Design and Fabrication of All Terrain Vehicle
Info: 16103 words (64 pages) Dissertation
Published: 11th Dec 2019
Tagged: DesignAutomotive
TABLE OF CONTENTS
1 INTRODUCTION ………………………………………………………………………………………. ………1
2 CAD Modelling of Parts …………………………………………………………………………………..…3
2.1 Roll cage Design Considerations ………………………………………………………………………………3
2.2 PVC Prototype ……………………………………………………………………………………………………………..8
2.3 CAD Models of Roll Cage ……………………………………………………………………………………………9
2.4 Material Selection of Roll cage …………………………………………………………………………………11
2.5 Fabrication of Roll cage …………………………………………………………………………………………..11 2.6 CAD Modelling of Other parts ………………………………………………………………………………. 13
- CAE & Optimization of Parts………………………………………………………………………… 17
- Introduction ……………………………………………………………………………………………………………. 17
- Front Impact Test …………………………………………………………………………………………………… 18
- Rear Impact Test ……………………………………………………………………………………………………. 20
- Side Impact Test…………………………………………………………………………………………………….. 22
- Roll Over Test …………………………………………………………………………………………………………. 24
- Steering System design ………………………………………………………………………………. 26
- Introduction ……………………………………………………………………………………………………………. 26
- Design Methodology ………………………………………………………………………………………………. 26
- Turning Radius …………………………………………………………………………………………………… 26
- Ackerman Condition & Turning Angles …………………………………………………………… 27
- Rack & Pinion design …………………………………………………………………………………………. 28
- Design Parameters ……………………………………………………………………………………………… 29
- Steering System Layout ……………………………………………………………………………………… 31
- Error Calculations ………………………………………………………………………………………………. 31
- Suspension Design……………………………………………………………………………………… 32
- Introduction ……………………………………………………………………………………………………………. 32
- Design Methodology ………………………………………………………………………………………………. 32
- Deciding Type of suspension system……………………………………………………………….. 32
- Deciding Suspension Geometry ………………………………………………………………………… 33
- 2 Dimensional Sketch ………………………………………………………………………………………… 33
- Hard point Pick up ……………………………………………………………………………………………… 34
- Lotus Analysis…………………………………………………………………………………………………….. 35
- Calculations ………………………………………………………………………………………………………… 39
- Suspension Mounting ………………………………………………………………………………………… 40
- Braking system………………………………………………………………………………………….. 41
- Introduction ……………………………………………………………………………………………………………. 41
- Calculations ……………………………………………………………………………………………………………. 41
- Stopping distance calculations …………………………………………………………………………. 44
- Load Transfer ………………………………………………………………………………………………………. 45
- Braking Parameters ……………………………………………………………………………………………. 46
- Transmission System …………………………………………………………………………………. 47
- Introduction ……………………………………………………………………………………………………………. 47
- Calculations ……………………………………………………………………………………………………………. 47
- CVT Design ……………………………………………………………………………………………………………… 48
- Belt Tensions ………………………………………………………………………………………………………. 49
- Shaft Load ……………………………………………………………………………………………………………. 49
- Clamping force…………………………………………………………………………………………………….. 49
- Shaft design …………………………………………………………………………………………………………. 49
7.4 Transmission Layout……………………………………………………………………………………………… 50
- Results and Conclusion ………………………………………………………………………………. 51
LIST OF FIGURES
FIGURE 1 ASSEMBLED MODEL OF CAR …………………………………………………………………………………………. 1 FIGURE 2 ELEMENTS OF ROLL CAGE…………………………………………………………………………………………….. 4 FIGURE 3 MEMBERS OF ROLL CAGE ……………………………………………………………………………………………… 6 FIGURE 4 ROLL CAGE FBM……………………………………………………………………………………………………………….. 7 FIGURE 5 REAR BRACING OF ROLL CAGE …………………………………………………………………………………….. 8 FIGURE 6 PVC PROTOTYPE OF ROLL CAGE …………………………………………………………………………………… 8 FIGURE 7 FRONT VIEW OF ROLL CAGE………………………………………………………………………………………….. 9 FIGURE 8 SIDE VIEW OF ROLL CAGE ……………………………………………………………………………………………… 9
FIGURE 9 TOP VIEW OF ROLL CAGE ……………………………………………………………………………………………… 10 FIGURE 10 ISO METRIC VIEW OF ROLL CAGE…………………………………………………………………………….. 10 FIGURE 11 FABRICATION OF COCKPIT …………………………………………………………………………………………. 11 FIGURE 12 FABRICATION OF FRONT CABIN ………………………………………………………………………………… 12 FIGURE 13 WELDING OF ROLL CAGE …………………………………………………………………………………………… 12
FIGURE 14 LEVELING OF ROLL CAGE …………………………………………………………………………………………… 12 FIGURE 15 ERGONOMICS TEST IN CATIA…………………………………………………………………………………….. 13 FIGURE 16 FRONT KNUCKLE DESIGN …………………………………………………………………………………………… 13 FIGURE 17 REAR WHEEL HUB………………………………………………………………………………………………………… 14 FIGURE 18 FRONT WHEEL HUB …………………………………………………………………………………………………….. 14 FIGURE 19 CVT & ENGINE ASSEMBLY ………………………………………………………………………………………….. 15 FIGURE 20 WHEEL ASSEMBLY……………………………………………………………………………………………………….. 15 FIGURE 21 FRONT ASSEMBLY ………………………………………………………………………………………………………… 16 FIGURE 22 FRONT SUSPENSION ASSEMBLY……………………………………………………………………………….. 16 FIGURE 23 FRONT IMPACT STRESS……………………………………………………………………………………………….. 19 FIGURE 24 FRONT IMPACT DEFORMATION………………………………………………………………………………….. 19 FIGURE 25 REAR IMPACT STRESS …………………………………………………………………………………………………. 21 FIGURE 26 REAR IMPACT DEFORMATION ……………………………………………………………………………………. 21 FIGURE 27 SIDE IMPACT STRESS………………………………………………………………………………………………….. 23 FIGURE 28 SIDE IMPACT DEFORMATION …………………………………………………………………………………….. 23 FIGURE 29 ROLL OVER STRESS …………………………………………………………………………………………………….. 25 FIGURE 30 ROLL OVER DEFORMATION ……………………………………………………………………………………….. 25 FIGURE 31 TURNING RADIUS …………………………………………………………………………………………………………. 26 FIGURE 32 ACKERMAN CONDITION ………………………………………………………………………………………………. 27
FIGURE 33 RACK & PINION DESIGN 1 …………………………………………………………………………………………… 28
FIGURE 34 RACK & PINION DESIGN 2 …………………………………………………………………………………………… 28 FIGURE 35 RACK & PINION PARAMETERS ……………………………………………………………………………………. 29 FIGURE 36 ACKERMAN PERCENTAGE GRAPH…………………………………………………………………………….. 30 FIGURE 37 INNER ANGLE VS OUTER ANGLE……………………………………………………………………………….. 30 FIGURE 38 STEERING SYSTEM LAYOUT……………………………………………………………………………………….. 31 FIGURE 39 ERROR CALCULATIONS……………………………………………………………………………………………….. 31 FIGURE 40 2D SKETCH…………………………………………………………………………………………………………………….. 33 FIGURE 41 WHEEL TRAVEL VS CAMBER ANGLE ………………………………………………………………………… 35 FIGURE 42 WHEEL TRAVEL VS TOE ANGLE ………………………………………………………………………………… 36
FIGURE 43 WHEEL TRAVEL VS CASTOR ANGLE ………………………………………………………………………… 36 FIGURE 44 WHEEL TRAVEL VS KPI……………………………………………………………………………………………….. 36 FIGURE 45 ROLL TRAVEL VS CAMBER ANGLE ……………………………………………………………………………. 37 FIGURE 46 ROLL ANGLE VS TOE ANGLE …………………………………………………………………………………….. 37 FIGURE 47 ROLL ANGLE VS CASTOR ANGLE ……………………………………………………………………………… 37 FIGURE 48 STEER ANGLE VS CAMBER ANGLE …………………………………………………………………………… 38 FIGURE 49 STEER ANGLE VS TOE ANGLE ……………………………………………………………………………………. 38 FIGURE 50 STEER ANGLE VS CASTOR ANGLE …………………………………………………………………………….. 38 FIGURE 51 SUSPENSION FRONT MOUNTING……………………………………………………………………………….. 40 FIGURE 52 SUSPENSION REAR MOUNTING …………………………………………………………………………………. 40 FIGURE 53 MASTER CYLINDER ………………………………………………………………………………………………………. 43 FIGURE 54 CALIPER………………………………………………………………………………………………………………………….. 43 FIGURE 55 GRAPH STOPPING DISTANCE VS SPEED………………………………………………………………….. 45 FIGURE 56 STOPPING DISTANCE VS SPEED ………………………………………………………………………………… 46 FIGURE 57 GRADE ABILITY ……………………………………………………………………………………………………………… 47 FIGURE 58TRANSMISSION LAYOUT (CAD MODEL)……………………………………………………………………….. 50 FIGURE 59 TRANSMISSION LAYOUT-2 (CAD MODEL)…………………………………………………………………. 50
FIGURE 60 TRANSMISSION LAYOUT-2 ……………………………………………………………………………………………. 50
LIST OF TABLES
TABLE 1 BENCH MARKING OF ROLL CAGE MATERIAL ………………………………………………………………. 11 TABLE 2 FRONT IMPACT DETAILS………………………………………………………………………………………………….. 18 TABLE 3 REAR IMPACT TEST DETAILS………………………………………………………………………………………….. 20 TABLE 4 SIDE IMPACT TEST DETAILS …………………………………………………………………………………………… 22 TABLE 5 ROLL OVER TEST DETAILS ……………………………………………………………………………………………… 24 TABLE 6 STEERING DESIGN PARAMETERS………………………………………………………………………………….. 29 TABLE 7 SUSPENSION GEOMETRY DETAILS……………………………………………………………………………….. 33 TABLE 8 FRONT HARD POINTS……………………………………………………………………………………………………….. 34 TABLE 9 REAR HARD POINTS………………………………………………………………………………………………………….. 35 TABLE 10 STOPPING DISTANCE VALUES………………………………………………………………………………………. 44 TABLE 11 LOAD TRANSFER VALUES ……………………………………………………………………………………………… 45 TABLE 12 BRAKING PARAMETERS …………………………………………………………………………………………………. 46 TABLE 13 DRIVE & DRIVEN PULLEY DIMENSIONS……………………………………………………………………… 49 TABLE 14 VEHICLE PARAMETERS………………………………………………………………………………………………….. 51
Abstract
All-Terrain vehicle which is 4 wheeled and single seated automobile powered by an IC Engine it is used in hill areas deserts to manure easily and also it is used in agriculture in mountain areas.
In this project we are designing model of ATV in SOLIDWORKS in this model each and every part is designed and assemble in SOLIDWORKS and in order to validate our design we are performing structural, thermal analysis on various components in ANSYS and later we fabricate complete vehicle by following traditional manufacturing methods.
For this vehicle we are planning to use 4 stroke 305cc single cylinder Briggs & Stratton engine and we want to develop transmission system by coupling CVT (continuously variable transmission) with manual gearbox for better performance and efficiency and also to reduce load on the driver and also we are developing multiple purpose braking system in this vehicle. Suspension system will be simulated in LOTUS SHARK in order to effects of steering geometry and to minimize them.
Chassis, knuckles, wheels hubs, discs, mountings, wishbones, rack & pinion will be designed and fabricated by us. For every part after deign we will validate our results in CAE software.
Scope of ATV Snow Plowing, Killing Weeds, Camping, Winching, Hunting, Field PlowingLawn/Field Mowing, Seed/Salt/Rock Spreading, Transporting MaterialsMounting, Loading Logs, Hosing Your Garden.
 INTRODUCTION
We approached our final design by considering all possible alternatives for a system and modeling them in CAD software’s like CATIA, PRO-E/CREO etc.to obtain a basic model with maximum geometric details.
The models were then subjected to analysis using ANSYS FEA software. Based on analysis results and considering the factor of safety, the model was modified and retested and a design was obtained. Extensive weight reduction techniques were followed at every stage of the design to improve performance without sacrificing structural integrity.
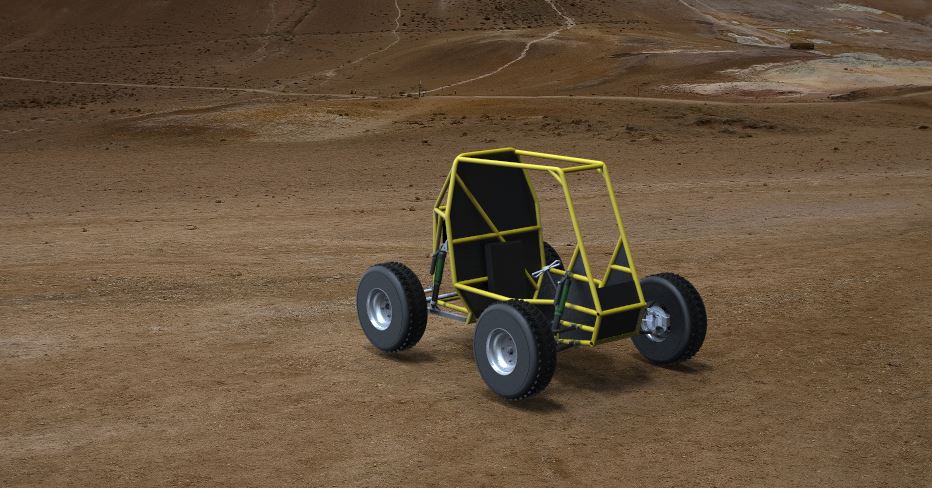
Figure 1 Assembled model of car
 CAD Modelling of Parts
Modeling of parts was done using CATIA & SOLIDWORKS software’s and rendering was done in Key shot.
2.1 Roll cage Design Considerations
Roll cage of this project was modelled with reference of BAJA SAE International Series Rulebook.
Objective
The purpose of the roll cage is to maintain a minimum space surrounding the driver and to support all subsystems. The cage must be designed and fabricated to prevent any failure of the cage’s integrity.
Lateral Space
Minimum space is based on clearances between the driver and a straight edge applied to any two points on the roll cage; an example is shown. The driver’s helmet shall have 152 mm (6 in.) clearance, while the driver’s shoulders, torso, hips, thighs, knees, arms, elbows, and hands shall have 76 mm (3 in.) clearance.
Clearances are relative to any driver selected at technical inspection, seated in a normal driving position, and wearing all required equipment.
For any member to be a part of the roll cage.
If there are any triangulating members joining the RHO to the vertical members of the Rear Roll Hoop and these triangulating members conform to, then the virtual side surfaces may be extended by an outboard crease over the triangulating members.
The driver’s helmet shall have 152 mm (6 in.) clearance to the side surfaces.
The driver’s shoulders, torso, hips, thighs, knees, arms, elbows, and hands shall have 76 mm (3 in.) clearance to the side surfaces.
NOTE: When minimal dimensions are given that is to the centerline of the members, and when a clearance for the driver is given, it is defined by the outside edges of the roll cage members less the padding installed.
Vertical Space
The driver’s helmet shall have 152 mm (6 in.) clearance from any two points among those members that make up to top of the roll cage. These members are: the RHO members (exclusive of any covering or padding); the RRH upper, LC; and the LC between points C. In an elevation (side) view, no part of the driver’s body, shoes, and clothing may extend beyond envelop of the roll cage.
Elements of the Roll Cage
The roll cage must be a space frame of tubular steel. The required members of the roll cage are illustrated.
Primary members are:
Rear Roll Hoop (RRH)
Roll Hoop Overhead Members (RHO)
Front Bracing Members (FBM)
Lateral Cross Member (LC) in Rule
Front Lateral Cross Member (FLC) in Rule
Lower Frame Side Members (LFS)
Secondary members must be steel tubes having a minimum wall thickness of 0.89 mm (.035 in) and a minimum outside diameter of 25.4 mm (1.0 in):
Secondary members are:
Lateral Diagonal Bracing (LBD)
Side Impact Member (SIM)
Fore/Aft Bracing (FAB)
Under Seat Member (USM)
All Other Required Cross Members
Any tube that is used to mount the safety belts
Roll cage members which are not straight must not extend longer than 711 mm (28 in.) between supports. Small bend radii (<152 mm/ 6 in.) at a supported end of a member are expected, and are not considered to make a member notstraight. The minor angle between the two ends of a not-straight tube must not exceed 30º.
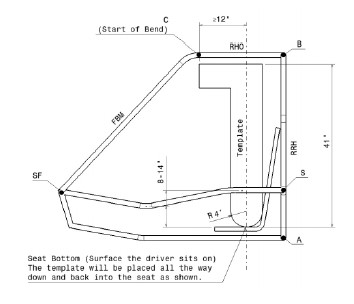
Figure 2 Elements of Roll Cage
Note: Required dimensions between roll cage members are defined by measurements between member centerlines, except where noted Note: No holes are allowed to be drilled on the roll cage tubing. Also, no tube should show any cracks or deformation. Final judgment rests with Baja SAE India Organizing Committee.
Lateral Cross Member Requirement
Lateral cross members cannot be less than 203.5 mm (8 in) long. They cannot have a bend; however, they can be a part of a larger, bent tube system, between bends. The LC’s which connect the left and right points of AF, SF, and C must be made of primary materials.
Rear Roll Hoop (RRH)
The RRH is a structural panel behind the driver’s back, and defines the back side of the roll cage. The driver and seat must be entirely forward of this panel. The RRH is substantially vertical, but may incline by up to 20º from vertical. The minimum width of the RRH, measured at a point 686 mm (27 in.) above the inside seat bottom, is 736 mm (29 in.). The vertical members of the RRH may be straight or bent, and are defined as beginning and ending where they intersect the top and bottom horizontal planes The vertical members must be continuous tubes (i.e. not multiple segments joined by welding). The vertical members must be joined by LC members at the top and bottom. The LC members must be continuous tubes.
Note: The RRH will have an additional member for seat belt mounting without violating triangulation rule.
Rear Roll Hoop Lateral Diagonal Bracing (LDB)
The RRH must be diagonally braced. The diagonal brace(s) must extend from one RRH vertical member to the other. The top and bottom intersections of the LDB members and the RRH vertical members must be no more than 127 mm (5 in.) from the RRH top and bottom horizontal planes, respectively. The angle between the LDB members and the RRH vertical members must be greater than or equal to 20º. Lateral bracing may consist of more than one member.
Roll Hoop Overhead Members (RHO)
The forward ends of the RHO members (intersection with the LC) define points CR and CL must be at least 305 mm (12 in.) forward of a point, in the vehicle’s elevation view, defined by the intersection of the RHO members and a vertical line rising from the after end of the seat bottom. This point on the seat is defined by the seat bottom intersection with a 101 mm (4 in.) radius circle which touches the seat bottom and the seat back. The top edge of the template is exactly horizontal with respect to gravity.
Points CR and CL must also be no lower than the top edge of the template, 1041.4 mm (41 in) above the seat.
Lower Frame Side Members (LFS)
The two Lower Frame Side members define the lower right and left edges of the roll cage. These members are joined to the bottom of the RRH and extend generally forward, at least as far as a point forward of every driver’s heels, when seated in normal driving position. The forward ends of the LFS members are joined by an LC, the Front Lateral Cross (FLC –Fig. RC4). The intersection of the LFS members and the FLC define the points AFR and AFL.
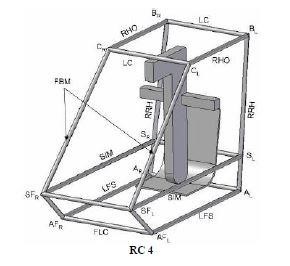
Figure 3 Members of Roll cage
Side Impact Members (SIM)
The two Side Impact Members define a horizontal mid-plane within the roll cage. These members are joined to the RRH and extend generally forward, at least as far as a point forward of every driver’s toes, when seated in normal driving position. The forward ends of the SIM members are joined by an LC. The intersection of the SIM members with this LC defines the points SFR and SFL. The SIM members must be between 203 mm (8 in.) and 356 mm (14 in.) above the inside seat bottom.
Under Seat Member (USM)
The two LFS members must be joined by the Under Seat Members. The USM must and pass directly below the driver where the template in RC3 intersects the seat bottom. The USM must be positioned in such a way to prevent the driver from passing through the plane of the LFS in the event of seat failure.
Front Bracing Members (FBM)
Front bracing members must join the RHO, the SIM and the LFS (Fig. RC5).
The upper Front Bracing Members (FBMUP) must join points C on the RHO to the SIM at or behind points SF. The lower Front Bracing Members (FBMLOW) must join points AF to points SF. The FBM (FBM UP and FBMLOW) must be continuous tubes. The angle between the FBM UP and the vertical must be less than or equal to 45 degrees.
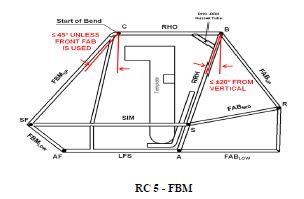
Figure 4 Roll cage FBM
Fore/Aft Bracing (FAB)
The RRH must be restrained from rotation and bending in the elevation plane by a system of triangulated bracing. Bracing must either: 1) Rear bracing directly restrain both points B from longitudinal displacement in the event of failure of the joints at points C; and 2) Front Bracing -restrain both points C from longitudinal and vertical displacement, thus supporting points B through the RHO members. Better design will result if both front and rear bracing are incorporated.
RHO must be braced on both right and left sides. From a side view, the bracing must be triangulated. Members used in the FAB systems must not exceed 1016 mm (40 in.) in unsupported length. Triangulation angles (projected to the elevation view) must be at least 20º
Front Bracing
Front systems of FAB must connect the FBM UP members to the SIM members (on the same sides). The intersection with the FBM UP members must be within 127 mm (5 in.) Measured as a straight line distance from centre line to centre line of points C. The intersection with the SIM members must be vertically supported by further members connecting the SIM members to the LFS members.
Rear Bracing
Rear systems of FAB must create a structural triangle, in the elevation view, on each side of the vehicle. Each triangle must be aft of the RRH, include the RRH vertical side as a member, and have one vertex near Point B and one vertex near either Point S or Point A.
The third (after) vertex of each rear bracing triangle, Point R (Fig. RC6) must additionally be structurally connected to whichever point, S or A, is not part of the structural triangle. This additional connection is considered part of the FAB system, and is subject to B7.3.1, but may be formed using multiple joined members, and this assembly of tubes, from endpoint to endpoint, may encompass a bend of greater than 30 degrees.
Attachment of rear system FAB must be within 127 mm (5 in.) of Point B, and must be within 51 mm (2 in.) of points S and A. Distances measured as a straight line distance from center line to center line. In the plan view, the rear bracing structural triangles must not be angled more than 20 degrees from the vehicle center line. The after vertices (right/left) of the FAB structural triangles must be joined by an LC.
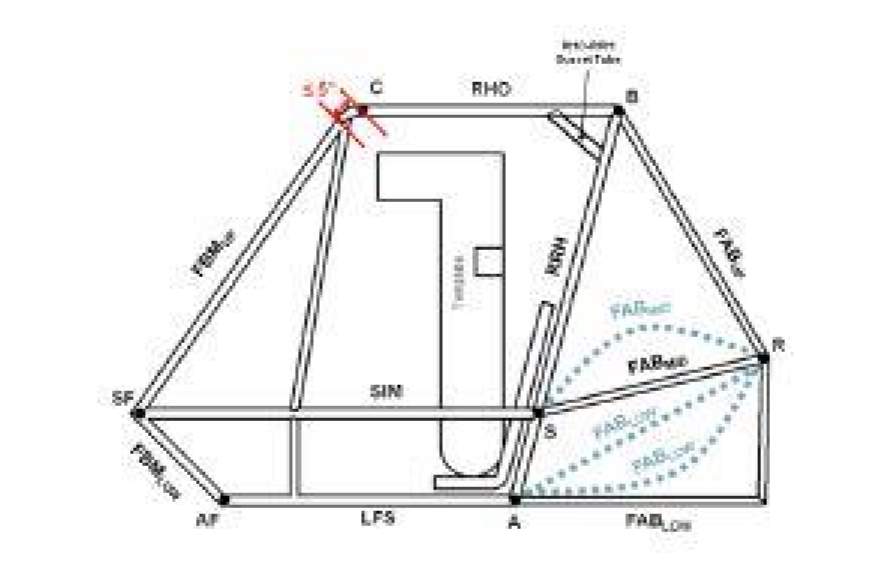
Figure 5 Rear bracing of Roll cage
2.2 PVC Prototype
Considering the above rules and regulations first we have extracted the dimensions of the roll cage by making prototype with PVC pipes
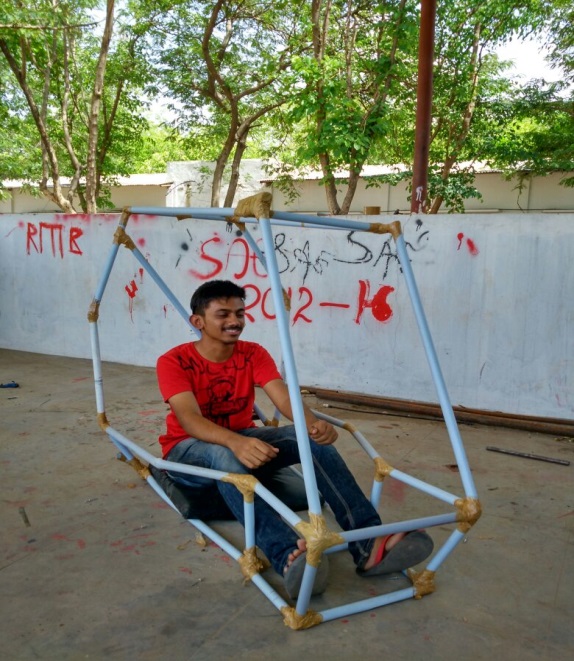
Figure 6 PVC Prototype of Roll cage
2.3 CAD Models of Roll Cage
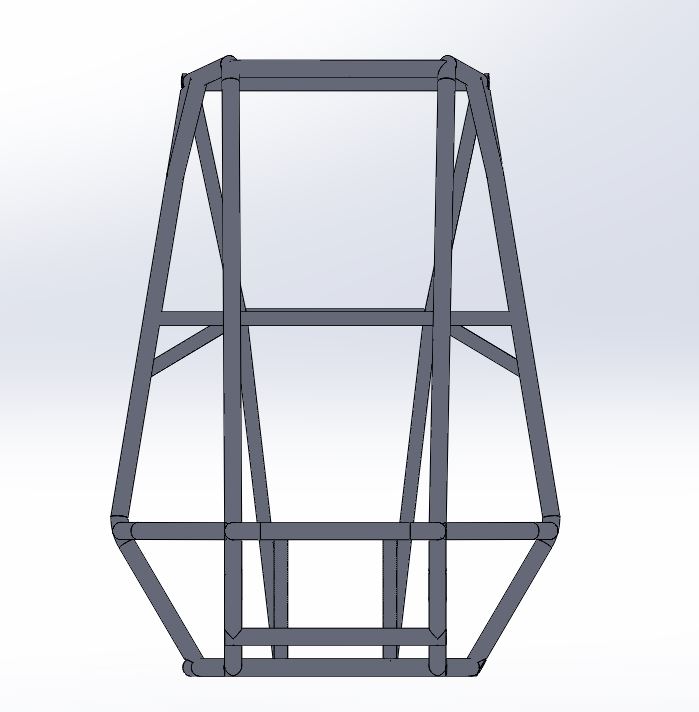
Figure 8 : SIDE VIEW OF ROLLCAGE
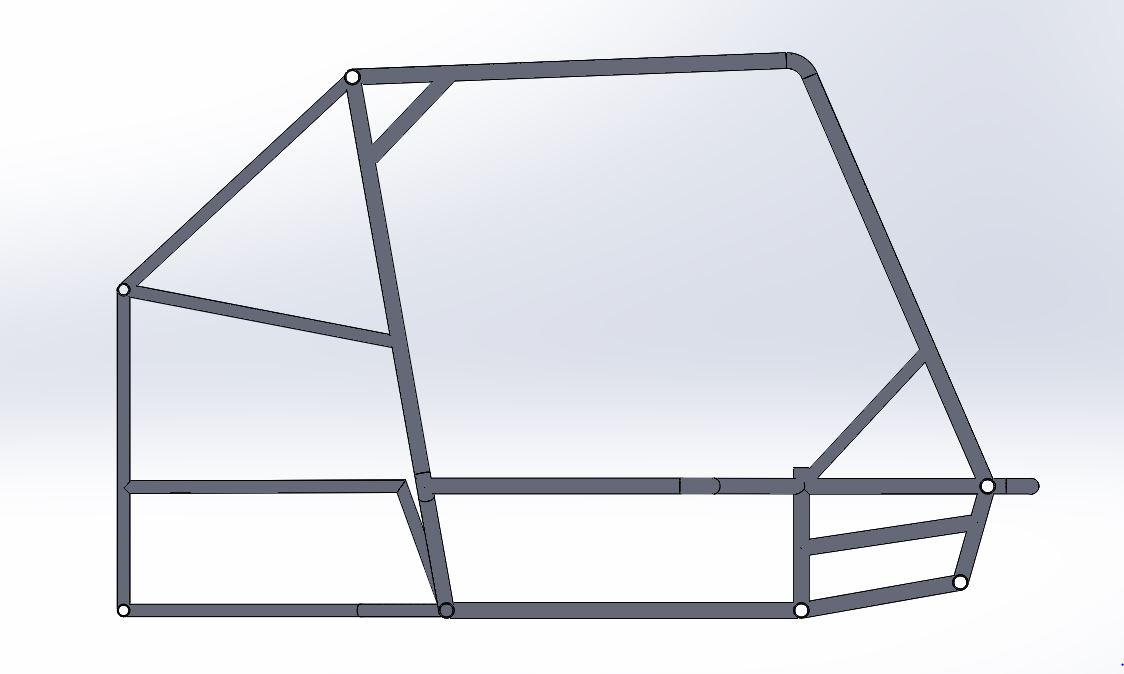
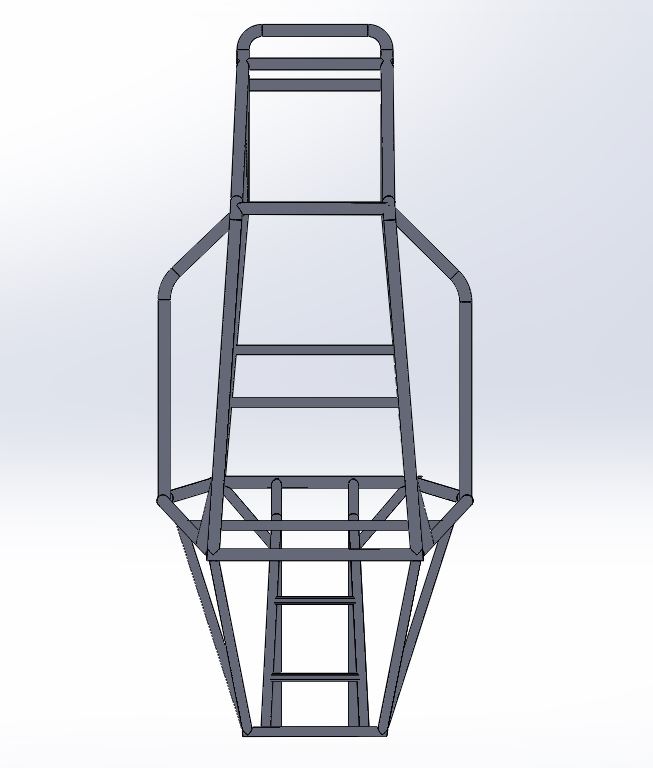
Figure 9 : TOP VIEW OF ROLLCAGE
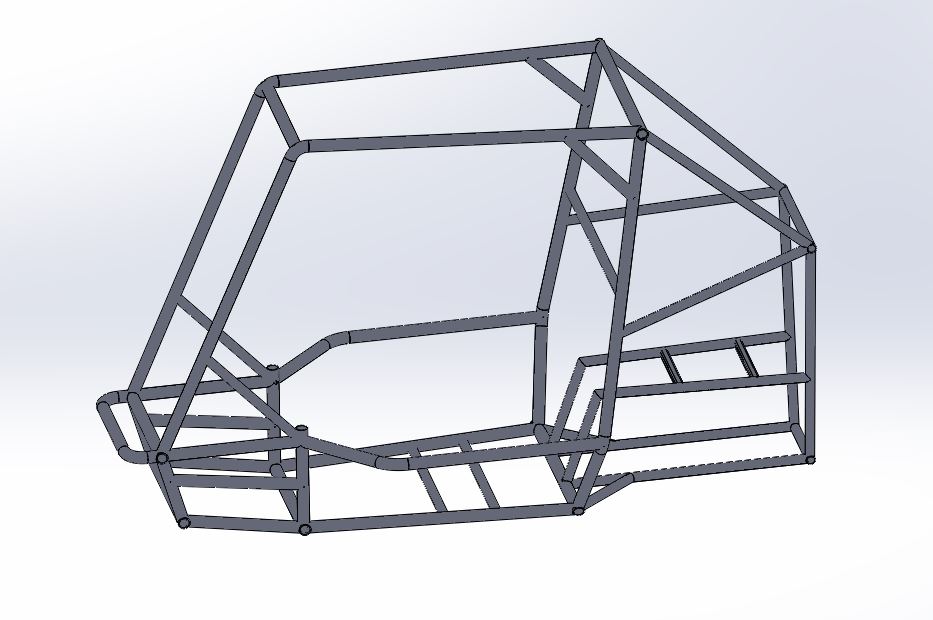
Figure 10 ISO metric view of Roll cage
Above Models are drafted based on values got from Prototype.
2.4 Material Selection of Roll cage
Circular steel tubing with an outside diameter of 33mm (1.3 in) and a wall thickness of 2 mm (0.120 in) and a carbon content of at least 0.18%.
The bending stiffness and bending strength must be calculated about a neutral axis that gives the minimum values. Bending stiffness is considered to be proportional to the product EI where:
E Modulus of elasticity (205 G Pa for all steels)
I Second moment of area for the structural cross section Bending strength is given by: Sy*I/C where:
Sy is Yield strength (365 MPa for AISI 1018 steel*)
C is Distance from neutral axis to extreme fibre
*Bending moment of AISI 1018 steel (for tube dimension of Sec B7.3.12 A) = 387.38 Nm
Based on the above calculations we did Market research for materials.
| MATERIAL | Ys | E | C% | El% | Cost | Avaiabity |
| AISI 1018 | 400 | 205 | 0.30 | 18 | 170 | More |
| ASTM A106 | 367 | 205 | 0.29 | 20 | 150 | More |
| AISI 4130 | 460 | 205 | 0.30 | 18 | 900 | Less |
| AISI 1020 | 350 | 205 | 0.30 | 20 | 450 | Less |
Table 1 Bench marking of Roll cage material
2.5 Fabrication of Roll cage
Fabrication of roll cage started from preparation of Jigs and material procurement after then cutting of pipes and welding was done.
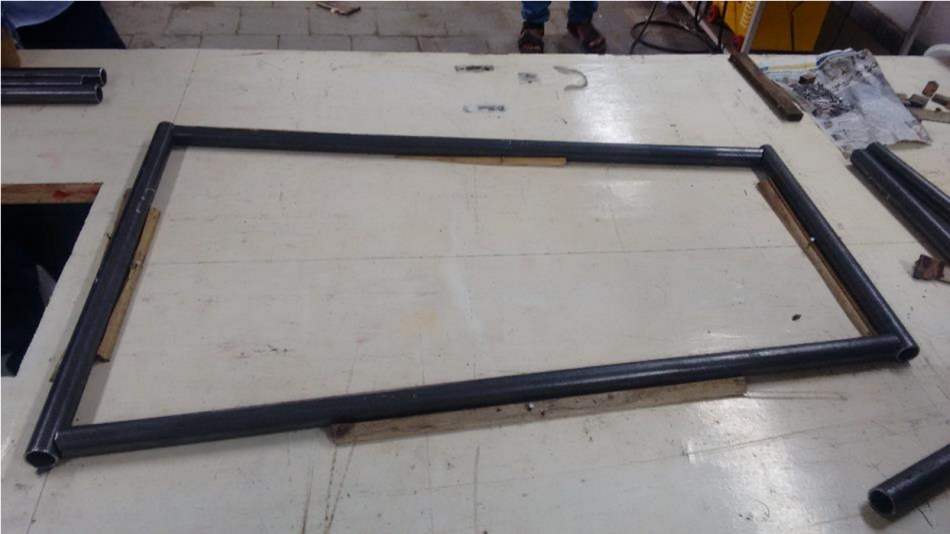
Figure 11 fabrication of Cockpit
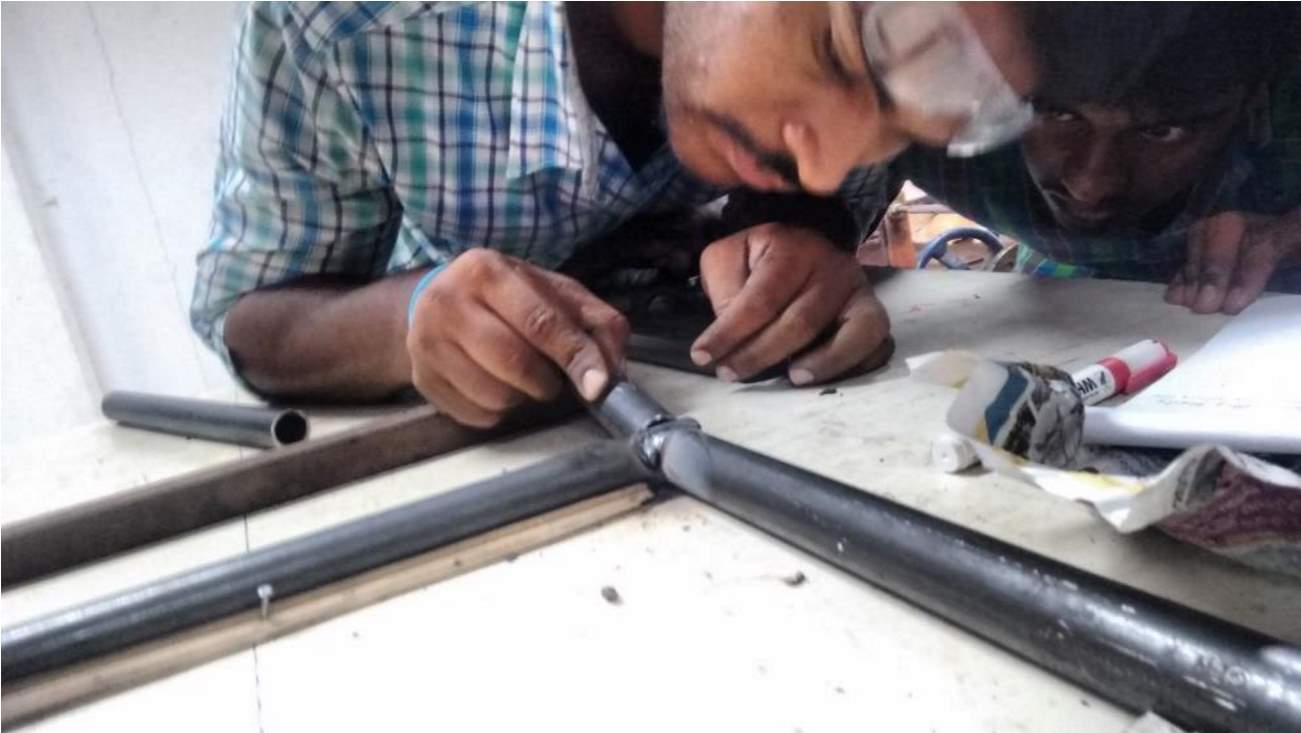
Figure 12 Fabrication of front cabin
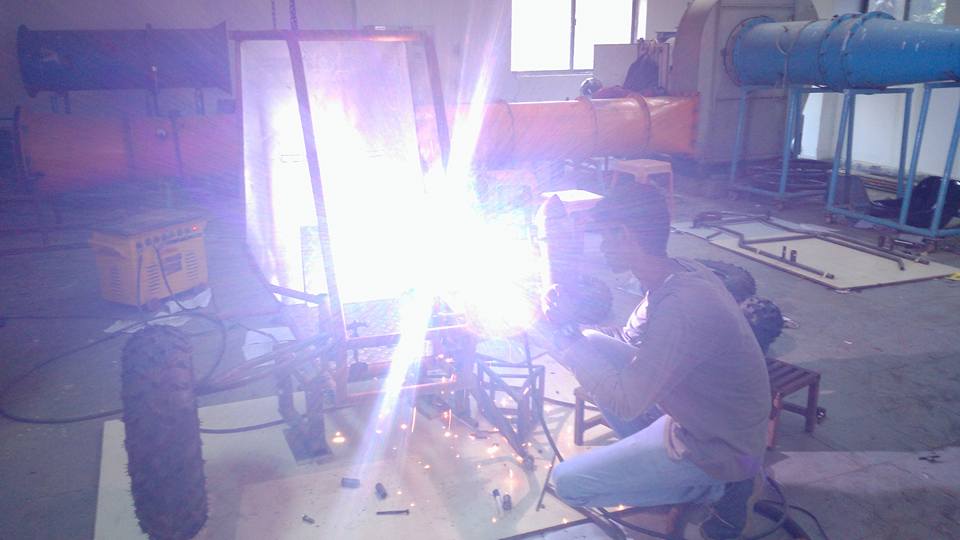
Figure 13 Welding of Roll cage
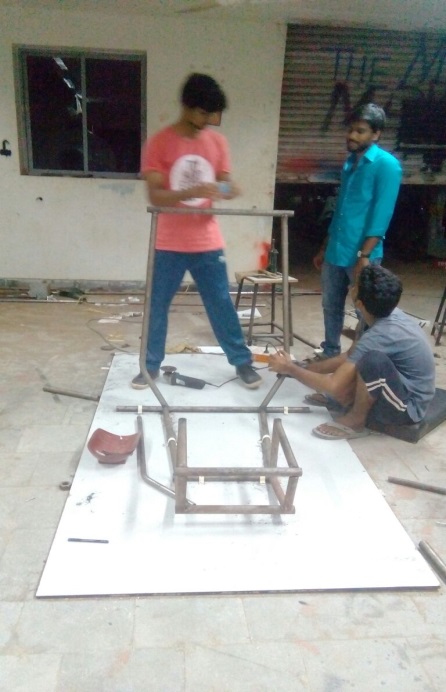
Figure 14 Leveling of Roll cage
2.6 CAD Modelling of Other parts
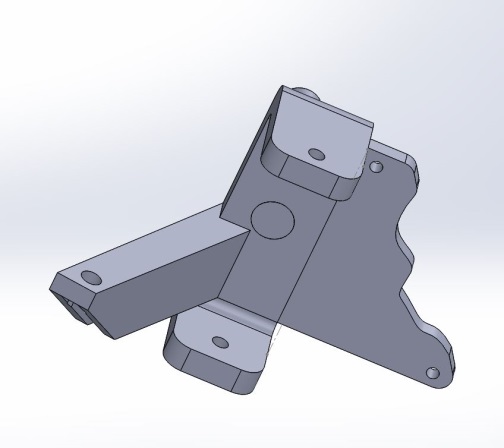
Figure 16 Front knuckle Design
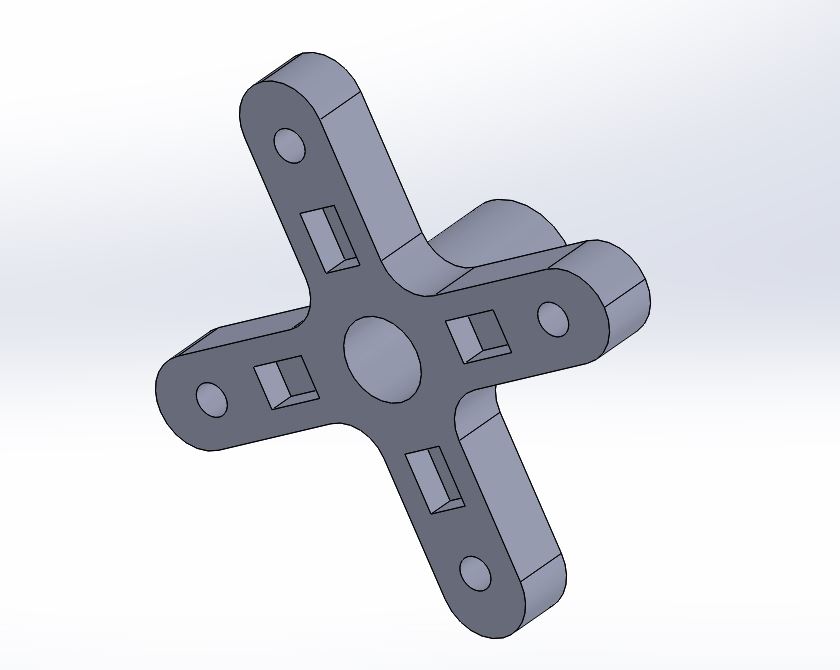
Figure 17 Rear Wheel hub
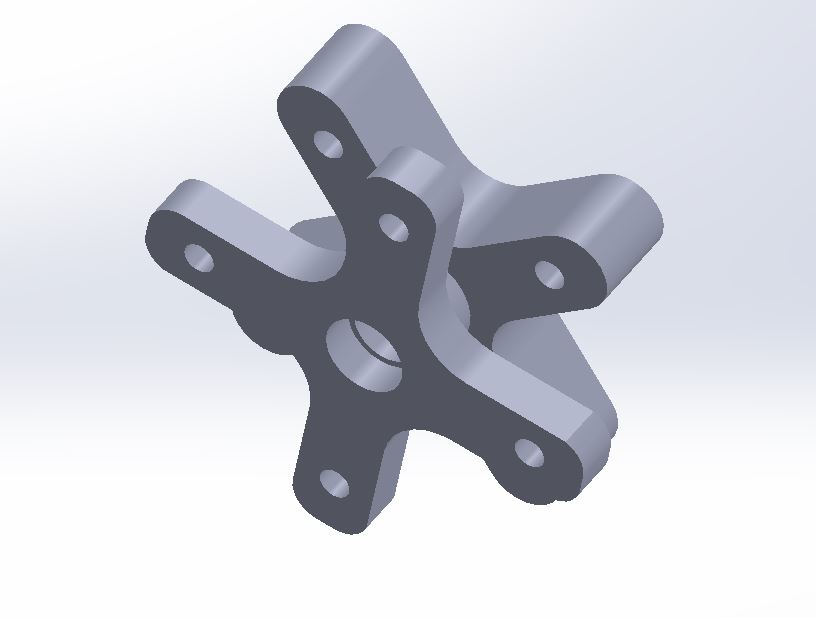
Figure 18 front wheel Hub
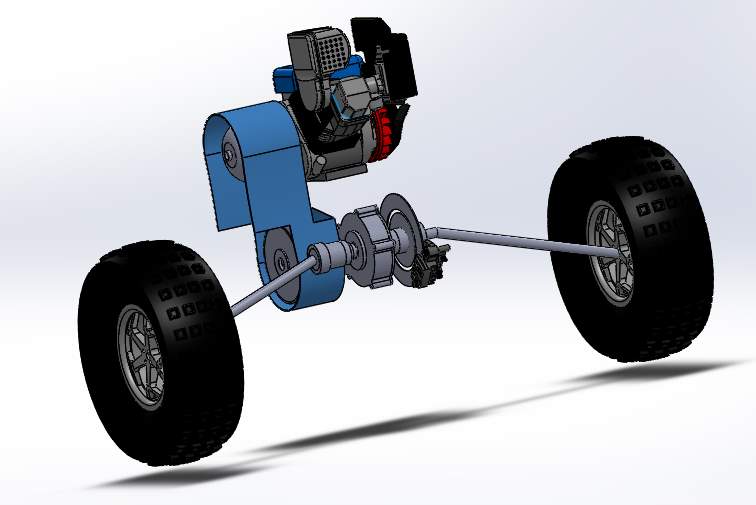
Figure 19 CVT & Engine Assembly
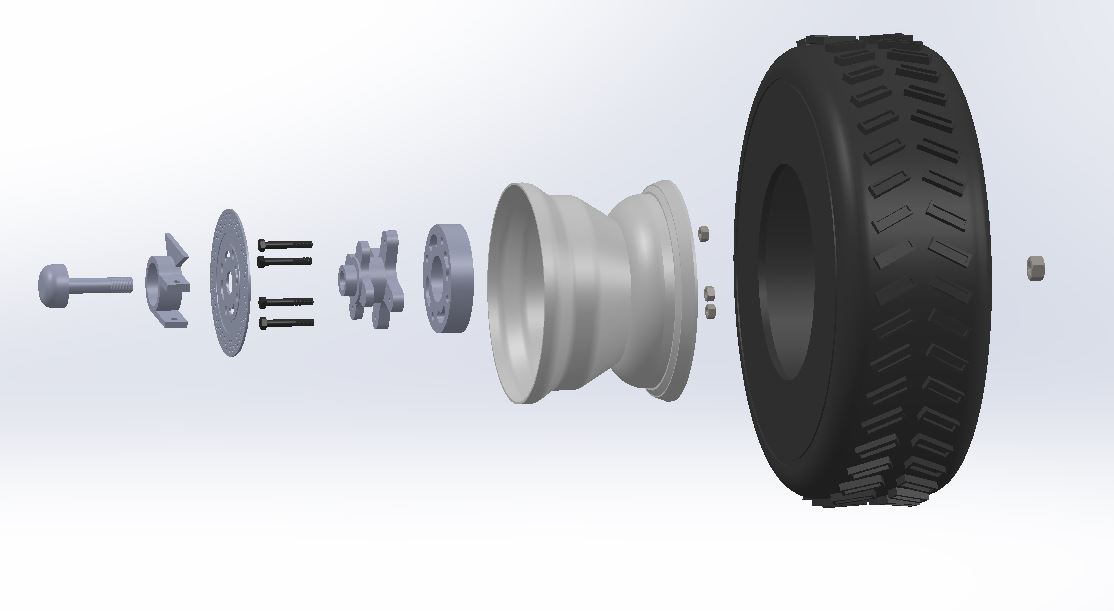
Figure 20 Wheel Assembly
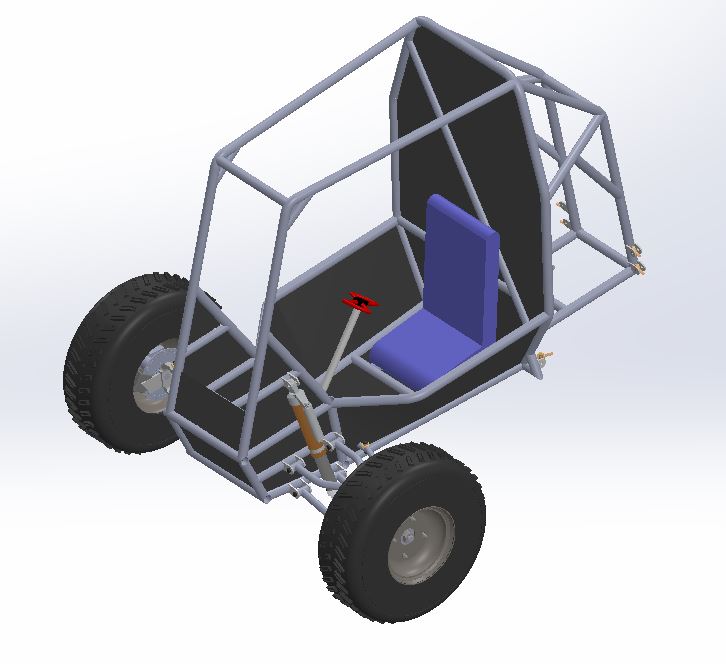
Figure 21 Front Assembly
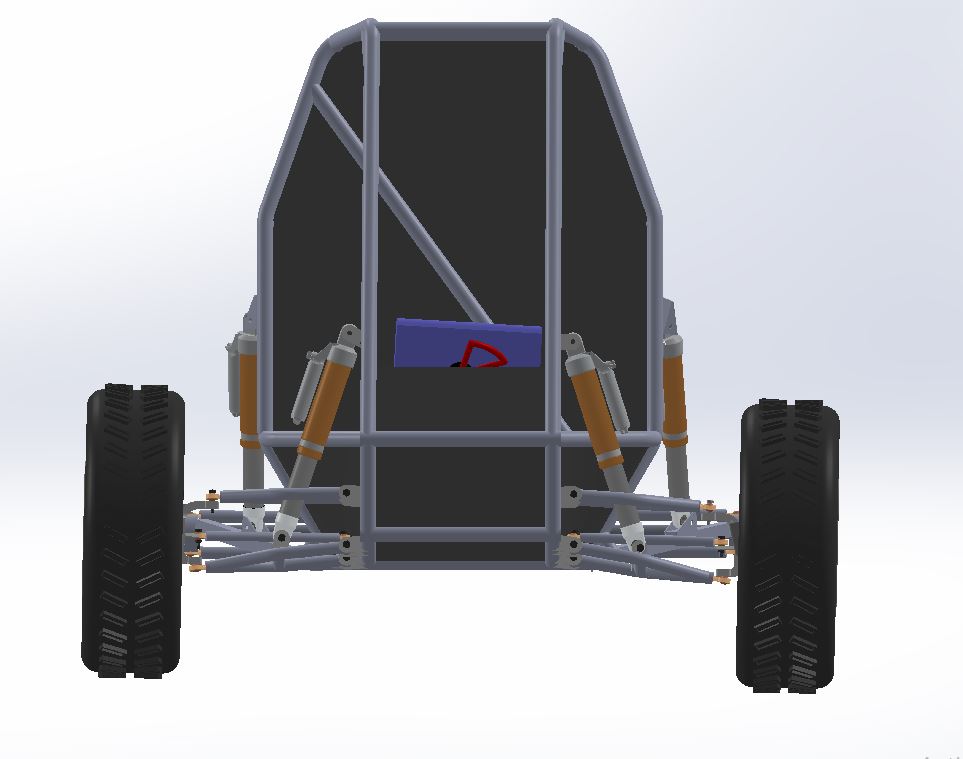
Figure 22 Front suspension Assembly
 CAE & Optimization of Parts
3.1 Introduction
As the vehicle is intended to work on varied terrains, a number of considerations were made. In this process, we included the effect of various functions acting on the vehicle.
The following forces were primarily considered for the analysis
- Front impact
- Rear impact
- Side impact
- Roll over impact
The material selected for the roll cage and chassis of the vehicle has a prominent role to plug in deciding the strength of the vehicle. The vehicle has to sustain the various loads and forces that act upon it in different working conditions. The material should sustain the deflections and vibrations imposed on it. Therefor to strike a balance between the weight and strength was crucial. It has necessary properties which give the desired strength to the entire frame and also was in accordance with our economic team’s statistics.Solver assumes beam simplification in your model and it would not take into account any local stresses in the cross-section.
Space frame (or) ladder type:
Body of the vehicle is mounted to a separate frame or chassis. A space frame or space structure is a truss-like, lightweight rigid structure constructed from interlocking struts in a geometric pattern. Space frames can be used to span large areas with few interior supports. Like the truss, a space frame is strong because of the inherent rigidity of the triangle; flexing loads are transmitted as tension and compression loads along the length of each strut. SOLVER: Ansys workbench – Easy to mesh and loads can be applied after immediate meshing
Work bench: It has Faster meshing capability compared to the mechanical Ansys parametric design language and also having great interface. Beam elements: A beam element is a slender structural member that offers resistance to forces and bending under applied loads. A beam element differs from a truss element in that a beam resists moments (twisting and bending) at the connections.
3.2 Front Impact Test
For the front impact test there are certain assumptions that made i.e. the vehicle is assumed to be stationary on the ground . Another vehicle coming with a speed of 60Kmph hits the vehicle which is in stationary position at the front. As the vehicle is assumed to be stationary the suspension points of the vehicle are constrained and also a deceleration of 90G’s is assumed to be acted upon the vehicle front part during crash . Another alternative assumption can also be made which is the vehicle is assumed to kept behind a wall and in this assumption the rear part of the vehicle is constrained and the force is applied on the front part.
force applied F = m x a = m x 90 x g at front part
where m is mass of the vehicle , g is acceleration due to gravity =9.8m/s2
F= 240 x90 x 9.8
F= 211680N
Where M = mass of the vehicle
A = acceleration of vehicle
V = Final velocity
U = Initial velocity
T = Impact Time
Impact time : f = m x v / t
f = 211680 N, m = 240kgs , v =16.66m/s2 so
t = (240 x 16.66) / 211680 =0.018 secs
Distance till which vehicle crash crumples : ½ x m xv2 = f x d
d = (1/2 x m x v2) / f = ( 0.5x 240x 16.662) / 211680= 0.157m
Table 2 Front Impact Details
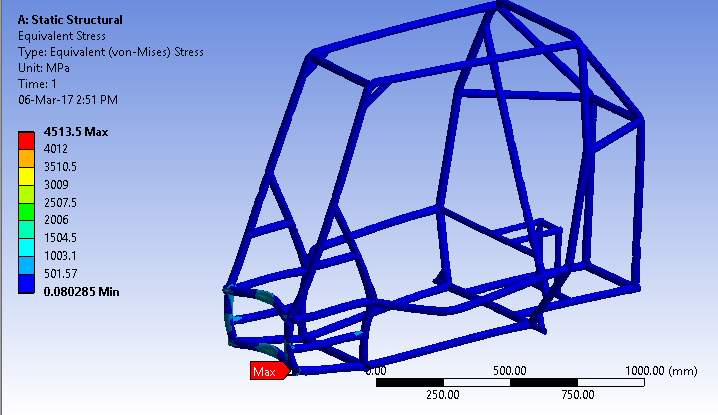
Figure 23 Front Impact Stress
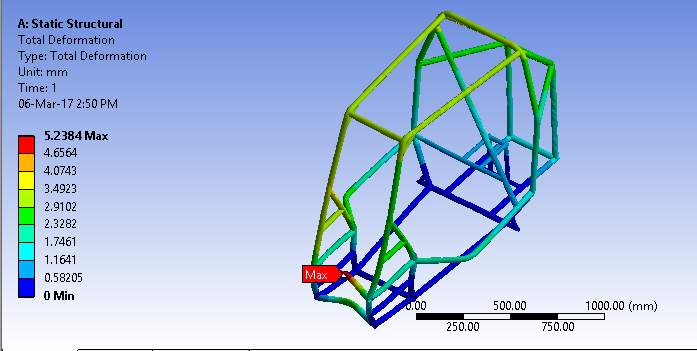
Figure 24 Front Impact Deformation
3.3 Rear Impact Test
In this case the assumption made is that vehicle is stationary another vehicle with the speed of 60Kmph hits the vehicle from back, as the vehicle is stationary on the ground the suspension points of the vehicle are constrained and also a deceleration of 90G’s is assumed to be acted upon the vehicle rear part during the crash. . Another alternative assumption can also be made which is the vehicle is assumed to kept in front of a wall and in this assumption the front part of the vehicle is constrained and the force is applied on the rear part.
force applied F = m x a = m x 90 x g at rear part
where m is mass of the vehicle , g is acceleration due to gravity =9.8m/s2
F = 240 x90 x 9.8
F= 211680N
Where M = mass of the vehicle
A = acceleration of vehicle
V = Final velocity
U = Initial velocity
T = Impact Time
Impact time: f = m x v / t
f = 211680 N, m = 240kgs, v =16.66m/s2 so
t = (240 x 16.66) / 211680 =0.018 secs
Distance till which vehicle crash crumples: ½ x m xv2 = f x d
d = (1/2 x m x v2) / f = (0.5x 240x 16.662) / 211680= 0.157m
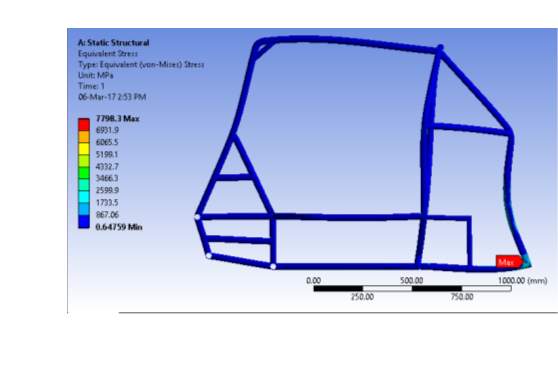
3.4 Side Impact Test
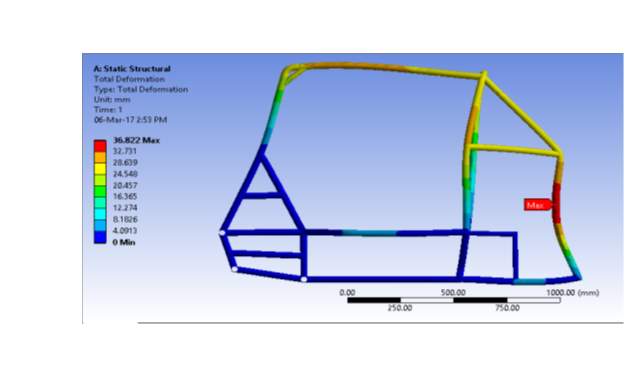
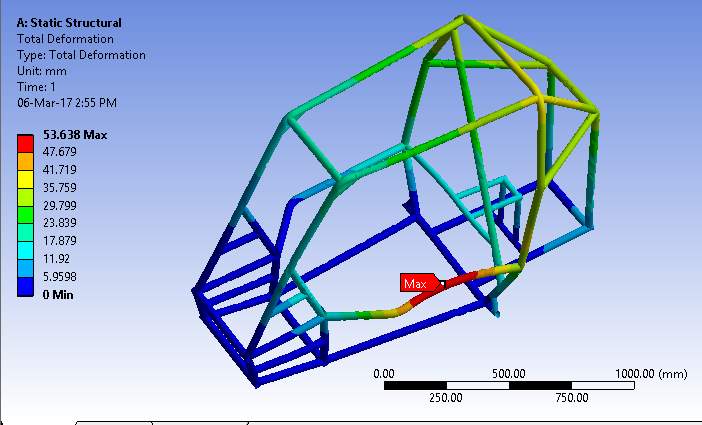
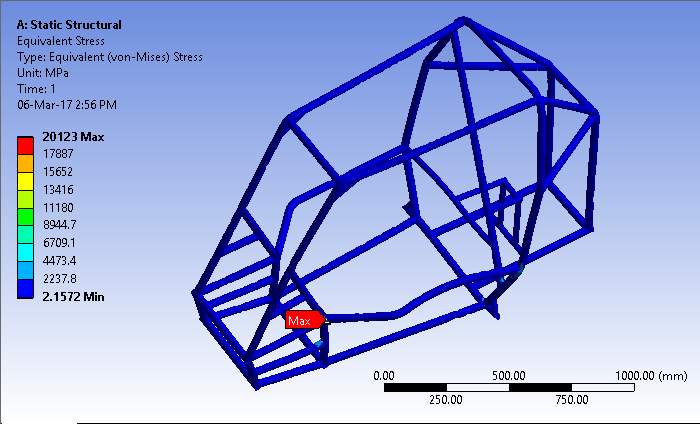
In side impact test the assumptions made are vehicle is stationary on the ground and another vehicle hits the stationary vehicle at 30Kmph speed from side, as the vehicle is stationary suspension points are constrained and also a deceleration of 50G’s is used in-order to stop the crash. Another alternative assumption can be made where the roll-cage is assumed to be kept beside the wall and that part is constrained and force is applied on the opposite side
force applied F = m x a = m x 50 x g at side part
where m is mass of the vehicle , g is acceleration due to gravity =9.8m/s2
F = 240 x50 x 9.8
F = 117600N
Where M = mass of the vehicle
A = acceleration of vehicle
V = Final velocity
U = Initial velocity
T = Impact Time
Impact time: f = m x v / t
f = 211680 N, m = 240 kgs, v =8.333m/s2 so
t = (240 x 8.33) / 117600 =0.017 secs
Distance till which vehicle crash crumples: ½ x m xv2 = f x d
d = (1/2 x m x v2) / f
(0.5x 240x 8.332) / 117600 = 0.07m
Table 4 Side Impact test Details
3.5 Roll over Test
To assess a vehicle’s structural performance, engineers measure the amount of intrusion into the occupant compartment after the crash. In the moderate overlap test, measurements are taken at nine places around the driver’s seat. In the small overlap test, 16 locations on the driver side interior and exterior of the vehicle are measured. The amount and pattern of intrusion shows how well the front-end crush zone managed the crash energy and how well the safety cage held up, three factors to determine how a vehicle rates in the moderate overlap and small overlap side tests: structural performance, injury measures and dummy movement.
In this project we have performed side impact test by constraining the roll cage at suspension points and applying load on the side outermost members.
Load Calculation’s:
F = 6,370 N
Where M = mass of the vehicle
A = acceleration of vehicle
V = Final velocity
U = Initial velocity
T = Impact Time
Table 5 Roll Over Test Details
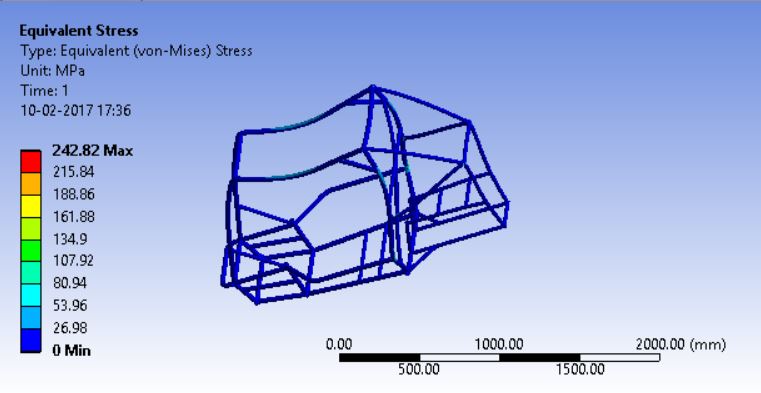
Figure 29 Roll over Stress
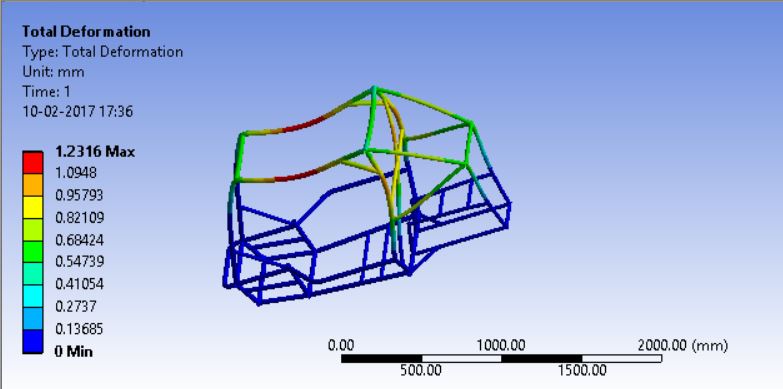
Figure 30 Roll Over Deformation
 Steering System design
4.1 Introduction
The steering system plays an important role in controlling vehicles. But they also have to provide good ergonomics. Substantial calculations have been done for the design and optimization of steering system of our vehicle.
4.2 Design Methodology
- Turning Radius
- Ackerman Condition
- Turning Angles
- Wheel Geometry
- Rack and Pinion Design
4.2.1Turning Radius
Our ATV vehicle is designed for turning radius 2.4mts. The track width and wheel base are decided 52 inches and 54 inches respectively.
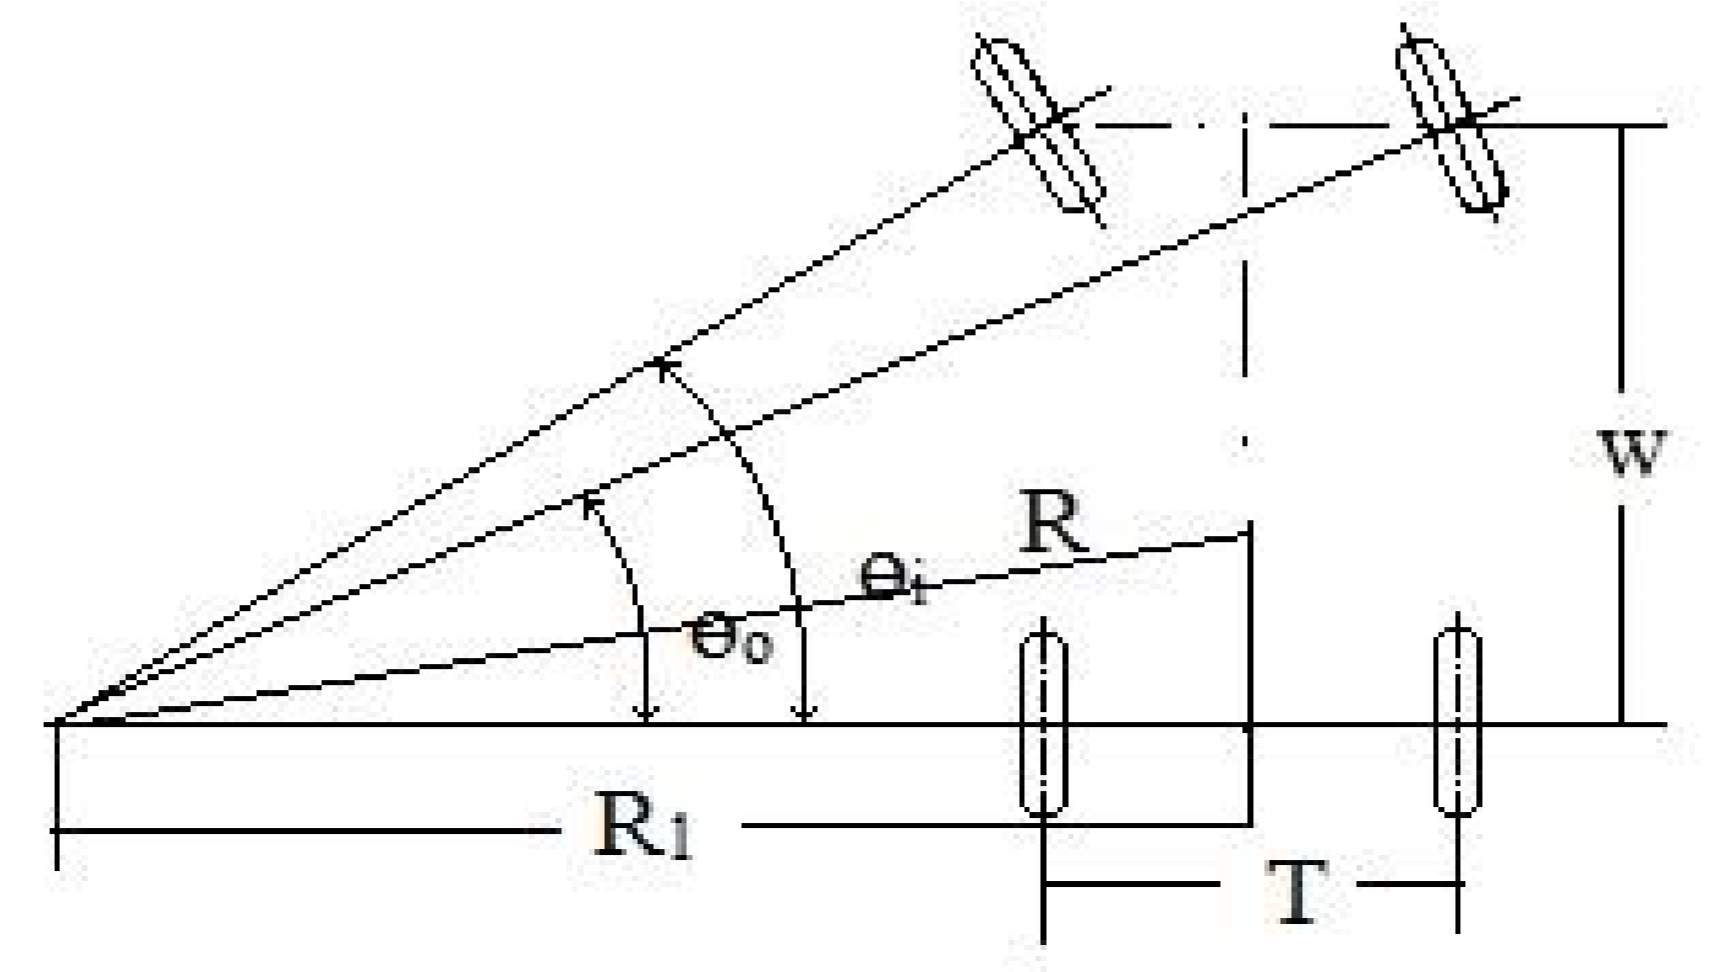
Figure 31 Turning radius
4.2.2Ackerman Condition & Turning Angles
Cotөo– Cotөi = T/W = Track width/wheel base tanөi= W/(R1-T/2)
T= Track width
W= Wheel base
tanөo=W/(R1+T/2) өi = Maximum inner angle өo = Maximum outer angle tanөi = 54/(R1-26) a = 21.6
R2 = R12 + a22
R12 = R2 – a22
R = 2.4 m = 94.48 inches
R12 = (94.48)2 – (21.6)2 R = 91.98 inches tanөi = 54/(91.98-26) өi = 39.42o tanөo = 54/(91.98+26) ө0 = 25.19o
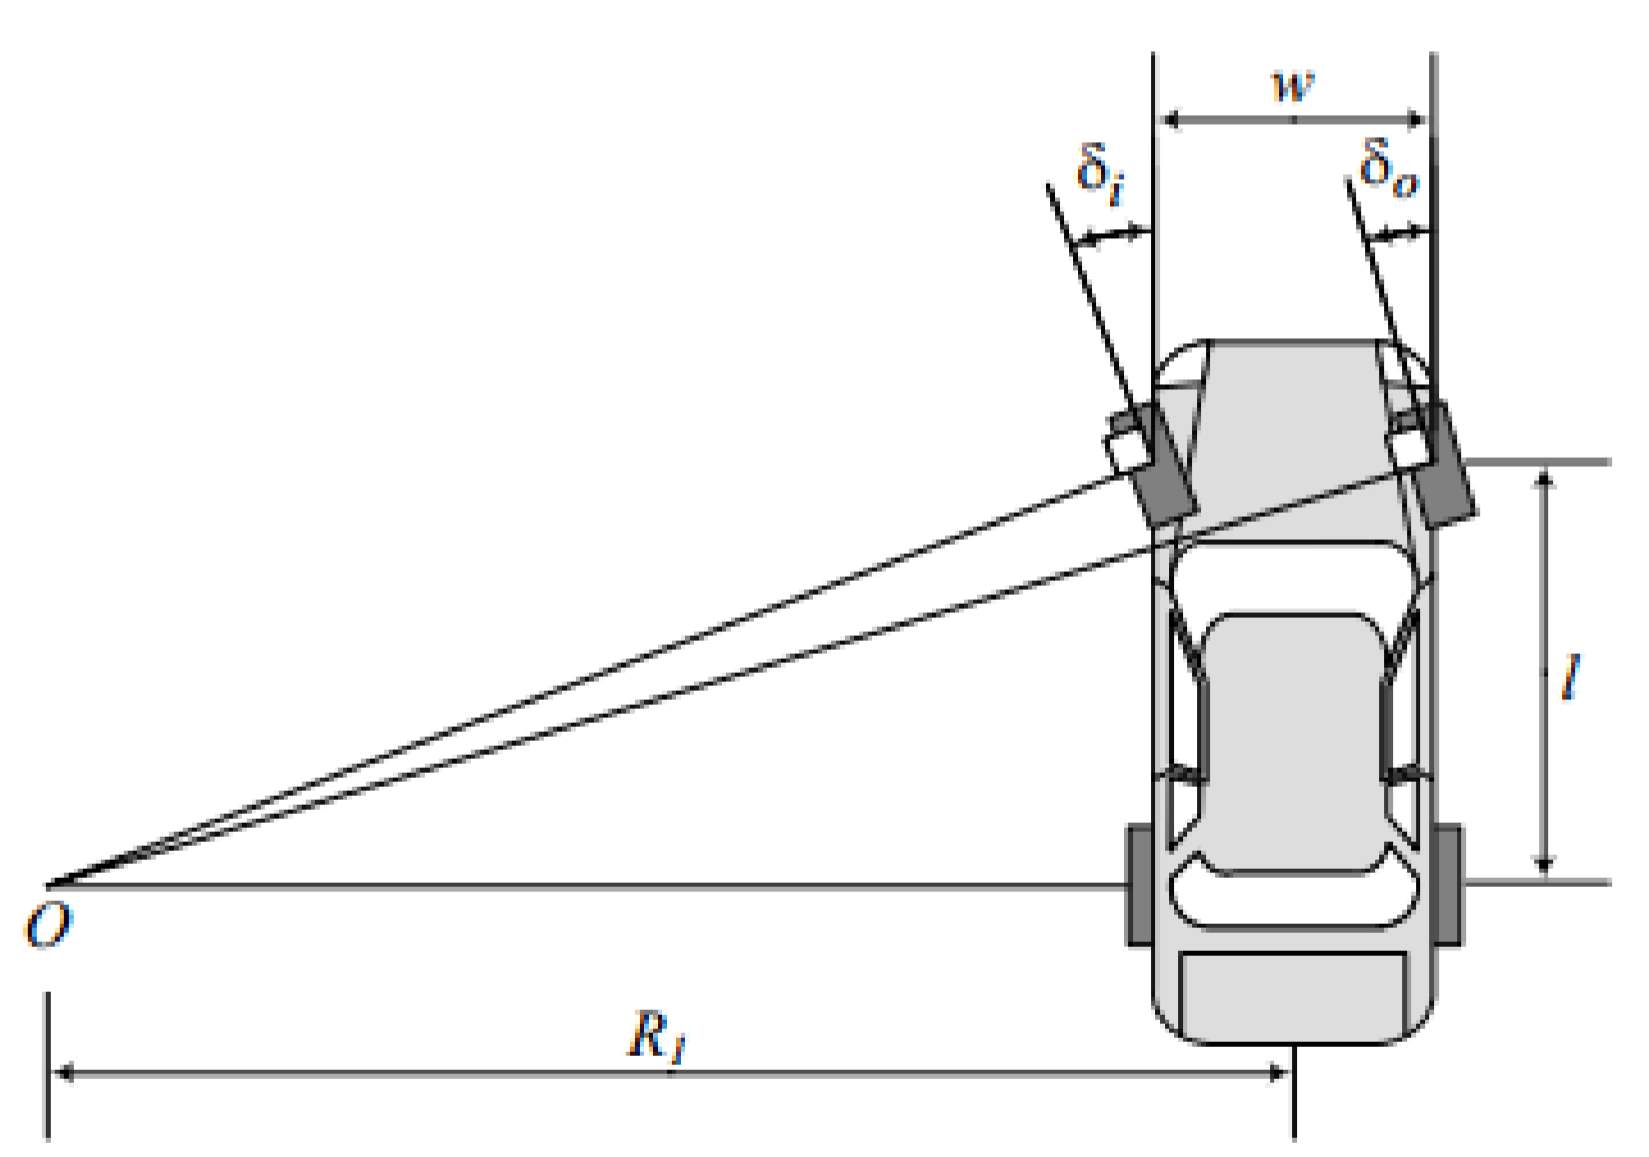
Figure 32 Ackerman Condition
4.2.3Rack & Pinion design
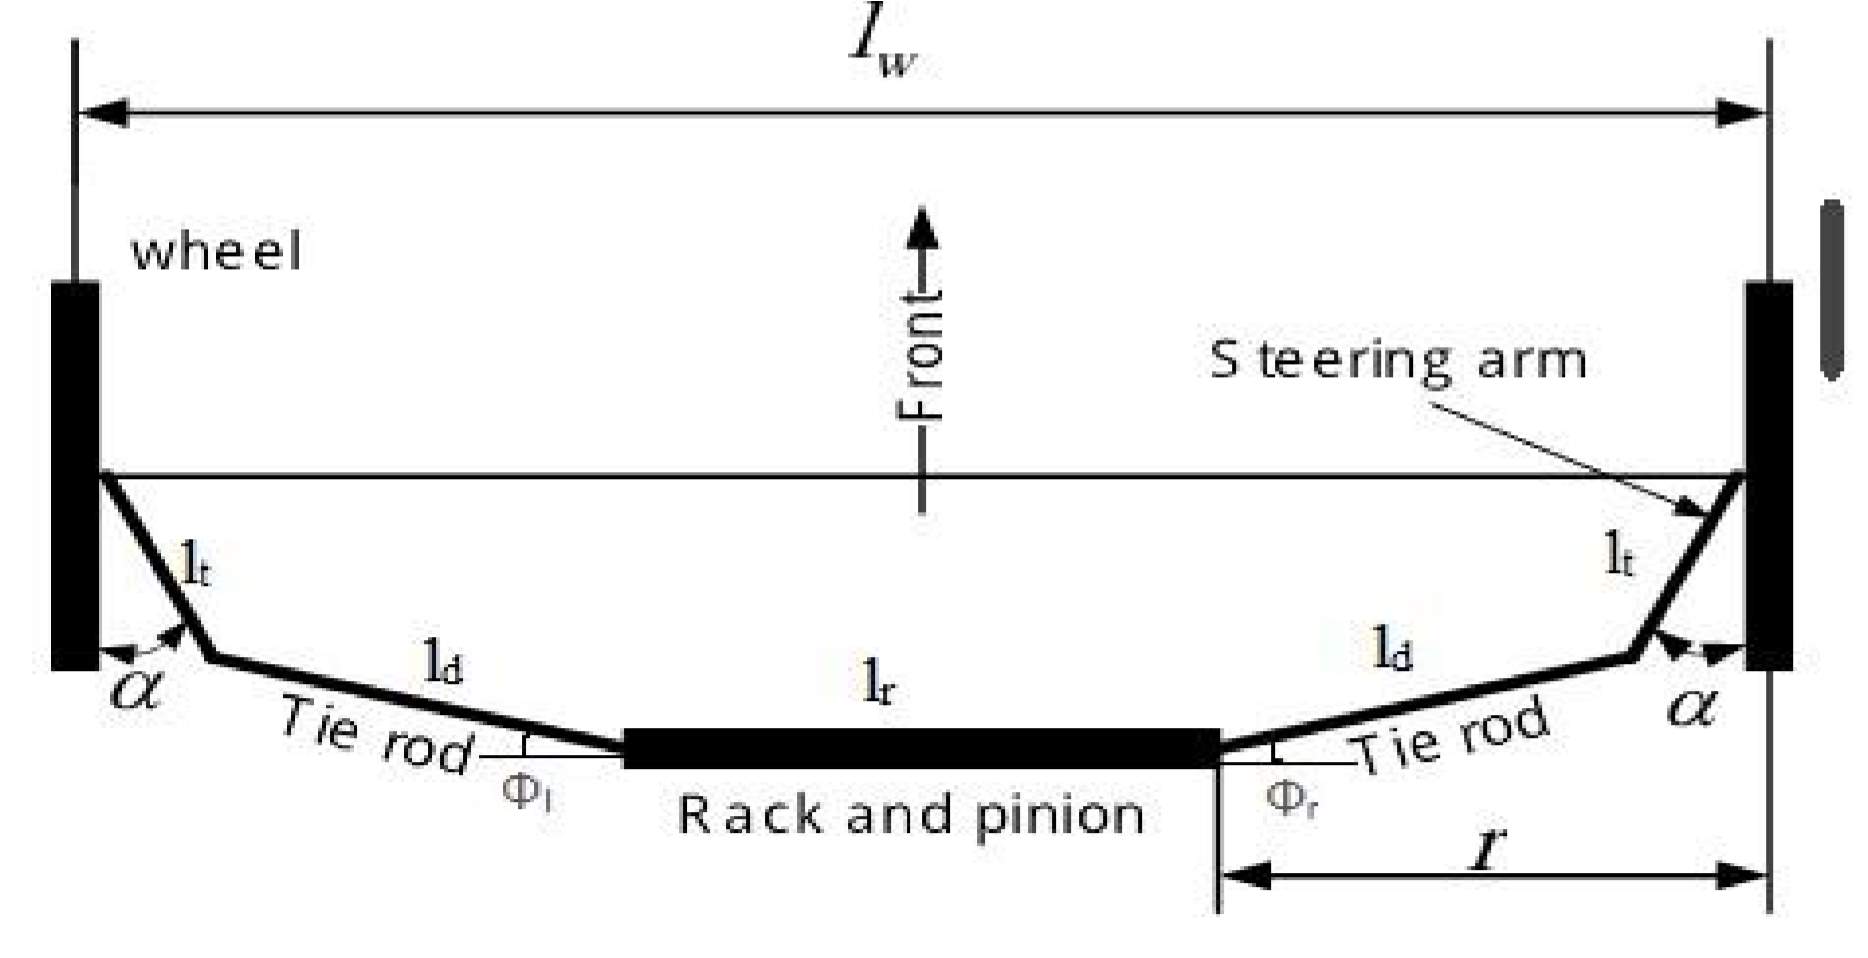
Figure 33 Rack & pinion design 1
lw -> distance between two knuckles lr -> rack length ld -> length of tie rod lt -> length of steering arm s -> distance from front axis to race axis r = (lw – lr)/2
When wheels are straight,
ld = ((r – lt sinα)2+(s-lt cosα)2)1/2
When wheels are turned towards left
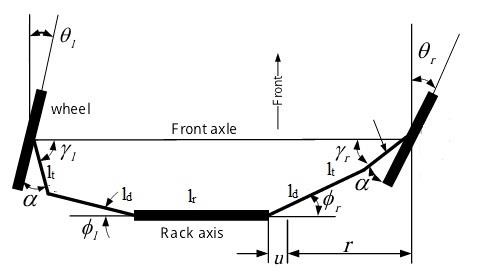
Figure 34 Rack & Pinion Design 2
FOR LEFT WHEEL:
ld2 = (r + 4 – lt cosrl)2 + (s – lt sinrl)2 => (r + 4 – lt cosrl)2 = ld2 – (s – lt sinrl)2
=> r + 4 = lt cosrl + ( ld2 – (s – lt sinrl)2)1/2
Similarly,
FOR RIGHT WHEEL:
R – 4 = lt cosrr + (ld – (s- ltsinrr)2) ½
Combining both the equations,
2r = ltcosrl + ltcosrr + (ld2 – (s – lt sinrl)2)1/2 + (ld2 – (s – ltsinrr)2) 1/2
4.2.4Design Parameters
| Steering Parameters | Values |
| Steering Type | Rack & Pinion |
| Steering Column | Rigid Type |
| Steering Wheel Diameter | 12 Inch |
| Steering effort | 4.8 N-m |
| Turning Radius | 2.1 Meters |
| Max Inner turning Angle | 45 Degrees |
| Max Outer Turning Angle | 25 Degrees |
| Ackerman Percentage | 100.631 % |
Table 6 Steering Design Parameters
| Rack & Pinion Parameters | Values |
| Rack Travel | 48.6 mm |
| Rack length | 14 Inch |
| Lock to lock turns | 1.5 |
| Steering ratio | 6:1 |
| Length of Tie rod | 13 Inch |
| Length of Steering Arm | 5 Inch |
| Length of Inner ball Joint | 177.8 mm |
| Length of Outer ball Joint | 496.539 |
Figure 35 Rack & Pinion Parameters
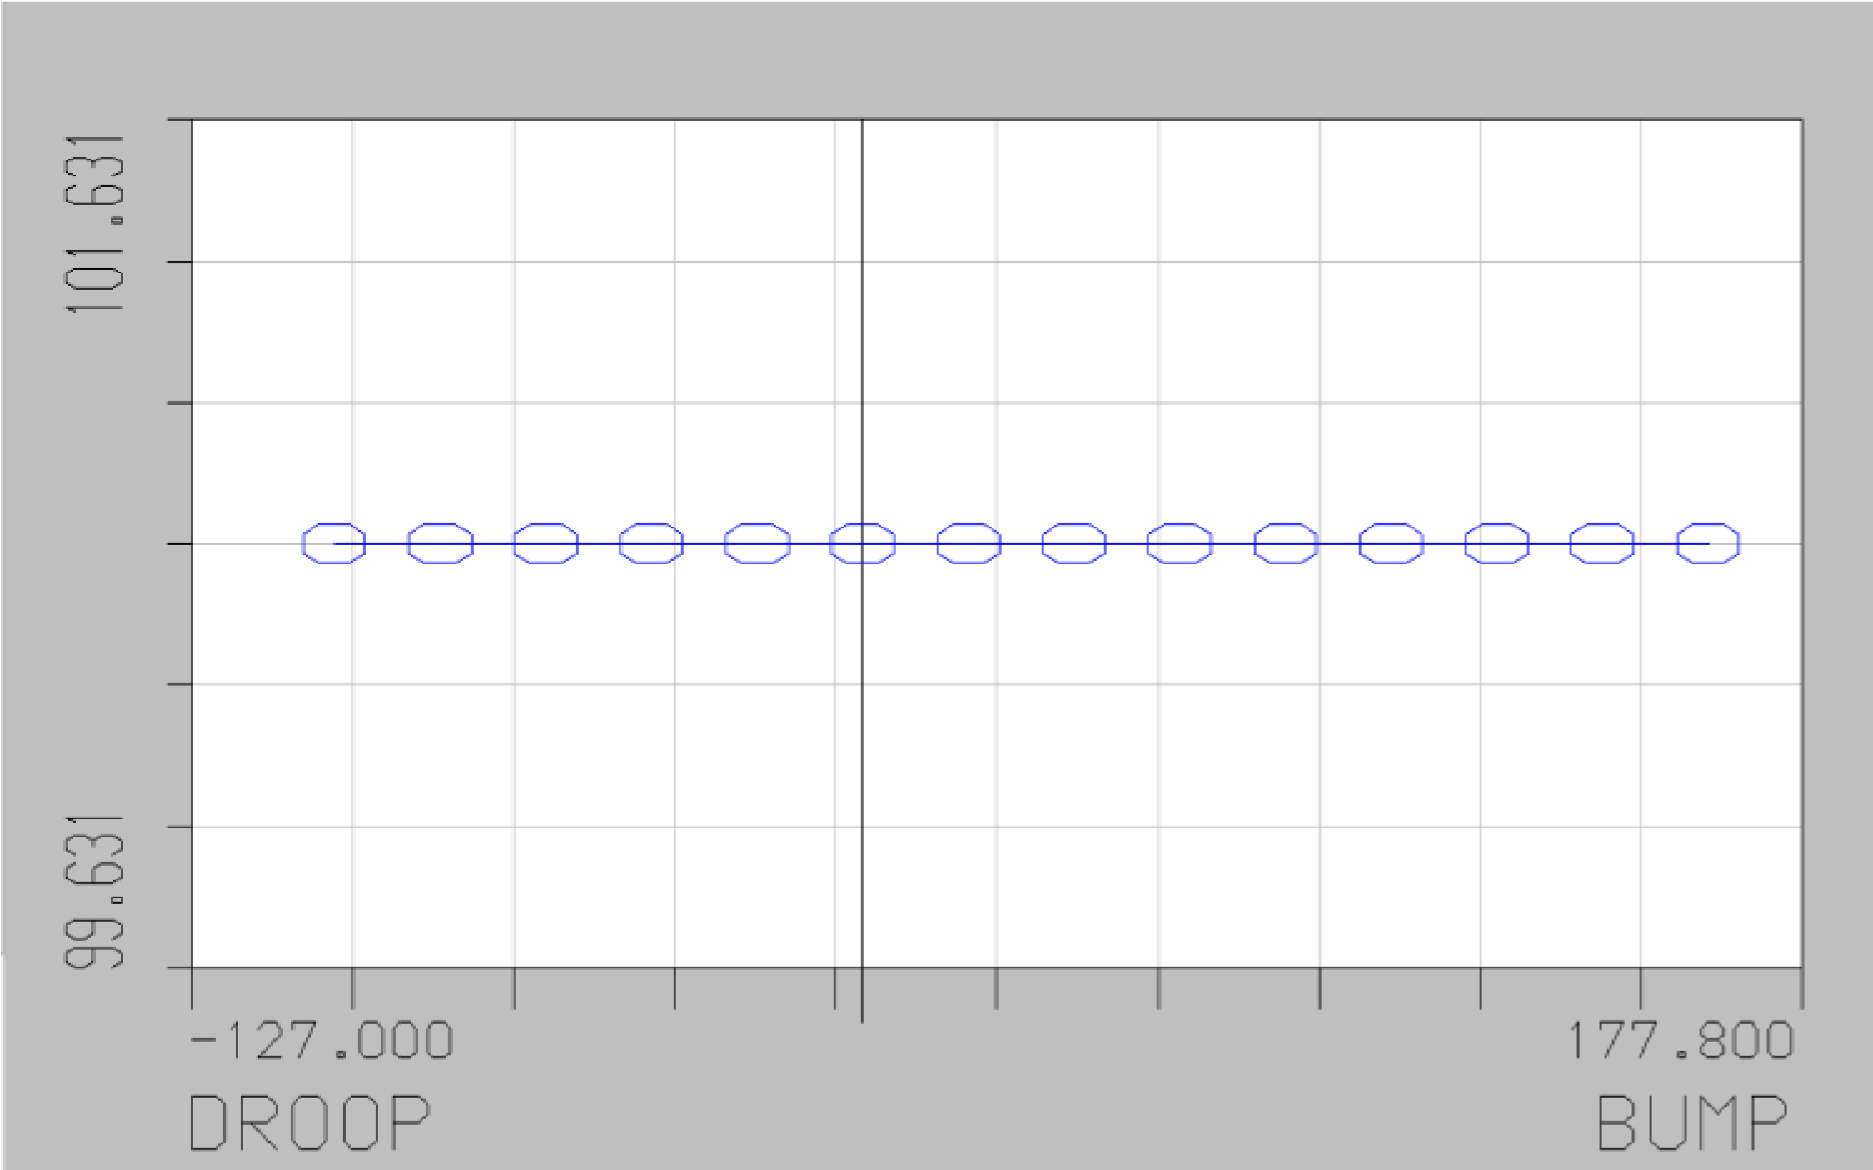
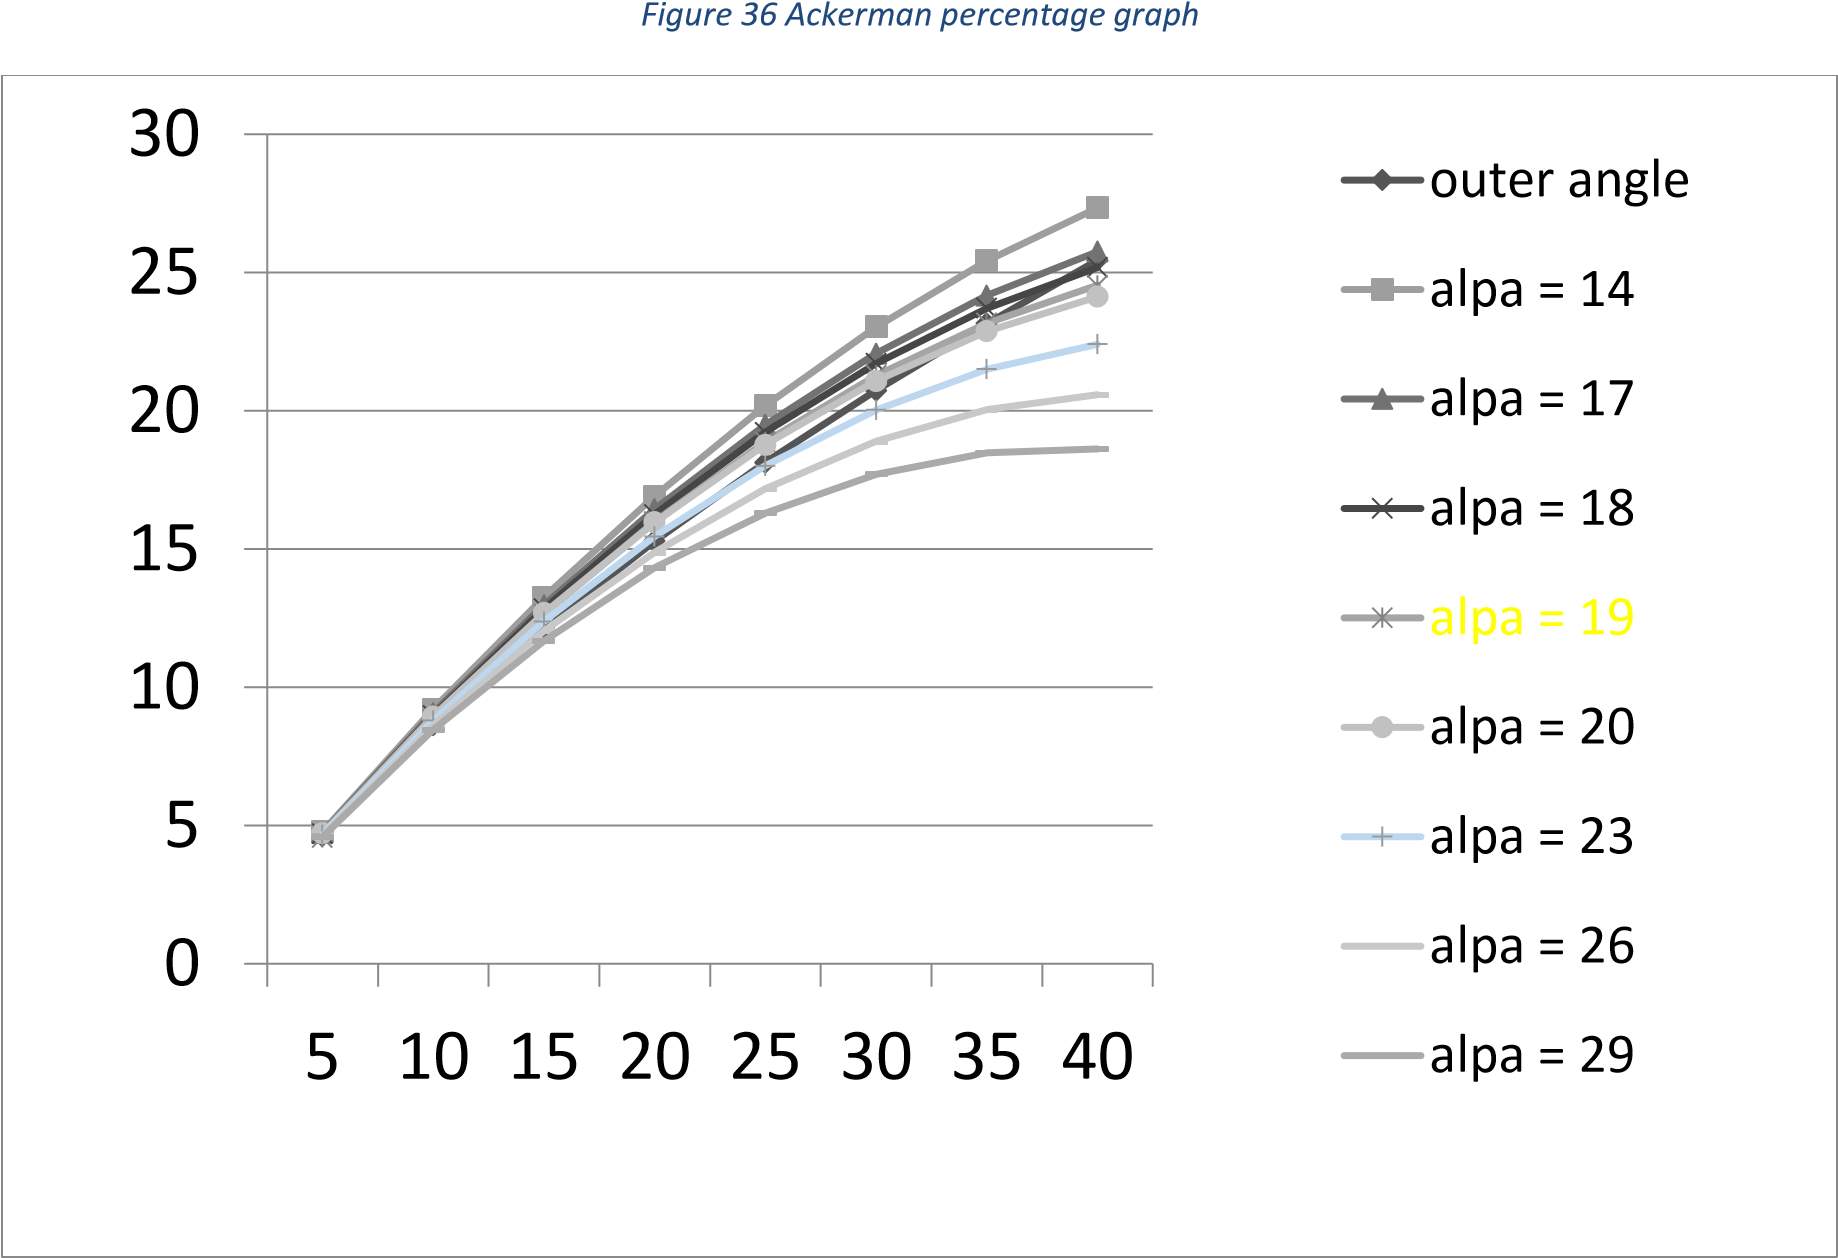
Figure 37 Inner angle vs Outer angle
4.2.5Steering System Layout
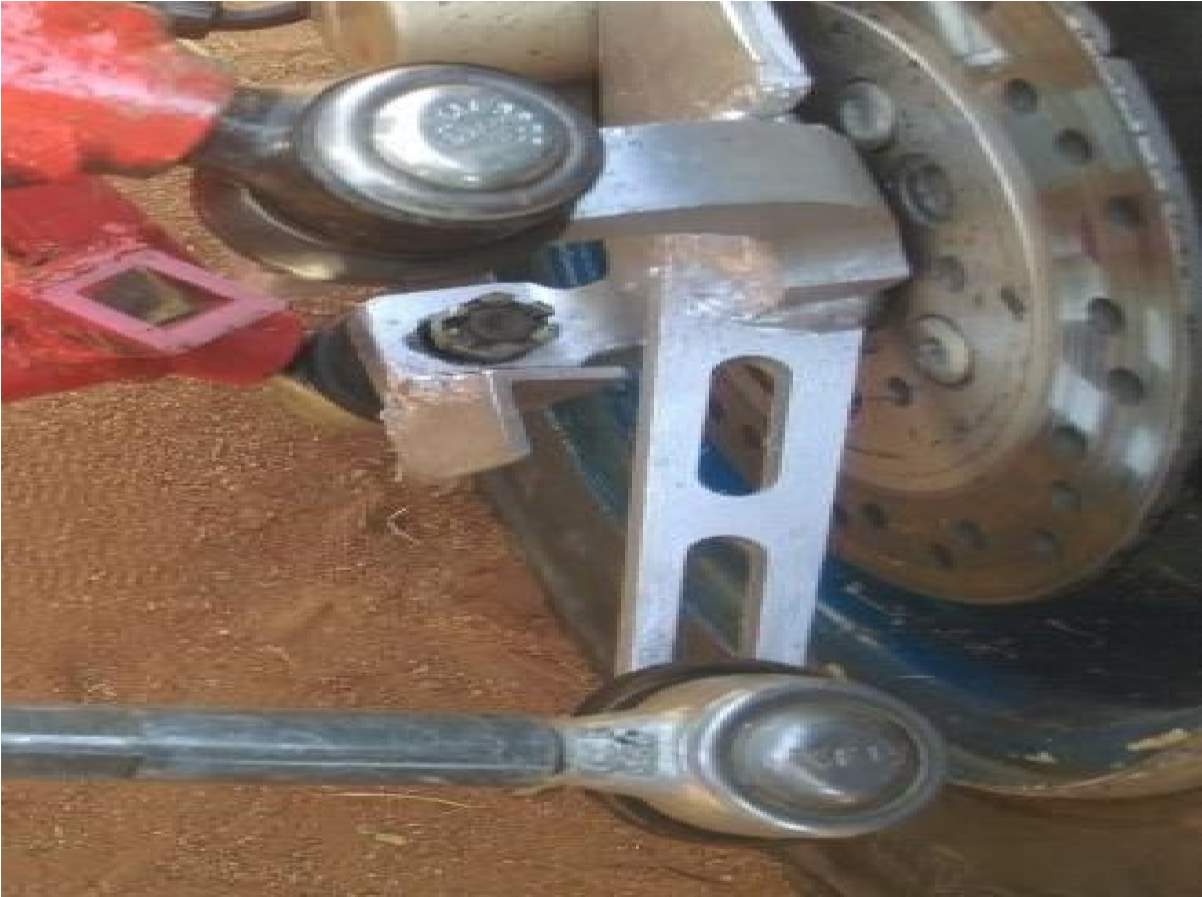
Figure 38 Steering System Layout
4.2.6Error Calculations
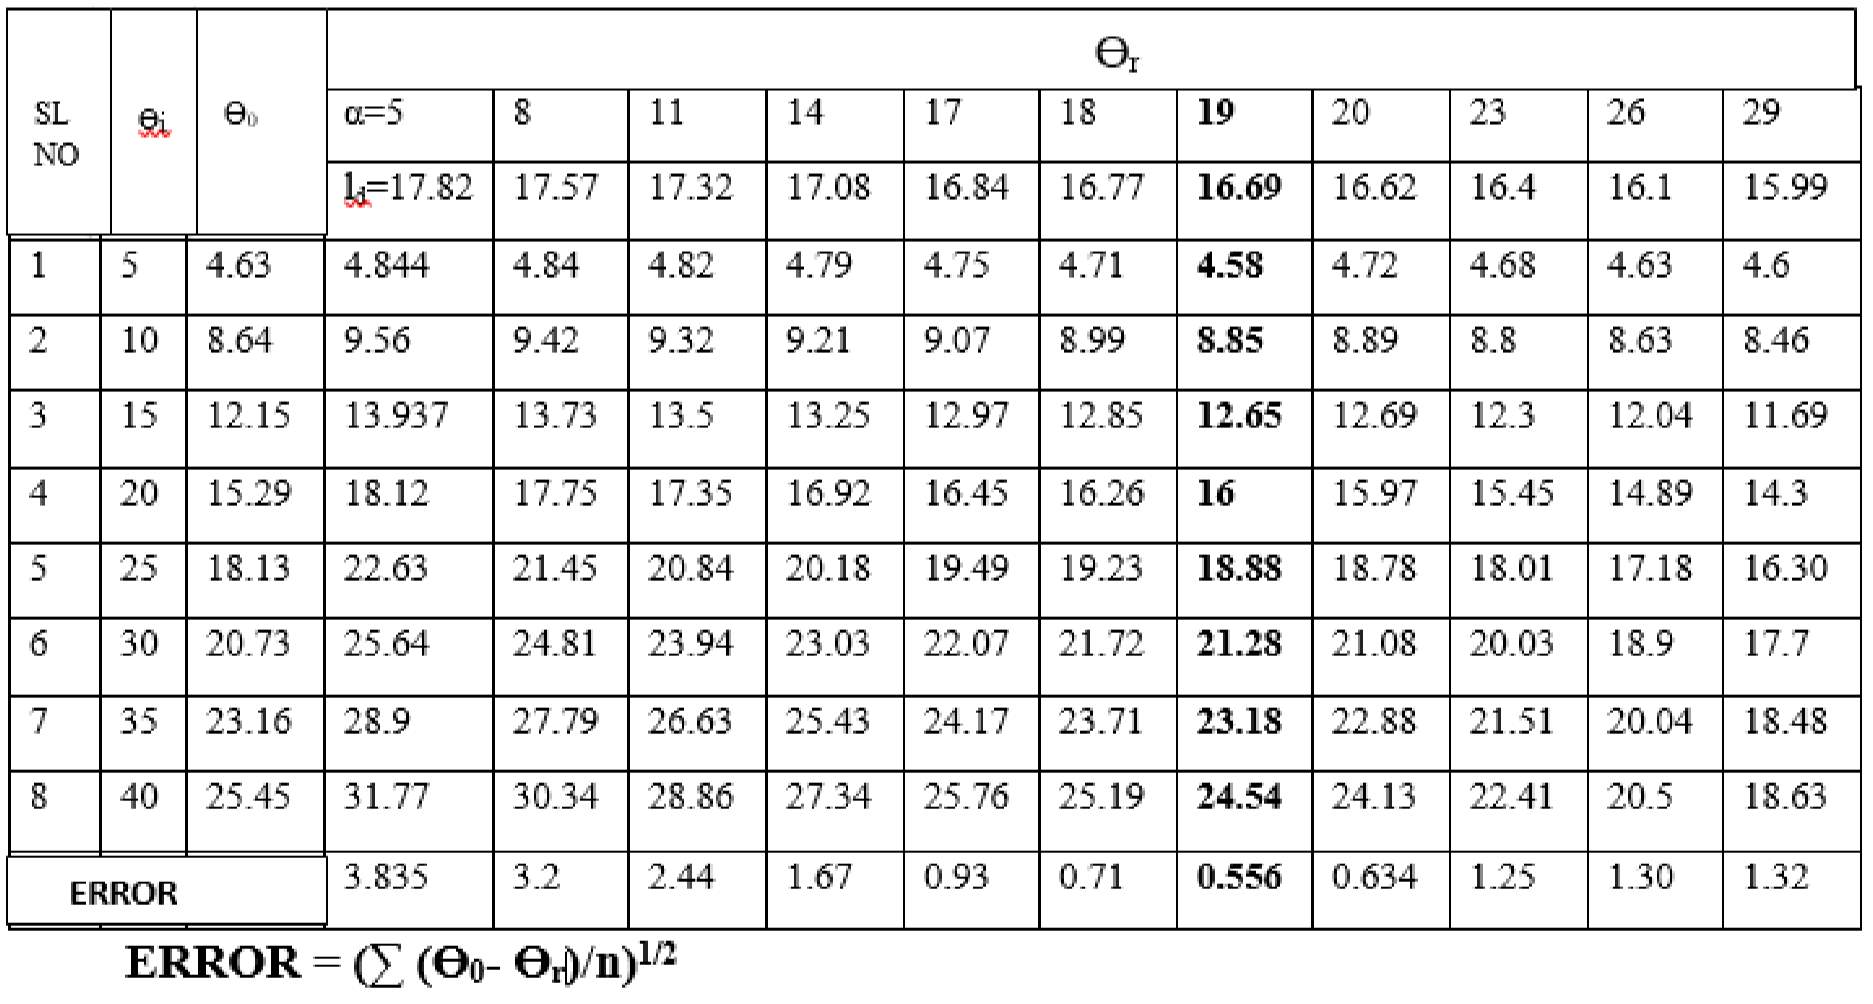
Figure 39 Error Calculations
 Suspension Design
5.1 Introduction
The main functions of suspension system in the vehicle is to
- Maintain the traction between the tire and ground
- vehicle handling
- driver comfort and safety
DEISGN METHDOLOGY:
DECIDING BASIC PARAMETERS:

DECIDING SUSPENSION GEOMETRY:

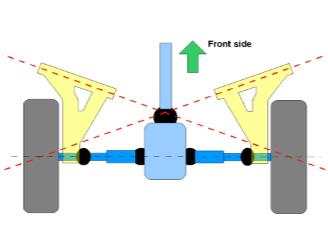
2 DIMENSIONAL SKETCH:

LOTUS ANALYSIS:

HARD POINT PICKUP:

SEVERAL ITERATIONS:

OPTIMIZATION:

COMPONENT DESIGN:
DECIDING BASIC PARAMETERS:
SUSPENSION CALCULATIONS:
Total sprung mass: The entire mass that acts upon the wheels of the vehicle is considered as sprung mass i.e., weight of the roll cage ,driver, engine, cvt, steering wheel , steering rack , braking .The lower the sprung mass is the better the performance of the vehicle.
Sprung mass:175 kgs
Total unsprung mass: The mass excluding the sprung mass is considered as unsprung mass i.e., weight of the wheels, uprights ,knuckles , a arms .Trailing arms.
Unsprung mass: 65 kgs
Total weight: sprung mass + unsprung mass gives the total weight of the vehicle
Total weight: 175 +65 = 240kgs
Kerb weight: The weight of the vehicle excluding the driver’s weight (Also known as curb weight )
Kerb weight: 240 – 60 = 180kgs
(Drivers weight is considered as 60kgs)
Front track width: there is no specific formulation in deciding the track width of the vehicle but we need to consider certain basics like
- Up to what value the rules allow?
- What is the predominant track type the vehicle is to be run?
iii) Are low speed tight circuits are of concern?
iv)Is top speed thus top frontal area is important?
Front track width: 52’’inches
Rear track width: selection criteria for rear track width depends upon the same considerations as of front but how ever we preferred the rear track width to be slightly greater than front for more stability of the vehicle
Rear track width: 53 inches
Static Ride height: It is always desirable to maintain a ride height at a moderate height which is not too high and not too low because if the ride height is low the vehicle may get hit at the bottom during getting over a bump and if the ride height is very high the height of COG increase which is also not a desirable scenario. So by benchmarking the ride heights of different commercial ATV’s the ride height for our vehicle is determined as
Static ride height: 12 inches
Tire diameter: The selection criteria for the diameter of the tire depends upon 2 factors
i) Vehicle’s torque
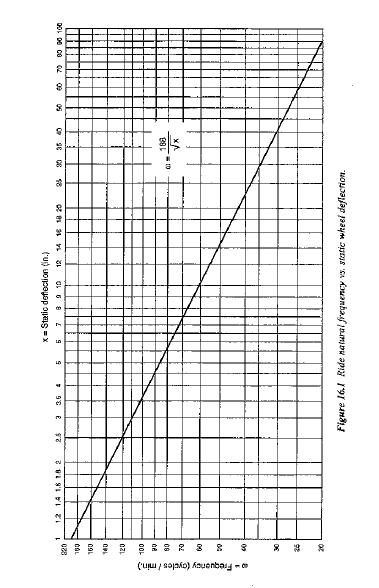
Rear spring travel: for rear whose wheel travel is low when compared to front the spring is also has been reduced and customized shock absorbers have been used whose spring travel is
Rear spring travel: 3 inches
Installation ratio: the installation ratio is also known as motion ratio which is determined as
Shock travel/wheel travel
Front: 5.3”/10”=0.53
Rear: 3”/6”=0.5
Ride frequency: It can be considered as the frequency of the body moving up and down on the springs. Usually the ride frequency can be determined once the static deflection has been estimated.
ii) Braking disc and caliper that needs to be fitted inside the wheel (rim)
Tire diameter: 23”inches
Wheel travel: The wheel travels for the several classes of the vehicles is specified as below
| Type of car | Wheel travel ( in inches) |
| i)off road cars | +/- 12” |
| 2)passenger cars | +/- 4” |
| 3)sports cars and small | +/- 2” or- 4”+/ |
| formula cars | |
| 4)indy type cars | +/- 0.5” |
So based upon the above data available the wheel travel for the fornt and rare has been considered as
Wheel travel front: 10” (4” bump, 6”droop)
Wheel travel rear: rear wheel travel is intentionally chosen to be less because if it is increased then there may arise a problem of slippage of split transmission shafts from the gear box which is connected to the rear wheel.
| Wheel travel : 6” (4”bump, 2”droop)inches | ||
| Front spring travel: Fox evol R shock absorbers are used | ||
| for the vehicle which have a maximum spring travel of | ||
| Front spring travel :5.3”inches | Usually for i)sports car : 70-90 cpm | |
| ii) Indy car : 95-120 cpm |
iii) Passenger cars : 30-50 cpm
Cpm : cycles per minute
Front: 2Hz (120cpm)
Rear: 2.5Hz (150 cpm)
Ride frequency is intentionally chosen more in order to stabilize the vehicle quickly after interacting with bump.
Spring stiffness: can be described as force per unit deflection the spring.
but we knew that w = =√(k/m)
also w =2πf
f= ride frequency
m = sprung mass that acts upon the individual tire
so we get
K = 4mπ2f2
Front: weight distribution for the vehicle is 45:55 front and rear so the total weight 240 x 0.45 = 108kgs
So the weight acting upon front individual tire will be 108/2 = 54 kgs
K = 4x 54 x 3.14 x 3.14 x 2 x 2 =8527.3 N/m
Rear: for rear 240 x 0.55 =132kgs and as of rear individual tire 132/2-= 66kgs
K = 4 x 66 x 3.14 x 3.14 x 2.5 x 2.5 = 16284.84 N/m
Wheel rate: vertical force per unit vertical displacement at the location along the spindle corresponding to the wheel center line measured relative to the chasis
Wheel rate = spring rate x (motion ratio) 2
Front: 8527.3x (0.53)2 =2395.3 N/m
Rear: 16284.84 x (0.5)2 = 4071N/m
Roll rate: moment (torque) resisting the body roll per degree of the body roll
Roll rate: (Track width) 2 x(left K)x(right K)

(Left K + right K)
Front: (1.3)2 x8527x8527 / (8527+8527)
=7167 N-m/deg roll
Rear:
(1.34)2 x16284.84×16284.84/ (16284.84+16284.84)
=14619.77 N-m/deg roll
Roll center height:
Roll center height plays a prominent role in suspension whenever the vehicle undergoes rolling it is said to be rolled around an axis called roll axis. This roll axis is a line that passes through the 2 points called roll centers. During cornering of the vehicle there acts a centrifugal force an outgoing pseudo force on the vehicle which results in moment arm. This moment arm depends upon the centrifugal force and the distance between the roll center and COG so if the distance between roll center and COG increases then the moment arm produced will have a high value which results in the rolling of the vehicle. Thus it is mandatory that the distance between roll center and COG should be kept as small as possible.
Roll center height is found by
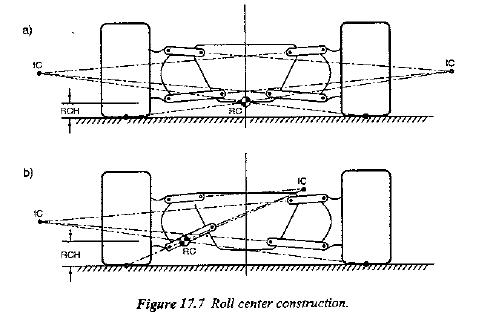
Front: 167.39mm
Rear: 177.818mm
SUSPENSION TYPE:
There are different types of suspension system which can be used for a vehicle depending upon our need. Basically suspension can be classified into 3 types.
- Dependent suspension
- Independent suspension
- Semi-independent suspension
Independent suspension is preferred over dependent suspension because the vehicle is made to run on uneven terrain so that each wheel can act individually irrespective of the other wheel.
FRONT SUSPENSION: Of all the independent suspension systems available double wishbone suspension with unequal arms of unequal length for front suspension is adopted for the vehicle because of the numerous merits it possess when compared to all other suspension types.
MERITS OF DOUBLE WISHBONE-
- Adjustable camber angle
- Controlled toe
- Easy to build
REAR SUSPENSION: Though double wishbone possess tremendous advantages it can’t suspension because of its complexity and weight so trailing arm with a mono shock has been implemented
for the rear part of the vehicle
SUSPENSION GEOMETRY:
| FRONT | REAR |
| Camber- 3 deg adjustable | Camber- 0 deg non adjustable |
| Castor- 8 deg | Castor-0 |
| Kingpin inclination- 10deg | Kingpin inclination-0 |
| Toe : -2.467 | Toe: 0 |
| Scrub radius: -35.4mm | Scrub radius: 0mm |
2 DIMENSIONAL
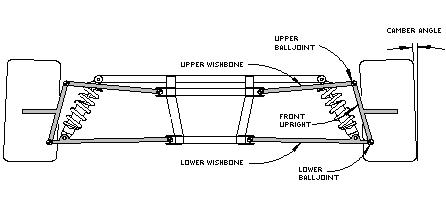 SKTECH: FRONT:
REAR:
LOTUS ANALYSIS:
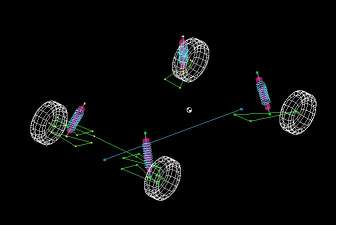
Introduction: A Market Leading Application For Suspension Modelling And Design From The World-Leaders In Vehicle Ride And Handling; The Lotus Suspension Analysis Shark Module Is A Suspension Geometric And Kinematic Modelling Tool, With A User-Friendly Interface Which Makes It Easy To Apply Changes To Proposed Geometry And Instantaneously Assess Their Impact Through Graphical Results.
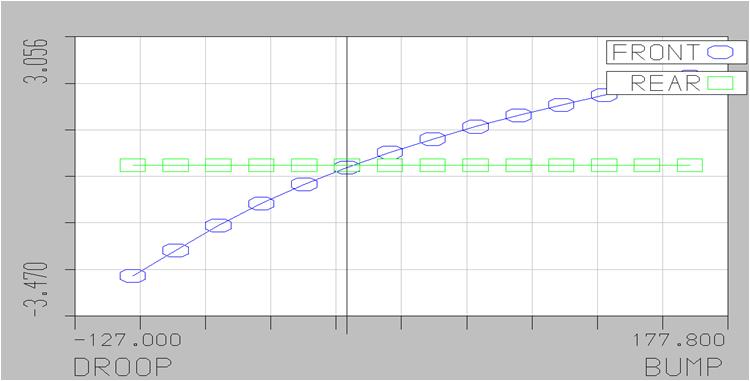
WHEELTRAVEL VS CAMBER ANGLE GRAPH:
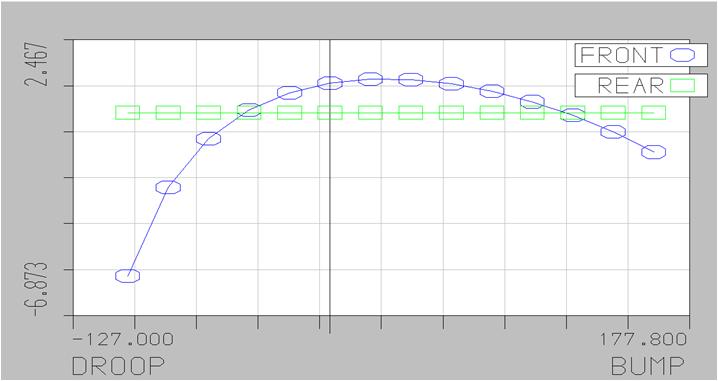
WHEEL TRAVEL VS TOE ANGLE GRAPH:
Inputs:
- Front: 6” bump, 4” droop Rear: 4”bump, 2”droop
- Roll: 2 degree
- 3 dimensional steer with 40mm rack droop
| Front | X | Y | Z |
| Lower | 329.4 | 205.5 | 334.876 |
| Wishbone | |||
| Pivot | |||
| Lower | 467.45 | 203.5 | 310.339 |
| Wishbone | |||
| rear pivot | |||
| Lower | 348.4 | 551.5 | 217.1 |
| Wishbone | |||
| outer ball | |||
| Joint | |||
| Upper | 204.33 | 205.5 | 367.1 |
| Wishbone | |||
| front pivot | |||
| Upper | 500.0 | 205.5 | 367.1 |
| Wishbone | |||
| rear pivot | |||
| Upper | 426.6 | 525 | 260.3 |
| Wishbone | |||
| outer ball | |||
| Joint | |||
| Damper | 398.4 | 380.7 | 632.7 |
| Wishbone | |||
| End | |||
| Damper | 462.11 | 205.5 | 292.1 |
| body end | |||
| Outer track | 525.15 | 493.9 | 378.8 |
| rod ball joint | |||
| inner track | 590.15 | 205.5 | 260.3 |
| rod ball joint | |||
| Wheel | 414.25 | 531.5 | 295.3 |
| spindle point | |||
| Wheel | 411.35 | 660.4 | 292.1 |
| center point | |||
HARDPOINT PICKUP:
After doing several iterations and lotus suspension stimulation software we decided the above hard points while deciding then we studied the following properties in three different types of motion
- 3 Dimensional bump
- 3 Dimensional steer
- 3 Dimensional roll
- 3 Dimensional motion
| Rear | X | Y | Z |
| Lower | 1723.92 | 147 | 304.8 |
| wishbone | |||
| front pivot | |||
| Lower | 1843.3 | 147 | 304.8 |
| wishbone | |||
| rear pivot | |||
| Lower | 1783.9 | 551.5 | 190.5 |
| wishbone | |||
| outer ball | |||
| joint | |||
| Upper | 1723.95 | 147 | 508 |
| wishbone | |||
| front pivot | |||
| Upper | 1843.2 | 147 | 508 |
| wishbone | |||
| rear pivot | |||
| Upper | 1783.2 | 551.5 | 393.7 |
| wishbone | |||
| outer ball | |||
| joint | |||
| Damper | 1723.95 | 431.167 | 426.101 |
| wishbone | |||
| end | |||
| Damper | 1783.954 | 147 | 637.355 |
| body end | |||
| Outer track | 1783 | 147 | 320 |
| rod ball joint | |||
| inner track | 1783.95 | 551.5 | 292.1 |
| rod ball joint | |||
5.2.7Suspension Mounting
Front
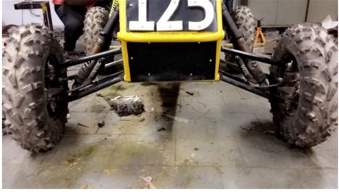
Figure 51 Suspension front mounting
Rear
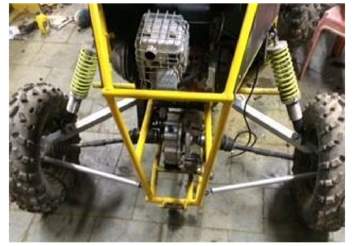
Figure 52 Suspension Rear mounting
 Braking system
6.1 Introduction
There are different types of brakes depending upon type actuating medium and direction of action of brake pads on wheels. Depending upon type of fluid there are pneumatic (air) brakes and hydraulic brakes are used in heavy vehicles. Hydraulics is used in small vehicles.Depending on direction of action there are disc and drum brakes. Drum brakes are also called radial brakes. Disc brakes are also called axial brakes.
6.2 Calculations
In order to choose the required diameter of master cylinder and caliper pistons we need to calculate the required forces and torques acting on the front and rear wheels.
ON REAR WHEELS:
Since power is given to rear wheels high amount of force is required on the rear wheels.
Max Torque acting on each rear wheel considering all losses = 1200N-M.
So we have to design the braking torque to be > 1200 N-M.
(Because the maximum torque at each rear wheel is 600 N-M and this lasts for time < 2 seconds so, we can consider a continuous torque of 450N-M approximately. Although this maximum torque is not acting at front wheels actually, we have considered this same maximum torque at front wheels and calculations are done. In this way we can balance the any unaccounted or un-estimated or additional torque from the differential.)
Pedal ratio: 6:1(lever ratio or mechanical advantage)
(Because if we exceed the pedal ratio greater than 6:1 it may cause the bending of pedal and it leads to failure of braking circuit)
Max Force on the pedal = (75lbs*.456) *9.8*(6/1) * = 1980 N.
(Maximum force on a pedal varies between 50-75lbs (SAE standard).
For proof refer www.sae.org/events/bce/tutorial-limberg.pdf.)
Diameter of the master cylinder (say) = 0.019 M.
Diameter of the disc (D) = 190 MM.
Diameter of the caliper cylinder (say) = 0.042 M FRONT, 0.0344 M REAR.
Co-efficient of friction (µ) = 0.6
IN THE IDEAL CONDITION
Input pressure = output pressure
(According to Pascal’s law in a confined or closed area pressure exerted on incompressible fluid remains constant at every point in the confined area)
FOR BRAKING FORCE:
F (input)/F (output) = (d (input)/d (output)) 2.
F (output) = 4236.37 N.
For two such cylinders TOTAL F (output) = 4236.37*2 = 8472.75 N.
Total clamping force = 8472.75 N.
FOR FRONT WHEELS:
For front wheels also we can select the required torque and calculate similarly.
FOR BRAKING TORQUE:
Total BRAKING TORQUE available = F (output)* µ*D/2.
= 8472.75*.7*.095 = 1257 NM.
TANDEM MASTER CYLINDER:
It’s different from general master cylinder. At present all our cars, auto’s equipped with this one. It has three fluid outlets; but only two outlets are used. The main purpose of this is, if one piston fails to work the other piston works and provides fluid to one of the circuit this provides still efficient braking.
- We are using TMC of Bajaj Re, cylinder diameter=2.54cm, cost=RS 1000/- this is available very easily.
- This can also be mounted accordingly in the pedal cabin.
Tandem Master cylinder of diameter less than the above is not easily available in the market.
Brake fluid =DOT-3 (which is easily available in the market) The maximum torque at our wheels =563.43 NM.
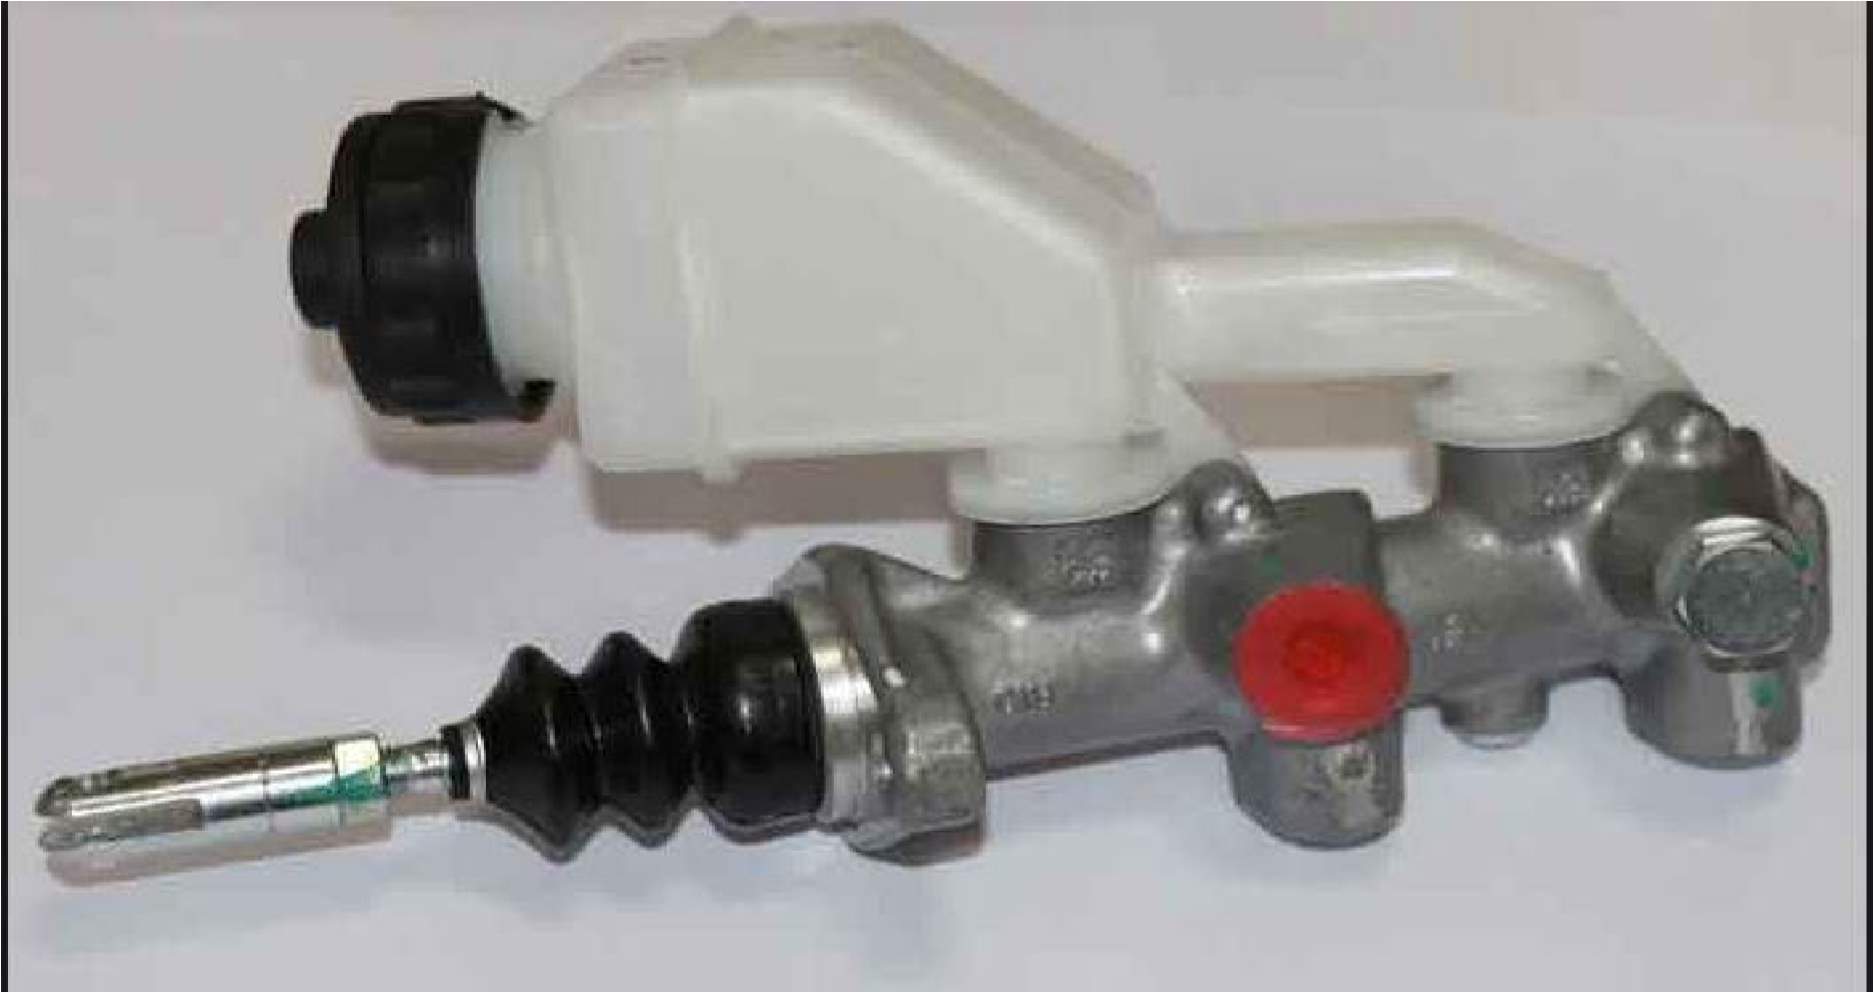
Figure 53 Master Cylinder
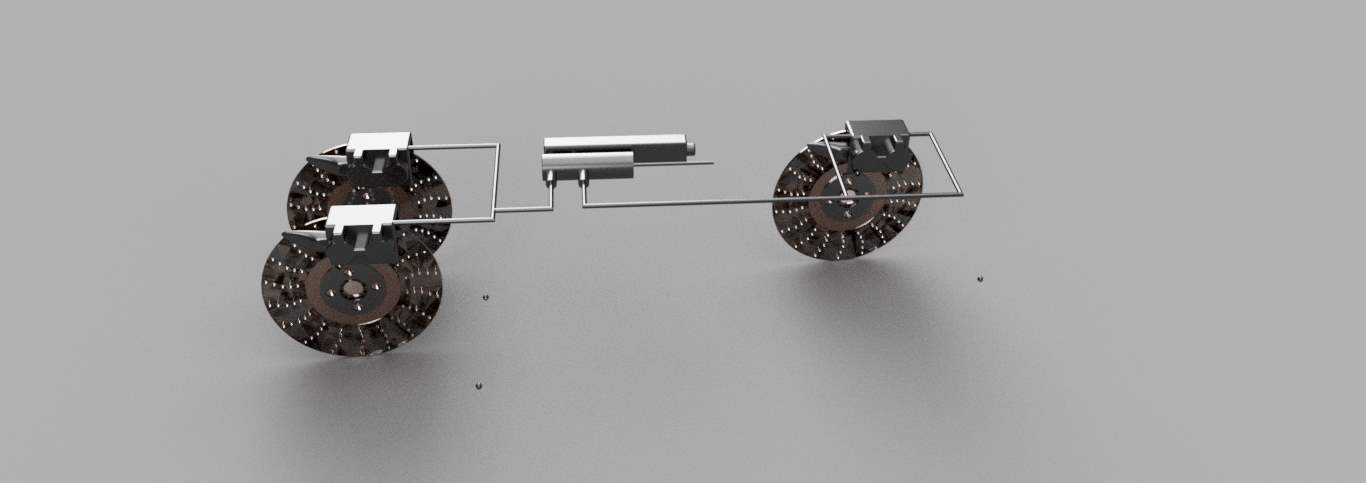
Figure braking circuit
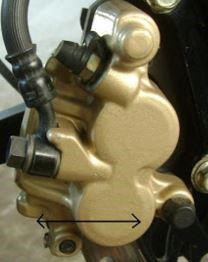
Figure 54 Caliper
6.2.1 Stopping distance calculations
The stopping distance is one of the complex parameter to calculate because it depends:
- Friction between wheels and the track.
- Momentum loss at the instant of application of brakes.
- The Moment when wheels lock, friction changes from rotary to sliding.
- Braking torque & friction between disc and brake pads.
- The amount of load transfer.
Some of the above conditions are difficult to estimate hence stopping distance is calculated approximately.
At Initial velocity (U) = 60KMPH = 16.666667 m/s.
V = U + (a*t)
Final velocity (V) =0, total stopping time (t) = 2.93 S.
Deceleration = -a = 5.55 m/s.
Stopping Distance = (V) 2/(2* µ*g).
| S.no | Speed(kmph) | Stopping distance(m) |
| 1 | 10 | 0.65 |
| 2 | 20 | 2.61 |
| 3 | 30 | 5.89 |
| 4 | 40 | 10.81 |
| 5 | 50 | 16.36 |
| 6 | 60 | 23.40 |
Table 10 Stopping distance values
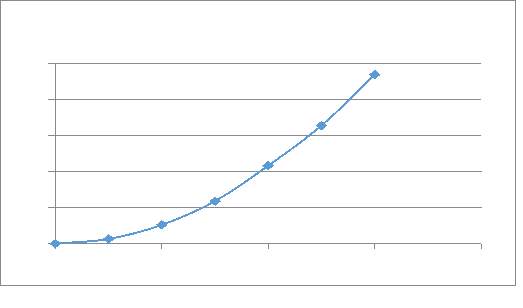 Figure 55 Graph Stopping distance Vs Speed
6.2.2Load Transfer Mass of the vehicle (M): 193kgs.
Height of the center of gravity from ground (h):16inch
Acceleration ratio at v m/s (r) = v/9.8.
Wheel base (w) = 52inch.
Longitudinal load transfer: M*h*a/w.
| S.no | Speed(kmph) | Load transfer(kg) |
| 1 | 10 | 10.09 |
| 2 | 20 | 20.29 |
| 3 | 30 | 30.28 |
| 4 | 40 | 40.61 |
| 5 | 50 | 62.94 |
| 6 | 60 | 75.89 |
Table 11 Load transfer Values
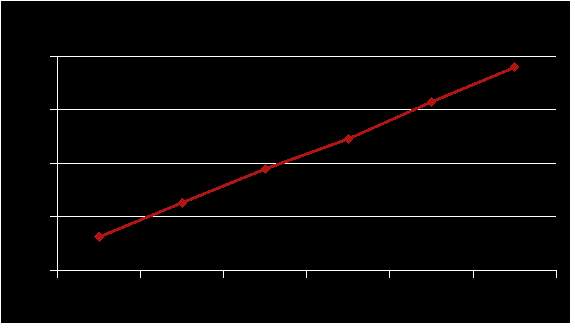
Figure 56 Stopping distance Vs Speed
6.2.3Braking Parameters
| BRAKE CIRCUIT | VALUE |
| TYPE | Front or rear-SPLIT |
| MASTER CYLYNDER: BORE DIAMETER STROKE | 0.0019m0.035m |
| TYPE OF BRAKES | DISC BRAKES |
| CALIPER CYLINDER: | |
| BORE DIAMETERNUMBER OF CYLINDERS:FRONTREAR | 0.03m23 |
| MEAN BRAKING: | |
| RADIUS front rear AREA COEFFICIENT | 0.08m0.2m0.4156m20.4 |
| WEIGHT TRANSFER: AT (40kmph) | |
| LONGITUDINAL | 40.61KG |
| ROLLING RADIUS OF TYRE | 0.29M |
| COEFFICIENT OF FRICTION FOR ROAD | 0.4 |
| TORQUE REQUIRED PER WHEELFRONT WHEELREAR WHEEL | 743.049NM498.46NM |
| FORCE REQUIRED BY CALIPER CYLINDERSFRONTREAR | 9.76KN 6.510KN |
| BALANCE REQUIRED | FRONT:40% REAR :60% |
Table 12 Braking Parameters
 Transmission System
7.1 Introduction
Providing required torque and RPM whenever necessary is main aim in designing a power transmission for an ATV, keeping in view of this this power transmission is designed using infinitely variable transmission system which is commonly called as CVT transmission system.
7.2 Calculations
ENIGNE SPECIFICATIONS:
Manufacturer: Briggs & Stratton
Technology: Over Head Valve Technology
Volume: 305CC
Power: 7.5KW @3700RPM
Torque: 27 N-m @1800RPM
Speed: 3,800RPM
Ignition: Magneto-Ignition
Cooling System: Air cooled
Maximum torque is required in hill climbing event in view of this calculating toque required for a hill of inclination 300
For the engine selected observing the graph of torque vs rpm the maximum torque is obtained as 25N-M
Choosing the tire radius as 23inch and assuming co efficient of friction as 0.4 and transmission efficiency of 90%
Tire Radius = 23inch
Co efficient of friction= 0.4
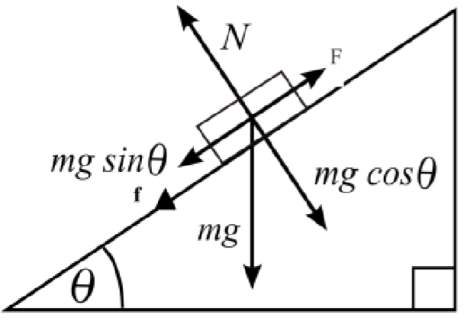
Figure 57 Grade ability
Transmission efficiency = 90 %
Let the normal force is represented by N and mg is the weight of the vehicle, and f be frictional force
N=mg cosθ
F = mg sinθ+f
F= mgsinθ+µN
F= mgsinθ+µ mgcosθ T/r=mgsinθ+µ mgcosθ ηeff T reduction/r=mgsinθ+µ mgcosθ
N1 = total reduction
N1 = m*g*(sin θ + µ*cos (θ)) *r/ (T*ηeff)
N1 = 350*9.81*(sin 300 + 0.4*cos 300) *11.5*0.0254/ (25*0.9)
N1=37.728
Maximum speed:
V= π * D * N/60
N2= π*23*0.0254*3,800/60*16.67
N2=6.9728
7.3 CVT Design
Belt selection
Center –center distance(x) =232mm
Length of the belt (l) =895mm
Maximum ratio = 3.4:1
Minimum Ratio = 0.54:1
L=2*x+π*(r1+r2) + (2*(r1-r2)2/x)
Substituting: 3r1= r2 we get D1 =63.12mm, D2=189.36mm
0.45 r1= r2 we get D1=180.02mm, D2=81mm
| Maximum diameter | Minimum diameter | |
| Driver pulley | 180.02 mm | 63.12 mm |
| Driven pulley | 189.36 mm | 81mm |
Table 13 Drive & driven pulley dimensions
7.3.1Belt Tensions
Belt speed at high ratio = π* D1*N/60=12.22 m/sec Belt Speed at Low Ratio = π* D2*N1/60=34.8 m/sec
Assume µ=0.3
Angle of Wrap β1 = 148.420 β2=155.350
Angle of Groove (α) = 320
µcosec (α/2) =1.088
Tensions at height ratios:
T1/T2= e(µcosec (α/2))=16.65
P=v(T1-T2)
T1=652.69N T2=39.21N.
7.3.2Shaft Load
Fs = (T12+ T22-2* T1*T2*cos (β1)) 1/2 Fs=686.59
7.3.3Clamping force
Fc= P/ (µ*v)
Fc = 563.90N
Reduction required attaining a speed of 60KMPH
N2/N1=0.54
Ratio inside Gear Box = 13.4
7.3.4Shaft design
Main Shafts:
Total Torque to be transmitted = 1188N-m
Type of shaft – Solid
Material – EN 36(Oil Quenched at 8300 and tempered at 200 0c)
Ultimate Tensile Strength = 1140MPa
Permissible Shear Stress = 342 MPa
Diameter of the Shaft d3= 16*T/ (π*σs) D=25.7 MM
7.4 Transmission Layout
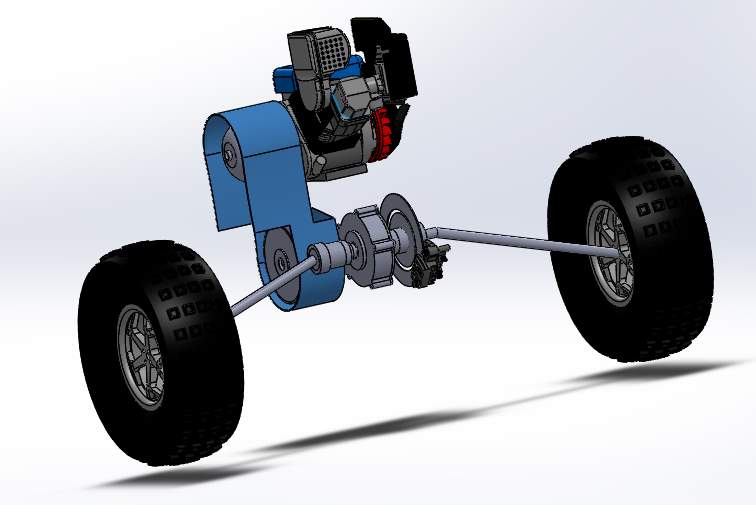
Figure 58Transmission Layout
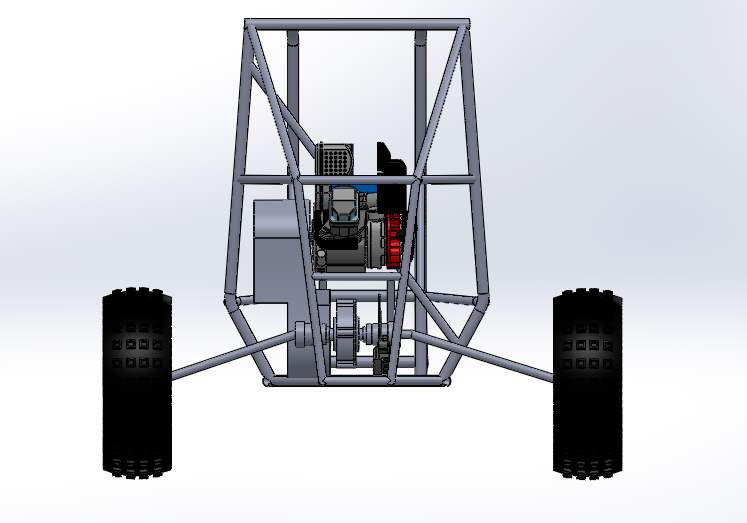
Figure 59 Transmission Layout-2 cad model
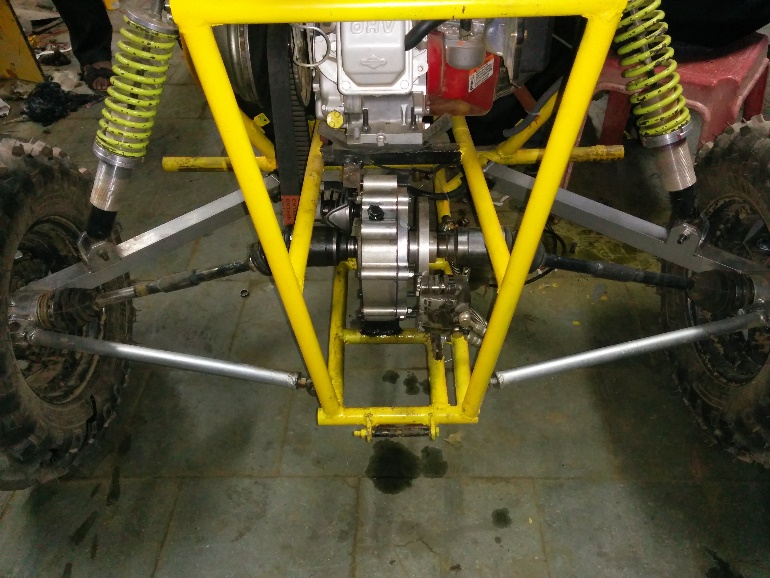
Figure 60 Transmission Layout-2
 Results and Conclusion
| Vehicle parameters | Value | |
| Wheel base | 52 Inch | |
| Track Width (Front & Rear) | 52 Inch | |
| Maximum Length | 76 Inch | |
| Maximum Width | 56 Inch | |
| Ground Clearance | 11 Inch | |
| CG Height | 21.4 Inch | |
| Maximum Speed | 60 Kmph | |
| Maximum Acceleration | 12 m/s2 | |
| Grade ability | 34 Degree | |
| Stopping distance | 3 meter at 60 kmph | |
| Kerb Weight | 193 KG | |
| FAW:RAW- Laden | 1:1.34 | |
| Chassis Material | AISI 1018 | |
| Engine | B&S 305 cc | |
| Transmission | CVT WITH GEAR BOX | |
| Brakes | Discs on 2 WHEELS AND REAR INBOARD BRAKING | |
| Steering | Rack & pinion | |
| Suspension | ||
| Front | Double wishbone | |
| Rear | Trailing Arm |
Table 14 Vehicle Parameters
Bibliography
- Race Car Vehicle Design by Milliken & Milliken
- Fundamentals of Vehicle dynamics by Thomas & Gillespie
- Tune to Win by carol Smith
- Clutch handling book by Aean
- Theory of machines by RS Kurmi
Cite This Work
To export a reference to this article please select a referencing stye below:
Related Services
View allRelated Content
All TagsContent relating to: "Automotive"
The Automotive industry concerns itself with the design, production, and selling of motor vehicles, such as cars, vans, and motorcycles, and is home to many multi-billion pound companies.
Related Articles
DMCA / Removal Request
If you are the original writer of this dissertation and no longer wish to have your work published on the UKDiss.com website then please:


