CFD Simulation of Lubricant Film Between a Piston Ring and Cylinder Liner
Info: 12315 words (49 pages) Dissertation
Published: 15th Nov 2021
Tagged: EngineeringTechnology
Abstract
Lubrication is one of the most important aspects in reducing energy loss and increasing engine efficiency in internal combustion engines. This dissertation considers the possibility of using ANSYS Fluent to analyse the effect that changing piston ring profile has on the pressure distribution in the lubricant and force exerted on the cylinder liner. The way the project achieves this is by setting up an existing piston ring profile in Fluent and analysing it. The results are then compared to the results conducted on that piston ring profile in a physical experiment. The same Fluent setup is then used to analyse different piston ring profiles and the results compared and analysed.
Expand table of contents
Table of Contents
Acknowledgements
Nomenclature
Abbreviations
Roman Symbols
Greek Symbols
Other units
Chapter 1: Introduction
Chapter 2: Literature Review
2.1 Purposes of lubricating oil in IC engines
2.1.1 Lubrication
2.1.2 Cooling
2.1.3 Cleaning
2.1.4 Sealing
2.1.5 Protection
2.1.6 Why does this matter?
2.2 Cavitation
2.2.1 What is cavitation?
2.2.2 Why does cavitation matter?
2.3 Piston rings
2.3.1 Piston ring shapes and their functionality in IC engines
2.3.2 Ring Pack
2.3.3 How piston rings work
2.3.5 Lubricant flow around a ring pack
2.3.6 The different types of piston rings
2.4 Experimental results
2.4.1 Maximum pressure
2.4.2 Oil film thickness
2.5 Density of Oil
Chapter 3: Theory
3.1 Validation test
3.2 CFD software used
3.3 Geometry
3.3.1 Geometry of experiment
3.3.2 Max height of the geometry (ICEM CFD)
3.4 Velocity of the wall (Fluent)
3.5 Viscosity of oil
Chapter 4: Method
4.1 Experimental specimen ring profile
4.2 Setting up the geometry on ICEM CFD
4.2.1 Create Point
4.2.2 Create/Modify Curve
4.2.3 Create Block
4.2.4 O-Grid
4.2.5 Create Parts
4.2.6 Create Mesh
4.3 Setting up the simulation in Fluent
4.3.1 General
4.3.2 Models
4.3.3 Materials
4.3.4 Phases
4.3.5 Boundary Conditions
4.3.6 Solution Methods
4.3.7 Monitors
4.3.8 Solution Initialization
4.3.9 Run Calculation
4.3.10 Contours
4.3.11 Static pressure graph
4.3.12 Reports
Chapter 5: Results and Discussion
5.1 Experimental results vs CFD results
5.2 Changing the film thickness in CFD
5.3 Changing the Viscosity
5.4 CFD Trends
5.5 Experimental vs. CFD discussion
5.6 New Piston Ring Profiles in CFD
Chapter 6: Conclusions
6.1 Achievements and Highlights
6.2 Progress to plan
6.3 Learning Outcomes
6.4 Metrics
6.5 Conclusion
List of Figures
List of tables
References
Expand nomenclature
Nomenclature
Abbreviations
CAD computer-aided design
CFD computational fluid dynamics
FT oil film thickness
IC internal combustion
RPM revolutions per minute
Roman Symbols
oC degrees Celsius
c centi (1 x 10⁻²)
g gram
k kilo (1 x 10³)
m metre
m milli (1 x 10⁻³)
rad radians
Pa pascals
s seconds
St stroke
Greek Symbols
μ micro (1 x 10⁻⁶)
Other units
Micron 1 micron = 1 micrometre
Chapter 1: Introduction
As the world becomes more aware of the environmental problems caused by humans, demand for engineers to design machines that are more efficient is higher than ever. Efficient machine design is especially important when it comes to machines that are considered essential to the modern way of life, for example, the internal combustion (IC) engine. In IC engines, one of the most important and hostile environments is the interface between the piston, piston rings and cylinder liner [1].
Over the past few years, the role of the piston ring in IC engines has become more complex. They function to lower oil consumption, lower friction, increase engine performance, decrease the wear of the piston and increase the engine durability [2]. It is therefore of utmost importance for an engineer to pick the correct type of piston ring for each part of the piston in IC engines to maximise its performance. In order to know the best type of ring to use for each part of the piston, one must have data to back up the choice made. To get this data, experiments need to be conducted. Experiments are expensive and time consuming to run and need to be repeated for validation because human error is always a possibility.
This report is looking into the possibility of using computational fluid dynamics (CFD) software to simulate the conditions. If it is possible to do these experiments via computer simulation, it will be much faster and cheaper than doing the physical experiments. The CFD software used in this report is ANSYS Fluent. To see whether the way ANSYS Fluent is used in this project can simulate the conditions between a piston ring and cylinder liner accurately, an existing piston ring and cylinder liner profile will be set up and run through ANSYS Fluent.
The experimental data is then compared against the simulated data. The experimental data used to verify the computation is found in Oil Transport in Piston Ring Assemblies [3]. After the computation is verified, new piston ring profiles will be set up and run through the simulation again and the results will be analysed to see the difference that changing the piston ring profile makes to the lubricant flow between the piston ring head and cylinder liner. The two variables compared will be the static pressure in the lubricant and the force exerted on the piston ring.
Chapter 2: Literature Review
2.1 Purposes of lubricating oil in IC engines
2.1.1 Lubrication
The primary purpose of lubricating oil is to reduce the coefficient of friction between the moving parts. This means it decreases the power required to overcome friction. Reducing the friction also reduces the wear between the rubbing and the bearing surfaces. This, therefore, increases the power output and the engine service life. The lubricating system must provide a continuous flow of oil to all of the engine bearing sand other lubricated surfaces so that the oil film on each component is maintained to minimise wear [4]. The correct oil viscosity is also essential for friction reduction. Lower viscosities lose the oil film faster whereas higher viscosities may have more gaseous cavitation due to inadequate oil flow [5].
2.1.2 Cooling
Another major function of lubricating oil is the cooling of components. The lubricating oil absorbs the heat and carries it away from the components which are lubricated. The oil is then returned to the oil pan which generally would have an external cooler to help cool the oil. This is essential as it is important to keep the oil temperature below the flash point of the oil. The oil is also required to have a high heat resistance so that carbon formation due to breakdown is kept to a minimum [4].
2.1.3 Cleaning
Another function of lubricating oil is cleaning. Additives are added to the engine oil so that when it is in contact with the engine components, it will clean them. Carbon formation is cleaned from the pistons and the piston rings [4]. The build-up of carbon formations can cause sludge, gunk, debris or other similar deposits. These will increase the friction between the parts, so it is important to clean these off [6].
2.1.4 Sealing
Another essential function of the lubricating oil is to form a tight seal between the rings and the cylinder walls. The microstructure of the piston rings and cylinder walls will have microscopic irregularities that can be a potential escape for the combustion chamber gas. This will reduce the power output and the overall efficiency of the internal combustion engine. The engine oil will fill the microscopic irregularities preventing the escape of the combustion chamber gases thereby decreasing the wasted energy from gas leakage. The oil film also provides lubrication between rings and the piston ring grooves, thus allowing the rings to move freely and therefore have continuous contact between the rings and cylinder also helping to seal in the gases [4].
2.1.5 Protection
As the lubrication oil fills in many of the gaps in the moving engine parts, the oil between the engine parts cushion the parts from shock as the combustion charge forces the piston down. This reduces the damage done to these parts so that they last longer [7].
2.1.6 Why does this matter?
Tribological deficiencies cause any national economy a huge amount of money due to the large amount of energy and material loss that occurs simultaneously on virtually every mechanical device in operation. Since a large proportion of the world use motor vehicles [8],and most motor vehicles use the IC engine, each tiny loss on one revolution adds up when the engine has thousands of revolutions per second, and there are so many engines running simultaneously. This adds up to a huge amount of wasted energy. Therefore it is important to optimise the efficiency of IC engines to save money [9].
2.2 Cavitation
2.2.1 What is cavitation?
Cavitation is a very similar phenomenon to boiling. They both represent a phase change process from liquid to gas. However, their thermodynamic paths are different.
- Boiling is caused by a temperature increase at a constant pressure.
- Cavitation is caused by a pressure drop at a constant temperature.
Cavitation is a naturally occurring phenomenon in IC engines, specifically where moving lubricants are present in the higher pressure locations such as that between the interface of the piston ring and the engine liner [10].
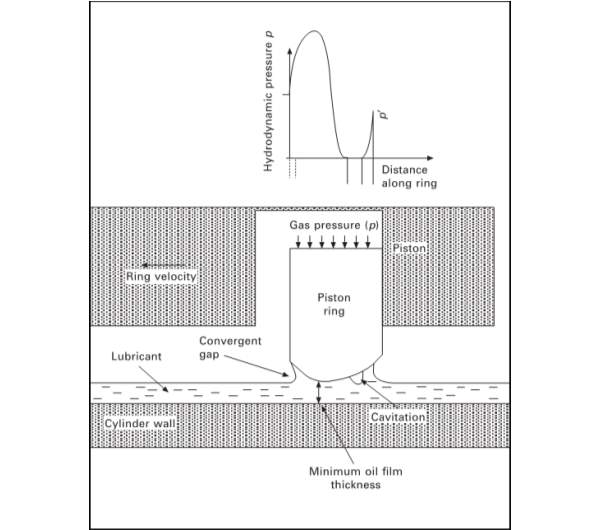
Figure 2.1 Hydrodynamic lubrication of a piston ring [11]
Figure 2.1 shows the hydrodynamic pressure in the lubrication of a piston ring and where cavitation occurs in the piston. Cavitation occurs in the diverging section of the lubricant film in a converging-diverging wedge. As the fluid film tries to occupy the clearance space with increasing volume in the diverging region, the pressure drops below the saturation pressure in the piston ring/liner. As the fluid is unable to sustain large and continuous negative pressure, cavitation occurs [10]. The two main types of cavitation are vapourous cavitation and gaseous cavitation.
- Vaporous Cavitation occurs when the pressure of the liquid lubricant is reduced to its vapour pressure, at which point, evaporation or boiling will follow [10].
- Gaseous Cavitation occurs when the lubricant pressure falls to the saturation pressure, and the dissolved gases are emitted from the solution. Standard mineral oil normally has around 10% by volume of dissolved air – any reduction of pressure below the ambient conditions can encourage suspended bubbles of gas to grow or draw gas into the lubricating film from an external source; this form of gaseous cavitation is called ventilation [10].
2.2.2 Why does cavitation matter?
As the lubricant flows past the top of the piston ring head (where the lubricant film has the minimum thickness), the static pressure in the lubricant falls and causes the dissolved air in the oil to be emitted from the solution and form gas bubbles. As the piston and the piston ring change direction, the static pressure in the lubricant rises and causes the bubbles to collapse or implode. Very large pressures are generated in very small areas as this happens. This causes a violent shock wave to be realised, and these shockwaves hammer the piston ring surface and the liner surface. The resulting bare surfaces are exposed to very high stresses. This causes local corrosion and is effectively drilling small holes into these surfaces [9]. This causes the piston ring and the liner wall to wear out faster and increases the amount of friction that will occur in the piston. This means that engine parts will need to be replaced more often and the efficiency of the engine is decreased. It is important to, therefore, study and try to understand cavitation and work out ways in which to reduce the amount it occurs [12]. This project is trying to expand the research in the effect of piston ring profiles with regards to lubrication and the cavitation phenomenon.
2.3 Piston rings
2.3.1 Piston ring shapes and their functionality in IC engines
One of the ways to improve engine efficiency and reduce mechanical losses arising due to the occurrence of friction at the various interfaces of engine components is to change the surface of the parts that are in contact. Smart surface engineering and effective lubrication at the piston ring and cylinder liner interface can contribute to significant reductions in friction. While changing the piston ring shape might only reduce the friction by a small margin, even the smallest reductions of friction can lead to substantial fuel savings, increase in the engine break horsepower, reduction in lubrication oil consumption, reduction of harmful exhaust emissions and improvement in part durability and the life of the engine [11].
2.3.2 Ring Pack
The piston assembly is in many ways, the heart of the IC engine. It forms the critical link in transforming the energy generated by the combustion of the fuel and air mixture into the desired kinetic energy. The piston rings are dynamic and form the seal between the piston and cylinder wall of a reciprocating IC engines. Normally a piston wall will have several rings which are referred to as a ring pack. Typically, an IC engine for a standard vehicle will have three rings with each ring having different functions[11]:
- The top ring plays a major role in gas sealing and encounters the highest load and temperature. This ring is often known as the compression ring.
- The second ring assists in restricting the upward oil flow in addition to providing secondary gas sealing.
- The third ring provides a way for the excess oil to leave the ring pack area. This ring is often known as the oil control ring.
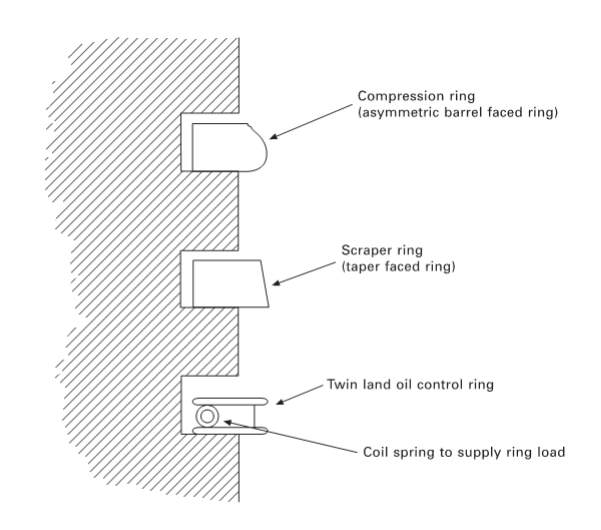
Figure 2.2 A typical ring pack[11]
Each ring has design elements that are characteristics of its function. Compression rings are typically barrel faced and are coated with wear-resistant coatings because they undergo the most pressure and the highest temperatures. Scraper rings are generally taper faced or stepped and are generally coated with the same coatings as the compression rings. Oil control rings have two narrow contact rails which are loaded against the cylinder wall using a spring which is incorporated into the back of the ring [11].
2.3.3 How piston rings work
Piston rings are located in ring grooves on the piston circumference where they are free to rotate, twist and undergo limited axial movement. The first and second rings are loaded against the cylinder wall by gas pressure acting on the back face of the ring, but the third ring is loaded with a coiled spring. For the largest part of the stroke, the pressure is balanced by the hydrodynamic pressure that develops in the lubricant film – this is generated by the lubricant entering a convergent gap between the ring face and cylinder wall.
2.3.4 Piston ring criteria
Ring pack designs must meet a number of criteria. The most obvious of these are that the ring pack must be:
- Effective in sealing
- Wear resistant
- Effective in operation to minimise the contact friction and lubricant shear effects
- Effective in controlling the flow of lubricant to minimise oil consumption
In addition, the ring pack design must also be constantly becoming longer lasting, more efficient and more environmentally friendly. The technical consequences of this are that compression ring designs of the future will probably need to be able to operate under conditions of increasingly higher temperatures and pressure with thinner hydrodynamic films while also being made of increasingly limited engineering materials as environmentally damaging materials such as chromium and phosphate are being removed from the manufacturing process [11].
2.3.5 Lubricant flow around a ring pack
The flow of a lubricant around a ring pack is very important to study. The oil lubricating the piston rings can either flow around the ring pack and return to the sump, or it can leave the engine via the exhaust gas [11]. The oil that is returned to the sump is degraded by three factors.
Firstly the exposure to heat causes the oil to degrade by chemical breakdown [13]. Secondly, the exposure to oxygen causes the oil to oxidate. Finally, the high-speed repetitive movement of the oil causes molecules to break by the shearing between two moving parts in close contact [14].
The oil that leaves the engine through the exhaust gases are an undesirable emission because it both reduces the sump volume and it contributes to pollution. The faster the oil degrades, the faster the oil will have to be replaced via vehicle servicing. This is an inconvenience as it wastes both time and money and is bad for the environment. It is, therefore, important to try to minimise the oil degradation through both understanding the chemical compounds that make up engine oil and to understand how the oil flows in IC engine ring packs [11].
Over the years, engineers have been improving the understanding of oil flow in the IC engine ring packs through experimental investigation. This has proved to be difficult as the lubricant film gap is so thin (often ranging from 2-10 μm) and the change in static pressure in the lubricant happens so quickly it is difficult to measure. Even at a slow engine revolution speed of 300 RPM, each full revolution would take only 0.2s. In order to take an accurate reading of the internal pressure over this time frame, many readings would have to be taken in that time frame [3].
2.3.6 The different types of piston rings
| Barrel faced ring A barrel faced compression ring is a piston ring that has a curved running surface to provide consistent lubrication of the piston ring and cylinder wall. This also provides a wedge effect to optimise oil distribution throughout the full stroke of the piston. In addition, the curved running surface reduces the possibility of an oil film breakdown due to excess pressure at the ring edge of excessive piston tilt during operation [15]. |
|
| Rectangular ring This has a rectangular cross section. This ring has a geometrically simple shape and performs the standard sealing functions under normal operating conditions. The rectangular ring is used mainly in the top groove in gasoline and diesel engines [17]. |
|
| Taper faced ring This ring has a tapered running face. The Taper faced ring contacts the cylinder bore with its bottom outer edge. This shortens running in and improves oil scraping. The gas forces acting on the running face provide a degree of pressure relief. This ring is typically installed in the second groove in gasoline and diesel engines [17]. |
|
| Internally bevelled or stepped ring This ring provides edge relief on the top side of the rectangular and taper faced rings. Because of this edge relief, a twist effect is achieved which brings the ring into contact with the bore with its bottom outer edge while the inner edge contacts the bottom groove side. This is known as positive twist. This helps improve oil consumption control. These rings are used in the top and second groove of gasoline and diesel engines [17]. |
|
| Taper faced ring with inside bottom bevel or step This shaped ring produces edge relief with negative twist. I.E, in the opposite direction to a ring with the relief on the top side. The taper must be larger on a taper faced ring without twist or with positive twist so that the top outer edge is prevented from contacting the cylinder wall. The effect of the negative twist is to make the ring contact the groove and create a seal with its outer bottom side and its inner top side. This type of ring is installed in the second groove in gasoline and diesel engines [17]. |
|
| Keystone ring This ring is a compression ring with a wedge cross section. With its tapered sides, radial movement of the ring in engine operation will cause the axial clearance in the groove to increase and decrease. This greatly reduces ring sticking as the ring will continuously work its way free of the combustion residues. The keystone ring is used in the top groove in diesel engines where ring sticking must be expected [17]. |
|
| Half keystone ring This ring is a compression ring with only the top side tapered. Like the keystone ring, the tapered side causes axial clearance to vary as the ring moves radially and thus reduces ring sticking. Owing to its asymmetrical cross-section, the ring has positive twist when installed. A half keystone ring is used in the top groove of diesel engines when a rectangular ring is no longer adequate to stop ring sticking, but a keystone ring is not yet required [17]. |
|
| L-shaped compression ring This ring is mainly used in small 2-stroke gasoline engines as a ‘headland’ ring. Combustion pressure pushes the L-shaped ring against the cylinder wall and bottom of the ring groove. Gas pressure acts on the vertical arm causing the L- shaped ring to seal when in contact with the top side of the piston groove [17]. |
|
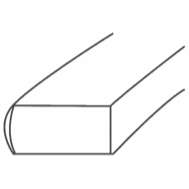 Figure 2.3 Barrel faced ring [16]
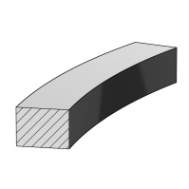 Figure 2.4 Rectangular ring [17]
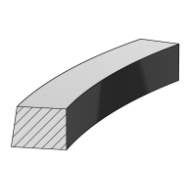 Figure 2.5 Taper faced ring [17]
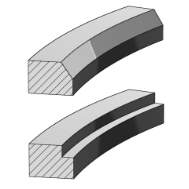 Figure 2.6 Internally bevelled or stepped ring [17]
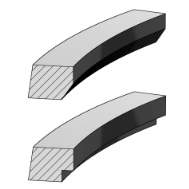 Figure 2.7 Taper faced ring with inside bottom bevel or step [17]
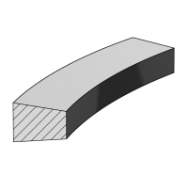 Figure 2.8 Keystone ring [17]
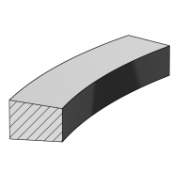 Figure 2.9 Half keystone ring [17]
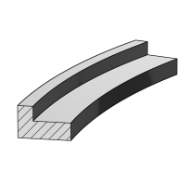 Figure 2.10 L-shaped compression ring [17]
Table 2.1 Table showing the different types of piston rings
2.4 Experimental results
This chapter will talk about the results of the experiment done in Oil Transport in Piston Ring Assemblies [3].
2.4.1 Maximum pressure
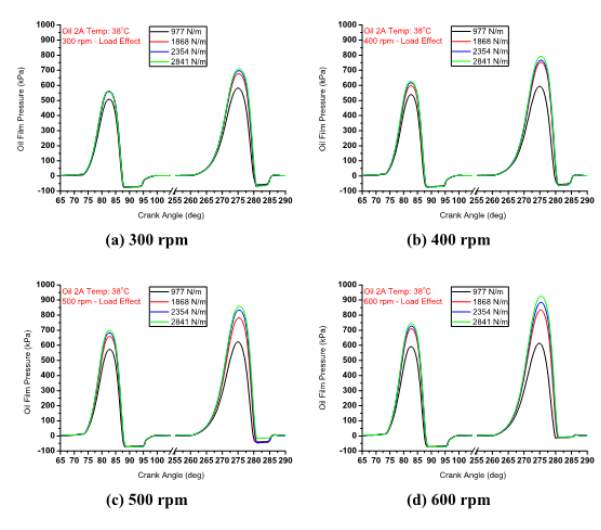
Figure 2.11 Example experimental results comparing the variation of oil film pressure at different loads and velocity profiles [3]
Four different loads were tested against four different engine RPMs to get a total of sixteen results comparing the variation of the pressure in the oil film at different loads and velocity profiles. Figure 2.11 was used to determine the oil film pressure at different loads and velocity profiles. This pressure is then compared to the pressure taken from the simulation in ANSYS Fluent. In figure 2.11, the first peak in the graph is the maximum pressure during the downstroke of the experiment described in Oil Transport in Piston Ring Assemblies. The second peak is the maximum pressure during the upstroke of the experiment. The negative pressure on the graph is where the cavitation occurs [3].
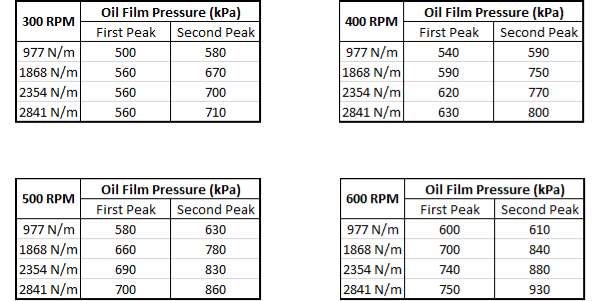
Table 2.2 results extrapolated from the graphs in figure 2.11
Table 2.2 shows the results that were extrapolated from the graphs in figure 2.11. Each table shows that the second peak is often higher than the first peak. This is possibly due to the oil film build up during the downstroke meaning that for the upstroke, the oil film is thicker. This is seen in figure 2.13. As the load increases, the maximum pressure is also increased. This is to be expected as pressure is force/area. Therefore with the area being constant and the force increasing, the pressure should increase too.
2.4.2 Oil film thickness
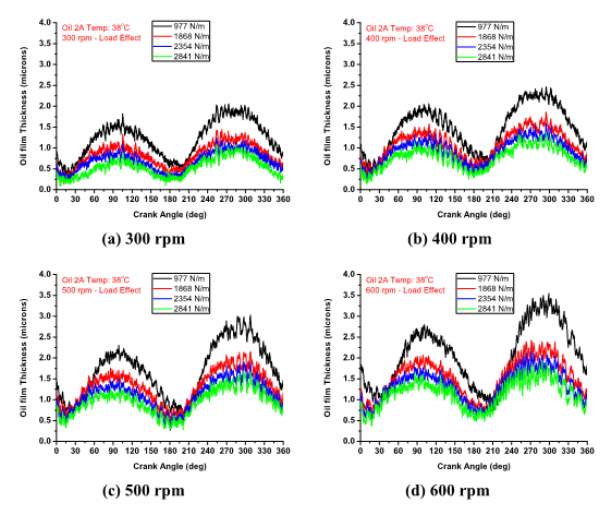
Figure 2.12 Example experimental results comparing the variation of oil film thickness at different loads and velocity profiles [3]
Four different loads were tested against four different engine RPMs to get a total of sixteen results comparing the variation of the oil film thickness at different loads and velocity profiles. Figure 2.13 was used to determine the oil film thickness at different loads and velocity profiles. The oil film thickness is then used to create the geometry before running it through the simulation in ANSYS Fluent. In figure 2.12, the first peak in the graph is the oil film thickness during the downstroke of the experiment described in Oil Transport in Piston Ring Assemblies. The second peak is the maximum pressure during the upstroke of the experiment [3]. Table 2.3 shows the results that were extrapolated from the graphs in figure 2.12. Each table shows that the second peak is often higher than the first peak. This is possibly due to the oil film being built up due to the motion of the downstroke. As the load increases, the oil film thickness decreases.
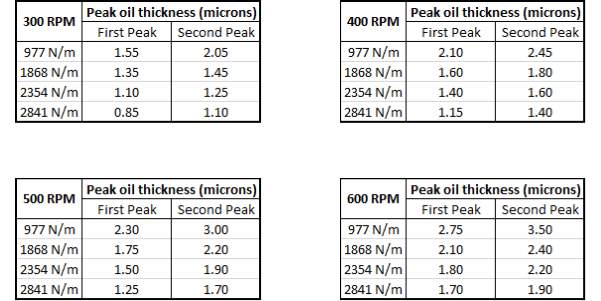
Table 2.3 results extrapolated from the graphs in figure 2.13
2.5 Density of Oil
The density of the oil was not given in the experiment. However, the SAE Grade was given as 5w-40. In order to find the approximate density of the oil used in the experiment, fifteen different oils with the same SAE Grade as the one used in the experiment were compared.
| Product | Density @15oC (kg/m3) | Density @38oC (kg/m3) |
| Shell Helix Ultra 5W-40 [18] | 851 | 834 |
| Tetrosyl 5W-40 Fully Synthetic Oil [19] | - | - |
| Mobil Delvac 1 5W-40 [20] | 854 | 837 |
| ENEOS 5W-40 Fully Synthetic Motor Oil [21] | 856 | 839 |
| Total Quartz 9000 5W-40 [22] | 854 | 837 |
| Mobil Synt S 5W-40 [23] | - | - |
| Mobil Super 3000 X1 5W-40 [24] | 855 | 838 |
| Shell Rotella T6 5W-40 [25] | 858 | 842 |
| Pento High-Performance II TW-40 [26] | 850 | 833 |
| Liquimoly Synthoil High Tech 5W-40 [27] | 850 | 833 |
| Royal Purple API-Licensed Motor Oil [28] | - | - |
| Castrol Edge Turbo Diesel 5W-40 [29] | 850 | 833 |
| Castrol GTD Magnatec 5W-40 [30] | 853 | 836 |
| Castrol Magnatec Professional A3 5W-40 [31] | 105 | - |
| Castrol Magnatec Professional B4 5W-40 [32] | 848 | 831 |
Table 2.4 collected data for different 5w-40 engine oils
The mean oil density at 38oC (the temperature of the experiment) is 836 kg/m3.
Chapter 3: Theory
3.1 Validation test
A validation test must be done to achieve the goal of finding out whether ANSYS Fluent is able to accurately simulate the conditions between the piston ring head and cylinder liner using the method described in chapter 4. This means setting up an existing profile that has been experimented on physically, running the CFD software analysis on the profile, and comparing the experimental results with the computational results. If the results are extremely similar, it is possible for CFD to simulate other profiles using similar CFD set-ups. The experimental results that are used in this project are the ones found in Oil Transport in Piston Ring Assemblies [3].
3.2 CFD software used
The CFD software that are used in this project are:
- ANSYS ICEM CFD
- ANSYS Fluent
ANSYS ICEM CFD is a popular software package used for CAD and mesh generation [33]. ANSYS Fluent is a popular software that contains the physical modelling capabilities required to model flow, turbulence, heat transfer and reactions for industrial applications [34]. ANSYS ICEM CFD is used to draw the geometry of the piston ring profile and set up the meshing. The reason meshing is required is that the mesh splits the geometry of the profile into many different nodes and then it is possible to apply fluid mathematics to each individual node making the simulations far more accurate. ANSYS Fluent is then used on the mesh created in ICEM CFD to model the physical fluid flow. It can be used to calculate many different properties such as the pressure at any given point in the flow. Using both these software, graphs can be obtained and compared to the ones as found in Oil Transport in Piston Ring Assemblies to see if the results can be validated.
3.3 Geometry
3.3.1 Geometry of experiment
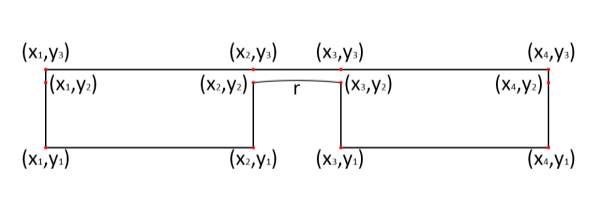
Figure 3.1 The co-ordinate system used for mapping the geometry in ICEM CFD
Figure 3.1 shows the coordinate system used for mapping the geometry in ICEM CFD. Each coordinate unit is 1mm.
3.3.2 Max height of the geometry (ICEM CFD)
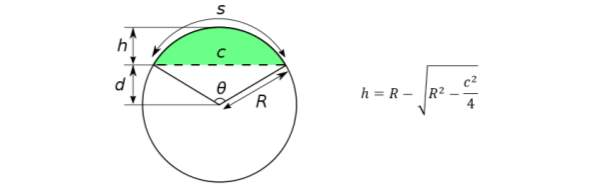
Figure 3.2 The circular segment equation used to work out the maximum height of the geometry [35]
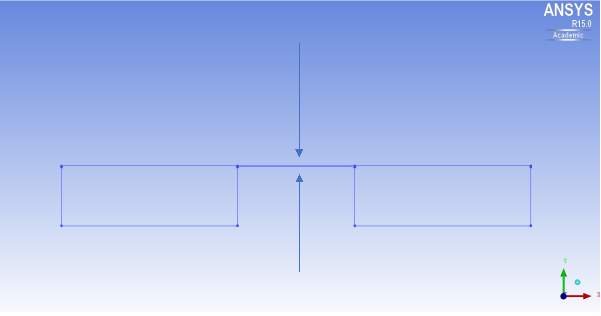
Figure 3.3 The geometry set up in ICEM CFD
In order to set the film thickness in ICEM CFD, the geometry is drawn with top wall being a certain distance from the peak of the piston ring profile as seen in figure 3.3. Since the radius of the ring is known, it is possible to work out the max height of the geometry using the circular segment equation shown in figure 3.2. The maximum height of the geometry can then be said to be h + oil film thickness.
3.4 Velocity of the wall (Fluent)
The velocity of the wall in Fluent is linear (m/s) but the velocity stated in the experiment is in RPM, so it needs to be converted. The equation for converting RPM to the angular velocity is: ω=2π∙RPM60 Where: ω is the angular velocity (rad/s) The equation for the displacement of the liner is: s=stroke2sinωt Where: stroke is the length of the engine stroke t is the time (s) Differentiating the equation for displacement gives the equation for velocity (the rate of change of position) u=ddtstroke2sinωt=stroke2.ωcosωt Where: u is the velocity In the experiment, the stroke is set at 0.022mm [3].
3.5 Viscosity of oil
The viscosity of the oil used in the experiment is given at 40oC and 100oC but not 38oC which is the temperature of the oil during the experiment. The viscosity of the oil was calculated for 38oC using the kinematic viscosity extrapolation according to ASTM D341 [36].
Chapter 4: Method
4.1 Experimental specimen ring profile
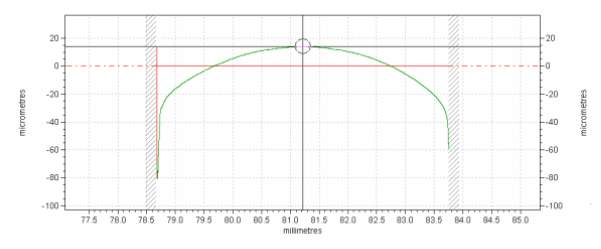
Figure 4.1 Experimental specimen ring profile
As shown in figure 4.1, the experimental specimen ring profile has a radius of 80mm and a width of 5mm. 
Table 4.1 Tested Oil Properties [3]
Table 4.1 shows the oil properties from the experiment. Using these numbers for viscosity and the theory covered in chapter 3.5, the calculated viscosity at 38oC was calculated to be 106.715 cSt.
4.2 Setting up the geometry on ICEM CFD
The version of ICEM CFD used to set up the geometry is 15.0. This chapter will go through the steps taken to create the experimental geometry on ICEM CFD.
4.2.1 Create Point
The first thing that needs to be done in ICEM CFD is to add the coordinates of the points. To do this, the geometry tab was selected and create point was selected with the coordinates entered.

Figure 4.2 The co-ordinates for the experiment for ICEM CFD
This is so that the geometry can be drawn. The coordinates for the geometry is shown in chapter 3.3.1. In order to do the curve for the piston ring, an extra centre point was created as a reference zone at x = 10 y = 0. This is essential so that ICEM CFD can recognise where the middle of the arc should be. Figure 4.3 shows the points when all the coordinates are mapped out onto ICEM CFD.
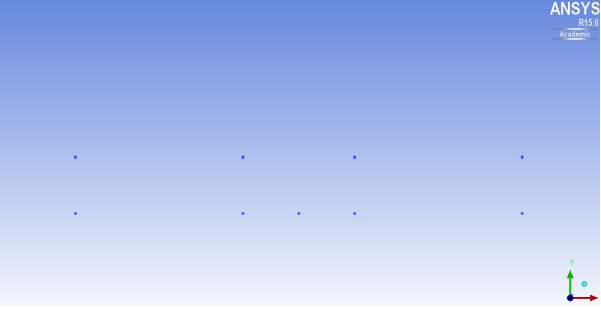
Figure 4.3 The co-ordinates of the geometry mapped out onto ICEM CFD
4.2.2 Create/Modify Curve
The next step done was to create/modify curves. To do this, the geometry tab was selected and create/modify curve was selected. First, the arc was created by using the method centre and 2 points. The ‘Keep’ selection was changed to ‘Start/End’. This is to ensure that the arc created would keep the radius at 80 and not allow the reference centre point to change the radius of the piston ring. The next step was to create the rest of the curves. Straight curves were drawn between the other points to look like the geometry in figure 3.1.
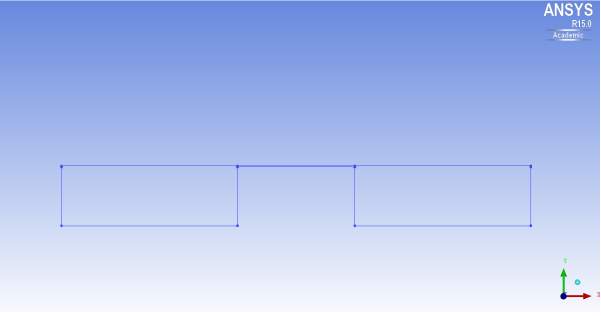
Figure 4.4 The mapped geometry after the curves had been added
Figure 4.4 shows the geometry after all the curves had been added.
4.2.3 Create Block
The next step done was to create the block. The block is required to help ICEM CFD know where the mesh is to be created. The block was created by selecting the blocking tab and selecting the create block tool. The block was created to be 2D planar as the geometry that would be run through the simulation is in two dimensions. After the block is created, it needs to be refined. This is done by splitting the block into the shape of the geometry. The block gets split into six blocks, and the central bottom block is deleted as it is not required for the mesh. The edges of the blocks are then associated to their respective curves. After that, the vertices are associated with their respective points. This is so the block, and the geometry is the same.
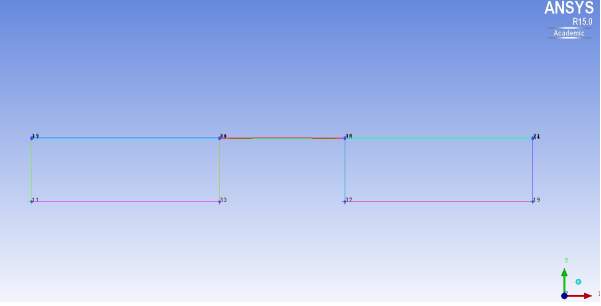
Figure 4.5 shows the completed block
Figure 4.5 shows what the geometry looks like with the completed block associated fully with the curves drawn originally.
4.2.4 O-Grid
The next step is to add O-Gridding. Since the piston ring is a curve, in order to get a high-quality mesh on ICEM CFD, an O-Grid needs to be added to the blocks above and below the curve, In order to do this, VORFN is selected as visible and the blocks above and below are added as O-Grids using the O-Grid tool in the blocking tab.
4.2.5 Create Parts
The next thing that needs to be done is to label the parts on ICEM CFD. This is so that when the mesh created in ICEM CFD is imported to Fluent to run the simulation, Fluent can recognise the parts for what they are. For example, the walls need to be recognised as walls, the pressure inlets need to be recognised as pressure inlets, and the pressure outlets need to be recognised as pressure outlets. Figure 4.6 shows which part of the geometry is labelled as which part. Since it is a simulation the lubricant flow between a piston ring and cylinder liner, there is no pressure inlet, just two pressure outlets depending on the direction of the movement. 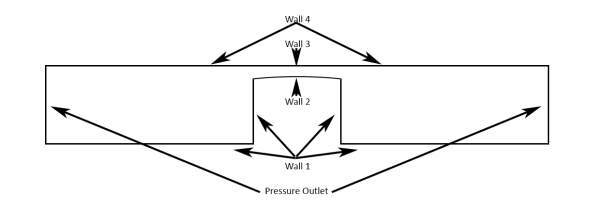
Figure 4.6 shows the part labels for the geometry
4.2.6 Create Mesh
The final and longest step in ICEM CFD is to create the mesh. To do so, the curve mesh parameters is selected from the meshing tab, the entire geometry is selected, and a maximum size of 0.05 per node is added to create an initial mesh. Pre-Mesh Params is then selected from the meshing tab; the entire thing is recalculated so that the pre-mesh can be shown. After ICEM CFD creates the initial mesh, it looks like figure 4.7.
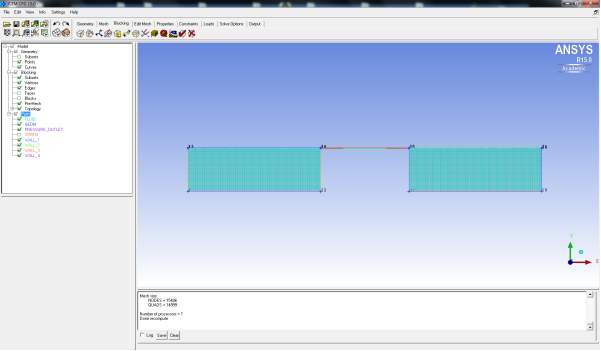
Figure 4.7 shows the initial mesh created in ICEM CFD
The initial mesh created has an even spread of nodes and has a total of 15,000 nodes. This will not be that useful because, in the regions between the piston ring head and the cylinder liner, the lubrication flow is a lot more ‘high activity’. This means the calculations need to be more accurate near these zones. The zones where the lubrication is barely flowing (when you get as far away from the cylinder liner), are known as ‘low activity’ regions. This means it will need to have fewer nodes. The more nodes the overall mesh has, the more accurate the simulation will be, but the calculations will take longer. Under the blocking tab, the mesh quality can be checked. Figure 4.8 shows the quality of the mesh. Over 99.7% of the mesh was found to be in the top quality region.

Figure 4.8 shows the quality of the mesh
In order to ensure that the high activity regions had a higher density of nodes, each edge was individually selected, and the nodes were added, and the mesh law was changed. After this had been done, the quality was checked again.
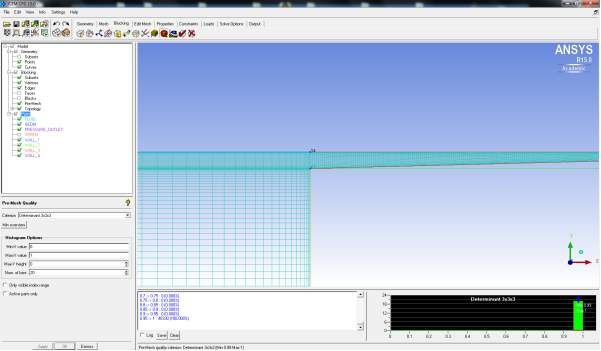
Figure 4.9 shows the concentration of nodes in the ‘high activity’ region
Figure 4.9 shows that the new mesh has 48,330 nodes and 100% of them are in the 0.95->1 quality region which is the top quality region in ICEM CFD.
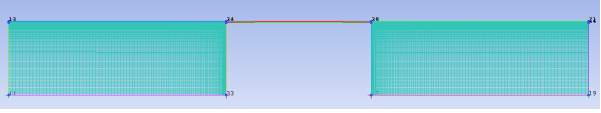
Figure 4.10 shows the final mesh created in ICEM CFD
4.3 Setting up the simulation in Fluent
The mesh generated in ANSYS ICEM CFD is now imported into ANSYS Fluent to run the simulation. The version of Fluent used was R17.2 with an Academic license.

Figure 4.11 The mesh after its imported in Fluent
4.3.1 General
The first thing that is done is changing the scale. Fluent automatically sets the scale to m. Under the general tab, mesh and scale, the mesh is changed to be in mm. The solver is set to pressure-based, time set to steady, 2D space set to planar and velocity formulation set to absolute. The reason time is set to steady is the simulation is only set up for the wall to move in one direction once.
4.3.2 Models
The second thing that is done is setting the multiphase model to on. The multiphase model is set to mixture with two Eulerian phases and the slip velocity set to off.
4.3.3 Materials
The third thing that is done is adding the correct materials. Since the kind of cavitation that occurs between the piston ring and cylinder liner is gaseous cavitation, two materials need to be there; air and engine oil. To create engine oil, click create, search the Fluent database for engine oil and copy it. The properties then need to be edited. The density set to 836 kg/m3 as stated in chapter 2.5. The Viscosity set to 0.106715 kg/m.s as stated in chapter 3.5.
4.3.4 Phases
The next thing that is done is to change the phases. Phase 1 is set to oil, and phase 2 is set to air. Then the interaction between them needs to be set. The number of mass transfer mechanisms is set to 1, from phase oil to phase air using the mechanism cavitation. The vaporisation pressure of engine oil is so low that it is set to 0 here.
4.3.5 Boundary Conditions
As wall 3 and 4 are moving walls, the boundary condition needs to be set. Using the equation in chapter 3.4, at 500RPM the velocity of wall 3 and 4 is set to 0.576 m/s.
4.3.6 Solution Methods
The solution Methods scheme is set to SIMPLE. The gradient is left at Least Squares Cell-Based and the pressure at PRESTO! to allow for the calculation to still be reasonably quick. The momentum is set to second order upwind and volume fraction to quick to allow for a more accurate calculation.
4.3.7 Monitors
The equations residual absolute criteria is set to 1 x 10⁻⁶ so that the solution will only converge at a more accurate reading.
4.3.8 Solution Initialization
The solution initialization is set to hybrid, and then the solution is initialized. After hybrid initialization is done, the calculation is run.
4.3.9 Run Calculation
The calculation is run for 100 iterations (Figure 4.12 shows that the solution converges after around 50 iterations).
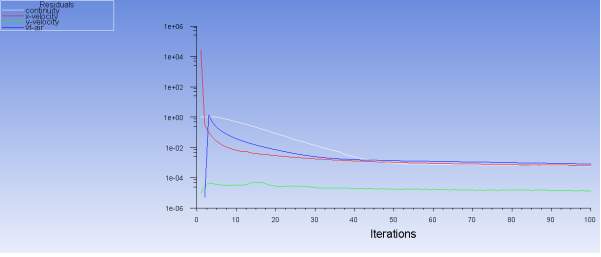
Figure 4.12 The calculation run for 100 iterations
4.3.10 Contours
By setting up contours, the internal pressure can be seen in the geometry.
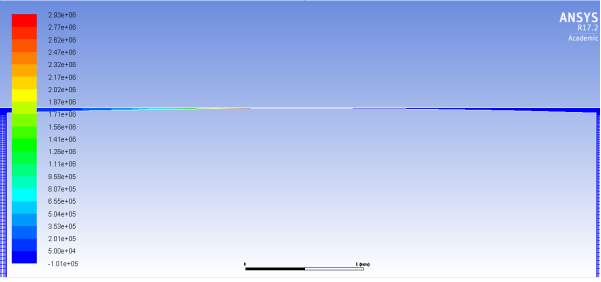
Figure 4.13 The contours between the piston ring and cylinder liner
Figure 4.13 shows that as the lubricant flows towards the thinnest gap between the piston ring and cylinder liner, the pressure in the lubricant builds up and dissipates straight after the thinnest point. Figure 4.14 offers a more zoomed in picture of this region.
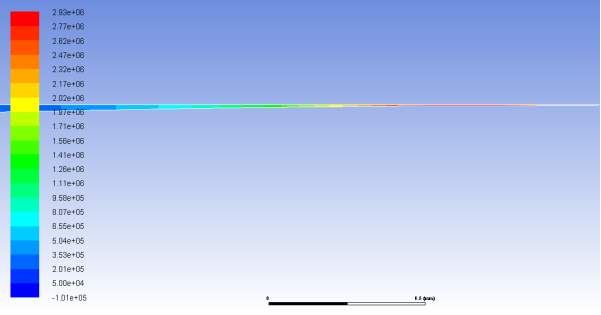
Figure 4.14 A zoomed in picture of the contours between the piston ring and cylinder liner
4.3.11 Static pressure graph
The static pressure against position graph can be drawn by taking a plot of the static pressure along wall 2 (the lubricant between the piston ring and cylinder liner)
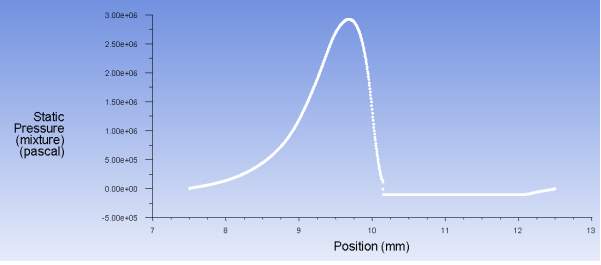
Figure 4.15 The static pressure graph along wall 2
Figure 4.15 shows a similar shape to the graph in figure 2.11. Comparing the graph with the contours, the max pressure is where it is expected. Also, the region of negative pressure where cavitation occurs is where it was expected.
4.3.12 Reports
Using the report tool on Fluent, the maximum pressure and the surface integral is calculated. This gives the values that are compared to the experimental results.
Chapter 5: Results and Discussion
5.1 Experimental results vs. CFD results
The difference between the experiment and Fluent is in the experiment, a force was exerted, and the oil film was measured whereas in Fluent the oil film thickness is set and the force is measured.
The results are taken from the experiment in Oil Transport in Piston Ring assemblies and the results measured from the initial test in Fluent is:

Table 5.1 Experimental results vs CFD results
Table 5.1 shows a huge difference in Force exerted and maximum pressure. The maximum pressure seen in CFD is over 4.6 times larger than the maximum pressure measured in the experiment with the force being over 2.7 times larger in CFD than that measured in the experiment. In order to see why this was the case, more data had to be collected. Table 5.2 shows that not all the experimental results followed the trend expected. The highest engine speed did not yield the maximum static pressure. However, table 5.3 shows that for every velocity profile, the CFD yielded far higher maximum pressures and forces than the experimental.

Table 5.2 Experimental results for all engine speeds

Table 5.3 CFD results for all engine velocities
5.2 Changing the film thickness in CFD
To see whether it is possible if the experiment measured the film thickness incorrectly, several more profiles were set up in CFD comparing the different film thicknesses. Table 5.4 compared to table 5.3 shows a huge increase in max pressure and force exerted with a film thickness decrease of only 1μm. This was expected as with the same amount of lubricant having to flow through a smaller gap; the pressure increases. The max pressure still follows the trend of increasing with the engine speed increase. The force also follows this trend. To attempt to get results closer to the experiment, the oil film thickness was increased to 5μm and then to 10μm.

Table 5.4 CFD results for all engine velocities and an oil film thickness of 2μm

Table 5.5 CFD results for all engine velocities and an oil film thickness of 5μm
Table 5.4 compared to table 5.5 shows a huge decrease in max pressure and force exerted with a film thickness increase to 5μm. However, these values are still larger than the values shown in the experiment.

Table 5.6 CFD results for all engine velocities and an oil film thickness of 10μm
Table 5.6 compared to table 5.5 shows a massive reduction in max pressure and force exerted. With the film thickness at 10μm, the CFD results show the pressure and force exerted to be lower than that found in the experiment.
5.3 Changing the Viscosity
To so whether the experiment was conducted at a temperature that was measured incorrectly, a test was done on CFD to see the effect of changing the temperature to 70oC and changing the viscosity accordingly.
Comparing table 5.7 to table 5.3, the results are vastly different. The max pressure at 70oC is much lower than the max pressure at 38oC. The forces are also much lower at 70oC than at 38oC.

Table 5.7 CFD results for all engine velocities and viscosity set to 0.03286 kg/m.s at 70oC
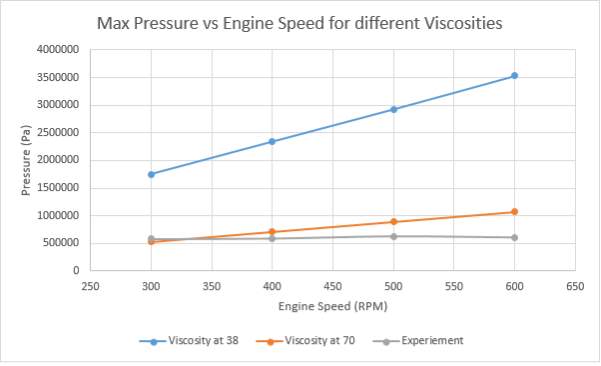
Figure 5.1 is a graph showing the max pressure vs engine speed for different viscosities
Figure 5.1 shows the pressure difference between the viscosity at 38oC and the viscosity at 70oC. The CFD results for the viscosity at 70oC overlap with the experimental results. Looking at figure 5.2, the force at 70oC is vastly different from the force at 38oC. The force at 70oC is much closer to the force shown in the experiment. However this time there is no overlap. This could suggest that the temperature measurement in the experiment was inaccurate or that the viscosity of the oil tested was incorrect.
5.4 CFD Trends
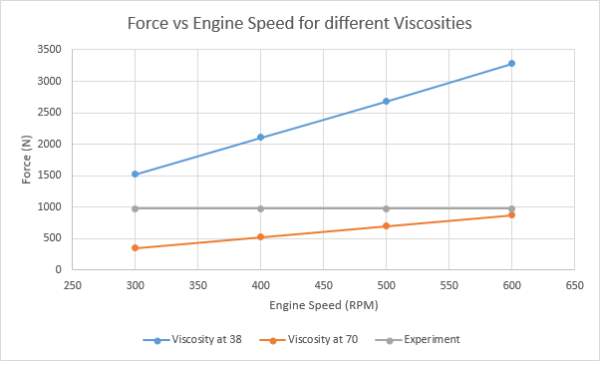
Figure 5.2 is a graph showing the force vs engine speed for different viscosities
In order to see whether the trends shown in the CFD tests were what was expected, a few graphs are plotted to have an easier visualisation than the tables.
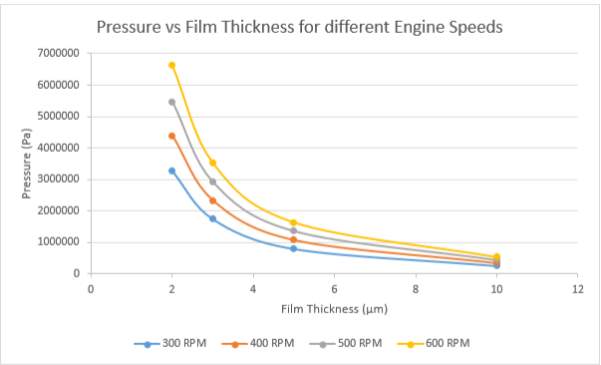
Figure 5.3 is a graph showing the pressure vs film thickness for different engine speeds
Figure 5.3 shows that the pressure falls with the increase of film thickness for all engine speeds. It also shows that the slower the engine, the lower the maximum pressure. Both these trends are expected. The faster a fluid is flowing, the higher the pressure. The wider the gap in which a fluid can flow, the fewer collisions between the fluid particles and therefore the lower the pressure.
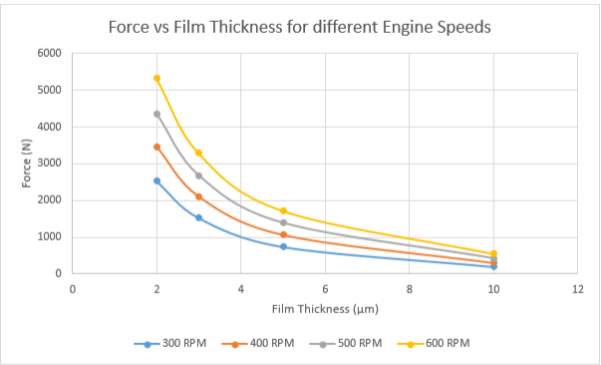
Figure 5.4 is a graph showing the load vs film thickness for different engine speeds
Figure 5.4 shows that the force exerted falls with the increase of film thickness for all engine speeds. It also shows that the faster the engine speed, the higher the force exerted. Both these trends are expected. The higher, the faster a fluid is flowing, the higher the pressure. Since the area is the same, the force exerted is also higher. The wider the gap in which a fluid can flow, the fewer collisions between the fluid particles and therefore the lower the pressure. Since the area is the same, the force exerted is also lower. Figures 5.5 and 5.6 shows this relationship from a different angle. Figures 5.3, 5.4, 5.5 and 5.6 all show that the CFD is consistent with its results. With all the engine speeds and film thicknesses showing the same trends just with different max pressures and the force exerted. With the CFD showing the trends that are expected, with a piston profile change, the trends can be analysed accurately even if the exact numbers are incorrect.
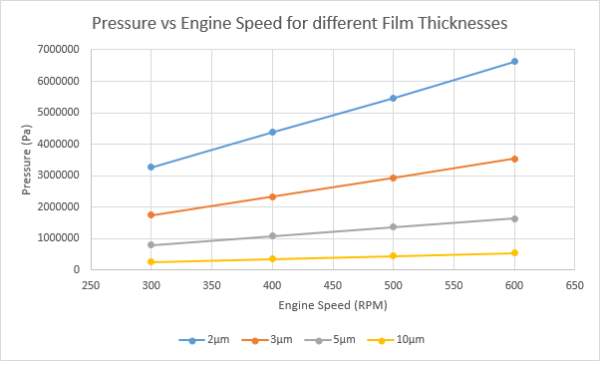
Figure 5.5 is a graph showing the pressure vs engine speed for different film thicknesses
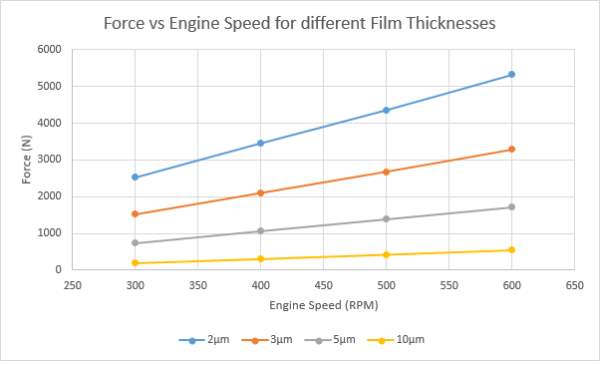
Figure 5.6 is a graph showing the force vs engine speed for different film thicknesses
5.5 Experimental vs. CFD discussion
The CFD results show the trends that are expected whereas some of the experimental results have not shown the same trends. Table 5.2 shows a lower max pressure for a higher engine speed. The reasons for this could either be that the load was not as high as expected, the viscosity was lower than measured (or temperature was higher) or that the pressure readings were not correct. It is possible that with the experimental setup, the joint could have exerted a reverse moment meaning that the actual load exerted was lower than expected.

Figure 5.7 is a line diagram of the reverse moment
It is possible that with the friction of the engine moving, the lubricant was heated up to a temperature higher than originally measured meaning that the viscosity was lower. It is also possible that the step measurement technique for reading pressure was not set to low enough step divisions in order to accurately measure the internal pressure at all points. Figure 5.8 shows that if the steps are not set to a small enough time frame, it is possible to create false peaks that are far lower than expected.
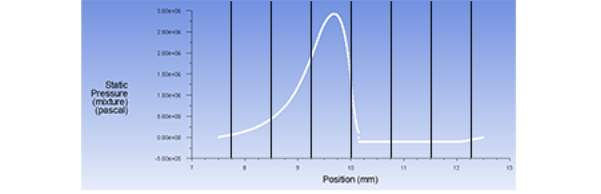
Figure 5.8 shows step measuring of a pressure graph
5.6 New Piston Ring Profiles in CFD
This chapter will talk about the results obtained in CFD for two new piston ring profiles. The radius of the experimental and the initial test in CFD was 80mm. In order to see the difference changing this radius would make, two new piston ring profiles were set up. One for a radius of 75mm and one for a radius of 85mm. Decreasing the radius of the profile means that the top of the piston ring is rounder with a higher peak. Increasing the radius of the profile means that the top of the piston ring is flatter. The film thickness for both of these tests is set to 3μm, the same as the original validation test.

Table 5.8 shows the results obtained for a radius of 75mm in CFD

Table 5.9 shows the results obtained for a radius of 85mm in CFD
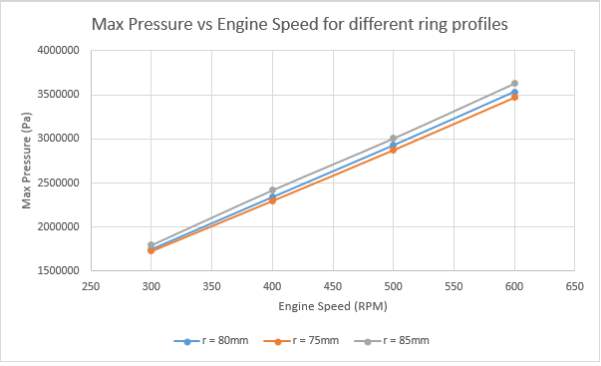
Figure 5.9 is a graph showing the max pressure vs engine speed for the different ring profiles
Looking at figure 5.9, the change in radius only causes a slight change in the maximum pressure. This is expected as the radius being so large (75-85mm) in comparison to the width of the piston ring (5mm), the change in radius only causes a slight change in the height of the ring. Since the oil film thickness is set to the same (3μm), the only change is the roundness of the ring. The higher the radius, the flatter the ring and the higher the maximum pressure. This is due to the smaller change in oil film thickness at the beginning of the ring to the peak of the ring. This means an overall larger flow of lubricant which causes the higher pressure.
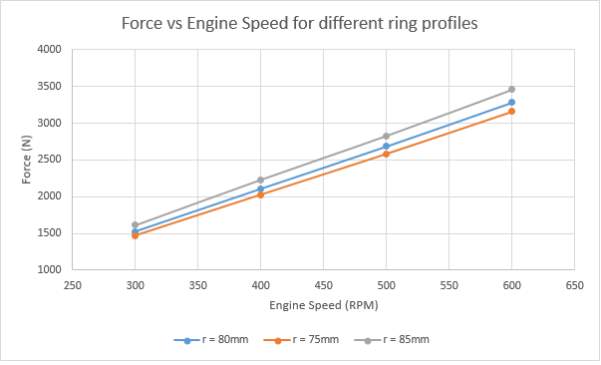
Figure 5.10 is a graph showing the force vs engine speed for the different ring profiles
Looking at figure 5.10, the change in radius only causes a slight change in the force exerted. The trend is the same as the maximum pressure. The CFD results show that the slight change in piston ring profile does indeed change the results obtained but not as much as changing the oil film thickness and changing the viscosity. All the radii have the same trend showing that the change in radius does not have any unexpected consequences.
Chapter 6: Conclusions
6.1 Achievements and Highlights
The objectives set for this project were fairly successfully met. Using ICEM CFD and Fluent, I was able to somewhat successfully model the geometry between a piston ring and cylinder liner. While the results were not as close to the experimental data as I hoped, it is possible that it is the experimental data that isn’t quite as accurate as it could be. Using Fluent, I managed to see the difference changing the piston ring profile has on the pressure in the lubricant between the piston ring and cylinder liner. The highlight of this project was getting to know the software’s ICEM CFD and Fluent. Being able to see and appreciate the complexity of fluid modelling even though I was only working in two dimensions.
6.2 Progress to plan
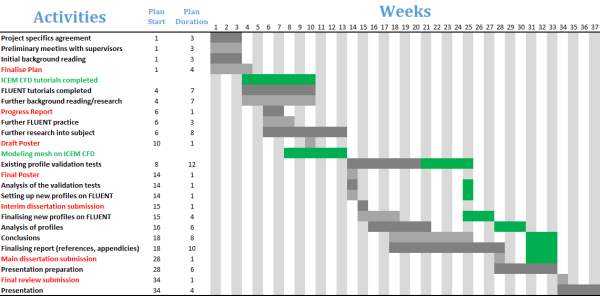
Figure 6.1 Gantt chart modified – plans vs actual progress
My actual progress was close to my original plan. Unfortunately, there were some extra things that I did not plan for. The big difference was learning the software ICEM CFD. I thought at the start that I would be creating a model in SolidWorks – a software that I am already familiar with and confident using. However after the project started, I was advised to use ICEM CFD to great the geometry and mesh because it is easier get a great mesh there and then import that into Fluent. This caused a delay for my validation tests and anything software related afterwards. As ICEM CFD is a software that is not available for use at home, I had to be in the university computer rooms to learn it which increased the time taken to become familiar with it. This can be seen in figure 6.1 the green text and green highlights show the actual progress. The grey shows the plan. It shows that I kept pretty close to the plan. When it comes to background reading or research, it was all to plan. The difference was all in ICEM CFD.
6.3 Learning Outcomes
The learning outcomes as outlined in the project description are:
- Gain general knowledge on lubrication in internal combustion engines with focus on lubrication between pistons rings and engine liner
- To gain practical skills of using commercial CFD software
- Assess the possibility of using commercial software to study engine lubrication
I think that I satisfied learning outcome 1 through all the background reading shown in the literature review in Chapter 2 of this report. I think that I satisfied learning outcome 2 through the amount of time spent on ANSYS ICEM CFD and ANSYS Fluent. I am confident that I can use these two software to create a 2D mesh and analyse the flow in it. I think that I satisfied learning outcome 3 by the comparisons made in Chapter 5 of this report. I think it is possible to use commercial software to study engine lubrication if the user of the software is good enough at the software and has a good enough understanding of what it is they are trying to study.
6.4 Metrics
The lessons to learn that would benefit future students:
- Space out the background reading, a little every day will make it much more manageable. The subject is quite interesting, and so it will not feel like too much work.
- When it comes to learning software, practice makes perfect. Don’t just read the manual, actually sit on the software and play around with it for a few hours – you will feel a lot more confident on it after a while.
6.5 Conclusion
Overall I think it is possible to use CFD to study engine lubrication. I think that if it was possible to spend more time on Fluent, a UDF could have been set up a transient case and see if that was more accurate than a steady laminar case.
List of Figures
Figure 2.1 Hydrodynamic lubrication of a piston ring
Figure 2.2 A typical ring pack
Figure 2.3 Barrel faced ring
Figure 2.4 Rectangular ring
Figure 2.5 Taper faced ring
Figure 2.6 Internally bevelled or stepped ring
Figure 2.7 Taper faced ring with inside bottom bevel or step
Figure 2.8 Keystone ring
Figure 2.9 Half keystone ring
Figure 2.10 L-shaped compression ring
Figure 2.11 Example experimental results comparing the variation of oil film pressure at different loads and velocity profiles
Figure 2.12 Example experimental results comparing the variation of oil film thickness at different loads and velocity profiles
Figure 3.1 The co-ordinate system used for mapping the geometry in ICEM CFD
Figure 3.2 The circular segment equation used to work out the maximum height of the geometry
Figure 3.3 The geometry set up in ICEM CFD
Figure 4.1 Experimental specimen ring profile
Figure 4.2 The co-ordinates for the experiment for ICEM CFD
Figure 4.3 The co-ordinates of the geometry mapped out onto ICEM CFD
Figure 4.4 The mapped geometry after the curves had been added
Figure 4.5 shows the completed block
Figure 4.6 shows the part labels for the geometry
Figure 4.7 shows the initial mesh created in ICEM CFD
Figure 4.8 shows the quality of the mesh
Figure 4.9 shows the concentration of nodes in the ‘high activity’ region
Figure 4.10 shows the final mesh created in ICEM CFD
Figure 4.11 The mesh after its imported in Fluent
Figure 4.12 The calculation run for 100 iterations
Figure 4.13 The contours between the piston ring and cylinder liner
Figure 4.14 A zoomed in picture of the contours between the piston ring and cylinder liner
Figure 4.15 The static pressure graph along wall 2
Figure 5.1 is a graph showing the max pressure vs engine speed for different viscosities
Figure 5.2 is a graph showing the force vs engine speed for different viscosities
Figure 5.3 is a graph showing the pressure vs film thickness for different engine speeds
Figure 5.4 is a graph showing the load vs film thickness for different engine speeds
Figure 5.6 is a graph showing the force vs engine speed for different film thicknesses
Figure 5.5 is a graph showing the pressure vs engine speed for different film thicknesses
Figure 5.7 is a line diagram of the reverse moment
Figure 5.8 shows step measuring of a pressure graph
Figure 5.9 is a graph showing the max pressure vs engine speed for the different ring profiles
Figure 5.10 is a graph showing the force vs engine speed for the different ring profiles
Figure 6.1 Gantt chart modified – plans vs actual progress
List of tables
Table 2.1 Table showing the different types of piston rings
Table 2.2 results extrapolated from the graphs in figure 2.11
Table 2.3 results extrapolated from the graphs in figure 2.13
Table 2.4 collected data for different 5w-40 engine oils
Table 4.1 Tested Oil Properties
Table 5.1 Experimental results vs CFD results
Table 5.2 Experimental results for all engine speeds
Table 5.3 CFD results for all engine velocities
Table 5.4 CFD results for all engine velocities and an oil film thickness of 2μm
Table 5.5 CFD results for all engine velocities and an oil film thickness of 5μm
Table 5.6 CFD results for all engine velocities and an oil film thickness of 10μm
Table 5.7 CFD results for all engine velocities and viscosity set to 0.03286 kg/m.s at 70oC
Table 5.8 shows the results obtained for a radius of 75mm in CFD
Table 5.9 shows the results obtained for a radius of 85mm in CFD
References
[1] Esfahanian, M. and Hamrock, B J. and Elsharkarkawy, A. (1998). On the hydrodynamic lubrication analysis of piston rings. Department of Mechanical Engineering, The Ohio State University
[2] Wright, G. Piston Rings – Wright’s Pages @ Centennial’s School of Transportation. Piston Rings. [Online] Available at: http://www.dieselclass.com/Engine%20Files/Piston%20Ring%209-06.pdf [Accessed 20/10/16]
[3] Dhunput, A. (2009). Oil Transport in Piston Ring Assemblies. School of Engineering & Mathematical Sciences, City, University of London.
[4] Anon. what-when-how In Depth Tutorials and Information. Purposes of lubricating oil. [Online] Available at: http://what-when-how.com/automobile/purposes-of-lubricating-oil-automobile/ [Accessed 10/10/16]
[5] Anon. Machinery Lubrication. The Effects of Viscosity. [Online] Available at: http://www.machinerylubrication.com/Read/1029/viscosity-effects [Accessed 10/10/16]
[6] Oilem. Lubricant, Fuel, Additive & Gas Saving Technology. Fuel & Carbon Cleaners – What Happens to the Carbon? [Online] Available at: http://www.oilem.com/fuel-carbon-cleaners-what-happens-to-the-carbon/ [Accessed 01/01/17]
[7] VanGelder, K. (2017) Book. Fundamentals of Automotive Technology. Publisher: Jones & Bartlett Publishers
[8] Anon. Nationmaster. Motor vehicles per 1000 people: Countries Compared. [Online] Available at: http://www.nationmaster.com/country-info/stats/Transport/Road/Motor-vehicles-per-1000-people [Accessed 20/01/17]
[9] Stachowiak, G. and Batchelor, A. (1993). Engineering Tribology. Department of Mechanical and Materials Engineering, University of Western Austrailia.
[10] Dellis, P. and Arcoumanis, C. (2004). Cavitation development in the lubricant film of a reciprocating piston-ring assembly. City, University of London and Imperial College London.
[11] Sherrington, I. (2010). Measurement techniques for piston-ring tribology. University of Central Lancashire.
[12] Plesset, M. (1995). Bubble Dynamics and Cavitation. Department of Engineering Science, California Institute of Technology.
[13] Anon. AMSOIL. Why Motor Oil Deteriorates. [Online] Available at: https://www.amsoil.com/newsstand/motor-oil/articles/why-motor-oil-deteriorates/ [Accessed 20/01/17]
[14] Summers, V. DECODED = {science…}. Motor Oil in Your Engine: Degraded by Heat and Oxygen. [Online] Available at: https://www.decodedscience.org/motor-oil-engine-degraded-heat-oxygen/41125 [Accessed 20/01/17]
[15] Anon. University of Windsor. Piston and Piston Rings. [Online] Available at: https://courses.washington.edu/engr100/Section_Wei/engine/UofWindsorManual/Piston%20and%20Piston%20Rings.htm [Accessed 16/11/16]
[16] Bryant, J. NAPA Know How. How Piston Rings Work. [Online] Available at: http://knowhow.napaonline.com/how-piston-rings-work/ [Accessed 16/11/16]
[17] Anon. Federal Mogul. Piston Ring Types – Compression Rings. [Online] Available at: http://korihandbook.federalmogul.com/en/section_18.htm [Accessed 16/11/16]
[18] Anon. Shell. Shell Helix Ultra 5W-40 Safety Data Sheet [Online] Available at: http://www.cnergyasiapac.com/assets/Uploads/Helix-Ultra-5W40-MSDS.pdf [Accessed 10/12/16]
[19] Anon. Tetrosyl. Tetrosyl 5W-40 Fully Synthetic Oil Safety Data Sheet [Online] Available at: http://www.farnell.com/datasheets/1718437.pdf [Accessed 10/12/16]
[20] Anon. Mobil. Mobil Delvac 1 5W-40 Product data sheet. [Online] Available at: http://www.chemcorp.co.uk/creo_files/upload/related-items/delvac_1_5w-40.pdf [Accessed 10/12/16]
[21] Anon. ENEOS. ENEOS 5W-40 FULLY SYNTHETIC MOTOR OIL PRODUCT DATA SHEET. [Online] Available at: http://www.eneos.us/wp-content/uploads/2014/12/ENEOS-5w40-Fully-Synthetic-Motor-Oil-Product-Data-Sheet-2014.pdf [Accessed 10/12/16]
[22] Anon. Total. Total Squartz 9000 5W-40 Engine lubricant product data sheet. [Online] Available at: http://www4.total.fr/asia-oceania/singapore/automotive_lubricants/Passenger%20Car/Engine%20Oils/Fully%20Synthetic%20Oils/Quartz%209000%20Future%20GF5%205W40.pdf [Accessed 10/12/16]
[23] Anon. Mobil. Mobil Synt S 5W-40 Synthetic Technology Extra High-Performance Multigrade Engine Oil Product Data Sheet [Online] Available at: http://www.ulei-mobil.ro/pdf/MobilAutoDataSheet/Synt%20S%205W-40%20pds.pdf [Accessed 10/12/16]
[24] Anon. Mobil. Mobil Super 3000 X1 5W-40 Product Description. [Online] Available at: https://www.mobil.com/English-GB/Passenger-Vehicle-Lube/pds/GLXXMobil-Super-3000-X1-5W40 [Accessed 10/12/16]
[25] Anon. Shell. Shell Rotella T6 5W-40 (CJ-4) Technical Data Sheet. [Online] Available at: http://s7d9.scene7.com/is/content/GenuinePartsCompany/1843126pdf?$PDF$ [Accessed 10/12/16]
[26] Anon. PENTO. Pento High-Performance II 5W-40 Product Data Sheet. [Online] Available at: http://www.pentosin.net/specsheets/Pento_High_Performance_II_5W-40.pdf [Accessed 10/12/16]
[27] Anon. LIQUIMOLY. Synthoil High Tech 5W-40 Product information. [Online] Available at: https://pim.liqui-moly.de/pidoc/P000339/1306-SynthoilHighTech5W-40-16.0-en.pdf [Accessed 10/12/16]
[28] Anon. ROYAL PURPLE. Royal Purple API-Licensed motor oil. [Online] Available at: http://www.royalpurpleconsumer.com/wp-content/uploads/PS_API_MotorOIl.pdf [Accessed 10/12/16]
[29] Anon. Castrol. Edge Turbo Diesel 5w-40. [Online] Available at: http://www.autodily-cardo.cz/soubory/27/castrol_edge_turbo_diesel_5w40_technic.pdf [Accessed 10/12/16]
[30] Anon. Castrol. Castrol GTD Magnatec 5W-40 Data Sheet. [Online] Available at: http://msdspds.castrol.com/ussds/amersdsf.nsf/Files/4BB032437B40F2AC802578B1005B24AE/$File/043112Castrol%20GTD%20Magnatec%205W-40.pdf [Accessed 10/12/16]
[31] Anon. Castrol. Castrol Magnatech Professional A3 5W-40 Data Sheet. [Online] Available at: http://msdspds.castrol.com/bpglis/FusionPDS.nsf/Files/5B1A75D4F8E211F380257B13005A2C3E/$File/BPXE-8HQJWQ_0.pdf [Accessed 10/12/16]
[32] Anon. Castrol. Castrol Magnatec Professional B4 5W-40 Data Sheet [Online] Available at: http://msdspds.castrol.com/ussds/amersdsf.nsf/Files/FD39C5EBF5E0AF1280257A9A005275C8/$File/156461Castrol%20Magnatec%20Professional%20B4%205W-40.pdf [Accessed 10/12/16]
[33] Anon. ANSYS. ANSYS ICEM CFD User’s Manual. [Online] Available at: http://148.204.81.206/Ansys/150/ANSYS%20ICEM%20CFD%20Users%20Manual.pdf [Accessed 22/04/17]
[34] Anon. ANSYS. ANSYS Fluent. [Online] Available at: http://www.ansys.com/Products/Fluids/ANSYS-Fluent [Accessed 22/04/17]
[35] Weisstein, E W. MathWorld. Circular Segment. [Online] Available at: http://mathworld.wolfram.com/CircularSegment.html [Accessed 16/11/16]
[36] Subcommittee D02.07. (2015). Standard Practice for Viscosity-Temperature Charts for Liquid Petroleum Products. Book of Standards Volume: 05.01.
Cite This Work
To export a reference to this article please select a referencing stye below:
Related Services
View all


Related Content
All TagsContent relating to: "Technology"
Technology can be described as the use of scientific and advanced knowledge to meet the requirements of humans. Technology is continuously developing, and is used in almost all aspects of life.
Related Articles

DMCA / Removal Request
If you are the original writer of this dissertation and no longer wish to have your work published on the UKDiss.com website then please: