Emission Control of a Diesel Engine using Reducing Agent
Info: 8638 words (35 pages) Dissertation
Published: 16th Dec 2019
Tagged: EngineeringMechanics
Emission Control of a Diesel Engine using Reducing Agent
Abstract
In today’s vehicle application, SCR ammonia dosing is completed using complex technology and that need to be simplified for the individual reduction technology. An experimented validated process has been investigated using ANSYS modelling. To reduce the NOx emission, selective catalytic reduction (SCR) is used. But because of ammonia slip the required level of NOx reduction has not been achieved. This work concentrates on the decomposition and evaporation of the urea water solution (UWS) using ANSYS Fluent. Available kinetic data was implemented and the conversion percentage was estimated from the concentration result obtained in the analysis. The results are validated with the experimental measurement which are available and the numerical system allows to find out the conversion efficiency and the distribution of the reducing agent. The study shows kinetic analysis of NOx reduction carried by catalytic filter material and the experimental data included in the literature. The result implies that the required NOx conversion is possible on time scales of gas flow through a catalytic filter in range of temperature 250-450 ºC and the strong temperature effect due to the composition of the SCR reaction and oxidation of NH3 with O2.
Contents
2.3 Selective Catalytic Reduction
5.4 Effect of Inlet Concentration
Table of Figures
Figure 3 A flow diagram of an SCR system [15]
Figure 4 The reaction principle of Urea – SCR system.
Figure 5 Model for the simulation
Figure 7 Effect of temperature on NO and NH3 concentration
Figure 8 Evaluation of the effect of GHSV on conversion versus the gas temperature
Figure 10 Evaluation of the effect of GHSV on conversion versus gas temperature
1 Introduction
Almost 90% of the energy production is dependent on the combustion of the fossil fuels [1]. Energy scenario predicts that’s the combustion of fossil fuels will permit for 50%of the world energy consumption in 2100 [2]. In the last few years, the pollutants from the combustion sources (carbon monoxide (CO), hydro carbon (HC), nitrogen oxides (NOx), sulphur oxides, etc ) are increasing rapidly because of excessive use of fossil fuel in the vehicle. Particulate matters can be reduced 50 to 90 % of its emission by making modifications in the engine [3]. On the other hand the emission of NOx is highly needed to be mitigated. Nitrogen oxides (NOx, including NO, NO2 and N2O) emissions from Diesel Engines are major environmental concerns that include increasing ground level ozone, formation of acid rain, forest damage, and formation of fine particles in the atmosphere.
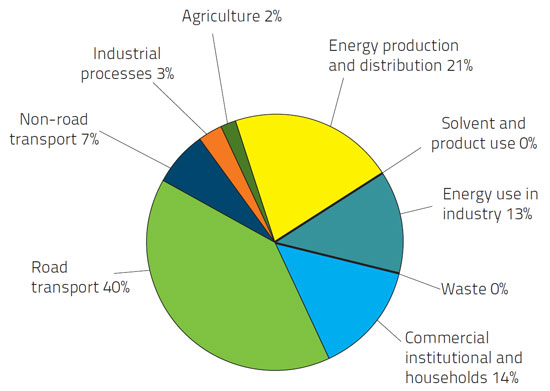
Figure 1 European Union emission inventory report 1990–2011 under the UNECE Convention on Long-range Trans-boundary Air Pollution (LRTAP)
In the above chart, it shows that the road transport and energy production are the greatest source of NOx emission [4]. Therefore, the technologies to reduce NOx emission are very important. To control the pollution, some limitation on the emission have been introduced first in 1970. Latest standard is ‘Euro 6’, applies to the new approval from September 2014 and all new cars from September 2015 and reduces 96% of pollutants as compared to 1192 limits [5]. Following are the emission standards introduced in Euro 6 emission limits for diesel engine.
Euro 6 emission limits (diesel)
- CO – 0.50 g/km
- HC+ NOx – 0.17 g/km
- NOx – 0.08 g/km
- PM – 0.005 g/km
- PM – 6.0×10 ^11 g/km
Being one of such technologies, selective catalytic reduction(SCR) of NOx, is a very promising method, due to its high efficiency, selectivity and low expense. A common problem in the SCR system is the ammonia slip which prevents the system to achieve the required level of NOx reduction and this occurs when excess ammonia is injected in the process or when there is insufficient catalytic surface area [6]. SCR performance can be improved by operating the catalysts at different temperatures to optimize their maximum activity and gas residence time also influences catalytic activity, as well as inlet ammonia concentration. The present study investigates the effects of various parameters (temperature, inlet NO concentration ratio, gas space velocity) on the performance of honeycomb structured catalysts using three-dimensional CFD modelling and simulation.
The purpose with this project was to study an after-treatment system for diesel exhaust where the reduction of NOx takes place. NH3-SCR technology is used to achieve the reduction. The main purpose with the project was to understand mixing of ammonia with exhaust gases, ensuring chemical reaction, its evaporation and decomposition, the resultant thermal behaviour. Further was the purpose to investigate if the results from the basic scale can be transferred to a full-scale system. To be able to understand the above-mentioned phenomena CFD-simulations (computational fluid dynamics) have been carried out with the software Ansys 17.1 together with the simulation tool Fluent.
2 Literature Review
2.1 Kinetics of NO reduction
The total pressure at the beginning. The absolute value of reaction rate was not depended on the pressure that it had at the beginning NO or NH3 but it was directly depended on the ratio. The total outcome of the rate was PNH3/pNO =2.1. and the observed the total energy that was activated was around 24.8 Kcal/gmol. N2O was involved in the formation; so, the N2 equation was [7]
| d PN2dt= PNH3PNO( PNH3PNO+B)2 | (1) |
Oxygen has properties from the reaction Michailova discovered that you can reduce the observed rate when you heat the platinum wire in oxygen.From the recent study, the molecular oxygen has immensely increased the rate of NO reduction by NH3 which was founded by Markvart and Pour. But they could not find any information on N20 formation. Gupta once studied the how exactly kinetics of NO reduction by NH3 which was over 3% Ni – 0.1%Pt specially on the alumina catalyst. The N2 formation rate was exactly fit to a Langmuir-Hinshelwood model involving non-dissociative adsorption of both reactants [7];
| rN2=k KNO KNH3 PNO PNH3(1+KNO PNO+KNH3 PNH3)2 | (2) |
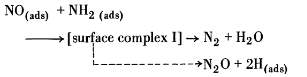
Even though the data that were shown in the rate equations given, the behaviour of the constants in the rate expression, for example showing the endothermic adsorption of reactants, it was expected as per the theoretically behaviour. Still no attempt was made to match the behaviour to the catalytic chemistry. The catalytic chemistry of NO-NH3 reaction system was derived from 15 N isotope work of Otto,Shelef and Kummer. So they have tagged N in NH3 and then in NO with constant isotope 15 N this was openly discovered that the catalytic reduction of NO by NH3 has been described in the following reaction paths [7] :
| NH3 -> NH3 (ads) | (3) | ||
| NH3 (ads) -> NH2 (ads) + H (ads) | (4) | ||
| NO -> NO (ads) | (5) | ||
 |
(6) | ||
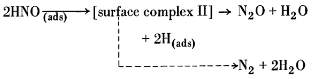
| H(ads) + NO(ads) → HNO(ads) | (7) | ||
 |
(8) | ||
The above reaction shows the major reaction paths. Product desorption steps are implicit surface intermediates were considered plausible, reactions are bit complexes to implement other than implied here are possible [7].
NH3 absorption is suitable at the normal room temperature with the extent of dissociation of NH2 (ads) + H(ads) with increase in temperature. If the minor reaction pathways in the steps 6 and 8 are ignored, the selective reason of N2 is determined by the material balance on absolved NH2 and H, and r n2 / r n2 0 must equal 2.0. Otto, Shelef and Kummer (6,8) detailed the significance of N2O and demonstrated that both N2 and N2 O were primary products were independent of conversion in batch experiments. Due to the involving very small reaction pathways the rN2 / r N0 ratio was less than 2.0. Many other reactions which was like this was also observed along the research which was for NO- NH3 reaction with a copper and ruthenium displaying a degree of generality to the proposed reaction mechanism [7].
Otto, Shelef and Kummer displayed that the rate of H2 (as absolved H) reaction with NO over Pt was considerably which was faster than that of NH3, and their accordance with surface mechanism reduction with H2 invented copious quantities of N2O. They also discovered that N2O reduction rate was about an order of magnitude slower than the No reduction rate using NH3. Other limitations were prevented further kinetic analysis of the data.
In the future study where they use NH3 and ND3 a new effect was discovered which was called as Kinetic isotope effect and the reaction rate was almost closer to zero-order dependence with reactants and products. However, neither reactant partial pressure nor reactant ratio was altered sufficiently to establish the kinetics. Markvart and Pour clearly marked that Pt the No reduction rate increased rapidly with increasing molecular oxygen concentration to about 0.6% O2 and left out was remained unchanged from 0.6 to 3.2% O2. But O2 was gradually decreased in the activity. The effect of oxygen on the Pt catalyst was described depending on the basics of O2 by eliminating ammonia fragments from the surface thus allowing NO to chemisorb and react with reactive absorbed NH3 species [7].
2.2 No-NH3 Reduction Kinetics
The literature provides all the information to demonstrate few qualitative models of the kinetics of the reduction of NO by NH3 supported by sufficient information on the reaction mechanism. The task which is left out will synthesize this information into respective models in order to have a very good amount rate data to compare between the models and then later keep the track on the kinetic parameters in the respective models. A part from this literature review provides you the full information on the communication of sulphur compounds with metals and on the NOx reduction behaviour of these metals when SO2 is present but the condition of the two types of information is required [7].
The main research of this work was to quantitatively measure the rate of reduction of NO by NH3 to modify the data with real kinetic equations and to calculate the effect of O2 and SO2 on the rate of reduction. This research was carried on supporting platinum, and other metals which was compared with their respective activity and the effect of SO2 on them.
Apparatus and Procedure – It is used to control and measure the flow of premixed gases to the reactor; a packed bed, flow, micro reactor which was operated at atmospheric pressure and immersed in a fluidised sand bath for temperature control. A thermocouple in the catalyst bed explained the quality with sand-bath temperature. This system was based on 316 stainless steel.
Due to increase in oxygen the rate of NO-NH3 reaction, an extra precaution was taken to take out from the system, and tests indicated was decreased to less O2 under reaction condition (3,4,40). Which was created newly catalyst as 30-40 mesh range particles was decreased under flowing hydrogen by heating at 1 K/min 623 and 773K for the unsintered and sintered catalyst and holding for 12 hr before keeping in the reactor. Reduction in the reactor was not changed of the steady state activity of the catalyst were used. Space velocities were calculated based on the feed stream at around 298K were around 170,000 to 390,000 hr for the unsintered catalyst and from 13,500 to 154,000 hr for the sintered catalyst. 10% was used to convert the limiting reactant in all the cases, differential reactor operation was operated in this region by displaying space velocity was independent of the rate. Due to which few of the catalyst were deactivated to constant state of about 18hr. In half an hour, Kinetic data was obtained that allowed for equilibration after each concentration change. The rate at the condition of the first deactivation was shown to reinvent after all kinetic data were obtained. So the concentration would be about 0.25 to 1.0% NO and 0.1% to 2.0% NH3were studied at 423,448,473 K [7].
2.3 Selective Catalytic Reduction
Selective Catalytic Reduction (SCR) has been connected to stationary source, petroleum product let go, ignition units for outflow control since the mid 1970’s and is as of now being utilized as a part of Japan, Europe, and the United States. There has been restricted use of SCR application to other combustion gadgets and procedures, for example, straightforward cycle gas turbines, stationary responding inward ignition motors, nitric corrosive plants, and steel process strengthening heaters. SCR can be connected as a remain solitary NOx control or with different advances, for example, burning controls. SCR frameworks have encountered moderately couple of operational or support issues [8].
SCR is normally executed on stationary source combustion units requiring a more elevated amount of NOx decrease than achievable by SNCR or combustion controls. Theoretically, SCR system can be intended for NOx evacuation effectiveness up to 100 %. Business coal, oil and gaseous petrol let go SCR frameworks are regularly intended to meet control focuses of more than 90%. Be that as it may, keeping up this proficiency is not generally functional from a cost angle. Practically speaking, SCR system work at effectiveness in the scope of 70% to 90% [9].
Like SNCR, the SCR procedure depends on the chemical reduction of the NOx atom. The essential distinction amongst SNCR and SCR is that SCR utilizes a metal-based impetus with initiated locales to build the rate of the decrease response. A nitrogen based lessening operator (reagent, for example, smelling salts or urea, is infused into the post burning vent gas. The reagent responds specifically with the pipe gas NOx inside a particular temperature extend and within the sight of the impetus and oxygen to lessen the NOx into sub-atomic nitrogen (N2) and water vapor (H2O) [10].
Urea-SCR innovation can successfully diminish diesel motor fumes gas nitrogen oxide (NOx) outflows, Urea – SCR is the most encouraging innovation which meet emission principles the diesel motor to meet the Euro IV and V directions. As indicated by the Eley-Rideal instrument completed urea catalysed diminishment NOx three-dimensional numerical recreation by utilizing the AVL FIRE programming, which comes about give reference to improvement outline of impetuses. Contingent upon the utilization of lessening operator, which can be generally partitioned into two classes, NH3-SCR and HCSCR, this investigation for the most part presents NH3-SCR innovations utilizing NH3 as decreasing specialist [11].
3 SCR Methodology
3.1 Chapter introduction
An experimental analysis of SCR system alone is not sufficient to make informed decisions on whether to proceed with a project; simulation using CFD analysis always necessary. The next chapter presented results from the experimental analysis of the investigated NH3-SCR systems. This chapter provides details on the conversion rate of NOx along with the change in temperature and presents results and findings through its application.
A description of the methodology employed to conduct the analysis of the conversion of the NOx after injecting ammonia is provided. Then the output is presented including explanation of all model inputs and assumptions. The results and findings from various sensitivity analyses are presented and discussed in the last section.
3.2 NH3-SCR mechanism
SCR technology is an advanced emission control technology used to reduce the quantity of hazardous gases that come out through the exhaust of a diesel engine. It injects a reducing agent into the exhaust of a diesel engine with the help of a catalyst. The reducing agent is usually automotive grade urea and it is known as a diesel exhaust fluid (DEF). A chemical reaction occurs that converts the nitrogen oxides (NOx) into nitrogen, water and carbon dioxide. SCR technology is made to allow the exhaust gases pass through the reducing agent to take place a chemical reaction in an oxidising atmosphere. The “selective” word is used because it reduces the amount of NOx using a reducing agent in a catalyst system and the chemical reaction is called reduction where the DEF is a reducing agent that sets a chemical reaction with NOx and converts it into nitrogen, water and carbon dioxide (CO2) [12].
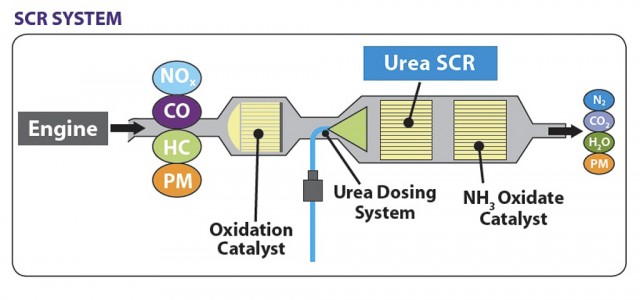
This technology is the most cost effective and fuel-efficient technology used to reduce the emission of a diesel engine. In the fig.1 the exhaust gases NOx, CO, HC and particulate matter (PM) coming out of the diesel engine are passed through the oxidation catalyst where oxidation of NO takes place and then through the SCR system. Urea dosing is injected before the SCR system to reduce the amount of NOx. At the end of the SCR system the products are found as shown in fig 1. There are some reactions takes place in the SCR system which are useful in the analysis. Following are the reactions which takes place in the SCR system [14].
The NH3-SCR System contained of an aqueous ammonia storage, radiator, air supplier, heat exchanger, vaporizer, blender, injector and SCR reactor. A diagram for a NH3-SCR system is represented in Figure 3. As shown, aqueous ammonia is directed into the vaporizer before being blended with hot air. At that point, gaseous ammonia as a reducing agent is injected into flue gas that is preheated in the heat exchanger. Then, the gas mixture streams into the SCR reactor. At that point, discharge clean gas streams into the heat exchanger to discharge its heat to include flue gas. In the SCR procedure, a gaseous reductant is ordinarily pure anhydrous ammonia, aqueous ammonia or urea. The chemical reaction that happen in NH3-SCR system are appeared in Equation mentioned in the following diagram where the first is the desired reaction. The SCR procedure requires an exact control of the ammonia injection rate. An inadequate injection may give low NOx transformations. An injection rate that is too high outcomes in release of undesirable ammonia to the environment. These ammonia emissions from SCR systems are known as ammonia slip. The ammonia slips increment at higher NH3/NOx proportions.
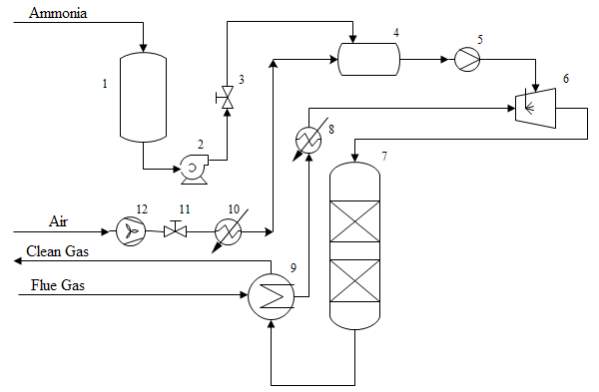
1. Aqueous Ammonia Storage
2. Pump
3. Valve
4. Vaporizer
5. Mixer
6. Ammonia Injector
7. SCR Reactor (Multi-bed)
8. Heater
9. Heat Exchanger
10.Heater
11.Valve
12.Air Fan
4NO + 4NH3 + O2→ 4N2 + 6H2O
4NH3 + 3O2 → 2N2 + 6H2O
Figure 3 A flow diagram of an SCR system [15]
The stoichiometric NH3/NOx proportion in the SCR system is around 1. Ratios higher than 1 primarily increment the ammonia slip [16]. In a useful SCR system, ammonia is commonly injected to deliver a NH3/NOx molar proportion of 1.05– 1.1 to accomplish a NOx conversion of 80– 90% with an ammonia slip of around 10 ppm of unreacted ammonia in gasses leaving the reactor. The NOx removal efficiency relies upon the flue gas temperature, the molar proportion of ammonia to NOx, and the flue gas residence time in the catalyst bed [17]. As examined later, the ammonia slip decreases by expanding temperature, while the NOx conversion in a SCR catalyst may either increment or reduction with temperature, depending upon the specific temperature range and catalyst system. Likewise, in the following, the impact of NH3/NOx proportion on NO conversion is shown in different working conditions and in the two sorts of SCR reactors.
3.3 NH3-SCR reaction
CFD can be used to determine the mixing of ammonia with exhaust gases, its evaporation and decomposition, ensuring the chemical reaction and the resultant thermal behaviour of the gases. Catalytic conversion occurs at high temperature above 220° C [6] . Exhaust gas temperature fluctuates in changing the engine load conditions, that produces high thermal stresses and possibility for the fatigue in exhaust component. The wall temperature is calculated by CFD simulation as an input to FEA, which find out the deformation and stress of the SCR.


The reaction principle of Urea-SCR system is given below in (Fig.4)
SCR Catalyst (S)
Oxidation catalyst (V)
4NH3+4NO+O2 →4N2+6H2O
2NH3+NO+NO2 →2N2+3H2O
8NH3+6NO2→ 7N2+12H2O
2NO+O2 →2NO2
2CO+O2 →2CO2
4HC+5O2→ 4CO2+2H2O
Urea
Exhaust
S
O
H
V
Hydrolyst (H)
Oxidation catalyst (O)
4NH3+3O2→ 2N2+6H2O
(NH2)2CO+H2O →2NH3+CO2
Figure 4 The reaction principle of Urea – SCR system.
NH3-SCR is the reducing agent injected in the exhaust pipe, NOx in the SCR catalytic converter by converting it into ammonia (NH3), water (H2O) and nitrogen (N2). Hydrolysis of urea at high temperature gives NH3 (see eq. 1). SCR system adopted reducing agent containing aqueous solution of 32.5% urea.
| (NH2)2CO + H2O → 2NH3 + CO2 | (9) |
NOx emission in diesel engine consists of more than 90% NO [18]. The standard SCR reaction is given in eq.(2). Standard SCR reaction is useful when the temperature ranges 250°→450°C [19] [20]
| 4NO + O2 + 4NH3 → 4N2 + 6H2O | (10) |
The reaction rate of the molar mixture of NO and NO2 is faster than the reaction including only NO see in eq.(2). The reaction in eq. (3) is a fast reaction [21]. The effect of this reaction is noticeable when the temperature is below 300ºC.
| NO + NO2 + 2NH3 → 2N2 + 3H2O | (11) |
During the leakage of ammonia in the operation of the engine, NH3 reacts with O2 to form H2O and N2 (see eq. 4)
| 4NH3 + 3O2 → 2N2 + 6H2O | (12) |
Although there are some ammonia oxidation reactions that was studied by researchers, it is considered that the ammonia is only converted to NO to validate the model. The ammonia oxidation is an unwanted reaction as shown in the eq. (5). [22]
| 5O2 + 4NH3 → 4NO + 6H2O | (13) |
Nitrous oxide is formed at high temperature above 400°C in the commonly used catalyst based on TiO2-WO3-V2O5. Eq (5) is one of the possible reaction which forms nitrous oxide.
| 4NO + 3O2 + 4NH3 → 4N2O + 6H2O | (14) |
When the temperature is below 200ºC the two reactions will seriously affect the NOx conversion rate. Explosive material NH4NO3, NH3 and NO2 reactions (see eq.7)
| 2NO2 + 2NH3 → NH4NO3 + N2 + H2O | (15) |
NH4NO3 can be adhesion in the form of liquid or solid on the surface of the catalyst, but NH4NO3 automatically decompose when the temperature is higher than 300°C [23]
4 Findings
4.1 Equations
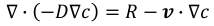
There are two findings deployed in this model. One is mass equation and the other is momentum equation. In spite of the fact that there is a heat evolved amid the response of NO and NH3, an energy condition was not considered in light of the fact that it is little because of little measures of two reactants. The equation indicates a mass equation in an advective flow.
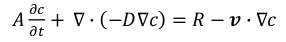
where c is a concentration, D is a diffusion coefficient, R is a chemical reaction, and v is a velocity which is a vector frame. Since the mass equation is expected at an enduring state, the 1 st term is counterbalanced lastly the condition turns into the condition.
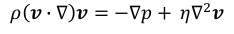
For a momentum equation, the incompressible Navier‐Stokes equation in a laminar flow was employed as shown in the equation.
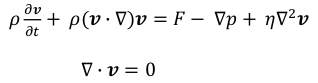
where ρ is a density, F is a convective force, p is a pressure, and ή is a dynamic viscosity.
Since there is no convective force and the inertial force is assumed negligible, then the equation
becomes as follows.
4.2 Formulation
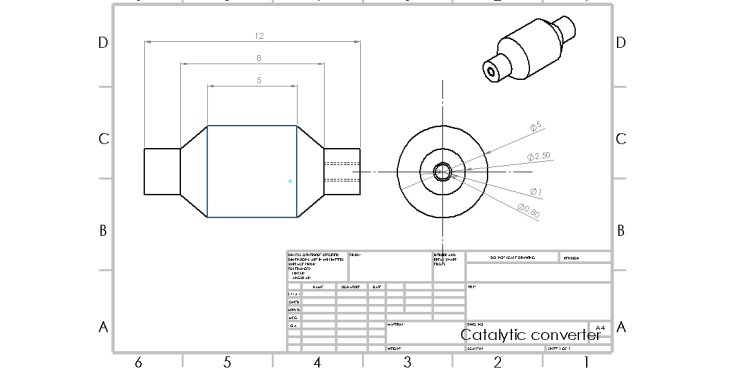
The reaction between NO and NHз was stimulated in 2-D in the figure below. Where the box is a cross-section in the center of the tubular reactor.
Figure 5 Model for the simulation
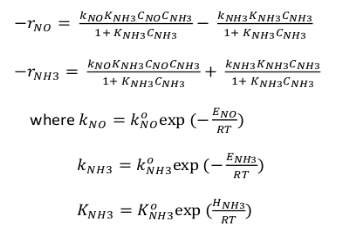 The proper equation used directly in this mode and the reaction rates of NO and NH 3 are given to Chae et al.’s kinetic model because it mainly includes the reaction kinetics and related kinetic constants with their experimental and simulated results. The kinetic model implemented in this process are depicted below:
In the Chae et al’s. model, the porosity of the reactor is not accessible, so there is no information accessible for penetrability and weight drop over the reactor. Likewise, pressure drop and porousness were ascertained utilizing Ergun’s condition and Darcy’s law, individually as depicted below.
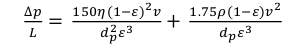
Where L is a reactor lengh, dp is a particle diameter and ρ is the density of the fluid.
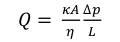
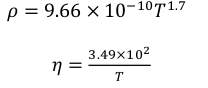
Where Q is a flow arte through the reactor and A is the cross-sectional area of the flow. The fluid coursing through the reactor is accepted as air since it is very little unique in relation to the exhaust gases in genuine plants and its properties at various temperatures are accessible in Turns’ book. Since the thickness and the dynamic viscosity of air are temperature‐dependent, their values were plotted as a component of temperature. From the fitted conditions, the thickness and the dynamic consistency are given as an element of temperature and the conditions were utilized for the figuring of pressure drop.
In the fig. 2, the diameter of the fuel inlet is 1 inch, diameter of the air inlet is 2.5 inches, height of the model is 5 inches
4.3 Data evaluation
4.3.1 Space velocity
The space velocity is a significant design parameter for chemical reactors and denotes the number of reactor volumes of feed, measured at normal conditions, processed per unit of time [24].Usually, the gas hourly space velocity (GHSV) is used and it is defined as:
GHSV=VNVC
VN = volumetric gas flow in normal conditions [cmN3/h]
VC = catalyst volume [cm3]
A GHSV representative of automotive diesel exhaust is 40000-60000 h-1. In the laboratory tests the performance of the SCR catalysts were investigated at GHSV=52000 h-1.
4.3.2 NOx conversion
The NOx conversion (DeNOx) is defined as follows:
DeNOx= NOx,in-NOx,outNOx,in.100
DeNOx is defined as conversion of NOx = NO + NO2. High DeNOx indicating a high SCR activity of the catalyst.
4.3.3 Stoichiometric ratio α
The stoichiometric ratio α represents the ratio between the moles of nitrogen added as reducing agent and the moles of NOx contained in the feed. α =1 means, in case of a high selectivity for SCR, the amount of reducing agent added to the feed allows the total removal of NOx. If ammonia is used as reducing agent, then a is evaluated as follows:
α=NH3,inNOx,in
5 Analysis
5.1 SIMULATION RESULTS
The set for steady-state governing equations together with proposed chemical reaction rates were solved eventually using the Ansys software. Simulation results shows that SCR conversion generously under the impact of different operational conditions. So, the influence of operating parameters was investigated individually to specify the extent to which they could be effective on SCR performance.
5.2 Effect of Temperature
As showed, temperature has a strong effect on the rate of two SCR reactions following its impact on the reaction rate. The simple expectation is that more NO conversion occurs at high temperature. However this case is no longer for temperatures less than 400ºc.
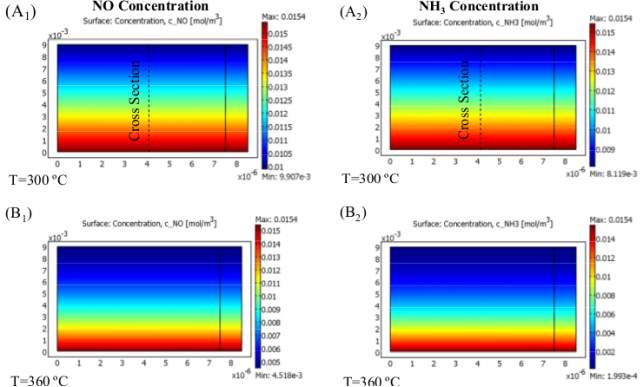
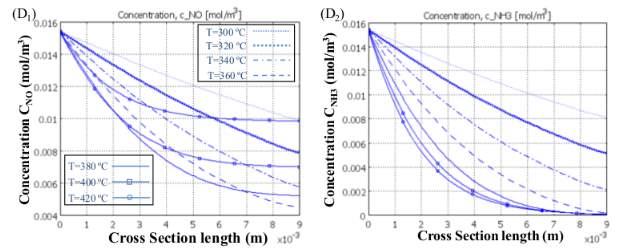
Figure 6 Effect of temperature on NO and NH3 concentration
Since two focused SCR responses are parallel and ammonia is being expended simultaneously in both R 1 and R 2 , diverse NO transformations are obtained at various working temperatures as a consequence of the diminishing convergence of NH3 along the reactor. Figure 6 (A), (B) and (C) show the variation of NO and NH3 concentrations along the reactor at three different temperatures.
Figure 6 (D) shows the variation of their concentration along the cross-section shown in Figure 6 (A) for different operating temperatures. As we can see in Figure 6 (D 1) and (D 2 ), by raising the temperature to 360ºc, NO and NH3 concentrations plummet, so that no ammonia is left by the end of the channel. Therefore, at 360 ºc, NO has a maximum conversion and its concentration falls to a low of 0.0045(mol/m 3 ) or its minimum value. Eventually, something different happens for temperatures up to 360 ºc when the rate of the first reaction (R 1) falls, leading to a greater NO outlet concentration at higher temperatures. In differentiation, NH3 is consumed more rapidly according to R 2, but as R 1 slows down, its concentration does not change significantly for temperatures up to 360 ºc. As provided, by increasing the temperature, all trends with different gas velocities rise and after a maximum trends they begin ti fall. As illustrated, all the curves show descending trends after ammonia is used up completely through the channel, then they all converge into one single curve at 370ºc, namely the falling point and decrease with a faster descending rate. There are two areas ahead of the maximum point; the former is due to depletion of NH3 until reaching 370 ºc and the latter is due to the fall in R 1 that causes all curves to plunge with a single steep trend. The motive behind why NO transformation decays tolerably with the expansion of temperature after full utilization of Ammonia (Maximum Point of each curve) until achieving the falling point (370 ) is the way that, by spending all alkali before achieving the finish of channel, less catalyst volume is utilized for catalytic reaction thus less NO is changed over. This does not happen when the length of the reactor is adequately long and, as we can see later in the case of the honeycomb reactor, NO conversion is less sensitive to this fact and the curve levels off after the maximum point. The greater the conversion, the lower the conversion. In this way, one can split up the reactor working temperature run into three segments in which diverse changes of NO can occur: NO is reduced along the reactor until the point when all NH 3 is totally consumed (First Section); from that point forward, the two responses stop and the rest of the reactor will stay untouched as is incapable. The second section of each curve is shortened by increasing the gas velocity and it has lower values; therefore, gas velocity has its own effect on NO conversion.
5.3 Effect of Gas Velocity
As given, no conversion depends upon changing the temperature, but there are some particular parameters which can influence this variation. Gas Hourly Space Velocity (GHSV) is one of these factors since it can change the residence time of reacting components in chemical reactors and so change their conversions. Reducing the residence time by raising the gas velocity, the reactants conversion should decrease. Hence, the conversion of NO and NH 3 drops off upon increasing the GHSV, which is shown in Figure 8 for a catalytic filter reactor. The conversion variations performed are not the same for all the temperatures with different gas velocities. On the other hand, at high
temperatures the second reaction rate (R 2) increases while the first one (R 1) decreases, which results in the lack of NH 3 and a plummet in NO conversion, so again the GHSV has no major effect on conversion. Therefore, gas velocity in parallel with temperature controls the value of conversion. In contrast, beside the maximum point, where NO conversion peaked at around 0.7 and NH 3 reached the value of 90% for a GHSV of 3000, gas velocity has the most considerable influence on changing the conversions. Applying high temperatures lowered the gap between curves and makes them converge into one single curve. The reason behind this is the increase of gas velocity which reduces the complete velocity on NH3 by the end of the reactor, so there is no conversion diminishes.
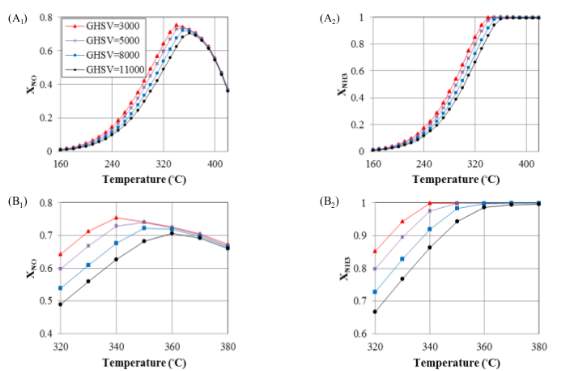
Figure 7 Evaluation of the effect of GHSV on conversion versus the gas temperature
Despite the fact that the expansion in temperature builds response rates that can kill to some degree the impact of the increment in gas speed, as residence time diminishes and the significant piece of the gulf gas experiences the void space of the reactor speedier than through the impetus permeable layer, a lower NO transformation is gotten. As provided, gas leaves the reactor through exhaust free space more essentially when it has higher speeds, which is trailed by a lower NO transformation that outcomes in higher yield fixations. The velocity field having a reverse parabolic trend for flow through the catalyst permeable space in correlation with the inward free space of the reactor because of its limit condition at the interface between the permeable medium and free space, which makes the bends have negative first and second subsidiaries. As compared before, the catalyst layer has a negative first and a positive second subordinate because of the no slip boundary condition on the correct hand side of catalyst layer.
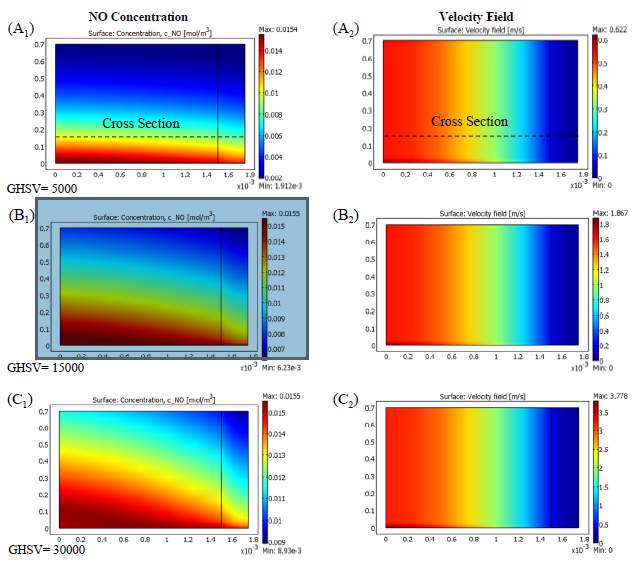
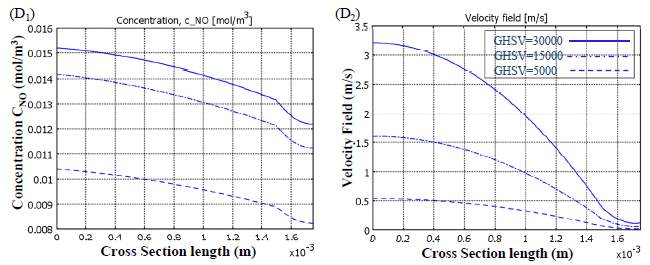
Figure 8 Effect of Gas Velocity; Variation of NO concentration (left column) and velocity field (right
The honeycomb reactor likewise experiences changes like the catalytic channel in regard to gas velocities. As we can see in Figure 10 (A), NO conversions for temperatures from 240ºc and 280 ºc to 340ºc, respectively for low GHSVs of 5000 and 15000 are relatively level. Once again, upon full utilization of ammonia, NO transformation with various GHSVs begins to diminish and, at higher temperatures, they merge into one descending curve. As mentioned previously, the main reason for moderate falling trend at high temperatures, NH3 is used up to the inlet of the reactor therefore of this reason conversion decreases. Subsequently, all bends meet into one soak falling pattern because of the decay of R 1. This reality can likewise be found in the following area where the focus influences on the transformation is considered.
5.4 Effect of Inlet Concentration
The concentration of gas toxic pollutants is one of the most crucial factors in selection of the best operational condition for contaminant elimination. Along with these lines, in this segment, we look at the SCR of NO under the impact of different NH 3 and NO concentrations at different working temperatures in the catalytic filter and honeycomb reactor. Besides, notwithstanding the adjustments in ammonia concentration, the falling point does not change and still occurs at 340ºc because, as said prior, it consists of R 1 which relies on the operating temperature as indicated by the Arrhenius Law for the response rate constant. After raising the ammonia inlet concentration, NO transformation expands, all the more essentially for temperatures in the vicinity of 180 and 340ºc, Meanwhile the most extreme point matches the falling point and the most extreme working transformation is reached. As demonstrated before, raising the temperature diminishes the ammonia concentration, while NO fixation may either increment or decline with temperature. Thus, as the operating temperature rises, the concentration of outlet ammonia decreases significantly.
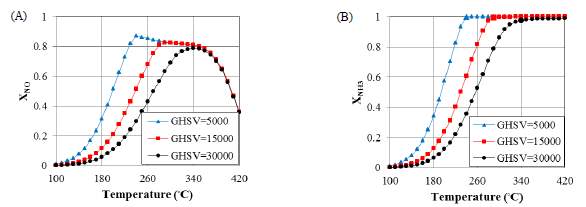
Figure 9 Evaluation of the effect of GHSV on conversion versus gas temperature
6 Conclusion
Research on SCR system proposes that in steady state conditions, when the temperature is high above 400°C, the conversion rate will be high and the conversion rate will higher than 80%. It is understood that the NOx in the exhaust gases can be effectively reduced by use of NH3 in the catalytic reactor known as Selective Catalytic Reactor (SCR).
It is shown that the NO consumption rate is higher than that of NH3, there is no effect on the conversion of the NO below 350°C with the increasing in ratio. Hence considering the NH3 slip and NO conversion at particular temperature the ratio should be controlled. There is no effect of pressure drop and permeability on the conversion, although they are dependent on the porosity.
7 References
| [1] | N. a. J. Nakicenovic, “Global Energy Perspectives to 2050,” in International Institute for Applied System Analysis, December 1995. |
| [2] | A. G. a. M. Jefferson, “Global Energy Perspectives,” in Internation Institute for Applied System Analysis. |
| [3] | C. S. W. a. C. S. W. Asif Faiz, Air Pollution from Motor Vehicles, Washington, D.C.: The World Bank, November 1996. |
| [4] | i. noxite, “Nitrogen Oxide (NOx) Pollution,” icopal noxite, [Online]. Available: http://www.icopal-noxite.co.uk/nox-problem/nox-pollution.aspx. |
| [5] | E. E. STANDARDS, “www.theaa.com,” EURO EMISSIONS STANDARDS, 1 October 2015 2015. [Online]. Available: https://www.theaa.com/driving-advice/fuels-environment/euro-emissions-standards. |
| [6] | T. S. a. P. M. Jayesh Mutyal, “Simulation to Reduce,” ANSYS, 2011. |
| [7] | R. K. a. J. Larson, The Catalytic Chemistry of Nitrogen Oxides, New-york-London: General motors research laboratories, 1975. |
| [8] | I. N. E. T. M. Colombo, “A comparative study of the NH3-SCR reactions over a Cu–zeolite and a Fe–zeolite catalyst,” Catal, 2010, pp. 223-230. |
| [9] | R. V. a. F. W. R.V. Helden, “Optimization of Urea SCR DeNOx Systems for HD Diesel Engines,” SAE Paper, pp. 1-0154, 2004. |
| [10] | P. F. a. M. P. C. Winkler, “Modeling of SCR DeNOx Catalyst-Looking at the impact of substrate attributes,” SAE Paper, pp. 01-01845, 2003. |
| [11] | L. L. a. G. R. G. Busca, “Chemical and mechanistic aspects of the selective catalytic reduction of NOx by ammonia over oxide catalysts: a review,” Applied Catalysis B: Environmental, vol. 18, pp. 1-36, 1998. |
| [12] | I. Nova, Urea-SCR Technology for deNOx After Treatment of Diesel Exhausts, New York: Springer-Verlag New York, 2014. |
| [13] | B. Howard, “Extreme tech,” 2010. [Online]. Available: https://www.extremetech.com/extreme/205338-what-is-diesel-technology-can-tech-conquer-everything-but-the-smell-at-the-pump. |
| [14] | I. Nova, Urea-SCR Technology for deNOx After Treatment of Diesel Exhausts, New York: Springer-Verlag New York, 2014. |
| [15] | M. Nahavandi, Brazilian Journal of Chemical Engineering, vol. 32, pp. 875-893, October – December, 2015. |
| [16] | C. E. E. T. J. Z. H. Baukal Jr, Combustion Handbook: Applications, Boca Raton: CRC Press, 2013. |
| [17] | B. a. L. M. Neuffer, Alternative Control Techniques Document Update: NOx Emissions from New Cement Kilns, Office of Air Quality Planning and Standards, Sector Policies and Programs Division, 2007. |
| [18] | M. M. MKoebel, “Urea-SCR: a promising technique to reduce NOx emissions from automotive diesel engines,” Paul Scherrer Institute, CH-5232 Villigen PSI, Switzerland, 26 May 2000. |
| [19] | X. L. H. L. X. L. a. Y. L. T. Qiu, “A method for estimating the temperature downstream of the SCR (selective catalytic reduction) catalyst in diesel engines,” Energy, vol. vol. 68, pp. pp.311-317, 2014.. |
| [20] | M. R. a. G. A. T.C. Watling, “Development validation and application of a model for an SCR catalyst coated diesel particulate filter,” Catalysis Today, vol. 188, pp. 32-41, 2012. |
| [21] | C. M. a. N. Isabella, “Tronconi Enrico. A simplified approach to modeling of dual-layer ammonia slip catalysts,” Chemical Engineering Sciences, vol. 75, pp. 75-83, 2012. |
| [22] | A. S. A. D. H. G. M. Votsmeier, “Simulation of automotive NH3 oxidation catalysts based on precomputed rate data from mechanisticsurface kinetics,” Catalysis Today, vol. 151, pp. 271-277, 2010. |
| [23] | Y. N. a. J. C. J. H. Hans, “Application of SCR denitrification technology onto coal-firedboilers,” Thermal Power Generation, vol. 9, pp. 10-15, 2007. |
| [24] | O. Levenspiel, “Chemical Reaction Engineering,” John Wiley & Sons Inc, 1972. |
| [25] | T. S. Oghare V. Ogidiama, “Performance Analysis of Industrial Selective Catalytic Reduction (SCR) Systems,” Elsevier, 2014. |
| [26] | N. M. S.R. Dhanushkodi, “Kinetic and 2D reactor modeling for simulation of the catalytic reduction of NOx in the monolith honeycomb reactor,” M. Wilson, July 2008. |
| [27] | T. Lepore. [Online]. Available: http://study.com/academy/lesson/anhydrous-ammonia-uses-safety.html. |
Cite This Work
To export a reference to this article please select a referencing stye below:
Related Services
View all


Related Content
All TagsContent relating to: "Mechanics"
Mechanics is the area that focuses on motion, and how different forces can produce motion. When an object has forced applied to it, the original position of the object will change.
Related Articles

DMCA / Removal Request
If you are the original writer of this dissertation and no longer wish to have your work published on the UKDiss.com website then please: