Executive Functioning in Relation to Risk Perception and Engagement
Info: 10738 words (43 pages) Dissertation
Published: 10th Dec 2019
Tagged: FinanceRisk Management
TABLE OF CONTENTS
PAGE
Abstract………………………………………… v
Introduction……………………………………… 1
Methods and Materials……………………………….. 16
Results………………………………………… 24
Discussion………………………………………. 25
References………………………………………. 26
Appendices……………………………………… 30
ABSTRACT
This study explored the potential relationship between executive functioning, risk engagement and risk perception. Additionally, gender was included as a moderator variable in each of the samples. The study’s hypothesis states that the correlation between executive functioning and risk engagement would be moderated by a participant’s gender. And further, that the correlation between executive functioning and risk perception would be moderated by a participant’s gender. SPSS analysis indicate no significant relationship. The hypothesis that a relationship (as between the means of two samples), is not due to a relational systematic cause. Study results indicate a null hypotheses.
Keywords: executive functioning, risk engagement, risk perception
Introduction
The transition between childhood and adulthood is characterized by a developmental stage known as adolescence. Pharo, Sim, Graham, Gross, & Hayne (2011) indicate that this developmental stage is characterized by an increase in both physical maturity and cognitive ability while also including an increase in morbidity and mortality (p. 970). Over the years, researchers have explored and studied the developmental stages of adolescence in order to identify the various components and factors that influence adolescent development.
One specific area of interest that is often reviewed and evaluated is the assessment of individual risk engagement. The term risk engagement has been used to classify a variety of actions. For the purpose of this study, risk behavior/engagement will be referred to as risk engagement in behaviors that occur in the following areas: ethical, financial, health/safety, social, and recreational (Weber, Blais, & Betz, 2002). Risk engagement research has varied in its hypotheses, methods, and outcomes. However, minimal research has been conducted exploring young adult risk taking and risk perception in relation to his or her executive functioning level.
Risk engagement
The types of risk engagement (e.g. ethical, financial, social, etc.) that individuals choose to engage in originates from differences in perceptions of the risk and/or benefits associated with risk engagement (Blais & Weber, 2006). An individual’s knowledge, age, and experience influence his or her perception of the risk and/or benefits of risky behavior (Blais & Weber, 2006). Gender differences have also been identified as an influential variable on risk perception and behavior (Hancoch, Johnson, & Wilke, 2006; Weber et al., 2002; Byrnes, Miller, & Schafer, 1999).
Various studies have been conducted with the purpose of reviewing gender effects on risk engagement and perception. Byrnes et al. (1999) conducted a meta-analysis on journal articles focusing on gender differences in risk perception. Results indicated that male individuals are more likely to engage in risk behavior than female individuals. Additional studies have also shown gender differences in both risk engagement and risk perceptions (Weber et al., 2002). In a study conducted by Weber and Blais (2002), gender differences were found indicating that males exhibited a greater likelihood of risk engagement and perceived risk behaviors as being less risky than females. Past research has also suggested that men estimate that risk behavior would generate greater benefits relative to women’s estimates (Johnson, Wilke, & Weber, 2004). A review of past research suggests that gender differences may occur as a result of differing perceptions of risk in different life domains. Perceptions of risk engagement are determined during an individual’s evaluation of the amount of risk involved when engaging in the behavior and whether it would result in desirable or undesirable outcomes (Blais & Weber, 2006). This is especially true as young adults develop and attempt to establish their own independence and experiences.
During the adolescence phase, young adults are more likely to consider the benefits of risk engagement than older adults, especially in the context where social acceptance is at stake (Anderson, 2015). Researchers Shulman and Cauffman (2013), examined age differences in perceptions of risk. Participants between the ages of 10 and 30 were asked to rate a series of activities as being risky or non-risky on a Likert scale ranging from “bad idea” to “good idea”. Results revealed a curvilinear pattern in participant responses such that ratings indicating risk activities as being a “good idea” increase with age peaking at around 20 years old and decline as age increased into later adulthood.
In a survey conducted by Kulbok and Cox (2002), researchers identified various types of risk engagement of individuals ranging in ages 12-21 years. Survey results indicated that although the co-occurrence of multiple risk behaviors increased with age, the majority of young adults engaged in risk behaviors one at a time rather than simultaneously (Kulbok & Cox, 2002). Results also indicated that the identified risk behaviors (in the areas of substance abuse, unprotected sexual intercourse, poor dietary and exercise patterns, reckless driving, and violent behavior) suggested potential predictive patterns such that some risk behaviors correlate with others (p.394).
Cognitive dissonance theory
Research suggests that perceptions of risks and benefits associated with risk engagement influence the frequency that an individual engages in risk behaviors. In general, individuals who engage in risk behaviors may perceive the risk as having fewer negative consequences associated with it than individuals who do not engage in risk behavior. Young adults who frequently engage in risk behaviors perceive these risks as having greater benefits and few consequences to rationalize his/her risk engagement (Baumgartner, Valkenburg, & Peter, 2010, p.#). The discussion of this type of relationship is an assumption in line with cognitive dissonance theory. This theory, developed by Leon Festinger in 1957, suggests that “if a person held two cognitions that were psychologically inconsistent, he or she would experience dissonance and would attempt to reduce hunger, thirst, or any drive” (Aronson, 1992). In other words, an individual who is psychologically uncomfortable will be motivated to reduce and/or resolve his or her dissonance in order to achieve balance.
Festinger’s theory is founded on three assumptions; the first stating that individuals are able to recognize discrepancies between their actions and beliefs (Festinger, 1957). The second assumption argues that an individual’s recognition of this inconsistency will cause dissonance between the individual’s behavior and his or her beliefs, and will motivate the individual to resolve this dissonance. The final assumption states that dissonance will be resolved in one of three ways: changing one’s beliefs, changing one’s actions, or changing one’s perception of his or her actions (such as: rationalizing one’s actions) (Festinger, 1957). According to Festinger’s theory, individuals who engage in risky behavior may attempt to rationalize their behavior by denying negative consequences and emphasizing the benefits of risk engagement (Baumgartner et al., 2010). If Festinger’s theory proposes that individuals may emphasize the benefits of risk engagement to justify behavior then perhaps there is a relationship between the brain, risky engagement, and cognitive development.
Cognitive development
Past research has hypothesized that limited brain development and system integration, particularly in the prefrontal cortex of the brain, may be involved in the degree of individual engagement in risk behavior (Pharo et al., 2011, p. 971). Researchers have proposed that individual differences in the rate of development of neural pathways are associated with an increase in the engagement of risky behavior during adolescence and young adulthood (Steinberg, 2008, p. 14). In a study conducted by Stanford, Greve, Boudreaux, and Mathias (1996), high school and university students who rated themselves as having high impulsivity exhibited greater involvement in real life risk-taking than individuals who rated themselves as less impulsive. Results from this study encouraged researchers to explore age-related changes in the human brain during young adulthood in relation to an individual’s tendency to engage in risky behavior. The white matter within the cortex of the frontal lobe is the area in the brain that contains interconnections and feedback loops between the major sensory and major motor systems. These interconnections and feedback loops integrate all components of an individual’s behavior by gathering information about an individual’s external and internal environment and sending this information to the prefrontal cortex of the brain (Lezak, 1995). Research has shown that the prefrontal cortex is paramount in decision making, emotion regulation, and inhibitory responses (Romer, 2010). This particular area of the brain is involved in an individual’s ability to assess the relative risks and benefits of various behaviors (Kelley, Schochet, & Landry, 2004). Taking into account the authors’ (Lezak, 1995; Pharo et al., 2011; and Romer 2010) research, it is important to this study in understanding the development of the frontal lobe during young adulthood. For example, the immaturity of the prefrontal cortex may help to explain the high rate of risk engagement that is exhibited during early adulthood.
In an article written by Laurence Steinberg (2008), past research was reviewed with the intent of understanding individual brain development in relation to risk engagement. The article was written with the intent of developing a new approach to studying risk taking by reviewing individual developmental neuroscience. The article identified three important developmental changes that occur in an individual’s brain over time:
- A decrease in gray matter (this decrease in grey matter influences basic information processing and logical reasoning);
- An increase in white matter, (this increase in white matter improves an individual’s connectivity in the prefrontal cortex which, in turn, improves higher order functions, such as executive functioning);
- An increase in connections within the cortical and subcortical areas of the brain, (increased connections between cortical areas are reflected by improved emotion regulation and processing of emotional and social information)
These changes work together to help improve an individual’s capacity for self-regulation, increase an individual’s ability to engage in long term planning, and decrease his/her impulsive behavior (Steinberg, 2008, p. 14).
Due to the changes that occur in an individual’s brain cognitive control processes, risk engagement tends to decline over time. This decline pattern may support the relationship between risk engagement and executive functioning.
Executive functioning
While neurobiological models provide an explanation of potential causal mechanisms underlying the increase in risk engagement during adolescence, these models do not fully explain the specific cognitive underpinnings of increased risk engagement in young adults. One way to understand the relation between brain function and behavior during adolescence is to examine the cognitive processes that reflect the observed changes in an individual’s neurobiological development (Pharo et al., 2011 p. 971). One potential source of individual differences in risk behavior may lie in individual differences in his or her cognitive abilities. More specifically, these differences may arise from differences in individual levels of executive functioning.
Executive functioning includes control and regulatory processes that integrate information perceived in the external world (Sparrow & Davis, 2008). An individual’s executive functioning process transforms external information into higher order processes by comparing current memory/knowledge to incoming information. Executive functioning processes also combine incoming perceptions with his/her current internal psychological and biological states. Executive functioning deals with how an individual’s behavior is expressed. Initially developed by Muriel Lezak (1995), it is comprised of four components: volition, planning, purposive action, and effective performance. Volition involves an individual’s capacity for intentional behavior. It is the process of determining what an individual needs or wants while also conceptualizing a future realization of that need or want (Lezak, 1995). Volition requires an individual to have the motivation, self-awareness, and the capacity to formulate a goal or an intention. Individuals who lack volition are often unable to conceptualize action (Lezak, 1995). Planning comprises the identification and organization of the steps and elements needed to carry out an intention. In order to plan, an individual must be able to conceptualize changes from present conditions, view the environment objectively, and deal objectively with oneself in relation to the environment. Planning comprises impulse control, intact memory functions, and a capacity for sustained attention. In order for an individual to plan, he/she must be able to conceive alternatives, weigh and make choices, and consider both sequential and hierarchical ideas necessary for the development of conceptual framework (Lezak, 1995). Purposive action involves the transformation of an individual’s intention or plan into a productive, self-serving activity. This action requires an individual to initiate, maintain, switch, and stop sequences of complex behavior in an organized matter. Individuals who lack purposive action engage in impulsive actions by bypassing planning stages (Lezak, 1995). Further, an individual’s ability to perform effectively requires his or her ability to monitor, self-correct, and regulate the qualitative aspects of his or her actions (Lezak, 1995).
Additional descriptions of executive functioning continue to be refined and expanded off of Lezak’s (1995) originating description. Luria described the main components of executive functioning as anticipation (setting realistic expectations, understanding consequences), planning (organization), execution (flexibility, maintaining set), and self-monitoring (emotional control, error recognition) (1996). For the purposes of this study, executive functioning will be conceptualized following Lezak’s principle outline.
In the study conducted by Pharo et al. (2011), researchers examined whether individual differences in executive functioning would independently predict real-life risk taking behavior. Researchers found that individual differences in performance on a series of neuropsychological assessments were predictive of participant’s real life risky behavior. Findings revealed that participants who scored lower on the neuropsychological battery engaged in higher levels of risk behavior than did individuals who scored higher on the neuropsychological battery. This finding provides empirical support for the idea that individual engagement in risk behavior may be a symptom of developmental changes in the prefrontal cortex and, as a result, executive functioning.
Past researchers argue that executive functioning is the most complex aspect of an individual’s cognitive capacity (Sparrow & Davis, 2000). Their reasoning involves the variety of functions required to select, plan, organize, and implement an appropriate behavioral response in a constantly changing world. The concept of executive functioning is abstract and is made up of a variety of functions. Because of the involvement of various functions within an individual’s prefrontal cortex, measures of executive functioning vary considerably in their design and the strength of their proposed relationships with additional cognitive variables.
One suggestion that has emerged from research of this kind is a push toward the development of new interventions focusing on increasing an individual’s executive control (Pharo et al., 2011). With the push to develop new interventions, researchers must first focus on identifying effective tools to measure an individual’s executive functioning behaviorally. Measurements exploring how an individual perceives and then interacts in his or her environment may be one way to identify and measure his or her executive functioning levels.
This study explores the potential relationship between executive functioning, risk engagement and risk perception. Additionally, gender was included as a moderator variable in each of the hypothesis. The study seeks a correlation between executive functioning and risk engagement that is moderated by a participant’s gender. And further, that a correlation between executive functioning and risk perception is also moderated by a participant’s gender.
Hypothesis 1: Levels of executive functioning (as determined by the BRIEF-A) will be correlated with risk engagement.
Hypothesis 2: Levels of executive functioning (as determined by the BRIEF-A) will be correlated with risk perception (as determined by the DOSPERT).
Hypothesis 3: The correlation between executive functioning (as determined by the BRIEF-A) and risk engagement (as determined by the DOSPERT) will be moderated by participant gender.
Hypothesis 4: The correlation between executive functioning (as determined by the BRIEF-A) and risk perception (as determined by the DOSPERT) will be moderated by participant gender.
Method
Participants
A sample of 90 participants, ages 19-69 (M = 33.98, SD= 11.47), was recruited to participate in the proposed study. This sample was calculated using G*Power for a multiple linear regression test (Faul, Erdfelder, Buchner, & Lang, 2009) with an effect size of .15 to obtain a medium effect size (Cohen, 1988). An alpha () of .05 was selected with the use of a power of .95 using one predictor variable (Cohen, 1988). Of the 90 participants, 7% were male, 63% were female, and 30% declined to state. Participants included undergraduate and graduate students at California State University, Stanislaus as well as individuals recruited via social media outlets (Facebook and Instagram), website invitations, access to an employee database with permission from Sierra Vista Child and Family Services. and the psychology department’s online subject pool (http://csustan.sona-systems.com/). All participants were asked to provide consent to participate. Students who participate through SONA had an opportunity to receive experimental credit for their participation; students who participate through social media and electronic outlets did not receive extra credit.Participants were compensated with the opportunity to enter to win one of two $50 gift cards for their participation. Each participant was treated according to the American Psychological Association (2010) ethical principles and code of conduct.
Measures
Behavior Rating Inventory of Executive Function.
The Behavior Rating Inventory of Executive Function-Adult version (BRIEF-A; Roth et al., 2005) is a standardized rating scale developed to provide a glimpse into daily behaviors associated with specific domains related to an individual’s executive functioning in adults between the ages of 18-90 years (see Appendix A). The BRIEF-A assessment consists of a short demographic questionnaire (see Appendix A), a self-report form as well as an informant report form. The self-report form and the informant report forms contain 75 items divided into nine clinical scales: inhibitory, shift, emotional control, self-monitor, initiate, working memory, plan/organize, task monitor, and organization (Ciszewski et al., 2014; Roth et al., 2005). All items are measured using a 3 point Likert rating scale ranging from “never”, “sometimes”, and “often” with higher scores indicating poorer executive functioning. Sample item includes: “I have trouble making decisions” (Roth et al., 2005). The participant’s task is to determine how often he/she has had a problem with the behavior over the past month by circling N (never), S (sometimes), or O (often). Each of the nine clinical scales measures individual reports of risk perception and engagement in behaviors associated with executive functioning. The BRIEF-A (Roth et al., 2005) assessment includes a final scale, known as the Global Executive Composite (GEC). This scale incorporates all of the nine assessment scales to create an overall composite score (Roth et al., 2005). This GEC score reflects the overall executive functioning of an individual. An individual’s executive functioning level is determined by assessing the following areas: an individual’s inhibitory control and impulsivity; ability to transition between situations or activities; ability to tolerate, change, problem solve, and alternate his or her attention or focus; an individual’s emotional expression and regulation; an individual’s social and interpersonal awareness; and the degree to which an individual is aware of his or her behavior and the effect it has on other people. Additional areas include: an individual’s ability to begin tasks or activities independently; ability to generate ideas and responses; ability to problem solve; capacity to hold information and apply it when completing tasks, encoding information, developing plans, and generating goals; ability to manage current and future oriented task demands; and ability to anticipate future events and develop goals, plans, and steps to carry out a task or activity. Other executive functioning areas included in the BRIEF-A include: a person’s ability to organize information for use when learning or communicating additional information; an individual’s ability to examine his or her problem solving strategies to identify and correct any mistakes; and the orderliness of an individual’s work, living, and storage spaces (Roth et al., 2005).
Scoring ranges from 1 (never) to 3 (often). The GEC score incorporates the sum of all 75 assessment items. Assessments were considered invalid and were not included in the GEC score if the number of missing assessment items exceeded more than 14 items. Executive functioning level ranges from 75-225 with higher scores indicating poorer executive functioning.
Internal consistency of the inventory ranges from .93-.96 (Roth, Lance, Isquith, Fischer, & Giancola, 2013). Test-retest reliability ranges from .93-.94 (Roth, Lance, Isquith, Fischer, & Giancola, 2013). The BRIEF-A has been validated in a variety of populations such as ADHD, traumatic brain injuries, and eating disorders when compared to non-clinical controls (Ciszewski et al., 2014; Mangeot, Armstrong, Colvin, Yeates, & Taylor 2002; Roth et al., 2013).
The BRIEF-A also contains three validity scales embedded into its design: negativity, infrequency, and inconsistency (Roth et al., 2005). The negativity scale measures the extent to which a participant answers the questionnaire in an atypical negative manner. The infrequency scale measures the extent to which a participant responds to items in an atypical fashion when compared to normative samples. Finally, this inconsistency scale measures the extent to which parallel questionnaire items were rated inconsistently in relation to normative samples.
Revised Domain-Specific Risk-Taking Scale (DOSPERT).
The Revised DOSPERT Scale (Weber & Blais, 2006) was selected to serve as the measurement tool to assess individual risk taking as well as individual risk perception. The Revised Domain-Specific Risk-Taking (DOSPERT) Scale (Weber & Blais, 2006) is a self-report scale that covers a broad range of risk behaviors that occurs across the span of an individual’s life (see Appendix B). This assessment (Weber & Blais, 2006) is used to evaluate risk engagement in 30 risky behaviors within five domains of life (ethical, financial, health/safety, social, and recreational). The self-reported likelihood of an individual engaging in risk behaviors is categorized as “risk-taking” and is measured using a 7 point Likert rating scale. This scale ranges from 1 (extremely unlikely) to 7 (extremely likely). A sample recreational item includes: “Taking a skydiving class” (Blais et al., 2006). The participant’s task is to rate each item with the likelihood that he/she would engage in said domain specific risk activities/behaviors. Higher scores indicate greater likelihood to engage in risk activities/behaviors listed in the domains of the subscales.
The Revised DOSPERT Scale (Weber & Blais, 2006) also assesses how risky an individual perceives 30 risk behaviors within five domains of life (ethical, financial, health/safety, social, and recreational). A participant’s initial assessment of the amount of risk associated with a given activity/behavior is categorized as “risk perception”. Similar to the self-reported risk taking scale, the risk perception scale evaluates a participant’s initial assessment of how risky each activity/behavior is using a 7 point Likert scale ranging from 1 (not at all) to 7 (extremely risky). Higher scores suggest perceptions of greater risk in the various domains of the subscale (Weber & Blais, 2006).
Both measurements were assessed using the same 30 items with separate prompts: “please indicate how risky you perceive each situation” or “please indicate the likelihood that you would engage in the described activity or behavior” (Weber & Blais, 2006). Scores ranged from 1-7. Scoring for the risk-taking scale was calculated by obtaining the sum of each item. Scoring for the risk perception scale was calculated by obtaining the sum of each item. Scoring for each assessment (risk perception and risk-taking) ranged from 30-210 with higher scores indicating greater risk perception and greater risk engagement.
This scale has been used, validated, and replicated in a range of settings and with a variety of populations. Since its development, the Revised DOSPERT Scale has been validated for use with American college students (Blais & Weber, 2006). In addition to adequate internal consistency and reliability estimates, results of the study reported an internal consistency of .78 for risk-taking scores and .77 for risk-perception scores (Weber et al., 2002). Researchers also reported moderate test-retest reliability estimates with results indicating .88 for risk-taking scores and .89 for risk-perception (Weber et al., 2002). Additionally, researches also reported factorial and convergent/discriminant validity of the scores (Weber et al., 2002).
Several studies have supported the construct validity for the Revised DOSPERT Scale. A reviewof instruments measuring risk engagement describes the Revised DOSPERT Scale as being, “relevant to a clinical environment as they directly measure risk propensity across a number of everyday situations…” (Harrison, Young, Butow, Salkeld, & Solomon, 2005, p. 1390). The Revised DOSPERT Scale is also recognized for its measurement of risk taking, perception of risk, and perceived-risk attitude (Blais & Weber, 2006).
Design
In this study, a non-experimental correlational design was utilized to explore the relationships between executive functioning and risk perception and risk behavior. One questionnaire was used to measure one predictor variable: executive functioning. The predictor variable was measured using the BRIEF-A GEC scale (Roth et al., 2005). A separate instrument was utilized to measure two outcome variables: self-reported risk taking and risk perception. The outcome variables levels were measured using the overall scores for the self-reported risk taking scale and the self-reported risk perception scale from the DOSPERT Scale (Blais et al., 2006).In addition to the above predictor and outcome variables, one moderator variable was considered. The moderator variable was identified via the demographics questionnaire provided by the BRIEF-A (see Appendix A). In this study, the moderator variable of gender was included. To control for order effects all scales were counterbalanced throughout the data collection process.
Procedures
All participants were provided with a website link to access the study survey. Participants were provided with a brief overview of the project. Participants were presented with an informed consent form (see Appendix C) online. If the participant chooses to continue, he/she agreed to the terms and conditions of the consent form by selecting “I agree to participate” near the bottom of the webpage. An additional option of “I do not agree to participate” was also available for participants who did not wish to participate in the study. All participants were prompted to print a copy of the informed consent to keep for his/her records.
Prior to beginning any assessment, participants were asked to complete a short series of demographic questions included as a part of the BRIEF-A (Roth et al., 2005). For the purposes of this study, only gender was utilized as moderator variables. Following the completion of the demographics questionnaire, each participant was assigned to complete the BRIEF-A, the DOSPERT self-reported risk-perception scale, and the DOSPERT self-reported risk-taking scale in random order. Each assessment was counterbalanced to control for order effects. Prior to beginning any assessment, participants were provided with instructions for completing each assessment. All participants were asked to complete each assessment in its entirety.
After completing all questionnaires, participants were directed to a debriefing page which provided detailed information regarding the purpose of the study (see Appendix D). All participants were prompted to print a copy of the debriefing form to keep for his/her records. Following the completion of the study, all participants were provided with an opportunity to enter his/her email information on a separate survey page to enter into a raffle for a chance to win one of two $50 gift cards. All entries were inputted using a separate survey page to maintain anonymity. Each participant had an equal chance to win in this raffle.
Results
Hypothesis 1 indicated that levels of executive functioning (as determined by the BRIEF-A) would be correlated with risk engagement. A multiple regression model was conducted to determine is risk engagement (dependent variable) would be predicted from executive functioning levels (independent variable). In order to determine if there was an association between risk engagement as it pertains to overall executive functioning, data were analyzed using Pearson Product-Moment correlation coefficient (r). An ANOVA analysis was conducted to determine the exact p value. The multiple regression analysis revealed that that higher levels of executive functioning were not significantly correlated with risk engagement (β = .062, R2 = .004, p =.563, N = 89). Further, Cronbach alpha’s for the risk engagement scale and the executive functioning scale were .84 and .95 respectively. Table 1 illustrates the regression analysis between executive functioning and risk engagement (see Figure 1 for a scatterplot of the individuals ‘risk perception and executive functioning values).
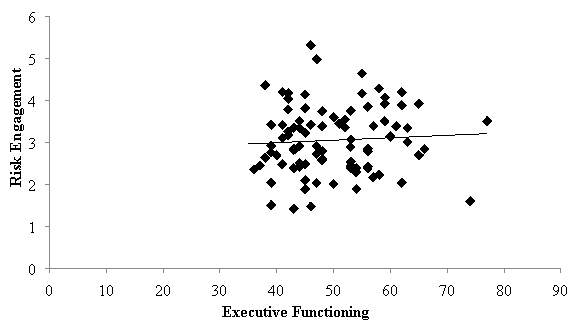
Figure 1. The relationship between risk engagement and executive functioning.
Table 1
|
Intercorrelation of Scores on the Risk Engagement Scale (RES) and Executive Functioning (EF) |
| EF | RES | |
| EFa | —- | |
| RESb | .062 | —- |
Note. N = 89.
a. Executive Functioning
b. Risk Engagement Scale
**p < .001
Hypothesis 2 proposed that levels of executive functioning (as determined by the BRIEF-A) would be correlated with risk perception (as determined by the DOSPERT). A multiple regression model was conducted to determine is risk perception (dependent variable) would be predicted from executive functioning levels (independent variable). In order to determine if there was an association between risk perception as it pertains to overall executive functioning, data were analyzed using Pearson Product-Moment correlation coefficient (r). An ANOVA analysis was conducted to determine the exact p value. The multiple regression analysis revealed that that higher levels of executive functioning were not significantly correlated with risk perception (β = -.106, R2 = .011, p=.319, N = 90). Further, Cronbach alpha’s for the risk perception scale and the executive functioning scale were .88 and .95 respectively. Table 2 illustrates the regression analysis between executive functioning and risk perception (see Figure 2 for a scatterplot of the individuals’risk perception and executive functioning values).
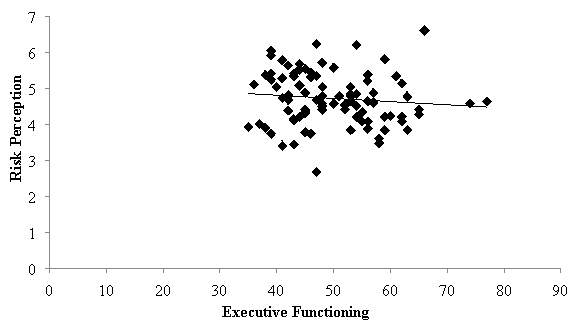
Figure 2. The relationship between exeutive functioning and risk perception.
Table 2
|
Intercorrelation of Scores on the Risk Perception Scale (RPS) and Executive Functioning (EF) |
| EF | RPS | |
| EFa | —- | |
| RPSb | -.106 | —- |
Note. N = 90.
a. Executive Functioning
b. Risk Perception Scale
**p < .001
In addition to the above predictor and outcome variables, one moderator variable: gender, was considered. This moderator variable was used to measure the extent to which the relationships between risk activities/behaviors and individual executive functioning as well as risk perception and individual executive functioning was influenced by a secondary factor. Hypothesis 3 suggested that the correlation between executive functioning (as determined by the BRIEF-A) and risk engagement (at determined by the DOSPERT) would be moderated by participant gender. Variables selected included executive functioning as the independent variable, risk engagement as the dependent variable, and gender as the moderator variable. To determine whether or not the correlation between levels of executive functioning and risk perception were influenced by a secondary factor, a multiple regression analysis was conducted moderated by gender. Results indicated that gender did not moderate the correlation between executive fucntioing and risk engagement (r(88) = -.091, p = .397) as depicted in Table 3.
Table 3
|
Intercorrelation of Scores on the Risk Engagement Scale (RPS) and Executive Functioning (EF) Moderated by Gender (G) |
| EF | RES | G | |
| EFa | —- | ||
| RESb | .062 | —- | |
| Gc | .073 | -.091 | —- |
Note. N = 90.
a. Executive Functioning
b. Risk Engagement Scale
c. Gender
**p < .001
Hypothesis 4 proposed that the correlation between executive functioning (as determined by the BRIEF-A) and risk perception (at determined by the DOSPERT) would be moderated by participant gender. To determine whether or not the correlation between levels of executive functioning and risk engagement were influenced by a secondary factor, a multiple regression analysis was conducted moderated by gender. Variables selected included executive functioning as the independent variable, risk perception as the dependent variable, and gender as the moderator variable. Similarly to the previous analysis using risk engagement as the independent variable, age did not moderate the correlation between executive functioning and risk perception (r(89) = -.101, p = .348 as depicted in Table 4.
Table 4
|
Intercorrelation of Scores on the Risk Perception Scale (RPS) and Executive Functioning (EF) Moderated by Gender (G) |
| EF | RPS | G | |
| EFa | —- | ||
| RPSb | -.106 | —- | |
| Gc | .073 | -.101 | —- |
Note. N = 90.
a. Executive Functioning
b. Risk Perception Scale
c. Gender
**p < .001
Discussion
This study proposed to identify relationships between individual executive functioning levels, perceived risk of behaviors, and level of risk taking. Additionally, this study proposed to identify any potential correlation between participant sex, perceived risk of behaviors, level of risk taking, and executive functioning. Four hypotheses were proposed:
Hypothesis 1: Levels of executive functioning (as determined by the BRIEF-A) will be correlated with risk engagement.
Hypothesis 2: Levels of executive functioning (as determined by the BRIEF-A) will be correlated with risk perception (as determined by the DOSPERT).
Hypothesis 3: The correlation between executive functioning (as determined by the BRIEF-A) and risk engagement (at determined by the DOSPERT) will be moderated by participant gender.
Hypothesis 4: The correlation between executive functioning (as determined by the BRIEF-A) and risk perception (at determined by the DOSPERT) will be moderated by participant gender.
Results indicated null hypotheses for hypothesis 1 and 2. One possibility for these results may have been that this study viewed executive functioning in it’s broadest definition. Future research may consider exploring the vareious elements of executive functioning including but not limited to: self-regulation skills of judgement, planning, focusing attention, etc.
Furthermore, results indicated null hypoetheses for hypothesis 3 and 4. Correlations were not significantly moderated by gender. A substantial amount of research suggests that males are more likely to engage in risk behaviors than females (Byrnes et al., 1999, Weber et al., 2002, Weber and Blais 2002, Johnson et al., 2004). Future research should consider exploring directional relationships between gender differences. A potential limitation of the study is that the genders of the sample size used for this study was skewed in that a large percentage of participants were female (f = 63%, m = 7.1%, decline to state 29.9%). Due to the skewed data, results were not reflective of comprehensive gender sample.
A larger sample size may be more likely to demonstrate a significant correlation effect. Further research in this area should consider expand participant sample size. Additional strategies (MTURK flyers, classrooms, etc.) for recruiting participants may also be beneficial to assist in the development of a larger, more varied population.
Additionally, a second limitation focuses on the exclusion of additional moderator variables such as age. Past research has indicated that engagement in risk behavior changes over time as age increases (Blais & Weber, 2006; Kulbok & Cox, 2002; Shulman & Cauffman, 2013). Further exploration in this area may be more telling in regards to risk engagement and perception over time as age increases which in turn, may correlate with the development of an individual’s executive functioning over time.
A limitation of the study is that the predictor and dependent variables were measured as subjects’ perceptions, not actual behaviors. In essence, the study does not address actual participation in self-directed behaviors. In order to gain a complete understanding of participant risk taking, it is necessary to conduct a study that examines all aspects of individual risk-taking, perception, and executive functioning. Additionally, the subject matter of the research collected (risk engagement and perception) may have created participant bias, reactivity, or social desirability.
Future research may consider evaluating additional measurement tools to assess executive functioning, risk behavior, and risk perception. Researchers may also consider examining real-life self-directed behaviors to assess for risk engagement and/or executive functioning. Additionally, it may be helpful to approach this research in a categorical fashion. This may be done by considering the various domains of risk taking and risk perception (e.g. ethical, financial, health/safety, social, or recreational) individually as well as the various functions housed within an individual’s executive functioning.
REFERENCES
REFERENCES
American Psychological Association. (2010). Ethical principles of psychologists and code of conduct. Retrieved from http://www.apa.org/ethics/code/4
Anderson, J.R. (2015). Cognitive psychology and its implications, New York, NY: Worth Publishers.
Aronson, E. (1992). The return of the repressed: Dissonance theory makes a comeback. Psychological Inquiry, 3, 303-311. Retrieved from http://www.apa.org/pubs/databases/psycinfo/
Baumgartner, S. E., Valkenburg, P. M., & Peter, J. (2010). Assessing causality in the relationship between adolescents’ risky sexual online behavior and their perceptions of this behavior. Journal of Youth Adolescence, 39, 1226-1239. doi:10.1007/s10964-010-9512-y
Blais, A. R., & Weber, E. U. (2006). A domain specific risk-taking scale for adult populations. Judgment and Decision Making, 1, 33-47. Retreived from http://www.apa.org/pubs/databases/psycinfo/
Byrnes, J. P., Miller, D. C., & Schafer, W. D. (1999). Gender differences in risk taking: A meta-analysis. Psychological Bulletin, 125, 367-383. doi:10.1037/0033-2909.125.3.367
Ciszewski, S., Francis, K., Mendella, P., Bissada, H., & Tasca, G. A. (2014). Validity and
reliability of the Behavior Rating Inventory of Executive Function – Adult Version in a clinical sample with eating disorders. Eating Behaviors, 15, 175-181. doi:10.1016/j.eatbeh.2014.01.004
Cohen, J. (1988). Statistical power analysis for the behavioral sciences (2nd ed.). Hillsdale:
L. Erlbaum Associates.
Ettenhofer, M. L., Hambrick, D. Z., & Abeles, N. (2006). Reliability and stability of executive functioning in older adults. Neuropsychology, 20, 607-613. doi:10.1037/0894-4105.20.5.607
Faul, F., Erdfelder, E., Buchner, A., & Lang, A.-G. (2009). Statistical power analyses using G*Power 3.1: Tests for correlation and regression analyses. Behavior Research Methods, 41, 1149-1160. Retreived from http://www.gpower.hhu.de/en.html
Festinger, L. (1957). A theory of cognitive dissonance, Evanston, IL: Row & Peterson.
Gioia, G. A., Isquith, P. K., Guy, S. C., Kensworthy, L. (2000). Test Review: Behavior Rating Inventory of Executive Function. Child Neuropsychology, 6, 235-238. doi:10.1076/chin.6.3.235.3152
Gioia, G. A., Isquith P. K., Retzlaff, P. D., Epsy, K. A. (2002). Confirmatory factor analysis of the Behavior Rating Inventory of Executive Function (BRIEF) in a clinical sample. Child Neuropsychology. 8, 249-257. doi:10.1076/chin.8.4.249.13513
Hanoch, Y., Johnson, J. G., & Wilke, A. (2006). Domain specificity in experimental measures and participant recruitement: An application to risk-taking behavior. Psychological Science, 17, 300-304. Retrieved from http://www.apa.org/pubs/databases/psycinfo/
Harrison, J. D., Young, J. M., Butow, P., Salkeld, G., & Solomon, M. J. (2005). Is it worth the risk? A systematic review of instruments that measure risk propensity for use in the health setting. Social Science & Medicine, 60, 1385-1396. doi:10.1016/j.socscimed.2004.07.006
Johnson, J. G., Wilke, A., & Weber, E. U. (2004). Beyond a trait view of risk-taking: A domain-specific scale measuring risk perceptions, expected benefits, and perceived-risk attitude in German-speaking populations. Polish Psychological Bulletin, 35, 153-172. Retrieved from https://www8.gsb.columbia.edu/sites/decisionsciences/files/files/germandospert.pdf
Kelley, A. E., Schochet, T., & Landry, C. F. (2004). Risk taking and novelty seeking in adolescence: Introduction to part I. Adolescent brain development: Vulnerabilities and opportunities 1021, 27-32. doi: 10.1196/annals.1308.003
Kulbok, P. A., & Cox, C. L. (2002). Dimensions of adolescent health behavior. Journal of Adolescent Health, 31, 394-400. doi:10.1016/S1054-139X(02)00422-6
Lezak, M. D. (1995). Neuropsychological assessment, (3rd ed.). Oxford, NY: Oxford University Press.
Luria, A.R. (1996). Higher coritical functions in man, (2nd et.). NewYork: Basic Books.
Mangeot, S., Armstrong, K., Colvin, A. N., Yeates, K. O., Taylor, H. G. (2002). Long term executive functioning deficits in children with traumatic brain injuries: Assessment using the Behavior Rating Inventory of Executive Function (BRIEF). Child Neuropsychology, 8, 271-284. doi:10.1076/chin.8.4.271.13503
Pharo, H., Sim, C., Graham, M., Gross, J., & Hayne, H. (2011). Risky business: Executive function, personality, and reckless behavior during adolescence and emerging adulthood. Behavioral Neuroscience, 125, 970-978. doi:10.1037/a0025768
Romer, D. (2010). Adolescent risk taking, impulsivity, and brain development: Implications for prevention. Developmental Psychobiology, 52, 263-276. doi:10.1002/dev.20442
Roth, R. M., Isquith, P. K., & Gioia, G. A. (2005). Behavior Rating Inventory of Executive Function – Adult Version (BRIEF-A). Lutz, FL: Psychological Assessment Resources.
Roth, R. M., Lance, C. E., Isquith, P.K., Fischer, A. S., Giancola, P. R. (2013). Confirmatory factor analysis of the Behavior Rating Inventory of Executive Function – Adult Version in healthy adults and application to Attention-Deficit/Hyperactivity Disorder. Archives of Clinical Neuropsychology, 28, 425-434. doi:10.1093/arclin/act031
Shulman, E. P., & Cauffman, E. (2014). Deciding in the dark: Age differences in intuitive risk judgment. Developmental Psychology, 50, 167-177. doi:10.1037/a0032778
Sparrow, S. S., & Davis, S. M. (2000). Recent advances in the assessment of intelligence and cognition. Journal of Child Psychology and Psychiatry, 41, 117-131. doi:10.1111/1469-7610.00552
Stanford, M. S., Greve, K. W., Bourdreaux, J. K., Mathias, C. W., & Brumbelow, J. L. (1996). Impulsiveness and risk-taking behavior: Comparison of high-school and college students using the Barratt Impulsiveness Scale. Personality and Individual Differences, 21, 1073-1075. doi:10.1016/S0191-8869(96)00151-1
Steinberg, L. (2008) A social neuroscience perspective on adolescent risk-taking. National Instituteof Health Public Access, 28, 78-106. doi:10.1016/j.dr.2007.08.002
Weber, E. U., Blais, A.-R., & Betz, N. E. (2002). A domain-specific risk-attitude scale:
Measuring risk perceptions and risk behaviors. Joural of Behavioral Decision Making, 15, 263-290. doi:10.1002/bdm.414
APPENDICES
APPENDIX A
The Behavior Rating Inventory of Executive Function-Adult version is a standardized rating scale developed to provide a glimpse into daily behaviors associated with specific domains related to an individual’s executive functioning in adults between the ages of 18-90 years. The BRIEF-A assessment consists of a short demographic questionnaire assessing gender, age, date of birth, years of education, and level of education. For the purposes of this study, gender and age responses will be recorded for use as two moderator variables. The BRIEF-A also include a self-report form. The self-report form contains 75 items divided into nine clinical scales: inhibitory, shift, emotional control, self-monitor, initiate, working memory, plan/organize, task monitor, and organization. These scales measure individual repots of difficulty related to executive functioning.
Instructions for the assessment invite the participant to identify any problems with scale items over the past month. Each participant will be asked to complete all items to the best of his/her ability. Participants will indicate his/her responses by circling the letter N if the specific behavior has never been a problem in the past month, circling the letter S if the specific behavior has sometimes been a problem in the past month, or O if the specific behavior has often been a problem in the past month. Due to copyright laws, a copy of the scale cannot be provided for review. Scale sample items include: I make inappropriate sexual comments, I don’t pick up after myself, and I have unrealistic goals.
Each scale is measured using a 3 point Likert rating scale ranging from “never”, “sometimes”, and “often”. The Global Executive Composite (GEC) scale reflects the overall executive functioning of an individual. For the purposes of this student, the GEC will be computed to yield an overall score of executive functioning. The measurement will be accessible online with a link provided by the measurement publisher.
APPENDIX B
Domain-Specific Risk-Taking (Adult) Scale – Risk Taking
For each of the following statements, please indicate the likelihood that you would engage in the described activity or behavior if you were to find yourself in that situation. Provide a rating from Extremely Unlikely to Extremely Likely, using the following scale:
- Admitting that your tastes are different from those of a friend. (S)
- Going camping in the wilderness. (R)
- Betting a day’s income at the horse races. (F/G)
- Investing 10% of your annual income in a moderate growth diversified fund. (F/I)
- Drinking heavily at a social function. (H/S)
- Taking some questionable deductions on your income tax return. (E)
- Disagreeing with an authority figure on a major issue. (S)
- Betting a day’s income at a high-stake poker game. (F/G)
- Having an affair with a married man/woman. (E)
- Passing off somebody else’s work as your own. (E)
- Going down a ski run that is beyond your ability. (R)
- Investing 5% of your annual income in a very speculative stock. (F/I)
- Going whitewater rafting at high water in the spring. (R)
- Betting a day’s income on the outcome of a sporting event (F/G)
- Engaging in unprotected sex. (H/S)
- Revealing a friend’s secret to someone else. (E)
- Driving a car without wearing a seat belt. (H/S)
- Investing 10% of your annual income in a new business venture. (F/I)
- Taking a skydiving class. (R)
- Riding a motorcycle without a helmet. (H/S)
- Choosing a career that you truly enjoy over a more secure one. (S)
- Speaking your mind about an unpopular issue in a meeting at work. (S)
- Sunbathing without sunscreen. (H/S)
- Bungee jumping off a tall bridge. (R)
- Piloting a small plane. (R)
- Walking home alone at night in an unsafe area of town. (H/S)
- Moving to a city far away from your extended family. (S)
- Starting a new career in your mid-thirties. (S)
- Leaving your young children alone at home while running an errand. (E)
- Not returning a wallet you found that contains $200. (E)
Note. E = Ethical, F = Financial, H/S = Health/Safety, R = Recreational, and S = Social.
Domain-Specific Risk-Taking (Adult) Scale – Risk Perceptions
People often see some risk in situations that contain uncertainty about what the outcome or consequences will be and for which there is the possibility of negative consequences. However, riskiness is a very personal and intuitive notion, and we are interested in your gut level assessment of how risky each situation or behavior is.
For each of the following statements, please indicate how risky you perceive each situation. Provide a rating from Not at all Risky to Extremely Risky, using the following scale:
- Admitting that your tastes are different from those of a friend. (S)
- Going camping in the wilderness. (R)
- Betting a day’s income at the horse races. (F/G)
- Investing 10% of your annual income in a moderate growth diversified fund. (F/I)
- Drinking heavily at a social function. (H/S)
- Taking some questionable deductions on your income tax return. (E)
- Disagreeing with an authority figure on a major issue. (S)
- Betting a day’s income at a high-stake poker game. (F/G)
- Having an affair with a married man/woman. (E)
- Passing off somebody else’s work as your own. (E)
- Going down a ski run that is beyond your ability. (R)
- Investing 5% of your annual income in a very speculative stock. (F/I)
- Going whitewater rafting at high water in the spring. (R)
- Betting a day’s income on the outcome of a sporting event (F/G)
- Engaging in unprotected sex. (H/S)
- Revealing a friend’s secret to someone else. (E)
- Driving a car without wearing a seat belt. (H/S)
- Investing 10% of your annual income in a new business venture. (F/I)
- Taking a skydiving class. (R)
- Riding a motorcycle without a helmet. (H/S)
- Choosing a career that you truly enjoy over a more secure one. (S)
- Speaking your mind about an unpopular issue in a meeting at work. (S)
- Sunbathing without sunscreen. (H/S)
- Bungee jumping off a tall bridge. (R)
- Piloting a small plane. (R)
- Walking home alone at night in an unsafe area of town. (H/S)
- Moving to a city far away from your extended family. (S)
- Starting a new career in your mid-thirties. (S)
- Leaving your young children alone at home while running an errand. (E)
- Not returning a wallet you found that contains $200. (E)
Note. E = Ethical, F = Financial, H/S = Health/Safety, R = Recreational, and S = Social.
APPENDIX C
Online Informed Consent
Dear Participant:
You are being asked to participate in a research project that is being done to fulfill requirements for a Master’s degree in Psychology at CSU Stanislaus. We are examining relationships among executive functioning, behavior, and perception. If you decide to volunteer, you will be asked to participate in three questionnaires. The procedure may take up to one hour to complete.
There is no cost to you beyond the time and effort required to complete the procedure(s) described above. It is possible that you will not benefit directly by participating in this study. However, possible benefits include the fact that you may learn something about how research studies are conducted and you may learn something new about this area of research. Your participation in this study does entitle you to a chance to win one of two $50 gift cards. Students recruited via the psychology department’s online subject pool (http://csustan.sona-systems.com/) will have the opportunity to receive extra credit for their participation.
You are free to discontinue your participation at any time without penalty. You may also skip any survey questions that make you feel uncomfortable. If you withdraw from the study, you are entitled to an amount proportional to the amount of the study you complete. Your participation is voluntary. Refusal to participate in this study will involve no penalty or loss of benefits. You may also withdraw at any time without penalty or loss of benefits.
All data from this study will be kept from inappropriate disclosure and will be accessible only to the researchers and their faculty advisor. Data collected online will be stored on a password-protected website and de-identified for analyses. Data collected in person will be kept in a locked file cabinet, separate from consent forms, and all materials will be destroyed after 3 years. The researchers are not interested in anyone’s individual responses, only the average responses of everyone in the study.
The present research is designed to reduce the possibility of any negative experiences as a result of participation. Risks to participants are kept to a minimum. However, if your participation in this study causes you any concerns, anxiety, or distress, contact the Stanislaus County Mental Health Services by phone (209) 525-6247 or online at www.stanislausmhsa.com. For individuals attending California State University, Stanislaus, you may also contact the University Student Counseling Center by phone at (209) 667-3381.
If you have any questions about your rights as a research participant, you may contact the Chair of the Psychology Institutional Review Board of California State University Stanislaus, Dr. Kelly Cotter, at kcotter@csustan.edu or (209) 664-4432.
This research study is being conducted by Jordan Rushing. The faculty supervisor is Dr. Dawn Strongin, Professor, Department of Psychology and Child Development. If you have any questions about this research project please contact me, Jordan Rushing, at (209) 996-1983 or my faculty sponsor, Dr. Dawn Strongin at (209) 667-3562. You may obtain information about the outcome of the study at the end of the academic year by contacting Dr. Strongin.
Sincerely,
Jordan Rushing
Jarushing1@yahoo.com
If you are at least 18 years of age and agree to participate, please indicate this decision below:
I have read and understand the information provided above. All of my questions, if any, have been answered to my satisfaction. Please type your name and date below. By clicking “I agree to participate” you are indicating that
• You have read the above information
• You voluntarily agree to participate in this study
• You are 18 years of age or older
Please print a copy of this form to keep for your records.
APPENDIX D
Online Debriefing Form
Dear Participant:
Thank you for participating in our study. We are interested in learning how an individual’s level of executive functioning influences an individual’s engagement in and perception of risk behavior. Each participant’s level of executive functioning will be determined using the results from the Behavior Rating Inventory of Executive Function –Adult (BRIEF-A). Individual levels of executive functioning will be compared to results obtained from both the risk-taking scale and the risk-perception assessments in the Domain-Specific Risk-Taking Scale (DOSPERT). We have reason to believe that an individual’s level of executive functioning is associated with an individual’s perception of risk behavior and engagement in risk behavior. We also predict that an individual’s gender is associated with the relationship between executive functioning and risk engagement and risk behavior respectively.
All information collected in this study will be kept safe from inappropriate disclosure, and there will be no way of identifying your responses in the data archive. Our measures of executive functioning information cannot be used to diagnose or treat any disease or medical condition. Furthermore, we are not interested in anyone’s individual responses; rather, we want to look at the general patterns that emerge when all of the participants’ responses are put together. We ask that you do not discuss the nature of the study with others who may later participate in it, as this could affect the validity of our research conclusion.
If you have any questions about your rights as a research participant, you may contact the Chair of the Psychology Institutional Review Board of California State University Stanislaus, Dr. Kelly Cotter, at kcotter@csustan.edu or (209) 664-4432.
If participating in the study caused you any concern, anxiety, or distress, you may contact the Stanislaus County Mental Health Services by phone (209) 525-6247 or online at www.stanislausmhsa.com. For individuals attending California State University, Stanislaus, you may also contact the University Student Counseling Center by phone at (209) 667-3381.
Thank you again for your participation. If you would like more information about this study, please contact Jordan Rushing at (209) 996-1983.
Sincerely,
Jordan Rushing
Jarushing1@yahoo.com
If you are interested in learning more about this research topic, we recommend the following references:
Blais, A.-R., & Weber, E. U. (2006). A domain specific risk-taking scale for adult populations. Judgment and Decision Making, 1, 33-47. Retrieved from http://www.apa.org/pubs/databases/psycinfo/
Steingburg, L. (2008) A social neuroscience perspective on adolescent risk-taking. National Institute of Health Public Access, 28, 78-106. doi:10.1016/j.dr.2007.08.002
Cite This Work
To export a reference to this article please select a referencing stye below:
Related Services
View all


Related Content
All TagsContent relating to: "Risk Management"
Risk Management is a process for identifying, understanding and mitigating any risks that are associated with a particular task or event. Individuals and organisations implement Risk Management to provide a layer of protection, allowing them to minimise risk in their operations.
Related Articles

DMCA / Removal Request
If you are the original writer of this dissertation and no longer wish to have your work published on the UKDiss.com website then please: