Proposal for a System to Extract Table Data from PDFs
Info: 10434 words (42 pages) Dissertation
Published: 20th Jan 2022
Tagged: Computing
1) Introduction
The PDF (Portable Document Format) is the most preferred format used for presenting, exchanging and sharing documents in ‘read-only’ content over the Web. The PDF format was initially developed by Adobe and is now maintained by International Standards Organization [1]. It preserves all the data in the original version and is one of the most trusted application used widely for document sharing due to its authenticity. It also has a variety of other features which can keep the document password protected and enables the addition of a digital signature. But this printable format version has a major disadvantage; the extraction of text content with structure is indeed a difficult task due to availability of very little structural and tagged information [4].
A significant amount of progress has been made over the last decade on the automated extraction of text content from PDF. Many open source PDF rendering libraries like PDFMiner [7], Poppler [8] are popular for extracting texts from PDF.
Tables are one of the most optimal ways of representing and understanding information in any type of document. They are universally used everywhere and does not have a detailed standard format for representation, especially in PDF. A table can be easily identified by humans. But it’s indeed difficult for machines to detect and interpret the tables in a similar manner as humans do. PDF was initially developed for display purposes and it’s actually a mixture of texts, vector graphics and binary representations partially built upon the Postscript language [20]. Due to the layout oriented aspect of the Postscript which focuses upon human readability, the complexity increases in machine readability [45]. The PDF to Microsoft Word converters available online can convert an entire document with a good accuracy. However, detection of tabular data contained within the document and extracting it into a machine readable/interpretable format still remains a big challenge.
1.1) Problem Domain
Table Detection and Extraction
Table extraction is one of the most difficult types of data extraction from PDF documents in the field of document analysis since there can be a variety of table formats which can be presented in PDF documents. Making a generalized method for automated extraction of all types of tables is a difficult and complex job at the present time. There are many open source tools as well as commercial software which converts PDF to Word format without losing colour, shapes, fonts of the original PDF documents. These applications do not specifically extract tables but convert the entire page into Word format. PDF documents don’t have a table tag which makes it more challenging only to detect tables [18].There are very few open source tools as well as commercial applications which detect tables from PDF and extracts them into CSV format [11]. However, they heavily rely on heuristics of tables and sometimes fail to detect complex table such as the ones which have unruled structure and have no labelling to detect tables, which is generally the case in financial reports containing balance sheet tables.
Table Interpretation
Table interpretation simply means to recoup the significance of table structure.The PDF table detection and extraction applications, which are recently developed over the last decade are very useful for detection, recognition and extraction of the PDF tables and converting them to HTML, XML and Word format but very few approaches are available for table interpretation [4]. The semantic relation extraction in tabular structure itself is a broad area of research and there are different types of categorical interpretation not only related to the semantics of table but also directly relating to the table abstraction and the named entities appearing in a document. The row-wise entity relationship linking is something which is not yet being explored extensively and a novel structure of presenting in this relationship with respect to the financial table is shown in this thesis.
Financial Table Semantics
Different entities like public/private companies creating financial tabular representations generally follow common standards like IFRS/GAAP for business reporting, however, the visual aspects like font, colour, shapes of the document can easily differ significantly for each company. The visual cues displaying semantic representation which hold the semantics of calculated fields do not necessarily convey a pattern between mutual row entities as the visual aspects appear and manual verification is required to actually see the semantics holding it.These variations make it difficult since there cannot be a standard way of representing a financial document. The above-presented problem of the financial table is discussed in detail in section 4.5.1.
1.2) Aim and Motivation
Aim
The aim of this project is to create a machine processable/readable hierarchical structure from the tables present in the financial reports in PDF documents. The extracted structure would retain the relationships between the table contents, which would be done by using the visual aspects (or features) like the colour of the font, font style and font size of the contents of the table.
Importance of extracting tables
Tables are one of the important ways of representing information but currently, they cannot be indexed and searched. The currently available search engines and algorithms do not provide an accurate ranking and searching options for tables [45]. Incorporation of semantics into table extraction and annotation [45] is required to search for a query related to the tables and also documents.
Why Financial spreadsheets?
XBRL (eXtensible Business Reporting Language) is used to characterize and trade business and monetary execution data. It is not mandatory for companies to publish its data using XBRL [53]. The tables have a tagged structure format for representation in XBRL. The XBRL will not guarantee company transparency [54] and the companies can still possibly hide their data in the form of footnotes even by using XBRL standards.
Therefore, PDF extraction holds a lot of value both for investors as well as the government to analyse this rich data available inside these PDF documents of the financial reports. Generally, data capture of financial tables from PDF is done manually which has higher turnaround time. Machine learning can be used to extract such rich tagged information which is a valuable asset and can be further extended to be used for predictive analytics.
The Gap
Most of the current software applications and tools available do not work for all types of tables in the PDF. It is due to the fact that there are many ways of representing tables. Therefore, they fail to give an accurate output over the extracted data sets. Even if a tabular content is extracted appropriately into a CSV (Comma Separated Value) format or any other standard format, there should be an implicit relationship between contents of the table. The colour of the text, size and type of text all carry significant information in the tabular representation. There are sometimes calculated fields inside the table which tally up to an overall sum or difference. They form merely a text editable version just presented in a CSV format. These difficulties increase substantially with non-standard and complex tabular format structures.
The use of the hierarchical structure can be used to determine the semantic relationships between different contents of the table and it can be represented in Microsoft Excel format by the formulation of this semantic relationship.
1.3) Proposed Solution
This project proposes a novel way for detecting tables from financial PDF documents and extracts the data from these tables to convert them into hierarchical tagged data structure format which retains the semantic relationship between the row entities.
The solution steps are as follows:
- Converting PDF elements into XML using PDF parser libraries and formation of ‘page-rows’ (‘page-row’ is defined in Section 2.)
- Removal of unwanted noise from the parsed PDF elements.
- Extracting features of every ‘page-row’ content and to classify paragraph sentences/non-tabular contents and table contents using unsupervised learning algorithm.
- Classification of headers, sub headers and other table row entities
- Considering other table row entities after the above classification as one single cluster.
- Using SHCA, Initially finding the breaking points in order to divide the single cluster into multi clusters with respect to breaking points and then converting these different clusters into a hierarchical tagged data structure format.
1.4) Thesis Contribution
The main contributions of this thesis are:
- Interpreting a table not only as a structured entity but also as a sequence
- Using unsupervised machine learning techniques to detect and extract tables from the parsed PDF contents.
- Introducing features for every row on a PDF page to carry out table detection and extraction.
- Creating a novel sequential hierarchical clustering algorithm exclusively for financial datasets to extract semantic relationship by creating a row-wise hierarchy for the financial tables.
1.5) Initial Hurdles
The proposed model in this thesis required labelled datasets for evaluation which had to be created manually for both table detection and table extraction. Creating this annotated data means a requirement of 1000s of manually labelled pages of financial PDF’s and for each row/sentence/line depicting whether they are part of a table or not, in order to follow a supervised approach. It would also require many gold standard datasets of hierarchical trees to compare with the predicted trees. Due to time constraints, this was not possible, and we thus follow an unsupervised approach and evaluate it on a sample of 3 tables, which was annotated manually including the hierarchical tree structures. This limited the outlook of evaluation and as well as creating or extensively exploring better models using supervised learning instead of unsupervised learning approaches only.
1.6) Thesis Layout
The thesis has 7 sections:
- The next section gives a brief detail of some preliminaries and terms used throughout this thesis. Also, a detailed information of interpretation of tables by human cognition and its relation to the features considered for this project is explained in that section.
- Section 3 gives a literature review on state of the art techniques as well as on some of the technical aspects of the table extraction.
- Section 4 discusses the proposed model and detailed implementation of every step, the difficulties involved and how they have overcome and also a brief on the alternatives for the limitations of every step.
- Section 5 explores the examples used for this project and also discusses the results obtained with the help of a proposed model.
- Section 6 focuses on discussion of the results obtained in section 5 and possible improvements which can be carried out to improve upon the results.
- Section 7 discusses the future extensions of this work and the areas where it can be improved upon.
- Section 8 concludes the thesis with the learnings and the contribution to the state of the art and it is followed by an appendix.
2) Basic Preliminaries
This section covers the basic terms and definitions used in the project and a brief look at the table structure as well as how a human interprets the table. It also discusses the tree structure which we have used to represent the final hierarchical output.
2.1) Table Structure
One of the most recent accepted conceptual table format was proposed by Wang [3]. Wang briefly stated there are 4 types of formats inside a table: stub head, stub, box head and body. The box head separation and stub-head separations separate the tables into these 4 regions. Not every table would have all types of formats present. A table can also exist by even skipping one or more types of these formats.
- The stub-head contains headers for the stub column.
- The stub contains sub-headers and headers for the row.
- The box-head contains column headers and subheaders for the body.
- The body contains block and cell. The cell is an intersection of row and column in the body. A block is simply a group of cells.
The footnotes and sidenotes are defined as separate entities in addition to the above-mentioned formats existing in the table.They are as follows:
Footnote
In financial datasets, there might exist footnotes which are a part of the table but they refer to the subsection where the particular items are discussed in detail or some additional information needed to interpret the table.
Sidenote
In financial datasets, there might exist sidenotes generally at the left margin of page which are not actually a part of the table but they may refer to the rules and amendments of detailed information present in the table.
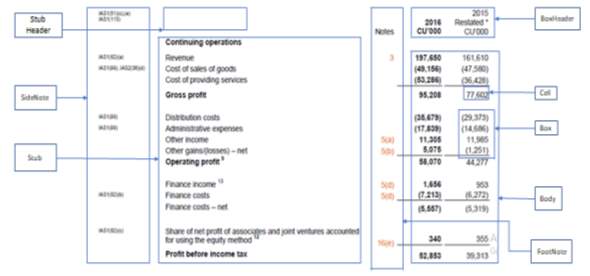
Figure 1: Table structure for a sample financial table
The above figure represents a financial table from the dataset, with few terms and definitions of labelled elements. The sidenote and footnote are just added as extra terminology in the basic table definition to give a broad view of explanation of the basic financial table structure.
Tables can be understood as a special kind of structure containing sequences of contents as well as possessing a hierarchy of contents column-wise at the same time. This hierarchy can consist of columns or rows, where a column can be divided into categories based on column values or a row can have a semantic relationship with other row and form a hierarchy of table contents.
Note on Financial Table
The values appearing in a bracket are negative values. Also, a hyphen ‘-’ is used to state no value present or not considered. We would be replacing such values with 0 for our simplicity while calculating the aggregates. This replacement of ‘-’ is only done for calculation purposes, and to be noted that it is not the value 0 but instead it just a representation for Null/None.
2.2) Issues with Conversion of PDF to text format for table extraction
The PDF to text conversion has advanced so much in recent times that they convert entire PDF documents along with tables into read-write format without missing on the visual attributes of the document. However, especially for tables, a simple text conversion syntactically does not convey the relationship of semantics structure. For example, a field like ‘Total’, used for depicting a sum/difference of row entities and has a mutual relationship between the table elements, is simply a number and do not hold much importance as a sum of all the numbers related to it. Moreover, these technologies only convert entire pages or any document given as input and do not detect and extract table structures separately.
2.3) Table interpretation by humans
A table is easily identified by humans, with just the help of some implicit visual and font formatting styles. A human being is able to perceive the contextual presence and a basic idea of even the most complex tables within minutes. Considering our case of financial tables, a variety of visual information is used in order to portray certain important notifications to an accountant. It may be highlighting a column by bold text in order to display a current year or only rectangular bold dashed lines in the entire table without grid structure just to depict the presence of total amount. Certain colour, font size, font colour, column highlighting are present in the table just to highlight information for certain prospects.
The reason the interpretations of the table by humans is briefly described because similar features inspired from the human interpretation is used in our algorithm to detect tables and also certain distinctive features used to convert the table structures into hierarchical tagged data structure format to enhance machine interpretability.
2.4) Definitions
The tool used to parse the PDF documents in this project is PDFMiner [7] which converts the entire given PDF document into XML format. Using the xml.etree [29] package, a list of the tagged elements is created. These tags are discussed in this section. Also, we discuss some common terms used throughout this thesis.
‘Textline’ tag: A textline consist of information of every letter of a word or sentence appearing in a particular part of sentence/table depending upon the structure of the page. A textline can also be interpreted as cluster of letters. A textline can be defined as a group of letters appearing in a textline tag.The textline tag list has 3 items, 1st represents the tag name, 2nd item corresponds to bounding box coordinates of the textline and 3rd item is a list of all the text information. Tag name and the bounding box are present in the form of a string, while text information is present in the form of list.
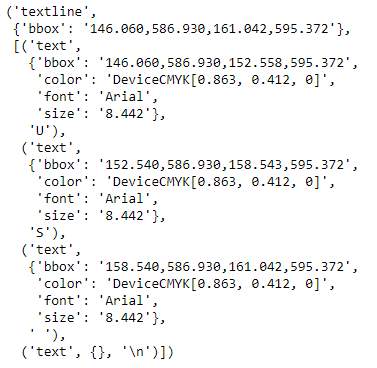
Figure 2: Contents in a textline tag
The above figure shows the contents of a textline of the word ‘US’ from the table of IFRS_30 (Refer Appendix 1) after being parsed. As seen from the figure, the bounding box coordinates of textline will be consisting of all the letters appearing inside it.
Textbox tag: A textbox is a group of textlines which forms a part of structure .A textbox is somewhat like a cluster of texlines as the textline appearing in particular textbox have similar characteristics.
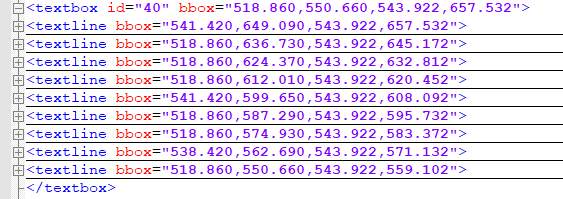
Figure 3: XML output of a textbox
Text tag: A text tag contains information of every letter within a textline . It carries the information font size, colour, font type in string format within a dictionary and also has information of bounding box coordinates of the list. Figure 3 has text information for a given textline. The first item in any text list is the tag word in string format followed bounding box of the corresponding letter, a dictionary of text information and the letter itself.
Besides XML also carries all the information which is related to the structure of the page. It has information of bounding boxes of various shapes, lines contained within the PDF.
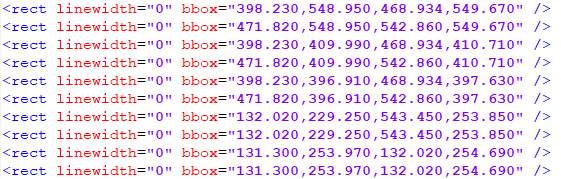
Figure 4: Information of different lines appearing within a PDF page
Layout: A layout in a pdfminer is a group of all the textgroups appearing together. A textgroup contains a group of textboxes which appear to form a group of the cluster. A layout can be imagined like a hierarchical structure which has textgroups in every level who have the same set of similarities.
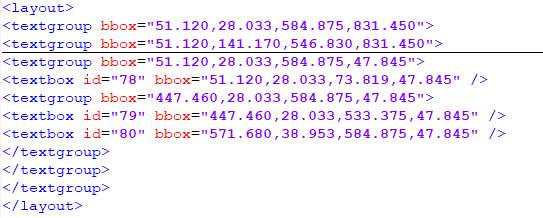
Figure 5: Layout Structure of XML output of PDFMiner
Figure 5 displays the layout structure. The bold line in between the centre of figure depicts that there are more elements inside the textgroup structure.
‘Page-row’: The ‘page-row’ term is used to represent any particular line of a row of words or sentences coming within a page. This term is used in order to differentiate it from the term ‘row’ which is also used for rows of tables. The ‘page-row’ concept and its importance are discussed in detail in section 4.
Cell: An intersection of a row and column of the table is called a cell.
The commercial Adobe Acrobat Pro [41] software was initially used to create PDF of individual pages. Then these example dataset pages are parsed using PDFMiner.
2.5) Limitations of the implemented algorithm
The thesis currently focuses only on a small number of various factors and is currently not generalised in many parts. Due to limited time and in order to show a working prototype of the followed approach, these generalisations were considered:
- Although the table detection was implemented, but since accuracy was not optimum, the tables were selected manually from the parsed PDF files for further processing.
- The header and contents of the table are separated manually.
- This project proposal is currently only used for pages written in a standard full-page format and not bi/tri adjacent paragraphs which are seen usually in scientific papers.
- The Sequential Hierarchical Clustering Algorithm which is proposed in this is limited only to financial tables currently, as it uses aggregation/summation of columns to guide the clustering.
2.6) Data Exploration
For this project, we used four different tables collected from different sources. Each table was selected in terms of the unique challenges it contains in order to test the algorithms efficiently.
As future work, we would be working on full automation of the system instead of feeding the input page-wise. The examples datasets are explained in detail in section 5.1.
2.7) Tree Representation and Visualisation
Newick Tree Format
The Newick tree format is one of the most widely used tree format structure mainly in the field of bioinformatics [31]. The Newick representation structures use simple parentheses to display a branch of a tree. The nodes come with an order which is presented in the hierarchical tree format. The bottom most branch is with the nodes present in the innermost parentheses.
Consider a simple example :
(‘(((a,c),b), (g, H)) ;
The above Newick tree structure is represented by:
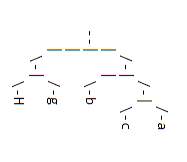
Figure 6: Example tree structure
In the above figure, it can be seen that the nodes coming in the innermost parentheses forms bottom most node in the structure and they are known as leaf nodes and they do not have any children. Trees can be considered as two types: rooted and unrooted. This is an example of the rooted tree and the topmost node is known as the root node. Unrooted trees have 2 or more children [31]. Generally, the table structures have unrooted trees.
2.8) Study of Table Semantics
Table interpretation can be broadly classified into functional representation and semantic representation [4]. The functional representation focuses upon the function of cells and its abstract relationships [4]. It is discussed in detail in sections 3.6 and 3.7. This section briefs on the study of the semantics of tables and its importance.
Semantic interpretation of table understands the semantics of elements appearing in the table, their traits with relating esteem and the mutual connection between the elements or different entities in a table [4].
The semantic table interpretation can be considered as the study of the following tasks [46]:
- To perceive the property of an idea that best portrays the information in a segment in a table.
- Recognizing the semantic relations between different entities.
- Disambiguation of content cells appearing in a table.
This thesis focuses on one semantic concept, which is to extract the relationship of mutual row entities appearing in a table.
2.9) Table as a sequence
Generally, the table is being viewed as a structured form of data with certain functional, graphical, structural and semantic rules governing it [5]. With the mutual entity relationship between the different rows, a tabular structure has the possibility to exist not only as a structured format but as a sequence as well. It may not be a rigid sequence but can be viewed in terms of positional aspects of the data points of a table appearing in specific substructures together and one particular data point appearing in a selected random substructure cannot be a part of another substructure. These substructures altogether can be viewed as different branches merging together to form a tree. Thus a table exists both as a hierarchical structure as well as a sequence.
3) Literature Survey
This section discusses briefly about the initial detection and table extraction techniques. It also discusses some of the current applications and their drawbacks.
3.1) Initial Table Extraction Systems
Yildiz [25] created one of the first full fledged applications of extracting tables from PDF documents. His system ‘pdf2table’ used pdftohtml software [52] and then used heuristics to determine table area.
He obtained a F-score of 92.33% in detecting tables and 85.42% in structural recognition.The pdf2table also offers a GUI in order to make any modifications to the extracted structures.
Pros: A semi auto extraction algorithm and a high F-score value.
Cons: May be prone to complex types of the table due to very strict heuristic rules.
Hassan [26] is one of pioneer researcher in the field of PDF document analysis. He used a Java based library PdfBox [17] for reading the PDF files. The PdfBox is similar to Poppler [8], PDFMiner and gives coordinates and attributes of texts and graphical objects in a PDF. Hassan broadly described three types of tables [11] (Horizontal ruled tables, vertically ruled tables and unruled tables) and uses a column finding algorithm [12] with a set of predefined rules for table recognition.
Evaluation: Hassan classified his evaluation of extracted tables depending on how accurate were the extracted elements into 4 types: fully understood, sufficiently understood, poorly understood and not recognized.
3.2) Table Extraction using Image Processing
Nurminen in his Master’s thesis [2] used a Poppler [8] PDF rendering library in C++ to extract the tabular data. He developed ‘Tabler’ with a GUI application to detect and extract tables from PDF documents. Nurminen used the coordinates of text positioning provided by Poppler to extract tabular data and converted PDF into an image format for detecting boundaries of tables, rows and columns inside the tables. Using certain heuristic rules and image segmentation techniques like horizontal edge detection and vertical edge detection, the rows and columns in the tables were detected. After finding the separator lines, the rectangular crossed lines are defined and each rectangular areas or cell are matched by equivalent row-column detection using heuristics. The output extracted data can be represented in the form of XML and HTML formats.
The problem with the Poppler rendering library back in 2013 was that it loses the information about font size colour and background colour. Therefore, for header detection, Nurminen stated certain heuristics based on rules on how to detect the column headers, row headers, title and captions super and sub headers.
3.3) Use of Graph Mining Techniques for PDF table Extraction
Ramel [12] initially described the contents of text elements in the form of a directed graph to find out the connected components in the table. Santosh [9] used graph mining techniques to derive semantic relationships between the data cells of the entire table or to a part of the table depending upon user’s requirements. The rows and columns form the nodes while edges of the graph represented by the values at a particular table value. He validated relations between neighbouring nodes and calculated score between a pair of nodes using relation assignments. Depending upon the client’s input requirements, the algorithm was able to extract possible attributed relationships. The technology was not dynamic and was based on knowledge based techniques. The relevant extraction based on client reviews was not evaluated. This algorithm was based on the use of OCR engine and can even be used on scanned documents.
3.4) Commercial and non-commercial PDF table detection and extraction applications
A brief overview of three different applications available on the internet for table detection and extraction is discussed in this section. There are many different applications available but these stand out from the rest in terms of concept and their accuracy.
3.4.1) Tabula
Tabula [15] is an open source application recently developed for detection and extraction of tables. It has a Graphical User Interface (GUI) and also it can be used as a library with prominent programming languages. Tabula also offers option for users to manually select tables. It converts PDF tables into CSV.
Tabula uses Apache PDFBox [17] in the background to generate XML file. It uses Hough Transform [43] technique to detect ruled lines of the table and output the data according to the position and uses several heuristics for detection and extraction with unruled line tables. It is currently being used by several prominent news organizations like Times of London, New York Times etc.
Pros: Simple to use GUI. Provides 2 different type of algorithms choices for extraction of table contents.
Cons: Tabula does not work with scanned images as well as with extremely complex datasets. Also, it does not take the details of font size, colour and background colour. Table detection is still done manually in the GUI.


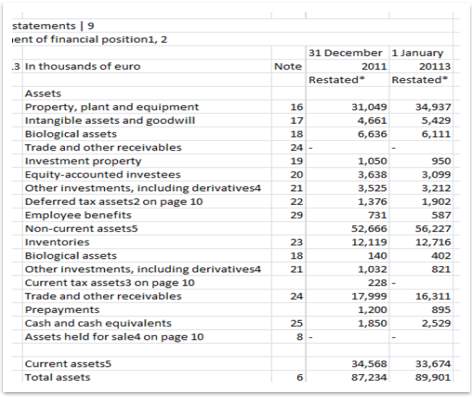
Figure 7: Tabula output
Figure 7 shows the output of a sample financial table from Tabula.Tabula works for a variety of range of table structures and comparatively gives a better output even with most complex types of table structures. However, the extracted data simply look like a text format and lose all the important semantic aspects like the total should have been a sum of current and noncurrent assets with certain visual implicit highlighting them. Certain words which are bold or having colour represent important information is ignored by Tabula.
3.4.2) Zanran
Zanran [16]: Zanran’s Xtractor is a commercial tool built for PDF extraction to various file formats. Its PDF table extraction technique is based on image segmentation and heuristics. The main advantage Zanran gives is it does not lose any visual implicit information. It retains font colour, size, type and background colour as well. However it only works for simple table structures.
Figure 8 represents the output for the same file used as input in Figure 7. Although Zanran keeps the visual implicit as well as the subscripts intact, it messes up the data. The extractions were extremely unrealistic and thus Zanran does not seem to be suitable for complex datasets especially for unruled tables.


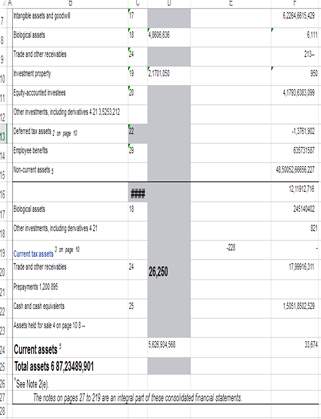
Figure 8:Zanran output
3.4.3) Tabstract
Tabstract [21] is a one of the latest product of Recognos launched in 2017. It claims to use feature extraction for extracting table elements and a deep neural network for table detection. Its use of deep learning is one of the first of kind of state of the art used in table detection. Tabstract classifies table into table and non table area lines using a deep neural network classifier.
The main advantage is that it is able to detect table area even for some complex tables where there are absolutely no ruled lines present and gives far better output than the other applications. Tabstract also claims to work with scanned PDF documents.
Figure 9 shows the table recgonition and extraction output by Tabstract. Tabstract’s output is similar to of Tabula. It was able to recognise the table rows and columns correctly although it had some problems with subscripts. The disadvantage of Tabstract is that it does not provide any information of font type, colour as well as the semantic relationship of the elements.
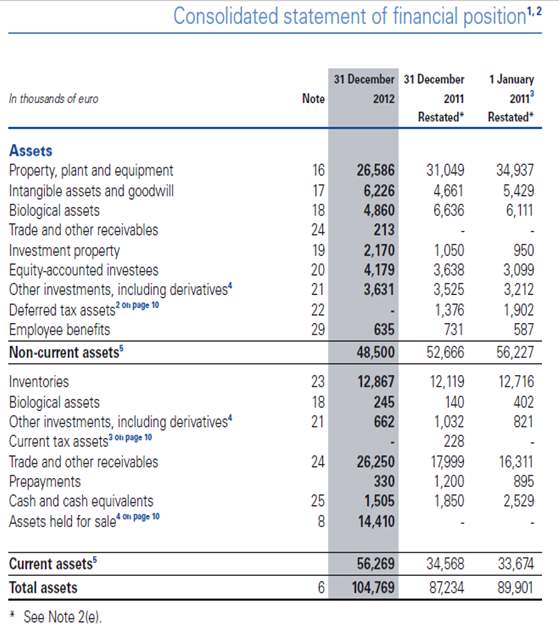
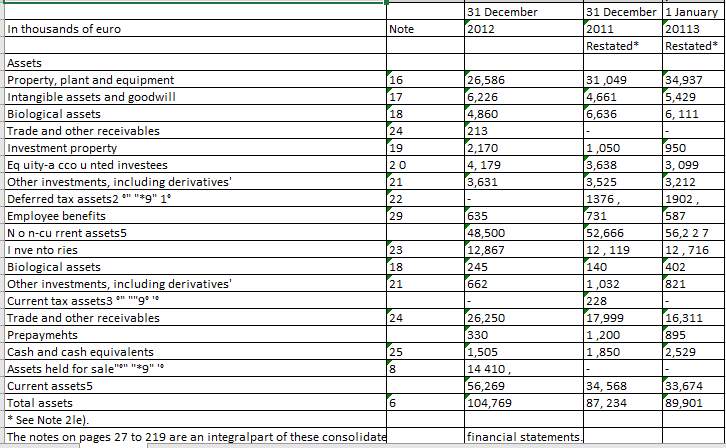
Figure 9: Tabstract output
3.5) Stanford Deepdive
Deepdive [24] is a system, developed by Christopher Le in Stanford University. It is used to extract specific structured data from the unstructured or the ‘dark’ data. Deepdive is a type of data management system integrated to carry out tasks all data processing tasks like extraction, integration and prediction under a single platform.
The motivation behind Deepdive which makes it stand out from other machine learning systems is that it asks the user interface to focus on features and features specifications, unlike the latter which focuses on the user interpretation on which type of machine learning or cluster algorithms to be used.
Following this work, we were motivated to focus more on the feature extraction of the documents in the project. Systems similar to ideas of Deepdive can be built to extract and tag financial line items from tabular structures of financial PDF documents.
3.6) Table understanding, abstraction and interpretation
Only a few research papers have stated the understanding and importance of table abstraction and focus on interpreting the relationship between contents present in the tabular structure. Peterman [9] in 1998 described 5 steps of extracting syntactic relationship of the elements of the data cells. Peterman characterized table understanding as an extraction of tabular content into a searchable form without losing relations between the texts inferred by the layout of the table.
Hurst in his PhD thesis [5] gave a detailed study of interpretation of the tables along with a method of evaluation of extracted tabular structures. He defined 4 types of table representation: physical, structural, functional and semantic and also derived a combination of 4 basic representations.
- The physical ontology representation is based on the way a table is rendered on a page. It gives the information of the relative positional coordinates of a cell.
- The functional representation states the table characteristics used to enhance the reading of a particular table.
- The structural ontology gives a brief overview of the information conveyed by the organisation of cell structure.
- The semantic ontology tries to derive the meaning of the representation, the meaning of metadata and the meaning conveyed by any of above ontologies.
Hurst further defined a set of definitions and rules in his paper [6] in 2006 to interpret the syntactic and semantic relationship of data cells in the tabular structure. It gives a structural indexing representation and also various kinds of understanding can be derived from the relationship of the cells in the table in order to identify the underlying categories present in those structures.
Most of the table detection and extraction use a combination of physical, functional and structural representation. Hassan mainly focuses upon the functional model in his paper [14]. Hassan uses access function relation IF to display unordered Cartesian relations between access and data cells. He also makes uses of dot notation to implicate the hierarchy in the table. He uses precision and recall metrics to evaluate the representation model. Precision, in this case, is defined by the ratio of a total number of correctly detected entities (access cell or data 8 cell) to the total number of entities (access cell or data cell). While recall here is defined as a total number of incorrectly detected entities (access cell or data cell) to the total number of entities (access cell or data cell).
3.7) Semantic Relationship of Table Contents and use of Linked Data
The above subsection gave the background about the functional aspects of the table. In this subsection, we look at some research papers focusing on semantic relations of the table.
Limaye [48] used factor graph model to annotate entities, types and relationship of table elements for web search. This entity relationship between the columns can be visualised in the form of a hierarchy of an individual element row.
Zyed [49] uses Linked Data concepts to represent the tables in the form of RDF (Resource Description Framework) structure format and uses knowledge base specific features to calculate relevance score in order to partially infer a semantic model representation of tables.
Zhang initially developed TableMiner [46] and then TableMiner+ [47] and his TableMiner claims to be the first table interpretation technique which works on partially seeded data by the table and then learns it by using bootstrapping and adapting recursively. Zhang also claims TableMiner to be the first technique which uses semantic markups like RDF to present contextual information of data outside the tables for table interpretation. TableMiner uses named entity recognition, a technique used in natural language processing, to use various types of contextual information both within as well as outside the table to carry out the task of classifying columns and also to disambiguate cells.
TableMiner+ [47] is an extension to proposed TablerMiner application which claims to improve annotation accuracy. TableMiner+ improves upon efficiency, effectiveness and completeness of semantic relationship in the table compared to its previous version. The NE (Named Entity) columns derive the relationship of all the NE’s as well as the literal column appearing in a table. TableMiner+ is also able to generate inference based upon the partial content of the table. TableMiner+ has a lot of scope of improvements as they presently only handle the binary relationship between Named Entities and columns. TableMiner+ explains the categorical column relationship in mutual entities but there is no information given about mutual row relationship appearing in the same table.
3.8) Most Recent Solution using PDFMiner
Perez [18] developed a ‘Table Organization’ (TAO) system for detection and extraction of tables from scientific papers. Perez used PDFMiner [7] for converting PDF to JSON format and then defined some heuristics for table detection.
These heuristics for table detection were developed by calculating Manhattan distances for each pair of textbox ID by considering their top left and bottom right distances. Since PDFminer gives the information character wise, again few more heuristics were used to reorganize the information of textboxes of pdf in form of rows and columns using heuristics.The proximity distances are saved in form of upper triangular matrix and then layout heuristics of column and row formation is done by checking their alignment.
For learning text IDs in the same column of a textline, a machine learning algorithm (kNN regression) was used to extract the table contents and then the classification of header and data based upon Boldness of the font. For machine learning 55 different types of fonts and 300 tables were considered for kNN regression. The header and content were separated based on the boldness of the headers.
Pros:
-Simple and robust
-One of the only known algorithms to the best of author’s knowledge to segregate headers and content based on font type.
Cons:
The table detection algorithm will not work if there are an additional indentation or alignment spacing textboxes.
The heuristics have fixed maximum threshold to identify rows and columns
Sometimes paragraph sentences can also be detected as separate tabular structures if they have side notes.
3.9) Row Feature Extraction in Tables
Fang [50] used a set of features for every row to describe the table content and then used machine learning techniques like SVM and Random Forest to detect the table headers. An estimated accuracy around 92% was obtained while detecting table headers.
Fang proposed features broadly for two types of categories single row features and neighbouring row features. Around 20 different features were proposed which were able to distinguish headers and other content data in the tables.
The proposed algorithm in our thesis is also constructed on feature extraction of row contents.
3.10) Hierarchial and Sequential Clusters
Rafsanjani [36] described clustering into 4 types: Hierarchical, Sequential, Clustering based on the cost function and ‘other’ where the group other types had specialized clustering algorithms like density based, genetic based, Branch and bound clustering algorithms.
As we discussed in Section 2.9 on how the tables can be understood both as a hierarchy and a sequence. In a table both hierarchies, as well as a sequence, holds importance.
The sequential clustering and hierarchical clustering have been used in clustering gene sequences into functional groups and are an important study in the field of bioinformatics [35].
Farran [36] used a small part of data to recursively construct a hierarchical and then using the rest of sequential of genes constructed adaptively while processing rest of gene sequences.
The use of partitional algorithm initially followed by agglomerative clustering has been used widely in the field of gene sequencing. Wei [35] proposed a new algorithm mBKM (which has its roots in partitional clustering) to create a hierarchy of gene sequences.
Abdel-Azim [38] proposed a hierarchical structuring algorithm based on ‘Hellinger’s Distance’ and defined a novel way of representing protein sequences using Probability Density Function (PDF).
3.11) Summary
3.11.1) Table Complexity and Current Technologies on Table Detection
The state of the art techniques evolved from using rule based learning for the extraction of tabular data-sets from PDF’s to the use of machine learning algorithms like Markov Random Fields to Deep Neural Network for table detection.
Many state-of-the-art technologies detect simple ruled tables easily. Using the physical geometrical structures most currently available software are able to detect and extract table data properly. However, a problem arises with unruled tabular structures. These structures are difficult to be detected even by the most recent applications but a generalisation of table techniques for all kinds of table complexities is now seemingly looking possible in the near future.
The PDF does not have a separate tag for representing tables. In order to even make proper alignment and great visual displays, the PDF formats may intentionally add additional spaces of different sizes even in between the rows of a particular column. These additional spaces cause more problems while detecting the layout of PDF formats using PDF libraries and that is why sometimes OCR formats can hold an advantage over regular PDF libraries while detecting table structures.
3.11.2) Table recognition and Extraction
Nurminen’s [2] image processing and edge detection based technique was one of the first applications to use image processing for table recognition. Table recognition and cell structure formation seem to be more efficient with image processing than the general heuristic building of rules. Table recognition and extraction still seem to be done using heuristics which although proves to be efficient for now. Perez [18] used kNN regression to learn the contents appearing in the same textline.
3.11.3) Retaining the semantic relationship
Few papers discuss the relationship of the cells of tables and how tables can be represented in a functional or a syntactic format. Limaye [49] were one of the first to create structured semantic representation to annotate entity relationships for information retrieval. There has been some focus upon semantic relationships for table contents and no table contents as well as the relations between two different entities appearing in two different tables. The table has always been viewed as a standard structural entity and even the relationships built are unidirectional in the form of categorical division of data with respect to columns. The possibility of the interdependence of row elements by the binding of column contents is well known but never being viewed in terms of semantic relationship. There might be a chance the appearance of visual structures may not infer the right structural format e.g. in the case of complex financial balance sheets.
Without this row-wise semantic relationships, the extraction of data elements of rows while converting tables from PDF and presented in CSV is actually similar to same data present in a Word format with the only advantage that you are able to view it properly in a spreadsheet than the latter.
Therefore in order to these conversion to hold a certain importance, A formulation needs to be displayed of how sequentially or semantically the elements are in relation to each other. A tabular structure has substructures and may have a hierarchical structure determining the syntactic relationship present in the table. Using hierarchical structures, the semantics of these relationships of row-wise elements can be retained.
3.11.4) Motivation from the clustering concepts used in Bioinformatics
One more important drawback of the state of the art techniques in determining semantic relationship is that they only view table just as a structure. Tables need to be viewed not only as a standard structure but also as a sequence of elements. Gene sequencing in bioinformatics is viewed both as a hierarchical structure as well as a sequence where the arrangement of genes also holds importance.
Many state-of-the-art algorithms for hierarchical clustering assume all data points as one single cluster, then divide the cluster based on the concepts of partitional clustering or similarity and iteratively use concepts of agglomerative clustering to build the hierarchical structure.
The proposed method in this thesis Sequential Hierarchical Clustering Algorithm (SHCA) exclusively for financial datasets is similar to hierarchical cluster concepts used in gene sequencing as discussed in section 3.8.
3.11.5) Evaluation for tables
There are many different metrics used for table detection/extraction evaluation in different research papers. Precision and recall are widely used metrics in the field of table analysis. The detailed information of these metrics are given in section 3.6.
However, the hidden assumption of these measurements is that the granularity of things at the output is the same as at input [3] which may not hold true for every type of table where there might be possibilities of cell merging and splitting.
One of the other standard evaluation metrics used in evaluating table recognition algorithms is completeness and purity [3]. Completeness defines the ratio of how many accurate tables are identified by a total number of ground truth tables. Purity represents the ratio of total correctly identified tables with respect to totally identified tables. Completeness highlights the problem on missed structures while purity is related whether two or structures are merged during extraction.
Completeness and purity are not used as evaluation metrics in this thesis since the evaluation of tree structure has to be carried out and the evaluation metrics were adopted from the field of bioinformatics (hierarchical tree creation of gene sequences).
9) References
1) “What is PDF? Adobe Portable Document Format | Adobe Acrobat DC”, Acrobat.adobe.com, 2017. [Online]. Available: https://acrobat.adobe.com/us/en/why-adobe/about-adobe-pdf.html .[Last Accessed 31st May 2017].
2) Nurminen Anssi. (2013). Algorithmic extraction of data in tables in pdf documents. Master’s Thesis. Tampere University of Technology.
3) Silva A. (2011). Metrics for evaluating performance in document analysis: application to tables. In: International Journal on Document Analysis and Recognition (IJDAR). Berlin Heidelberg: Springer . 101–109.
4) Hassan T, Oro E, Orsi G. (2013). ICDAR 2013 Table Competition. In: 12th International Conference on Document Analysis and Recognition.
5) Hurst M. (2000). The Interpretation of Tables in Texts. Phd Thesis. The University of Edinburgh.
6) Hurst M. (2006). Towards a theory of tables. International Journal of Document Analysis (2006). 8 (2), 123–131.
7) pdfminer 20140328 : Python Package Index, Pypi.python.org, 2017. [Online] Available: https://pypi.python.org/pypi/pdfminer/ . [Last accessed 1st June 2017].
8) Poppler. poppler.freedesktop.org, 2017. [Online] Available: https://poppler.freedesktop.org/ . [Last accessed 31st May 2017].
9) Santosh K, Belaïd A (2013). Pattern-Based Approach to Table Extraction. Berlin, Heidelberg: Springer. 766-773.
10) Peterman C, Chang CH, Alam H (eds). A system for table understanding. In: Proceedings of the symposium on document image understanding technology (SDIUT’97), 1997
11) Hassan T, Baumgartner R. (2007). Table Recognition and Understanding from PDF Files. Ninth International Conference on Document Analysis and Recognition (ICDAR 2007). 1143-1147.
12) Ramel J, Crucianu M, Vincent N, Faure C. (2003). Detection, Extraction and Representation of Tables. Proceedings of the Seventh International Conference on Document Analysis and Recognition (ICDAR’03). 1, 374-378.
13) O. Trainer, “Recognize text using optical character recognition – MATLAB ocr – MathWorks United Kingdom”, Uk.mathworks.com, 2017. [Online]. Available: https://uk.mathworks.com/help/vision/ref/ocr.html . [Accessed: 17- May- 2017].
14) Hassan T, Göbel M, Oro E, Orsi G. (2012). A Methodology for Evaluating Algorithms for Table Understanding in PDF Documents. 4–7.
15) Tabula. tabula.technology, 2017.[Online].Available: http://tabula.technology/ [Last Accessed 7 Jul. 2017]
16) Zanran. pdf.zanran.com, 2017. [Online] Available: https://pdf.zanran.com/extract-table-from-pdf [Last Accessed 27 May. 2017].
17) Apache PDFBox | A Java PDF Library, Pdfbox.apache.org, 2017. [Online]. Available: https://pdfbox.apache.org/. [Last Accessed 7 Jul. 2017]
18) O. Perez-Arriaga M, Estrada T and Abad-Mota S. (2017). TAO: System for Table Detection and Extraction from PDF Documents. Proceedings of the Twenty-Ninth International Florida Artificial Intelligence Research Society Conference.
19) Socher, Richard, Cliff C. Lin, Chris Manning, and Andrew Y. Ng. “Parsing natural scenes and natural language with recursive neural networks.” In Proceedings of the 28th international conference on machine learning (ICML-11), pp. 129-136. 2011..
20) Adobe.com. (2017). Adobe PostScript. [online] Available: http://www.adobe.com/products/postscript.html [Last Accessed 7 Jul. 2017].
21) Tabstract.Tabstract.io, 2017.[Online]. Available: https://www.tabstract.io/#/hello [Last Accessed 1 Aug 2017].
22) minecart 0.2 : Python Package Index, Pypi.python.org, 2017. [Online]. Available: https://pypi.python.org/pypi/minecart/0.2 .[Last Accessed 7 Jul. 2017].
23) New.myfonts.com. WhatTheFont! « MyFonts, 2017. [online] Available: http://new.myfonts.com/WhatTheFont . [Last Accessed 4 Jun. 2017].
24) Deepdive.stanford.edu. DeepDive, 2017. [online] Available at: http://deepdive.stanford.edu . [Last Accessed 3 Jul. 2017].
25) Burcu Yildiz, Katharina Kaiser, and Silvia Miksch pdf2table: A Method to Extract Table Information from PDF Files. Institute of Software Technology & Interactive Systems Vienna University of Technology, Vienna, Austria.
26) Tamir Hassan. Tamirhassan.com,2017. [Online] Available: http://www.tamirhassan.com . [Last Accessed 1 Jun. 2017].
27) Source.opennews.org. Introducing Tabula, 2017. [online] Available: https://source.opennews.org/articles/introducing-tabula . [Last Accessed 5 Jul. 2017].
28) GitHub. andruo11/pdfminer, 2017. [online] Available at: https://github.com/andruo11/pdfminer . [Last Accessed 1 Jun. 2017].
29) 19.7. xml.etree.ElementTree — The ElementTree XML API — Python 2.7.14rc1 documentation, Docs.python.org, 2017. [Online]. Available: https://docs.python.org/2/library/xml.etree.elementtree.html . [Last Accessed 1 Aug. 2017].
30) Pedregosa F, Varoquaux G, Gramfort A , Michel V , Thirion B , Grisel O , Blondel M , Prettenhofer P, Weiss R, Dubourg V, Vanderplas J, Passos A, Cournapeau D , Brucher M, Perrot M , Duchesnay E. Scikit-learn: Machine Learning in Python. Journal of Machine Learning Research,Volume: 12,pages: 2825–2830, year 2011
31) Huerta-Cepas, Jaime, François Serra, and Peer Bork. “ETE 3: reconstruction, analysis, and visualization of phylogenomic data.” Molecular biology and evolution 33, no. 6 (2016): 1635-1638.
32) Robinson, D. F., & Foulds, L. R. (1981). Comparison of phylogenetic trees. Mathematical Biosciences, 53(1-2), 131-147.
33)Phylogenetic Tree, Khan Academy, 2017. [Online]. Available: https://www.khanacademy.org/science/biology/her/tree-of-life/a/phylogenetic-trees . [Last Accessed: 13- Aug- 2017].
34) Marcet-Houben M, & Gabaldón T. (2011). TreeKO: a duplication-aware algorithm for the comparison of phylogenetic trees. Nucleic acids research, 39(10), e66-e66.
35) Wei, D., Jiang, Q., Wei, Y., & Wang, S. (2012). A novel hierarchical clustering algorithm for gene sequences. BMC Bioinformatics, 13(1), 174.
36) Rafsanjani, M. K., Varzaneh, Z. A., & Chukanlo, N. E. (2012). A survey of hierarchical clustering algorithms. The Journal of Mathematics and Computer Science, 5(3), 229-240.
37) Farran, B, Ramanan, A., & Niranjan, M. (2009, September). Sequential Hierarchical Pattern Clustering. In PRIB (pp. 79-88).
38) Abdel-Azim, G. (2016). New Hierarchical Clustering Algorithm for Protein Sequences Based on Hellinger Distance. Appl. Math, 10(4), 1541-1549.
39) Hierarchical clustering, Nlp.stanford.edu, 2017. [Online]. Available: https://nlp.stanford.edu/IR-book/html/htmledition/hierarchical-clustering-1.html . [Last Accessed 7 Jul. 2017]
40) Wang, X. (1996). Tabular abstraction, editing. and formatting. Phd Thesis. University of, Waterloo, Ontario, Canada.
41) Adobe Acrobat Pro DC: PDF converter, convert PDFs from anywhere., Acrobat.adobe.com, 2017. [Online]. Available: https://acrobat.adobe.com/us/en/acrobat/acrobat-pro.html. [Last Accessed 14 Aug 2017].
42)IFRS. ifrs.org, 2017 [Online]. Available: http://www.ifrs.org/about-us/who-we-are/ [Last Accessed 7 Jul. 2017]
43) Illingworth, J., & Kittler, J. (1988). A survey of the Hough transform. Computer vision, graphics, and image processing, 44(1), 87-116.
44) Python Data Analysis Library — pandas: Python Data Analysis Library, Pandas.pydata.org, 2017. [Online]. Available: http://pandas.pydata.org/index.html . [Last Accessed 7 Jul. 2017]
45) Khusro S, Latif A, & Ullah I. (2015). On methods and tools of table detection, extraction and annotation in PDF documents. Journal of Information Science, 41(1), 41-57.
46) Zhang Z. (2014, October). Towards efficient and effective semantic table interpretation. In International Semantic Web Conference (pp. 487-502). Springer, Cham.
47) Zhang, Z. (2016). Effective and efficient semantic table interpretation using tableminer+. Semantic Web, (Preprint), 1-37.
48) Limaye G, Sarawagi S, & Chakrabarti S. (2010). Annotating and searching web tables using entities, types and relationships. Proceedings of the VLDB Endowment, 3(1-2), 1338-1347.
49) Syed Z, Finin T, Mulwad V, & Joshi A. (2010, April). Exploiting a web of semantic data for interpreting tables. In Proceedings of the Second Web Science Conference (Vol. 5).
50) Fang J, Mitra P, Tang Z, & Giles C. L. (2012, July). Table Header Detection and Classification. In AAAI (pp. 599-605).
51) Samsung Annual Report. Page 46 [Online]. Available: http://www.samsung.com/common/aboutsamsung/download/companyreports/2014_E.pdf Last Accessed [22 August 2017]
52) PDFTOHTML conversion program”, Pdftohtml.sourceforge.net, 2017. [Online]. Available: http://pdftohtml.sourceforge.net/ . [Accessed: 28- Aug- 2017].[Last Accessed 25 August 2017]
53) n. corp., What is XBRL? Understanding XBRL Interactive Data for Filing on SEC EDGAR, Newsfilecorp.com, 2017. [Online]. Available: http://www.newsfilecorp.com/XBRL/UnderstandingXBRL.php. Last Accessed [23 August 2017]
54) Disadvantages of Using XBRL | Techwalla.com, Techwalla, 2017. [Online]. Available: https://www.techwalla.com/articles/disadvantages-of-using-xbrl . [Accessed: 28- Aug- 2017]. [Last Accessed 23 August 2017].
55) Medlock, B. W. (2008). Investigating classification for natural language processing tasks (No. UCAM-CL-TR-721). University of Cambridge, Computer Laboratory.
10) Appendix
The Appendix section discusses briefly about some modifications made in the main file of PDFMiner for converting to xml and for including the colour information. A demo of command line to convert PDF to XML is also included. The modified PDFMiner version should be downloaded from Github link [7] and not to be installed using command line interface for python (pip install).
10.1) Modification in the main module
Changes in the main module: In the python file ‘pdf2txt.py’ remove the word ‘StripControl’ from line 94 so that your code becomes compatible. This held true till the date 1st July 2017. With different versions, different changes might have to be done.
10.2) Command Line for converting PDF to XML
The following command line is used to convert the PDF to XML.
python
pdfminer-masteruildscripts-2.7/pdf2txt.py -o output12.xml -c UTF-8 exampletableextract.pdf
Cite This Work
To export a reference to this article please select a referencing stye below:
Related Services
View all


Related Content
All TagsContent relating to: "Computing"
Computing is a term that describes the use of computers to process information. Key aspects of Computing are hardware, software, and processing through algorithms.
Related Articles

DMCA / Removal Request
If you are the original writer of this dissertation and no longer wish to have your work published on the UKDiss.com website then please: