Eyjafjallajökull Volcano, Iceland: Eruption Evaluation
Info: 3444 words (14 pages) Dissertation
Published: 12th Sep 2024
Eyjafjallajökull Volcano, Iceland
Introduction:
The Eyjafjallajökull Volcano is an ice-covered stratovolcano located in Iceland, which last erupted in 2010. The eruption caused major disruption in the country as well as across the world. This was due to the ash produced from volcano as it caused major chaos to air traffic across Europe. These effects were unprecedented from the modest size of the volcano as such damage was not predicted. The Volcano received a large media response and was categorized as a VEI of 4 on the Volcano Explosivity Index (Sammonds, P., McGuire, B., Edwards, 2011).
The volcano itself has a large ridge shape that’s in a lengthened east west direction (Jónsson, 1988). Many of its slopes have been eroded down by the glaciers and rivers that run down from the ice sheet that peaks the volcano (REF). Past eruptions such as the 2010 eruption and other volcanic explosions before that can be used to guide future preparation methods. This is done by looking at details of eruptions and see the causes and impacts they caused. This will enable hazards to be kept to a minimum and reduce loss of life, health issues, economic damage and social disruption. This highlights the need to examine such eruptions and gather how the eruptions took place and the affects that they can cause.
Location and Plate tectonics:
The volcano in Iceland makes up a series of many active volcanoes in the country. These make up the Mid-Atlantic Ridge and has created the island of Iceland from two different types of volcanism. From underwater volcanoes and from a mantle plume that lies underneath the area. (British Geological Survey (BGS) | A world-leading geoscience centre, 2018). This underlying geological landscape makes up one of the most active volcanic islands in the world. The Volcano is around an area of high volcanism where a Rift zone is located on the south of Iceland on the boundary between the North American Plate and Eurasian Plate. Its peak is at a total height of 1651 metres, where there is a 2.5km wide Caldera (‘Global Volcanism Program’, 2018). The plate boundary is a Divergent boundary where the North American and Eurasian plates that move away from each other. However, the Eyjafjallajökull Volcano is situated just beyond the propagating rift of plate spreading in Iceland. But lies within a series of high rising volcanoes that’s influenced by a secondary rift zone (REF).
Magma Generation and development of the 2010 Eruption:
Relevant records of eruptions for this volcano can date eruptions back 1100 years, these show that previously before the 2010 eruption there had been two to three eruptions. These occurred in the 10th century when a flank eruption occurred (Óskarsson, 2009). Then again in 1612 when a possible summit eruption arose (Jónsson, 1774; Larsen et al., 1999), and then in again 1821 when the volcano last erupted before 2010 eruption (Thoroddsen, 1925). The low amount of eruptions can show the volcano to be quite inactive for this area as in the same time the nearby Katla volcano had 21 confirmed eruptions in the same amount of time (Larsen, 2000). Following the last eruption in 1821 the volcano had 170 years of dormancy which is normal for this volcano as its usual for it to have low levels of activity with it staying relatively quiet between its intrusion and eruption phases (Soosalu et al., 2006; Jónsdóttir et al., 2007; Jakobsdóttir, 2008).
Magma chamber movement can provide signs of eruptions that are going to occur (Sigmundsson et al., 2010). This movement was first recorded in 1994 when a period of seismic observations was recorded by seismic and geodetic measurements. This period of unrest lasted for 16 years until the volcano finally blew in 2010. The 16 years of activity had three main seismic swarms which started in 1994, 1996 and 1999.
In 1994 the volcano began to show minimal signs of activity, with the model for the 1994 activity indicating the intruded volume to of been three times smaller at 0.011km3 than during the 1999 phrase. During the 1996 swarm it indicates that tension was building suggesting magma was intruding up into the base of the crust, however no uplift was recorded (Hjaltadóttir et al., 2015).
This swarm activity occurred in different places across the volcano in the 1994 and 1999-2000, crustal deformation arose on the south eastern flank of the volcano. Along with seismic activity in the upper and intermediate crust. During this monitoring of the 1999 swarm a modelled intrusion with a circular sill with a volume of 0.030 ± 0.007 km3 at 5.0 ± 1.3 km depth was recorded (Hjaltadóttir et al., 2015). Between 1994 and 1999 it contracted in volume of around 0.0010 km3 at a fixed depth of 5km. As well a contraction from 2000 to 2009 was recorded at the southern flank at a volume of 0.0015 ± 0.0003 km3/year at 5.5 ± 2.0 km in depth(Hjaltadóttir et al., 2015).
The volume of intruded magma was underestimated, as well as the mass loading effects within the crust this was caused by the intruded magma and degassing of CO2. These all partly contributed to the changes of the accumulated volume being estimated wrong, as well due to solidification and magma cooling (Hjaltadóttir et al., 2015). These wrong estimates could highlight why the volcano impacts was underestimated and why it caused so much disruption from the amount of ash produced.
The seismic activities were in horizontal sill intrusions at 4.5 – 6.3 km in depth below the southern flank (Pedersen and Sigmundsson, 2004, 2006; Hooper et al., 2009; Sturkell et al., 2010). Seismic activity from 1991 to 2008 and GPS data from 1992 to May 2009 shows major magma movements below the volcano. The data shows a pipe like structure northeast of the summit crater, this shows the path of the magma from the base of the crust to the upper crust and into an intrusion (Hjaltadóttir et al., 2015).
The activity of a volcano can influence the prediction of the eruption as a lot more is known about the volcanoes that erupted more frequently. As for moderately active volcanoes such as the Eyjafjallajökull volcano less is known about the deformation of these types of volcanoes (Sigmundsson et al., 2010). This means each eruption that occurs can be monitored and research with this being used to predict future eruptions.
| Volcanic Activity Report | |||
| Date: | Deformation: | Seismic Activity: | Lava Flow: |
| January to March 2010 | Deformation was rapid with reduction of 0.5mm per day after 4th March | Intense Activity was recorded and uplift of volcano | |
| 20th March – 12th April | Effusive Basalt Flank Eruption | 1.3Km2 lava flow field formed with a volume of 0.030km3 | |
| 14th – 18th April | Second eruption at the summit. Explosivity increased from the Phreatomagmatic Eruption from a mixing of water and lava | Intense earthquake swarm that lasted three hours | First explosive phrase of magma discharge |
| 18th April – 4th May | Magma discharged reduced, with a less silica melt composition.
3km long lava flow from the caldera |
||
| 5th – 17th | Widespread dispersal of ash | More Explosive. Melt composition from Benmoreite to Trachyte. Discharged increased again | |
| 18th – 22nd May | Eruption declined until it eventually stopped | ||
| 4th – 8th June | Dispersion was kept within 1km of vents | More explosions however they had a small amount of magma | |
Most eruptive Period:
The immediate build up to the eruption started in January with an increased activity of phrases of seismic Earthquakes as well as volcano uplifting suggesting magma movement towards the surface (Hjaltadóttir et al., 2015). This developed into an official eruption that started on the 20th March and lasted around 6 weeks (REF).
With the large number of signs showing an eruption was near, the volcano was heavily monitored in the lead up to the eruption. This inspection of the earthquake revealed that there was a small net volume of magma from the shallow depth of the mantle. But the magma tended to be from more of a considerable depth (Sigmundsson et al., 2010). Other examination from the Global Positioning System GPS revealed that a 0.05km3 magmatic intrusion grew within 3 months (REF). The deformation in this instance was rapid before the first eruption when it reduced 0.5mm per day after the 4th March. Also, the deformation was unusual as it was not related to the magma chamber pressure these highlight why mistakes were made (Sigmundsson et al., 2010).
The first eruptive phrase was an effusive Basalt flank eruption this that was relatively small eruption and lasted till the 12th April 2010 (Sigmundsson et al., 2010; Gudmundsson et al., 2012). This eruption formed a 1.3km2 lava flow field this had a volume of 0.030km3 (REF).
The second eruption occurred on the summit of the volcano and started at 3.30pm on 14th April 2010. This eruption was immediately followed by an intense earthquake swarm that lasted three hours (Gudmundsson et al., 2012). From the 14th to 18th April the volcano began its first explosive phrase of magma discharge from a water filled vent. This formed a 5 to 10 km high plume that changed between a steam rich white ash cloud or a dark grey cloud that’s loaded with more ash than steam (Gudmundsson et al., 2012).
On the 18th April a change occurred that was a lower discharge phrase this lasted to the 4th May, the melt composition was less silicic than before as it reduced from around 60% to 58% and the magma discharge also dropped (Ref). The explosive action was relatively week but produced 2 to 4km high plumes. Lava effused out in a 3km long lava flow which made its way northwards out of the caldera down the Gı´gjo¨kull glacier (Gudmundsson et al., 2012).
From the 5th to 17th May the volcano became even more explosive, with the melt composition from Benmoreite to Trachyte. The magma production from the volcano changed from relatively low output to high discharge at times, with around 8 million tonnes of fine volcanic particles being ejected into the air (Carlsen et al., 2012). The wind caused widespread dispersal with the ash spreading over wide distances due to the wind direction and the duration of 13 days (Gudmundsson et al., 2012). This phrase of the eruption being very violent for the size of the volcano was a result of the volcano being a Phreatomagmatic Eruption. This was an outcome of the eruption arising within an ice capped caldera. This caused a mix of magma and ice which causes the explosivity of a volcano to increase in intensity (Sammonds, P., McGuire, B., Edwards, 2011).
From the 18th to the 22nd May the eruption declined until it eventually stopped. There were however explosions on the 4th to the 8th of June but these explosions had a small amount of magma that was admitted and caused dispersion of Tephra that was limited as it was kept within 1km of the vents. The volcano however had a steam plume that occurred for months after the eruption had stopped located at the crater on summit (Gudmundsson et al., 2012).
Primary and Secondary Hazards:
The eruption in Iceland caused many effects that affected people nationally and internationally from primary and secondary hazards. These includes flooding, health effects and disruption to air traffic.
The volcano went through a small subglacial stage when the eruption melted through the glacier of 200m of ice which took 3 to 4 hours (Gudmundsson et al., 2012) and this created large amounts of meltwater that caused flooding nearby . These floods were known as the jo¨kulhlaups or glacial outburst floods that occurred on the 14th and 15th of April (Gudmundsson et al., 2012). The sudden melting of ice and snow however threatened the communities at distance to the site to the eruption (Kuenzler et al. 2012). The impacts of flooding however were minimal as there is a relatively low population in that area (REF).
Yet trauma response teams from the Red Cross were at evacuations and in community centres at the time of the eruption (Carlsen et al., 2012).
Flooding caused disruption to the local communities that are near to the volcano. However other hazards were recorded further away from the eruption caused by ashfall from the volcano. This caused short term problems being reported such as causing Asthma Attacks, increase irritation to respirate and skin and eye irritation (Carlsen et al., 2012). Some of these hazards were tackled by the public health authorities by providing facial masks and glasses for eye protection (Carlsen et al., 2012). The health affects can be shown to not be just contained within the Iceland. As for the period that the eruption took place, the number of individuals across Europe that were treated for respiratory issues increased. However this may or may not be directly be related to the region being by an Ash Cloud (Carlsen et al., 2012).
The summit explosion of trachyandesite caused an exceptional disruption to air traffic across Europe with much of the airspace being closed for several days (Sigmundsson et al., 2010). As the ash can cause high damage to airframes, avionics and engines of civil jet aircraft. As small as a 2gm-3 of ash ingested in the engine can cause loss of power and near crashes (Sammonds, P., McGuire, B., Edwards, 2011).
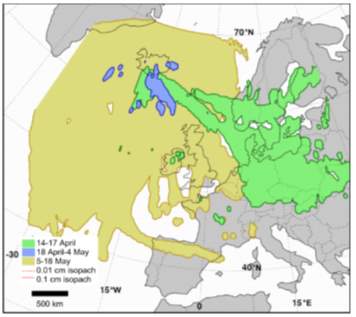
Figure 1: Distribution of Ash across Europe that caused international attention due to this major secondary impact of the Eyjafjallajökull eruption to the aerospace industry.
However, the volcanic ash cloud affects were affected greatly by the weather as the prevailing winds, caused large dispersion to the south and south-East of the Volcano. This therefore closing European air space for several days (Carlsen et al., 2012). The impacts on the airline industry highlighted severe issues that need solutions for future eruptions of this scale. More disruption was caused to flights was due to airlines having limited preparation, as it caught both airlines and public by surprise even though the volcano had been erupting for around a month before the airspace was suddenly closed on the 15th April by the UK National Air Traffic Control when they banned all non-emergency flights across the UK (Sammonds, P., McGuire, B., Edwards, 2011). This highlights the need for volcanoes to be monitored more, this involves not just monitoring the volcano that causes primary effects. But further forecasting of the potential paths of ash clouds and the secondary impacts they can cause.
Other ways to monitor and predict future eruptions:
The eruption in 2010 was the culmination of 18 years of unrest that was alternating in strength this shows the importance of monitoring volcanoes over weeks to years to see signs of potential eruptions. These volcanic signs can indicate the reawakening of volcanoes, however these short term eruptions may be underestimated and difficult to prepare for (Sigmundsson et al., 2010).
The Icelandic Met Office were responsible for monitoring the volcano using many geophysical sensors including seismic, strain and GPS. The office also monitored the river runoff from the meltwater off the glacier. The behaviour of the volcanic cloud was observed using a C-band weather radar located at the Keflavik international airport that is situated 150km west of the volcano (Icelandic Met Office, 2018). However, this was still not successful enough in warning airlines of the possible threat. This may be improved in the future by organisations from across Europe working together to monitor the volcano. The British Geological Survey and the Icelandic Met Office have installed new seismic stations on the Eyjafjallajökull volcano as well as the Katla Volcano. These stations were installed to provide real time data to monitor the possibility of future eruptions in the areas (Dr Brian Baptie, 2018).
Health effects of the local communities can also be reduced by well-developed houses as houses within Iceland generally have windows and doors that are insulated well so shut tightly and therefore can provide protection from health effects caused by ash (Carlsen et al., 2012).
Plans to mitigate the effects of eruptions on air traffic have been attempted by the International Civil Aviation Organisation (ICAO) that use advice from the World Meteorological Organisation to keep Aircraft away from ash clouds by advising international airlines of ash clouds (Sammonds, P., McGuire, B., Edwards, 2011).
Volcanoes can be monitored using varies techniques to estimate when an eruption will occur and what hazards it will present. However, it can be challenging whether a volcano is emitting ash particularly if the volcano is remote (Webley & Mastin, 2009). Radar Techniques are the conventional method to monitor volcanoes however they cannot detect ash particles (Prata and Tupper, 2009). So less conventional methods such as Satellite Images and LIDAR (Light Detection and Ranging) in detecting ash plumes, or thermal differences (Sassen et al., 2007). These monitoring operations assigns different warning levels to the aircraft industry when a volcano has been detected ejecting ash. This aviation colour code is shown in figure 2 and shows the amount of activity and ash generation is occurring at a volcano. This give a certain level of warning to aviation companies and allow them to take an action needed (Gardner, 2006). However, the Eyjafjallajökull eruption highlighted problems in this system and the need for it to be globally implemented across the globe. In the case of this volcano the volcano was given a red alert however this was relatively late and only applied at the sixth change of alert (Sammonds, P., McGuire, B., Edwards, 2011).
Aviation Colour Code used by the USGS Volcano Observatories
| Alert Colour | Description |
| Green | Eruption not occurring, either as normal background state or an eruption has stopped from a recent eruptive period. |
| Yellow | Signs of unrest and a possible eruption occurring, or last eruptive activity has reduced but it closely monitored for possible new explosive activity. |
| Orange | Increased unrest and more risk of eruption, or eruption is occurring, but violent explosive activity has no slowed or stopped. |
| Red | Eruption is looming with increased volcanic activity, or eruption taking place with significant emission of volcanic ash into the atmosphere. |
(AVO,2010)
Cite This Work
To export a reference to this article please select a referencing stye below:
Related Services
View all


Related Content
All TagsContent relating to: "Geology"
Geology is an “Earth science” or “geoscience” concerned with the study of the physical structure of the Earth (or other planetary body) and the rocks of which it is made, the processes that shaped it and its physical, chemical and biological changes over time.
Related Articles

DMCA / Removal Request
If you are the original writer of this dissertation and no longer wish to have your work published on the UKDiss.com website then please: