Project and Total Quality Management in the High Rise Construction and Development Sector
Info: 10250 words (41 pages) Dissertation
Published: 16th Dec 2019
Executive Summary
This paper provides an investigation and consequently creating an understanding of project quality in practice and (TQM) total quality management, in the high rise construction and development sector. Essentially with a view to understand if the TQM application can lead to project success. The methods to the investigation include the research of primary and secondary peer reviewed literature, together with a practical understanding through pertinent data collected. The relevant researched facts, information and evidence in this paper are comparative to best practice techniques, and TQM as used within large and small organizations for corporate success. Furthermore, this paper explored the traditional methods of CoQ, predominantly the PAF (Prevention, Appraisal & Failure) technique, however with much empirical research the model used in this paper is the Process Cost Model (PCM), for construction, easier for the application. The cost of quality data with calculations showing the COC & CONC, with the results indicating a moderate to a high level of expenditure. This paper finds methods to TQM in its current state as comprehensive, however as the organizational landscape becomes more competitive with increased quality demands on apartment projects, and not relinquishing marketplace position, it is strongly endorsed that best practice methodologies and continuous improvements in the project domain, TQM is a tool for project success.
Quality Management – Organizational Perspective
- Business Description
In this paper, and to avoid any issues regarding the breaching of any confidentiality obligations, (for complete clarity) where required for any references to the business name, shall be referred to as “the firm”. The business, is a global cooperation, where my (historic) role as a Senior Development Manager within the Perth office, with the responsibility of leading, managing and delivering on built form commercial, and medium rise residential apartments. More interestingly and importantly, the firm, and with the recent acquisition of this company, is now one of Australia’s and New Zealand’s leading diversified land and property groups with 700 staff in most states. Largely, the global firm effectively embraces four core business dedicated on residential, commercial/industrial, and hospitality which are delivered to over 80 cities on a global scale. In terms of operations, within the firm the departments and teams within the departments are numerous, which effectively cover the tasks and duties to perform the roles, led by middle management to each department such as; Acquisition, Construction, Development, Sales, Marketing, Finance, IT and Customer Relations/End User Interface.
- Business Critical Success Factors (CSF) & Key Performance Indicators (KPI)
The term Critical Success Factors (CSF) can be defined as a term for a component which is required for a business, organization or even a project to accomplish its task. For that reason, the success of that activity or task is critical to the overall success of the company or the organization.
During my tenure at “the firm”, there are three integral CSF to the business and its long term success. This paper shall nominate only two as required (Restoring Resources/Sustainability and People Focused), however to nominate only two CSF is difficult, nonetheless the business is committed on three core areas, each of these goals outline on how the business will plan to make a difference in sustainability to year 2030, these three goals are:
- Restoring Resources/ Future Sustainability;
- People Focused/Human Capital Development; and
- Must be advanced with progressive thinking.
For the benefits of understanding the nominated CFS, this paper will look at each of these in isolation, firstly People or the Human element. Effectively, all the products and services which are delivered, are provided by people and are for people. That being said, when it comes to the staff, a great deal of effort is made to retain staff through combined surroundings, training thus enabling further development, creativity, and in turn inspiring people to reach their full potential. In short, when it comes to the end user (or the customer element of people), it’s the people which is the businesses greatest asset, and a direct focus to the key success of the business, and therefore stress free for real people, end user, customer or the purchaser.
When it comes to sustainability as a success factor, the commitment of the business is the creation of products where resources are reused, recycled and in turn reinstated, including being smarter and more efficient in the way the company delivers products, for natural resources are can be used and regenerated, through the entire portfolio. Correspondingly, the same thought process of the approach to
In terms of the key performance indicators, the important aspect here is these need to be a measurable value, this in turn will indicate how effective the organization is reaching its key business goals. In terms of the two CFS, this paper will nominate two (2) Key Performance Indicators (KPI), which are measurable and in turn, critical to the ongoing improvement of the firm. Firstly, this paper will look at the KPI’s to the People Focused, as noted within Table 1:
Table 1.
| CFS | ID | KPI |
| Company must be People Focused for Human Capital Must inspire people, as people are central to the business success, & are encouraged to reach their full potential. | Employees | Satisfaction/Maintain: Increase employee satisfaction to 80% or above, to be 5% higher than the Aust. high performance norm of 75% by 2019; and |
| Preservation: Rise the employee retention from 70% to 80% within 24 months. | ||
| End Users/Customers | Satisfaction: Increase the end user/customer satisfaction from an approval score from 60 points to 70 points within 24 months; and | |
| Growth: Increase end user/customer base by 15% within 3 years. | ||
| Resources/
Sustainability Commitment to creating places where resources are reused, recycled and restored. |
Energy & Carbon | Succeed: Achieving a Min. 6 Star energy (NABHERS) tenancy rating to all residential developments by 2018; and |
| Waste (Landfill & Recycled) | Waste management plans for all corporate offices throughout Australia by 2017; and improved waste management plans to all Apartment developments, to reduce landfill by 5% of volume by 2020. |
Project Definition
- Product Scope Statement
For the benefits of understanding the difference between “Product Scope” and “Project Scope”, as defined in PMBOC (PMI (2013, 105), basically Product Scope is the purposes and features which describe a product, service or end result, whereas Project Scope is defined as the effort performed to deliver on a product or service or end result. In terms of the development which has been approved by “The Firm” to proceed, I shall assume the role as the Project Manager or the Client Representative for the development, the product scope of the product is stated below, in addition to the project objective following.
Project Objective/Product Scope
The projectobjective is to design, construct and develop a high quality apartment complex within the CBD of Perth, with the cost not to exceed $20,000,000.
The product scope for the development is effectively a site located within the CBD of Perth, which is walking distance to the city, river and several sporting grounds. The development will feature retail/office/commercial spaces as well as an eight level apartment building, with eighty (80) apartments, consisting of thirty one bedroom and one bathroom and fifty, two bedroom and two bathroom apartments respectfully. Again the development will be over eight levels, and consist of 5000m2 of total built up area, and each apartment shall consist of attached bathrooms, living rooms, kitchens, plus each apartment shall have access to one car bay and one storeroom, as standard internal features. Further features (to the product) and functions to the development include, but not limited to:
- Amenity – Full privacy from neighbours, to all apartments with adjustable screening.
- Amenity – All apartments have the ability for cross ventilation, natural ventilation, adding to the amenity.
- Safety & Amenity – The development incorporates a defined are between the public and private realm, where entry to the site is controlled by security passes to pedestrian and vehicles.
- Energy – Double glazed windows, with external awnings to all apartments, reducing energy costs PA.
- Energy – Selected materials for their low embodied energy and ongoing maintenance features, including lighting, appliance fixtures and fittings.
- Environment – Environmentally sustainable development with one of the first medium to high rise apartments to achieve a 6 star Green Building Council of Aust. Rating.
- Community – Opportunities for the owners or the residences to involve themselves with the CBD, East Perth, Swan River through parklands,
- Community – Communal features including, rooftop BBQ & full size pool facilities, plus communal meeting area with communal food gardens, encouraging sustainable living.
- Community – Ground level theatre communal space, with the ability to book for particular events.
- Organizational Project Objectives
All or most businesses embrace key objectives with a strategic plan, the strategic preparation is the organizational course of action and allocating of resources, and the making of decisions to pursue a strategy (and objectives) which are integral to the business image. It is critical for the business objectives and therefore the projects objectives to align, hence it would be fair to say that organizations effectively manage their product or project portfolios, are predicated their tactical plan PMBOC (PMI (2013, 10). It is pertinent to align “the firms” key success factors and effectively supporting the CSF’s with the projects objectives. For that reason the high level project objectives will be predicated on the firm’s two key factors, for project and business success, as outlined briefly in Table 2 on following page.
Table 2.
| BUSINESS TARGETS | PROJECT OBJECTIVES
(IN LINE WITH BUISNESS MODEL) |
| RESTORING RESOURCES/Sustainability
|
Energy & Carbon – Making clean energy accessible, integration of higher sustainable design strategies to build form. |
| Water & Waste – Make all water & waste a resource into built form. | |
| Promote – Invest in sustainable communities and neighbourhoods that have mixed-income, look at various housing products, close to amenities, services and transportation. | |
| Biodiversity – Conserve, enhance, and regenerate ecosystems, built form consideration. | |
| Materials & Supplies – Procurement of safe, and responsible materials, endorsing ecological dwellings. | |
| PEOPLE FOCUSED/HUMAN CAPITAL | Diversity – Adopt a varied & inclusive workplace, predicated on worth and equity. |
| Community/Equality – Promoting equal opportunities to all prospective residence/owners with no discrimination. | |
| Leadership & Skills – Enabling all staff, the customers & communities to make sustainable selections. | |
| Health & Wellbeing – Improving the wellbeing of the business customers & staff. Promote the wellbeing and health within neighbourhoods. | |
| Community Connectedness – Growing the social value of the local societies; &
Community – Facilitate the integration of design strategies, producing a range of built form products to meet various rental and ownership housing needs. |
Customer/Supplier ID
- External & Internal Customers
Current research demonstrates that businesses recognise the importance and the value of intra-organizational relationships, together with the lessons learnt from the internal environment, and more specifically the interactions with the end user or the external customer. In particular, the management of relationships internally becomes critical on a tactical level, a valuable tool in which to be effective, and effectively delivering customer awareness to the merchandise or product quality, and in turn the organizational performance Beckett-Camarata, Camarata, and Barker (1998, 76). Correspondingly, organizations whom empower their staff, and who clearly understand and participate in the business targets, the outcome is the employees act as the business proprietors, consistent with the business goals Juran and Godfrey (1999, 425). Businesses have identified through research that, customer satisfaction is profoundly influenced by customer service or product delivery Beckett-Camarata, Camarata, and Barker (1998, 73).
The expression “customer” can be an ambiguous term, it can mean an individual or an organization, and therefore to be clear an External Customer can be the end user, someone who buys the product or service for him/her or someone who benefits from the product Juran and Godfrey (1999, 54). Furthermore, the marketplace or the customer can define the product scope, hence the success of the development can be based on their ultimate gratification Larson (2014, 350) Ultimately, as the product is a built form dwelling, the customer is the one whom will occupy the dwelling.
In terms of the Internal Customer, staff play various roles being a provider, processor and a purchaser. To identify an internal customer, can be ambiguous as this area is not clear. Therefore, this paper identifies an Internal Customer as someone whom is within the organizations; Marketing, Sales, Finance or customer relations Juran and Godfrey (1999, 54). Lastly, when it comes to the internal departments/functions within the organization, there are two who spring to mind, these are critical to the project’s success; these are identified as Marketing and the Sales Departments, this paper will briefly look at these consecutively, interfacing with the PM.
When it comes to the relationship between the PM, Marketing and the Sales departments, these teams are all critical and are interdependent with each other, for the ultimate benefit and the success of the project. The marketing section of the company, effectively creates the information required to produce and grow sales through various advertising methods. For that reason, the interface with the marketing team is predominantly critical at the front end of the project, (& the project life cycle) whereby establishing and promoting the project within the marketplace, in addition to ongoing advertising and promotion of the product to assist in the product launch. Although the relationship between marketing and the PM are strong, the interpretation is the relationship between the sales & the PM’s relationship can be somewhat superficial, to the point where once the marketing has delivered on their targets and objectives, once the sale of the product (apartment, in this case), is complete the interaction is reduced. Contrary to this, where the requirements from the external customer are high, the relationship between sales, the PM, are critical to deliver a quality product. Fundamentally, the interface with both departments from the PM’s view point can be for the most part on a daily basis, however it can also increase or decrease, predicated on the phase of the project, and if the development reaches enough sales to proceed. Overall, the interface between the PM & marketing, sales and marketing, and finally PM & sales are significant, to the point where expert knowledge and shared information for all for the ultimate benefit & success of the project.
Product Definition
- Final & Interim (Work Package) Product Deliverables & Description
Stated prior in this paper, the final product deliverable is a development that will feature retail/office/commercial spaces as well as an eight level apartment building, with eighty (80) apartments, consisting of thirty one bedroom and one bathroom and fifty, two bedroom and two bathroom apartments respectfully. Again the development will be over eight levels, and consist of 5000m2 of total built up area, and each apartment shall consist of attached bathrooms, living rooms, kitchens, plus each apartment shall have access to one car bay and one storeroom, as standard internal features. Lastly, for this task, this paper notes within Table 3, the core product deliverable are identified with four interim/ work packages, and a brief description to each of the work packages for clarity.
Table 3.
| No. | Product Deliverable | Work Package/Description |
| 1. | 1.0 – Product: Residential Apartment Development | Five level, 80 Apartment complex with Car parking, Lifts, Stair access and common facilities. |
| 2. | 1.1 – Design Documents | |
| 3. | 1.1.1 – Producing Product Design Documents | Production of all design documentation for submission to authority |
| 4. | 1.2 – Building License Documents | |
| 5. | 1.2.1 – Prepare all product building licence submission documents | Preparation of all building licence drawings, specifications, reports for building license assessment. |
| 6. | 1.3 – Ground Floor Concrete Slab | |
| 7. | 1.3.1 – Commence & Placement of Concrete Slab | Commence the placement of basement slab |
| 8. | 1.4 – Building Finishes | |
| 9. | 1.4.1 – Commence Kitchen, Bathroom & Laundry Fitout | Installation of Cupboards to Kitchen, Bathroom & Laundry Cupboards |
Elicit & Establish Customer Requirements
- Introduction
Prior to the review of requirements collection, recording, method and tracing, it is important to briefly identify what the organization should take into account for the functional customer requirements, and one of the gurus of Customer Satisfaction, Professor N. Kano and his methods to identifying customer satisfaction.
Firstly, and as stated within AS3906 Australia (2004, 12) the business should look into the functions of the product or services and consider factors as; safety, timeliness, reliability, maintainability, communication, courtesy, the total costs and the total market. This in turn can be a good foundation, for the elicitation and the establishment of the customer requirement process.
Secondly, and primarily one of the keys to any business success, is the preservation and the recognition of its customer base. The gratification of the customer, plus the customer base is a fundamental core element to the business, which needs to be understood and nurtured. Therefore, it can be strongly argued that in the built form construction or development industry, it is significant to make clear not only the direct causes to customer satisfaction, but also the methods in which are most effective. Furthermore, as Sauerwein et al. (1996, 1) argue, Professor N. Kano’s model for satisfaction, clearly explain the pertinent information that can be received and expected from the customer or end user, establishing satisfaction levels. These levels are identified with a brief description, and Figure 1 following:
- Must-be Requirement(s) (Features) – Effectively these conditions MUST be met and MUST meet the simple functions, the end user will be displeased. There will be little or no interest in the product if the main criteria is not met.
- One Dimensional Requirement(s) (Features) – The customer satisfaction is relative to pertinent level needs, therefore the higher the satisfaction level equals to a higher customer satisfaction level; a clear customer requirement.
- Attractive Requirement(s) (Features) – These wants and needs are predicated on the evaluation of the product or project, in turn is determined by the level of customer product satisfaction. These are a non-imperative nor hopeful by the end user, and what the customer expects to receive.
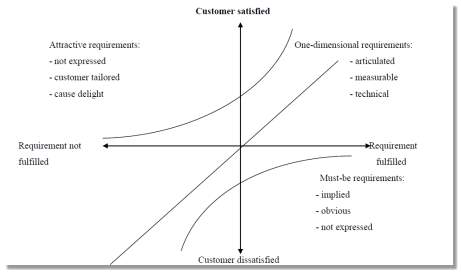
Figure 1 – Kano’s Model for Customer Satisfaction Matzler and Hinterhuber (1998, 29)
- Elicitation Methodology
At the outset of the project all the requirements are generally not known, hence the provoking of customer requirements can transpire over the course of the projects life cycle. Therefore, the wants and needs are just a thought process, and eventually leading to an investigation, where the requests and desires can be elaborated into further detail PMI (2016, 25). Fundamentally, the elicitation is a process of discovery to identify all the relevant information from key stakeholders, inclusive of other sources to identify any possible reasons for not addressing a potential prospect or a project opportunity Tuunanen (2003, 47). There are unlimited methods to produce the relevant requirements for the product or project, with much review and empirical study this paper suggests a traditional technique. In short this methodology can have their strengths and weaknesses, however with the use of other techniques, will produce the required outcome PMI (2016, 29). Finally, it is important to note the classifying of various requirements, consequently there are several categories which effectively provide context and clarity, examples as; Project, Quality, Program, Stakeholder and Business. The elicitation techniques used for this project are identified and detailed following, and the relevant requirements are stated within the technique PMI (2016, 115);
- Sponsor Interviews – The interview process is a key method to elicit the necessary information, whereby asking appropriate questions in regards to the critical dates as required to deliver both the design and the building licence documents to the local authority for review.
- Sponsor Facilitated Workshops & Document Analysis – Both of these methods, again is key to the success of the information gathering process, for the relative requirements. Essentially, the workshop and the analysis process, empowered the group to flesh out, identify key completion date, plus the detailed analysis of historic documents in regards to the decision for the project completion date, but particularly the number of bad weather days allocated requirement & decision.
- Benchmarking – In addition to the workshops, the project shall benefit from the benchmarking elicitation method, whereby comparing actual and historic practices. The payoff is by continual improvement, following best practice and therefore the measurement of the projects performance.
- Visualisation – This methodology, can be used to great benefit by showing the customer such things as; related product images, prior examples or ongoing interim project/product examples to further elicit ideas and further customer requirements.
- Product Requirements (5)
Prior to identifying the five product requirements collection, it is important to briefly to identify the important characteristics which in turn serve as a guideline, to ultimately ensure the quality of the requirements, as; Consistent, Unambiguous, must be Measurable, Complete, Feasible, Testable, Traceable, Precise, independent, Negotiable, Valuable, and Testable PMI (2016, 36,37)
Product’s five requirements:
- Product design documentation for Local Authority (Planning Application) submission and review are to be submitted to council by 1st August 2018.
- (This paper is assuming the DA is approved) – Post planning application submission and with now successive approval, the products documents for Local Authority (Building Licence Application) submission and review are to be submitted to council by 1st October 2018.
- Concrete Basement Slab & Reinforcement – The grade of concrete shall be N20 with slump of 100 mm in accordance with AS 1379, with 20 mm maximum nominal aggregate size. Reinforcement in rafts and slabs shall be placed in accordance with:
- Minimum concrete cover for the reinforcement shall be 40 mm to unprotected ground, 40 mm to external exposure, 30 mm to a membrane in contact with the ground, and 20 mm to an internal surface.
- Apartment Fitout:
- Kitchen Cabinet Bench height to be 900mm
- Overhead cupboards must be installed where possible, but not above hotplates.
- Minimum of one bank of drawers is required, but not under hotplates.
- Bench tops to be laminated with a post formed outer edge. Doors and drawers to be laminate finish with PVC edging, and D-handles.
- Sink and taps: Sinks are to be stainless steel. A single lever mixer tap is required.
- Kitchen splashback tiles are required and should continue into window reveals.
- Min. Sizes for Kitchen Components; Pantry: Min. 600mm Wide, Fridge Space: 850mmW x 700mmD x 1900mmH; Space between benches and to face of refrigerator: 1200mm.
- Product creation program not to exceed 50 Weeks duration (5 Working days per week), plus 10 days for poor weather delays, therefore the duration is 52 weeks.
- Implied/Unstated Requirements (2)
In terms of the two unstated requirements, the methodology to establishing both the completion dates and the construction duration, again met with much rigor and detail. The process commenced and as detailed below;
- Planning – Formulation of key stakeholders into a workshop, with the organization to address any unstated requirements. A third party consultant to assist the group to effectively resolve & identify the unstated requirements;
- Planning & Identification – During this phase a risk register & matrix was established to identify the risks in regards to the product creation time requirements.
- Analysis, Assessment & Decision – The analysis and assessment phase is the third step, where the implied requirements are assessed on a qualitative basis, with a risk likelihood, consequence, ratings tables plus a consequence matrix formulated. Overall, the group decision making technique, expert judgements and document analysis from historic projectsand also calling on assistance with consultants, and lastly construction related subject matter experts, Ie. Quantity Surveyors, to reach the final decisions.
Projects two implied requirements as listed:
- Product build program not to exceed 50 Weeks duration (5 Working days per week), plus 10 days for poor weather delays, therefore the duration of 52 weeks.
- The time difference between planning submission documents and the building licence submission documents.
- Tracing Requirements
The methodology to record and track the project requirements commenced during the elicitation and analysis phase, which in turn assists with the control and monitoring the scope of the project. Effectively, one of the tools as used in this project is a grid matrix where all the requirement inputs can be populated within the traceability matrix, Table 4 & Figure 2 shows a typical example, and if any changes to the scope are approved the traceability is updated within the matrix. Further, it should be pointed out that a baseline, from the outset needs to be clear, so the approved requirement can be tracked with status updates. This is the phase known as the monitoring and controlling element for clear communication to the stakeholders. Furthermore, there are two other methods that this paper shall use to track the requirements, where a dependency analysis is needed for the reason due to the relationships to other requirements, hence the technique is needed to realize the dependant relationships. Lastly, as referenced prior, if and when any requirements are changed, an impact analysis is needed and to understand any impacts to any other requirements. Overall, the analysis identifies any additional cost, work and the schedule impacts to the proposed change PMI (2016, 47,48).
Table 4.
| REQUIREMENTS TRACEABILITY MATRIX | ||||||||
| Project Name: | ||||||||
| National Center: | ||||||||
| PM Name: | ||||||||
| Project Description: | ||||||||
| ID | Assoc. ID |
Technical Assumption(s) |
Practical |
Status |
Architectural /Design |
Technical |
System |
Additional |
| 001 | 1.1.1 | |||||||
| 002 | 2.2.2 | |||||||
| 003 | 3.3.3 | |||||||
Table 4 – Typical Example of a Traceability Matrix.
. 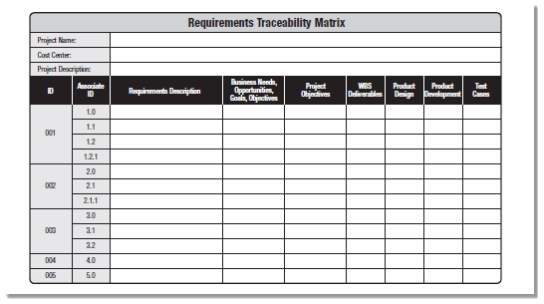
Figure 2 – Typical Example of a Traceability Matrix PMI (2013, 119).
Table 5.
| Requirement Collection Template
|
|||||||
| Requirement ID | ID# | Req. Type | Ie: Design | Use Case # | # | ||
| Status | New | Agreed | Y/N | Baseline | |||
| Parent Req. # | Unique id# for each requirement that this requirement supports | ||||||
| Description | Brief description to the req. | ||||||
| Reasoning | Brief rationale for the requirement or a business case | ||||||
| Source | Where data is obtained | Source Document | |||||
| Acceptance Criteria | Target to test if requirement as fulfilled | ||||||
| Dependencies | Any other requirements that this ID# is dependent upon | ||||||
| Priority | High or Low importance | ||||||
| Change History | Any changes made to the requirement | ||||||
Table 4 – Example of a method for requirement collection.
Quality Planning
- Requirement Metrics
As stated within PMI (2013, 242) a quality metric is a product characteristic, and exactly how the measurement process of quality control. Effectively it’s an actual value, whereby permissible tolerances or variation are given to the metric itself. There are possibly countless ways in which an activity can be measured, hence the implementation of a metrics system can ultimately assist in the success of the product or service, with such measures as scope, cost, schedule and client satisfaction Rad (2006, 3). However, this paper has the focus on quality, and consequently some pertinent examples are time performance, frequency of defects, failure rates, cost control and testing coverage PMI (2013, 242). Lastly, this paper identifies the requirements together with the pertinent metrics & criteria, noted within Table 5.
Table 6.
| No. | Requirement & Name | Category | Metric | Acceptance Criteria |
| 1. | Design documentation for Local Authority (Planning Application) submission and review are to be submitted to council by 1st August 2017. | Quality | Number (#) of document client corrections/mark-ups | Criteria: No more than or equal to 5 items per sheet (≤5) of rework to documentation |
| 2. | Building license documentation for Local Authority (Building Application) submission and review are to be submitted to council by 1st August 2018. | Quality | % Rework of documents | Criteria: No more than or equal to 5% – 10% (≤5% – 10%) of rework to documentation
Note: % Based on the number of documents issued |
| 3. | Typical Floor Slab & Reinforcement. | Quality | % Defects to concrete slab | Criteria: No more than or equal to 5% – 10% (≤5% – 10%) of defects/identified defects |
| 4. | Apartment fit out – E.g. Kitchen Cupboards | Quality | Number of defects to Kitchens/Bath Cupboards | Criteria: No more than or equal to 5 – 10 (≤5 – 10) of defects/identified defects per kitchen/bathroom cupboards |
| 5. | Final product costs not to exceed budgeted of $20,000,000 plus a 2% contingency @ $400,000, hence budget requirement @ $20,400,000. | Cost | Variance at Completion: VAC =BAC – EAC | Criteria: Final product cost to be no greater or
≤ 1% over the budget of $20.4m |
Quality Planning – Cost of Quality
- Process Cost Model
The costs of quality can be an area of considerable savings, therefore with the production of a product, service or even a quality job, by delivering a good level of customer satisfaction is essentially not enough Oakland (2014, 106). The management of these costs are critical to the performance of the business or operation. Empirical studies have indicated that the costs of quality are in the order of 20% – 30% of turnover, however the ideal scenario for turnover should be in the 2% – 4%. Therefore, the percentages represent a significant opportunity for cost savings and improvements on the business profit Hansen (2009, 907). To be competitive in the marketplace (and improve on the products profit margin) the balance between quality and the respective costs is one of the main goals of management, where the examination of the data could be aided of the Costs of Quality (COQ) Oakland (2014, 106).
Now that this paper has touched on the importance of these costs can possibly be measured, let us take a quick look at the proposed method to assessing the management of quality and identifying the problematic areas, any opportunities and possible savings along the way. Fundamentally, this paper has researched much empirical papers in regards to the methods to (QMS) quality management systems for construction projects based on the ISO 9000 series, where the data has indicated varied results, of both successful and unsuccessful. The most successful of the reports is based around an older technique known as Prevention, Appraisal & Failure (PAF) model and this can be seen as being relatively successful. However as construction quality costs are difficult to capture, this paper shall demonstrate the (COC) Cost of Conformance AND the Costs of Non Conformance (CONC) to 3 typical floors, with a relatively new approach which is called (PCM) Process Cost Model, which is pertinent to construction projects irrespective of size Tang, Aoieong, and Ahmed (2004, 264). This can be applied to any of the construction process, yet this paper has selected the concreting procedure for a typical concrete floor, the PCM process is illustrated in Figure 3.
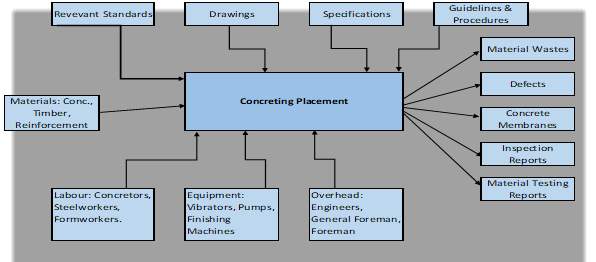
Figure 3 – Process Cost Model for Concreting Tang, Aoieong, and Ahmed (2004, 265).
- Activities for COC, CONC & Calculations
One of the main values to the PCM’s application it is not complex, with easy to understand by stakeholders, plus its main purpose is for continual development of the process itself Tang, Aoieong, and Ahmed (2004, 264). Lastly, and to give context to the data shown in Tables 7, Cost of Conformance and Cost of Non Conformance, the product is a 5 level Apartment development, consisting of 80 dwellings, with a typical floor area of 250m2, both cost tables are the findings of a concreting process to a typical floor for COC and three floors for CONC, to establish an average m/2 rate.
Table 7.
| Cost of Conformance (COC) to a Typical Floor | |||
| No. | Name | Costs (AUD$) | Comments |
| 1. | Formwork | $257,000 | Materials & Labour |
| 2. | Concrete | $128,500 | Materials & Labour |
| 3. | Reinforcement | $77,100 | Materials & Labour |
| 4. | Tools & Equipment | $38,550 | Tower Crane |
| 5. | Material Testing | $550
$250 $800 |
Concrete
Reinforcing Total |
| Total Costs of Conformance | $245,207 | Typical Floor area of 250m2 = COC $980.82/m2 | |
Table 7.
| Cost of Conformance (COC) to a Typical Floor | |||||
| No. | Description of Floor | No. of Occurrences | Total Repair Hours | $/PH (AUD) | $ Cost to repair (AUD) |
| 1. | Level 1 | 15 | 45 | 50 | 2250 |
| 2. | Level 3 | 27 | 81 | 50 | 4050 |
| 3. | Level 5 | 20 | 60 | 50 | 3000 |
| Total Costs 9300 @ Average floor area of 250m2 = CONC of $37.20/pm2 | |||||
- Analysis & Prioritising of Activities
The PCM’s application to understand the quality costs in the process of concreting a typical floor(s). Essentially the model provided relevant information & data to identify key activities and actions where decisions can be made to minimise and reduce the COC. Taking into consideration the COC, in view of the analysed data, the costs to the tower crane make up a reasonable portion the costs for the equipment is difficult to minimise. Effectively, with the higher costs to the formwork placement and the ongoing issues related to the support and the setting out to each floor, which is where the additional costs are occurring, and to achieve conformance for this work package, additional human & financial resources are required. The recommendation is that of a preventative one, to review the; internal quality procedures, method performance, product performance analysis and the current position of corrective improvement actions Oakland (2014, 212).
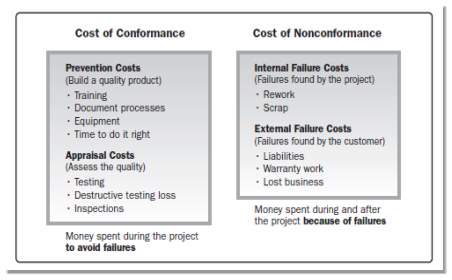
Figure 4 – Examples of Cost of Quality PMI (2013, 235)
The objective is effectively product improvement, for that reason and to ensure product conformance, (with a strategic mindset) a review of the processors are required, these include; a complete rethink of the process, with an action plan to move forward, likewise some new ideas to be implemented by brainstorming fresh approaches, human resource training to understand the correct processors, and possibly a reengineering of the methodologies to overall minimise costs and rework.
Quality Assurance
As stated within ISO 9000Australia (2015, 9) quality assurance is described as “focused on providing confidence that quality requirements will be fulfilled”. However within PMBOC PMI (2013, 242) quality assurance is the auditing process of the requirements, plus the outcomes from the control measurements, effectively ensuring that the quality principles and the functional standards are applied. As depicted within Figure 4, the inputs, tools, and the outputs of the data flow diagram, and quite simply QA is the execution process from the information created from the QM & the QC processors. Lastly, and more interestingly as noted within PMBOC PMI (2013, 245) QA falls within the conformance works category in the COQ structure.
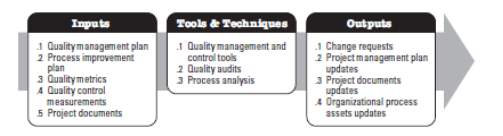
Figure 4 – Quality Assurance Flow Illustration PMI (2013, 243)
- Fulfil Requirements
The three nominated requirements are; cabinetry fit outs to the apartments, a typical concrete floor slab and the building licence documentation for authority approval. Firstly, QA is a direct focus on a series of guidelines which are essential to quality, therefore to ensure the QA requirements are met, the team must follow the quality management plan, with inspections, test plans, plus the use of defect tracking tools plus the initial and ongoing training of people in the methodologies and processors. What’s more, it is key to undertake QA at the inception of the project to mitigate any risks which may have been identified in the early phases, plus clear communication plays a crucial role in the management of the project, to fulfil the requirements and important to realize effective QA. Overall, to deliver on the project and fulfil the QA requirements, the team must abide and follow the QA process as documented as set down in the Quality Management Plan, plus ensuring the pre-set measurement criteria are realized.
- Preventative Actions
On any level, well-educated individual’s that are within or are looking at entering the workforce, there will always be a need for ongoing training, development and education, hence as a key requirement to quality or any other field, a solid training plan is important to business success. For that reason, a well-thought-out training plan is a key preventative act when it comes to such areas as; technical, product, resources, costs, and organization training, plus items such as quality realization Juran and Godfrey (1999, 455). Establishing rigorous training programs, effectively will advance the skills of the employees, plus ongoing training enhances new thought ideas within the team, potentially invoking improvement and innovation, which can cause the prevention of nonconformities. Figure 5, demonstrates QA flow chart for the documentation process.
- Quality Assurance Tool – Documentation Flowchart
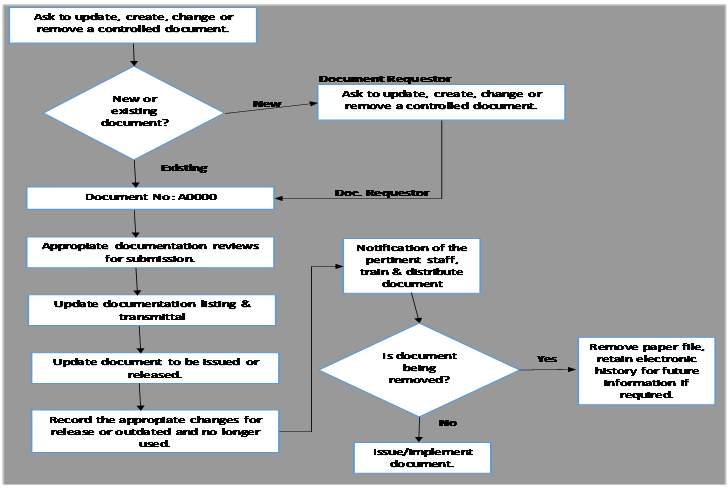
Figure 5 – Documentation QA Flow Chart
Quality Control
As stated within PMI (2014, 248) the control of quality is effectively the recording and observing the data and actions, to essentially evaluate the performance, and therefore make the recommended changes. Fundamentally, QC is the identification of the reasons to the bad process or the product and having an action plan to correct or to remove, plus communicating to the relevant stakeholders the pertinent information for subsequent approvals.
- QC Measurements
Prior to identifying the deliverables, it should be noted that QC measurements are effectively the results of QC activities, which are used to analyse the performance of the criteria which has been specified. Now, the two interim deliverables or work packages, these are; the placement of a typical concrete slab and the instillation of the kitchen, Bathroom & laundry cupboards. In terms of the measurement which shall assist in the control these work packages, one of the key project measurements shall be the use of quality metrics, which sets down the benchmark or the criteria of these and for that matter all the work packages. In addition, to ensure further control over the product, the team shall be performing such activities to measure the product by; reviewing of work performance data & checklists, and conducting technical quality audits and presenting all the data, reports and information to management and the team.
- Corrective Actions
As stated with ISO/Australia (2016, 13) a corrective action is “an action to eliminate the cause of a detected nonconformity or other undesirable situation”, plus to add further meaning to this term, it is also described as a task or an activity that is effectively is directly in line with the project works with the management plan PMI (2013, 93). Essentially, a corrective action is where the problem is eliminated, ensuring that is doesn’t reoccur. Such examples for both of these work packages, can be to conduct workplace inspections, to ensure the correct process and procedures are carried out, plus the further inspection, testing and the monitoring of any plant and equipment (I.e. Formwork, Tools, and Machinery), therefore ensuring the task or activity is performed right the first time. As shown within Table 8, the QC check sheet is one of many tools which are used on site to control any actions, in turn if any preventative actions are identified from the checklist, then a possible change request can be recommended for corrective or preventative actions.
- Quality Tool
Table 8
| Concrete Placement Checklist | Job Number
|
Project | Page 1/1 |
| Contractor: ABC Contractor Specific Location: Area Or Building: 1st Floor Lift No: 2 Shift: DAY
Elevation:EAST To Elev. Concrete Type: STD Mix No. 10 Additives: AGGRIGATE Computed Qty: NA |
|||
| Location Sketch: Refer to 1st Floor Structural Drawing – S001
|
|||
Replacement Verification
CABLES/GROUND X WIRE X CONDUIT X BOXES X OTHER COMPLETE/ACCEPTABLE TO DRAWING APPROVED REV. 5 SIGNATURE DATE APRIL 2017
MECHANICAL INSERTS X PIPING SLEEVES X MECH. FRAMES X OTHER COMPLETE/ACCEPTABLE TO DRAWING: APPROVED REV. 6 SIGNATURE DATE APRIL 2017
ROCK CROSS SECTIONS TAKEN APPROVED ROCK SURFACES PREPARED APPROVED SCREEDS SET APPROVED LINE AND GRADE ESTABLISHED APPROVED FORMS REINFORCING STEEL ALIGNMENT: X BRACING/SHORING: X CORRECT SIZE/GRADE: X LOCATION: FIRST FLOOR INTERIOR SURFACE: X RELEASE AGENT: X LAPS. ADEQ. SECURED: X JOINTS PREPARED: X WATER STOPS: X WIRE TIES/FORM RODS: X PLACEMENT/CONSOLIDATION EQUIPMENT AVAILABLE/ADEQUATE: APPROVED QUALITY OBSERVATIONS: SEE REMARKS BELOW WATER REMOVED NA FINAL CLEANING ACCEPTABLE: APPROVED COMPLETE/ACCEPTABLE TO DRAWING: APPROVED REV. SIGNATURE DATE: APRIL 2017 QUALITY CONTROL INSPECTION VERIFICATION SIGNATURE: X DATE: APRIL 2017 OBSERVATIONS/REMARKS: REQUIRE COMPLETE AUDIT OF PLACEMENT PROCESS ENSURE NO HONEYCOMBING OF CONCRETE – FOR CLASS 1 FINISH. NOTE: POSSIBLE CHANGE REQUEST INTO PROCESS & PROCEDURE.
AUTHORIZATION FOR PLACEMENT
DATE APRIL 2017 |
|||

 CONSTRUCTION MANAGER
Reflection
“Designing customer satisfaction into the product of a project”
Consumer fulfilment on any level is important and is a key requirement to any leading or newly created business, as part of the business strategy is the measurement of satisfaction as a key gauge for the performance of the product or service, this in turn is a measurement for the business success. Essentially, the strategy is predicated upon a good level of reason where the assumption is that a high level of customer satisfaction effectively leads to customer loyalty, and in turn leads to repeat business and product turnover Matzler and Hinterhuber (1998, 26).
Through much empirical research this paper has identified various methods in which the designing of customer satisfaction can be achieved in a product or service. Research has indicated a common reference to “Quality Function Deployment” or QFD which has become quite popular in recent years. The method was embraced by Japanese industrialists in the electronics, clothing, synthetic rubber, sectors in the early 70’s, using the “house of quality” concept. Nonetheless, this paper will review Kano’s model of customer satisfaction into QFD, to validate the design of customer satisfaction can be achieved in a project or product.
When it comes to customer satisfaction and market share, customer satisfaction and loyalty, these two elements are interrelated, and as stated within Matzler and Hinterhuber (1998, 26) “Customer satisfaction is the ultimate objective of every business; not to supply, not to sell, but to satisfy the needs that drive customers to do business”. Capturing market share is an offensive strategy, the calculated intent is not to capture the volume of customers than the competitor, but to have an overall advantage within certain market segments, in turn create a substantial level of customer satisfaction and loyalty. For that reason, having market share is a direct consequence of loyalty, plus having a high rate of retaining the customer base has an additional effect with market share due to pleased customers Matzler and Hinterhuber (1998, 27). Previously in this paper (Figure 1), Kano’s model for customer achievement in products, projects or a service, plus his three key features are: Must be, One Dimensional and Attractive Requirements respectfully. With those three key features in mind, a method to effectively analyse the requirements of the customer or simply the thought process of “walk in your customer’s shoes”. Principally, it’s a four step process, (Figure 7) the first being, the identification of your customers’ needs and expectations; secondly, a questionnaire document to understand the needs and wants of the customer, with an example such as; with each product feature, a series of questions are given so that the customer can answer in one of five various ways. Thirdly, the review of the customer’s responses and interviews, and lastly the understanding and evaluation of the results, which can be broken down into two categories being; the evaluation by interpretation and the evaluation by the frequency of the numbers.
Overall, with the use of the Kano model and integrating that with QFD, for the design of customer satisfaction, in regards to gaining a competitive market advantage, the overall objective is the continual improvement to customer satisfaction. Company measures can be made through the understanding of customer satisfaction, through the perception of product quality and what influences the perception, this can be a huge benefit for the organization to increase market share. Lastly, the reflection on this question “Designing customer satisfaction into the product of a project” is an interesting one, the heading as stated within Matzler and Hinterhuber (1998) which is rather pertinent for this problem “Walk in your customers shoes” speaks volumes where there are substantial company benefits to embrace a model with systematic processes which can aid in product design from customer gratification.
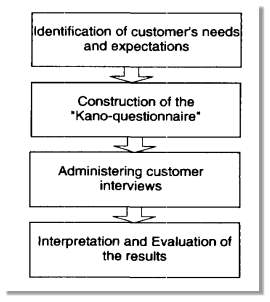
Figure 7 – Steps to implement Kano’s Project Matzler and Hinterhuber (1998, 30)
References
Aragón-Sánchez, Antonio, Isabel Barba-Aragón, and Raquel Sanz-Valle. 2003. “Effects of training on business results.” The International Journal of Human Resource Management 14 (6):956-980.
Arditi, David, and H Murat Gunaydin. 1997. “Total quality management in the construction process.” International Journal of Project Management 15 (4):235-243.
Australia, Standards. 2004. 3906 Quality of Service—Guide to Customer Expectations. Australia: SAI Global.
Australia, Standards 9000. 2015. AS/ISO 9000: Quality management systems — Fundamentals and vocabulary. Published in Switzerland.
Australia, Standards 2016. AS/ISO 9000 Quality Management Systems— Fundermentals & Vocabulary. GPO Box 476, Sydney, NSW 2001 and by Standards New Zealand, Private Bag 2439, Wellington 6140.: SAI Global Limited
Australia, Standards 2009. AS/ISO 9004 – Managing for the sustained success of an organization — A quality management approach. Switzerland: ISO.
Beckett-Camarata, Elizabeth Jane, Martin R. Camarata, and Randolph T. Barker. 1998. “Integrating internal and external customer relationships through relationship management: A strategic response to a changing global environment.” Journal of Business Research 41 (1):71-81. doi: 10.1016/S0148-2963(97)00013-1.
Franceschini, Fiorenzo. 2001. “Applying Quality Function Deployment.” In Advanced Quality Function Deployment, 35-59. CRC Press.
Hansen, Don R. 2009. Cost management : accounting & control / Don R. Hansen, Maryanne M. Mowen, Liming Guan. Edited by Maryanne M. Mowen and Liming Guan. 6th ed.. ed, Cost management : accounting and control. Mason, Ohio: Mason, Ohio : Thomson/South-Western.
Juran, Joseph, and A Blanton Godfrey. 1999. “Quality handbook.” Republished McGraw-Hill.
Larson, Erik W. author. 2014. Project Management : The Managerial Process / Erik W. Larson, Beverley Honig, Clifford F. Gray, Ursula Dantin, David Baccarini. Edited by Beverley author Honig, Clifford F. author Gray, Ursula author Dantin and David author Baccarini. [Australian edition]. ed. Australia: North Ryde, NSW : McGraw-Hill education.
Matzler, Kurt, and Hans H Hinterhuber. 1998. “How to make product development projects more successful by integrating Kano’s model of customer satisfaction into quality function deployment.” Technovation 18 (1):25-38.
Oakland, John S. 2014. Total quality management and operational excellence: text with cases: Routledge.
PMI, PMI. 2013. A guide to the Project Management Body of Knowledge (PMBOK guide), fifth edition. Edited by Institute Project Management. Five ed, Guide to the Project Management Body of Knowledge. 14 Campus Boulevard Newtown Square, Pennsylvania USA: Newtown Square, Pa. Project Management Institute.
PMI, PMI. 2016. Requirements Management: A Practice Guide. 1 ed. Vol. 1. Newtown Square, Pennsylvania USA: Project Management Institute.
PMI, PMI, CYNTHIA STACKPOLE SNYDER. 2014. A Project Manager’s Book of Forms: A Companion to the PMBOK® Guide-Fifth Edition. Vol. 28, PM Network. Drexel Hill.
Rad, Parviz F. 2006. Metrics for project management : formalized approaches / Parviz F. Rad, Ginger Levin. Edited by Ginger Levin. Vienna, VA: Vienna, VA : Management Concepts.
Ruud, Kari L., Jeffrey R. Leland, Juliette T. Liesinger, Matthew G. Johnson, Andrew J. Majka, and James M. Naessens. 2012. “Effectiveness of a Quality Improvement Training Course.” American Journal of Medical Quality 27 (2):130-138. doi: 10.1177/1062860611415391.
Sauerwein, Elmar, Franz Bailom, Kurt Matzler, and Hans H Hinterhuber. 1996. “The Kano model: How to delight your customers.” International Working Seminar on Production Economics.
Tang, S. L., Raymond T. Aoieong, and Syed M. Ahmed. 2004. “The use of Process Cost Model (PCM) for measuring quality costs of construction projects: model testing.” Construction Management and Economics 22 (3):263-275. doi: 10.1080/0144619032000064091.
Tuunanen, Tuure. 2003. “A NEW PERSPECTIVE ON REQUIREMENTS ELICITATION METHODS.” JITTA : Journal of Information Technology Theory and Application 5 (3):45-62.
Cite This Work
To export a reference to this article please select a referencing stye below:
Related Services
View all


Related Content
All TagsContent relating to: "Quality Management"
Quality management is the act of overseeing activities and tasks that are required to achieve or maintain product or service quality. There are four main components of quality management: planning or quality policy, quality assurance, quality control and quality improvement.
Related Articles

DMCA / Removal Request
If you are the original writer of this dissertation and no longer wish to have your work published on the UKDiss.com website then please: