Investment Analysis and Portfolio Management
Info: 7561 words (30 pages) Dissertation
Published: 11th Dec 2019
Tagged: Finance
PORTFOLIO OUTLINE
| Sr. No. | INDEX | PAGE NUMBER |
| 1. | Introduction. | |
| 2. | Fund Details. | |
| 2.1 | Name of Fund. | |
| 2.2 | Investment Policy. | |
| 2.2.1 | Objective of Fund. | |
| 2.2.2 | Target customer. | |
| 2.2.3 | Type of fund. | |
| 2.2.4 | Investment strategy. | |
| a) Short Term. | ||
| b) Intermediate term. | ||
| c) Investment Diversification. | ||
| d) Finance and Audit Committee approval. | ||
| e) Investment responsibilities. | ||
| 3. | List of assets/asset class and justification for selection. | |
| 4. | Asset Allocation Process | |
| 5. | Portfolio Evaluation | |
| 6. | Costs (exit loads) | |
| 7. | Portfolio managers’ background | |
| 8. | Conclusions | |
| Annexure | ||
| References |
1. Introduction: G10 is an asset management company offering mutual fund schemes to different investor categories to match investment objectives. The mutual fund schemes are open to Resident Individual Investors(RII’s), Institutions, Non-Resident Indians(NRI’s), Foreign Institutional Investors and High Net worth Individuals(HNI’s). G10 offers two mutual fund schemes: 1) Equity Mutual Fund: A multi-cap oriented equity scheme 2) Indices Mutual Fund: An index mutual fund scheme that derives its NAV from the underlying value of different indices across the globe. G10 was set up in 2016 and has been tracking the portfolio returns since 2011.
2. Fund Details:
| Scheme | Exposure | Tenure | Tax Exempt | Expected Returns |
| Equity Mutual Fund | Domestic Markets | 5 years | If held for >12 months | 20% |
| Indices Mutual Fund | Global Markets | 10 years | If held for >12 months | 12% |
2.1 Name of Fund: G10 Wealth Builder Fund
2.2 Investment Policy:
- Equity Mutual Fund: The fund focuses on wealth creation and thus invests in companies that are reinvesting their profits back in their business. The scheme is actively managed with investments in a diversified basket of equity stocks and churning those that fail to perform.
- Indices Mutual Fund: The scheme mimics the returns of with the aim to not beat the existing indices but to be the indices. We track the growth potential in various economies and invest in those to optimize on risk-return.
2.2.1 Objective of Fund:
- Long term growth of capital
- Prudently manage risk by diversifying investments
- Capitalize on growth opportunities
- Returns take the front seat
2.2.2 Target Customer:
| Scheme | Age Group | Net Worth | Risk Appetite | Objective |
| Equity Mutual Fund | 25-45 | – | Medium-High | Capital Appreciation |
| Indices Mutual Fund | – | > 2 Cr. | High | Capital Appreciation |
2.2.3 Type of Fund:
| Scheme | Type | Orientation | NAV buy back |
| Equity Mutual Fund | Growth Fund | Multi-Cap | Open-Ended |
| Indices Mutual Fund | Growth Fund | Indices | Open-Ended |
2.2.4 Investment Strategy:
- Short Term Strategy: The fund churns the portfolio on a 6 monthly basis. It assess the performance of the stocks and indices comprised in the portfolio with respect to others and the highest performing with respect to risk taken up to get that return is retained. The churn sees a diversification in the portfolio from the previous portfolio with respect to the industry to balance out the drastic effect of downtrend in one industry.
- Intermediate Strategy: To track the return of the portfolio and churn or not churn according to performance and risk of portfolio with respect to returns of the stock market index. In case of the equity mutual fund the intermediate strategy is replicated for long term, while in case of index mutual fund the entire portfolio is eventually retained.
- Investment Diversification:
Equity Mutual Fund:
- March 2011 – March 2016: Concentric Diversification
- The portfolio comprises of stocks on relating to the Finance and Investments industry in India which includes : JSW Holdings, JM Financials, Bajaj Finserv and Max Financial.
- September 2011 – September 2016: Forward Integration
- The portfolio comprises of stocks that are related to the Finance and Investments industry that move down the value chain such as Banking and Housing Finance which includes: Bajaj Finserv, YesBank, HDFCBank and LIC Housing Finance.
- March 2012 – March 2017: Unrelated Diversification
- The portfolio now diversifies into stocks of all industries to take the maximum advantage of growth prospects in the market and includes: MarutiSuzuki, Spice-Jet, HindustanUnilever and IndiabullsVentures.
Indices Mutual Fund:
- March 2011 – March 2016: Global Diversification
- The portfolio comprises of indexes of underdeveloped, developing and developed economies which include : S&P 500, TECALL, NSE20 , FTSE China A-H 50.
- September 2011 – September 2016: Forward Integration
- The portfolio comprises of indexes relating to the Global indexes of developing and developed economies which include : S&P 500, NYSE, HANGSENG , NIFTY50.
- March 2012 – March 2017: Unrelated Diversification
- The portfolio comprises of indexes relating to the Global indexes which include : S&P 500,NYSE , NIFTY50 , HANGSENG. All the indexes of the above period were held on to with anticipation of further uptrend.
- Investment Responsibilities: The Sponsor will not be responsible for any loss on capital and investors cannot sue for the same. There is no guaranteed returned only an estimation subject to market conditions.
- Audit and Finance Committee: The audit committee is appointed by the trustees and must be independent. As the AMC has schemes and accounts independent of each other, there must be an unbiased and detailed review of both. Further the Audit Committee chaired by an independent director of the Trustee is responsible for: Review of the periodic financial statements of the Trustee and Mutual Fund including audit observations, and review the internal audit systems and internal and statutory audit reports. They also recommend appointment of auditors.
3. List of Assets and Justification
3.1 EQUITY MUTUAL FUND
March 2011 – March 2016:
Bajaj Finserv Ltd.:
Bajaj Finserv Ltd. is a financial conglomerate with significant presence in lending, general and life insurance. It operates as the financial services holding company of the group, and holds stakes in three key businesses: Bajaj Finance Ltd, the NBFC, Bajaj Allianz General Insurance and Bajaj Allianz Life Insurance. BFS holds 57.5 percent in Bajaj Finance Limited and 74 percent each in the insurance firms which are joint ventures with Allianz of Germany. Bajaj Finance’s net profit grew at an annual rate of 39% between FY11-FY15 and market capitalization has grown sharply to Rs27,112Cr. as of March’16, from Rs7,590Cr. on March’11, a CAGR of 29% over the past five years.
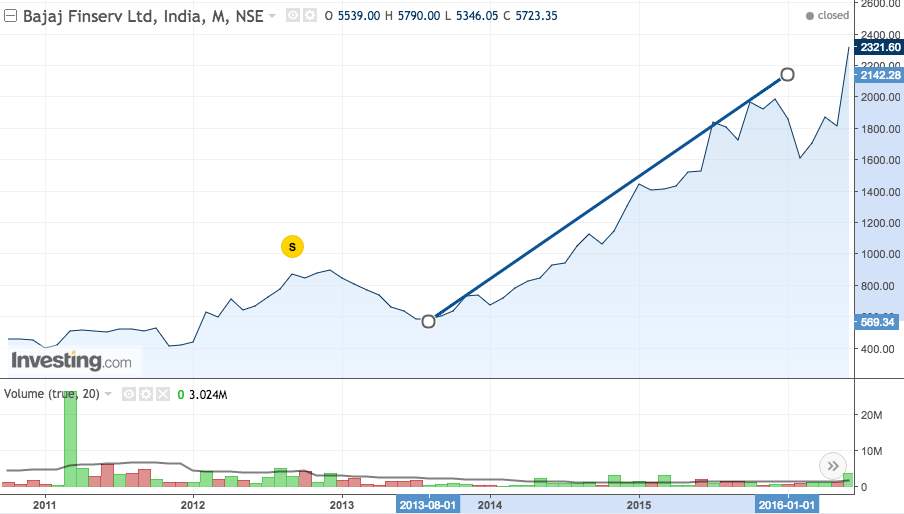
Chart 1.1: 5 Year Performance Of Bajaj Finserv Ltd.
JM Financials:
It is one of India’s prominent financial services groups, specializing in providing a spectrum of businesses to corporations, financial institutions, high net-worth individuals and retail investors. Investment by Vikram Pandit in 2013, former CEO of CitiBank gave an impetus to the company’s credibility. In 2014, consolidated revenue was up by 65% and consolidated profit up by 97%. For 2015, the diversified financial services company has reported a 21% increase in net profit. In 2016, the company declared a final dividend of 85%, followed by a continuous upward trend in the share price, touching a high of Rs50 from Rs19 in 2012. JM Financials is a definite multi-bagger share.
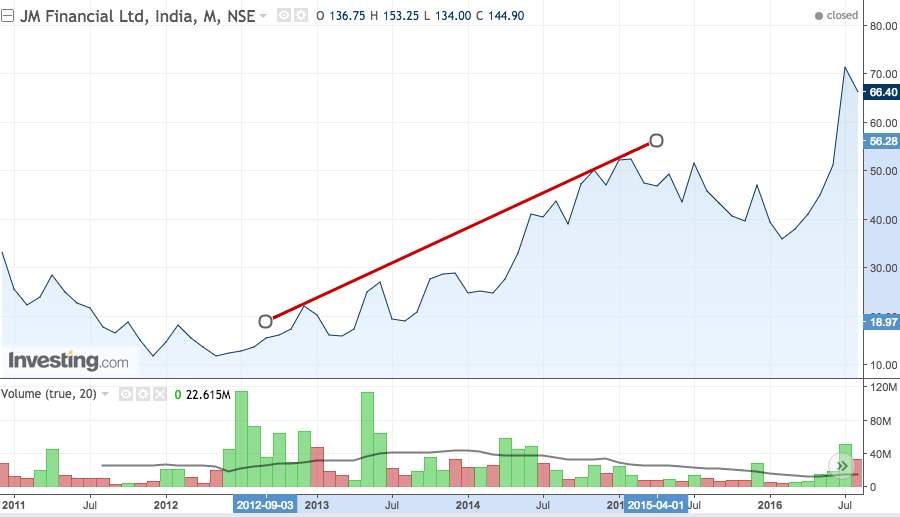
Chart 1.2: 5 Year Performance Of JM Financial Ltd.
Jindal South West Holdings Ltd.(JSW):
JSW is a conglomerate non-banking financial company. The company’s main holdings are in JSW Group’s Steel companies. JSW Holdings market cap in 2011 was INR4200 Million and by 2016 has reached an astonishing INR 4958 million, which shows that it has more than tripled in just 5 years. 2015 proved to be a remarkable year for JSW Holdings for it was declared the largest steel maker in India, with revenues that surpassed the revenues of SAIL and Tata Steel India. The total revenue of JSW Holdings has increased by a staggering 108.33% from 2011 to 2016. The jump in revenue and increase in customer base is the reason for the stock selection.
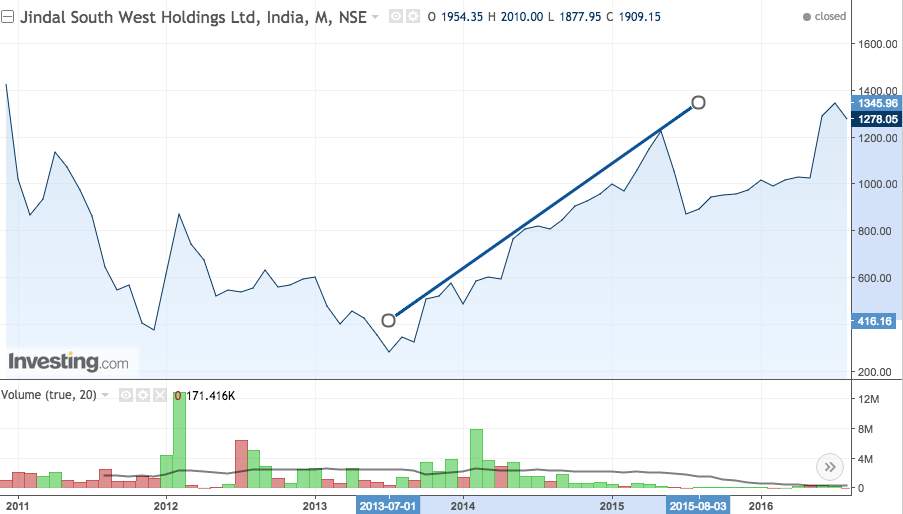
Chart 1.3: 5 Year Performance Of Jindal South West Holdings Ltd.
Max Financial Services Limited(MFS):
MFS, a part of the US$ 3 billion Max Group, a Rs17,000 crore conglomerate that is the holding company for Max Life, India’s largest non-bank, private life insurance company. The share price of Max Financial Services Ltd has risen by an approximate 268.5% in the past 5 years, from 2011 to 2016. The market capitalization of the company was INR 34466 million in 2011, and by 2016 it was a remarkable INR 146441 million! The continued uptrend and increase in market capitalization is the reason for the stock identification.
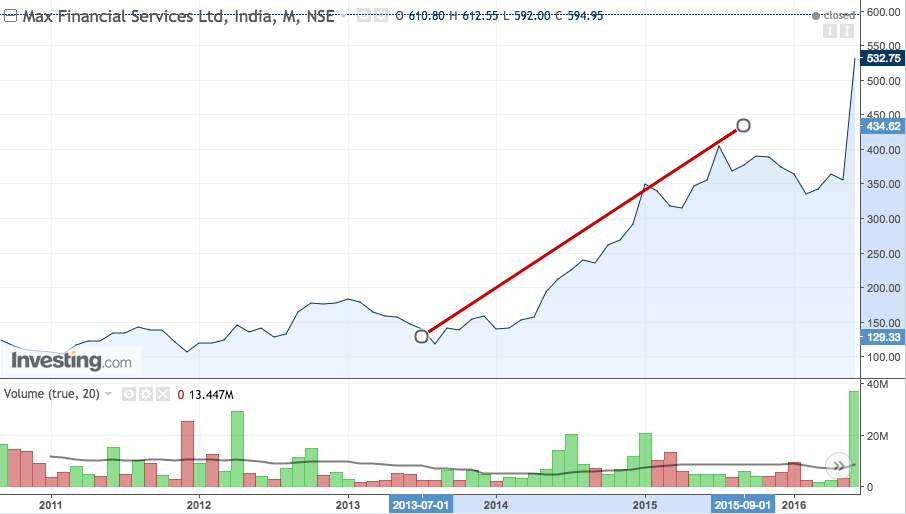
Chart 1.4: 5 Year Performance Of Max Financial Services Ltd.
September 2011 – September 2016
Yes Bank:
It’s India’s fifth largest private sector bank. It held the only Greenfield bank license awarded by RBI for 12 years till the recent round of new licenses. Yes Bank is recognized amongst the top and fastest growing banks in various Indian Banking league tables. It has a seen a sharp increase in its sharp rise from Rs 267.45 in Sept’11 to Rs 846.35 in Sept’16. The cash EPS has increased from Rs 21.95 in March 2011 to Rs 63.02 in March 2016 and revenue and net profit of the company has increased constantly at a phenomenal rate which makes it an attractive stock to invest in (net profit at a five year CAGR of 29.7% from Rs 727.14 crores in March 2011 to Rs 2539.45 crores in March 2016.
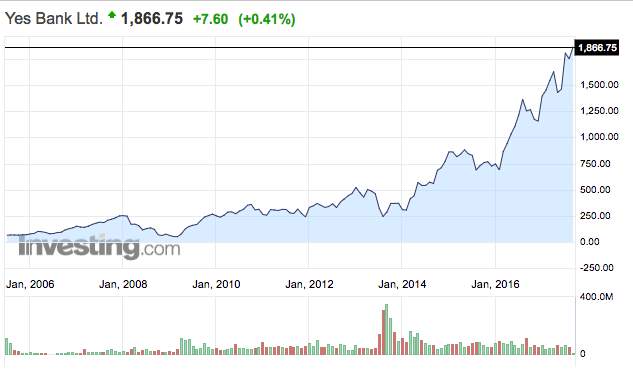
Chart 1.5: 5 Year Performance Of Yes Bank.
HDFC Bank:
It’s the largest bank in India by market capitalization and second highest valued company in the Indian Stock Market. Its share price has increased from Rs450.10 in Sept’11 to Rs1277.50 in Sept’16. The cash EPS saw an increase from Rs24.33 in March’12 to Rs51.43 in Mar’16 and revenue grew from Rs24263Cr to Rs70973Cr and so did the net profit from Rs 3926Cr. to Rs12296Cr. Healthy growth in earnings, good management, highest return ratios in the sector have been driving investors to this stock. HDFC bank’s profit is likely to grow because of its better asset quality parameters, steady deposit base and strong net interest margin. It also has great scope for acquisitions and mergers because of its strong financial position. Its market capitalization stood at a whooping Rs2708Billion on March’16. The continued outperformance of the bank with respect to the industry is the reason for the stock selection.
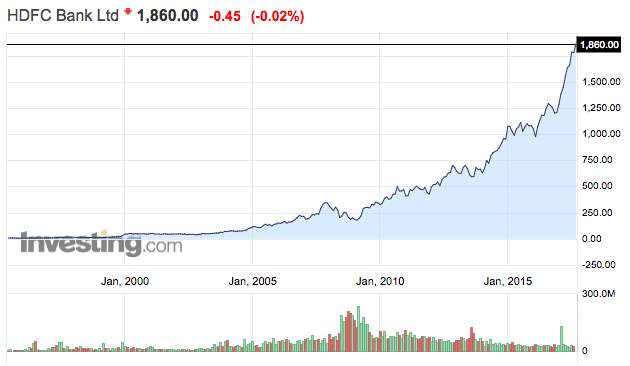
Chart 1.6: 10 Year Performance Of HDFC Bank.
LIC Housing Finance:
It is the second largest housing finance company. It saw an increase in its share price from Rs204.50 in Sept’11 to Rs563.60 in Sept’16. The cash EPS grew from Rs9.20 in March’12 to Rs33.08 in March’16 and revenue increased at a rapid pace from Rs 6215Cr. to Rs12485Cr. and so did the net profit from Rs914Cr. to Rs1660Cr. Its market capitalization has increased from Rs10701Cr. on March’11 to more than Rs24000Cr. on March’16. It has the third highest market capitalization among housing finance companies and its total assets are second only to HDFC. Strong performance in an increasingly competitive market is the reason for stock selection.
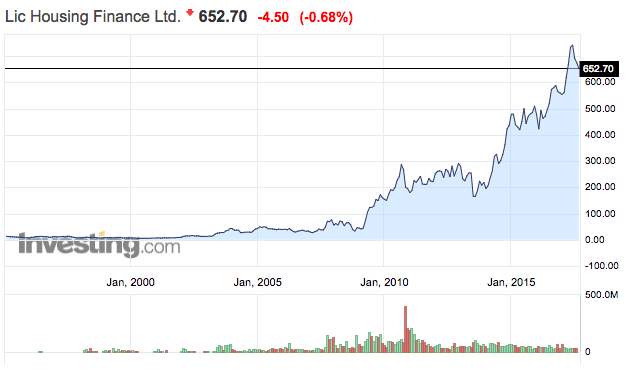
Chart 1.7: 10 Year Performance Of LIC Housing Finance.
BAJAJ FINSERV:
Bajaj Finserv was the only stock retained due its efficient tradeoff of risk and return. It gave the highest return of 28.7% with a standard deviation of 0.32. Although the risk is higher than that of the market, investors are getting much better returns for every unit of risk. It also outperformed the other previous stocks in the portfolio by 10-12%. Bajaj Finserv has been turned into a powerhouse under Sanjiv Bajaj. The business model is very sound and we have seen in every quarter that their numbers have shown steady uptick.
March 2012 – March 2017
Maruti Suzuki India Ltd:
The leading car manufacturer in the Indian automobile sector, has seen its share price rise from ₹1275 in FY13 to ₹6035 in FY17. It has a current market share of 51% in the extremely competitive Indian passenger car market. The CAGR of net sales of Maruti Suzuki India ltd. has been 13.5% and the CAGR of adjusted EPS has been 28.4% over the last 5 years which makes it a very lucrative stock to invest in. Currently, Maruti Suzuki India ltd. is the 7th most valuable company of the country with a market capitalization of around ₹2400Billion. Also, various external factors such as entry of cab service providers such as Ola and Uber who hire or purchase small and mid-size cars generally, affording power of a large chunk of Indian car buyers being within Maruti Suzuki’s offering range, among others have contributed to its dominance.
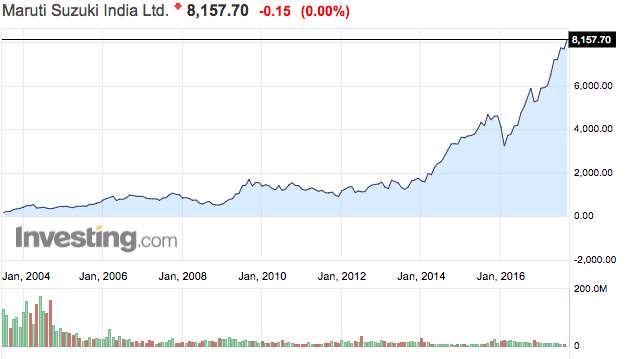
Chart 1.8: 10 Year Performance Of Maruti Suzuki Ltd.
SPICEJET
The third largest airline in the country in terms of domestic passengers carried, with a market share of 14.2% as of July 2017. Spicejet, which was on the brink of closure in 2014, has seen a turnaround ever since Ajay Singh took back control from Sun TV promoter Kalanithi Maran in February 2015. Spicejet is currently the second most valued airline in Indian market after Indigo with a market cap of around ₹8500 crore and has registered profit for the last eight consecutive quarters , over 90 per cent load factor for 23 consecutive months and the best on-time performance among all airlines for five months in a row. The share price of Spicejet which was a meagre ₹27 in FY12 was ₹100 in FY17 and is ₹146 as of 12th Sept,2017. The cash EPS has turned to a positive ₹8.75 in FY16 from a negative ₹13.02 in FY12. Strong revival is the reason for stock selection.
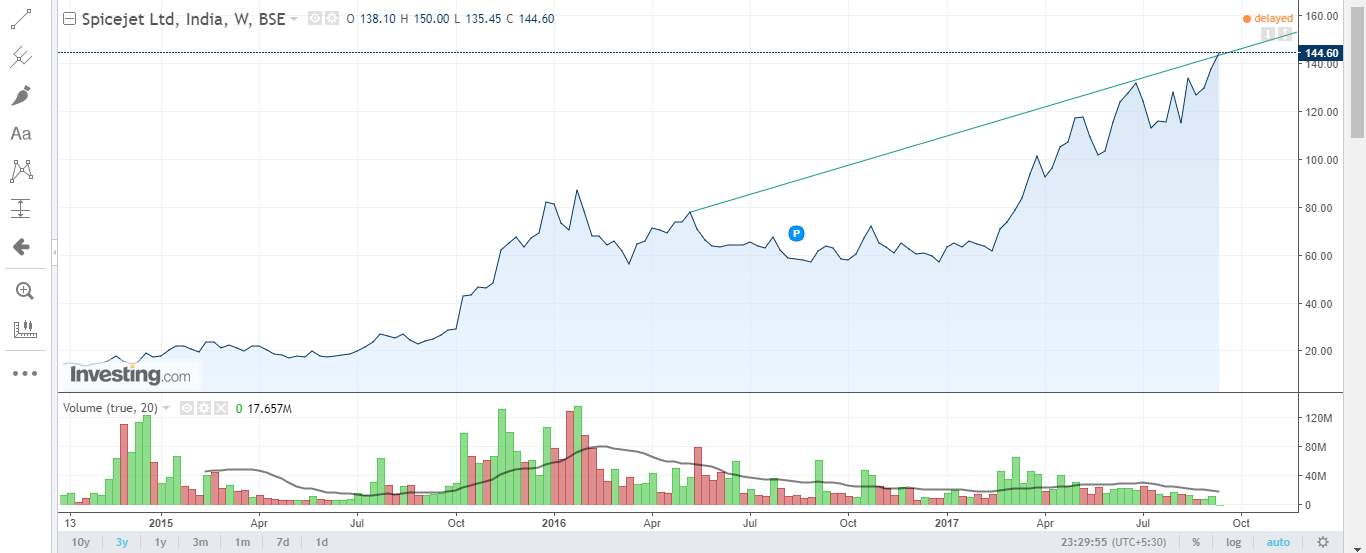
Chart 1.9: 3 Year Performance Of SpiceJet
HINDUSTAN UNILEVER (HUL)
HUL is an Indian consumer goods company with a market cap of around ₹2600 Billion. From ₹437 in FY13, the share price of HUL has constantly risen and stands at ₹1250 as of Sept’17. The average profit growth has been around 4% over the past years. The cash EPS has risen to ₹22.62 in FY17 from ₹18.65 in FY12 and also the net profit/share has risen to ₹20.79 from ₹17.56. Despite nominal profit growth, the stock has performed well as given its market position it is best poised to exploit the growing consumer market in the country..
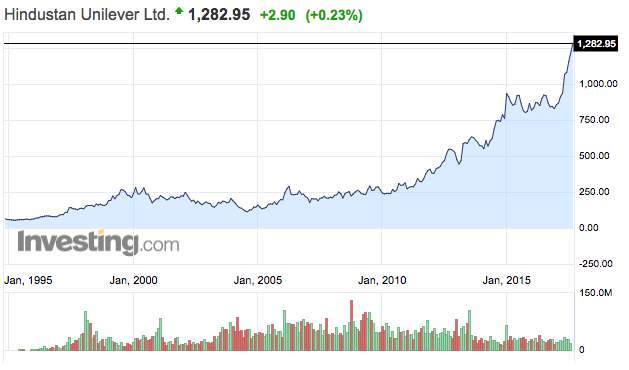
Chart 1.10: 20 Year Performance Of HUL.
Indiabulls Venture
It is one of India’s leading capital markets companies. The price ranged from Rs.8 to Rs.27 in the first 4 years, but has seen a spectacular rise in the last one year. The stock was kept in the portfolio in anticipation of it turning into a multibagger stock. It has seen its revenues fluctuate in tandem with the economic sentiment of investorstowards equity markets. Its profits peaked in FY2008 and kept on falling until FY2012 in the aftermath of global economic meltdown. Its profits have picked up since then and have been growing at a rate of about 20% Y-o-Y and were Rs.47.09Cr in FY17. It’s a high beta stock but has been identified as a potential game changer.
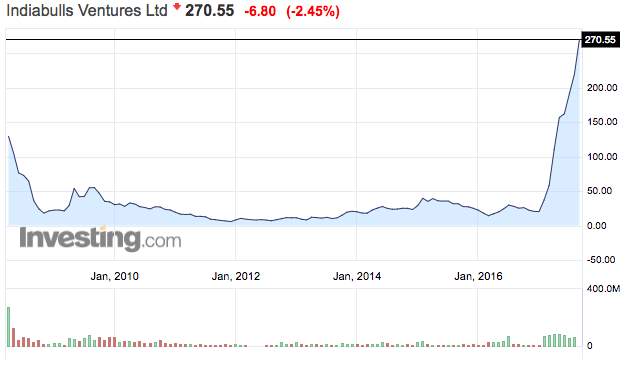
Chart 1.11: 10 Year Performance Of Indiabulls Ventures Ltd.
3.2 INDICES MUTUAL FUND
March 2011 – March 2016:
S&P 500 Financial Index: This US Index is one of the most well-known stock index and focuses on the finance stocks within the S&P 500 Index and compliments the investment in financial stocks in the domestic market. Since 2012, it has grown at a CAGR of 6.8% and technical charts indicate an inevitable burst in the index as per Bollinger Bands. The expansionary monetary policy of the Fed, sustained low interest era, positive consumer growth and start of the revival of housing finance industry have all contributed to the growth of this index. The fundamentals of this index remain strong with Trailing P/E at $16.21 and companies like Berkshire Hathaway, J P Morgan, Citigroup, Goldman Sachs rallying over the years forming a strong case for investment in this index.
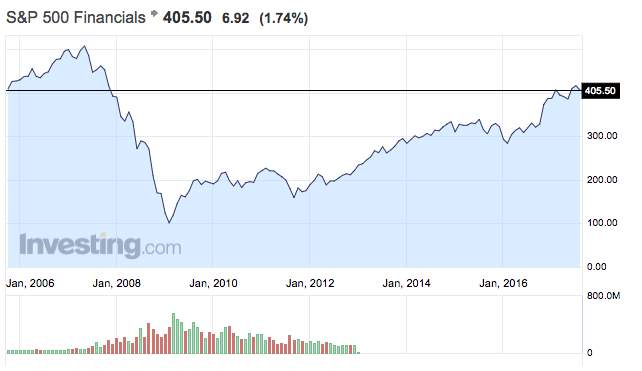
Chart 2.1: 10 Year Performance Of S&P 500 Financials.
TECALL:
Germany was ranked 10th in the Global Innovation Index in 2011 which can be directly correlated to its technology industry. The technological environment has improved significantly in Germany due to the liberal policy of the government which was adopted in 2011 and in March’2011 the stock market showed revival as it crossed 1000 points and it is still rallying in March’2016 when it reached a range of 2000-2050. Dividend matters for most of the German stocks and it holds true in the case of technology stocks too, the dividend adjusted price elevates the returns exponentially. Stocks like Technotrans, Suess Microtech and Sinnerschrader have generated 150% returns over a 3 period.
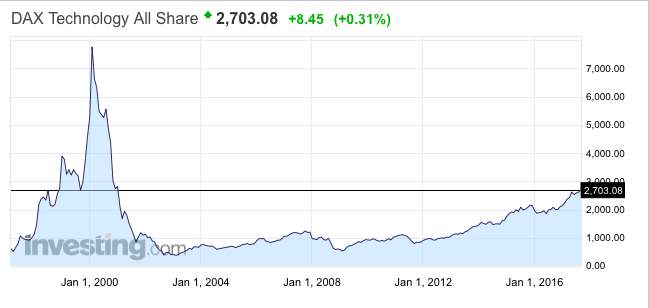
Chart 2.2: 15 Year Performance Of DAX TECALL.
NSE 20 (Nairobi Securities Exchange Ltd 20 Share Index):
Investing in an index of an underdeveloped country is always a risky investment, it’s like investing in a small cap stock, the return prospectives are huge but so is the risk. We have chosen to invest in Kenya as data shows that it is the fastest growing country in Africa aided by the strong business ties with USA during President Obama’s administration. Entering into the index of this country will allow us to have an open position in anticipation of long term economic boom. The NSE20 consists of technological and scientific companies that have attracted large investments from venture capitalists like Google, IBM, Facebook, etc. With access to 140 million consumers, the market has significant growth potential. The index is attractive as these companies have low penetration and a rapidly changing demographic.
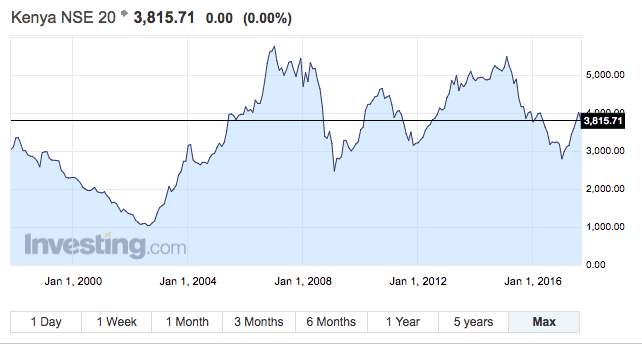
Chart 2.3: 15 Year Performance Of NSE20.
FTSE China A-H 50:
China ranks number 1 in the Purchase Managers Index, an indicator for the economic health of the manufacturing sector. The index comprises of only the large cap stocks, that have over the years witnessed ease in reform for foreign investors to invest in these markets generating huge demand and the index has been growing at a rate of 17.5%. China is one of the largest and fastest expanding economies in the world. The total number of A list share has grown by 75% over the past 10 years with trading increasing from $400 billion to $4.6 trillion. The increase in volume and market cap (Jump to $3.6 trillion in 2013) reflects the huge growth prospects available to investors during the time horizon.
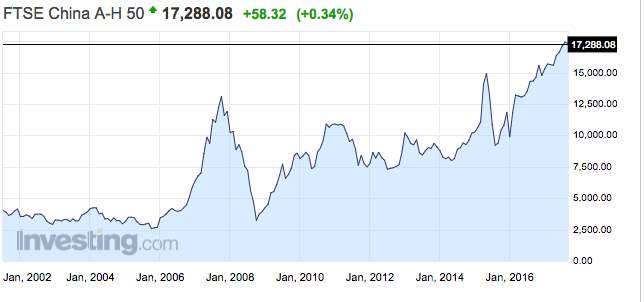
Chart 2.4: 13 Year Performance Of FTSE CHINA A-H 50.
September 2011 – September 2016
S & P Financial 500
This index was held on with a speculation of an uptrend which was achieved in the previous period. The index moved up by 17 points during this period. S&P Financial 500 is a fundamentally strong index, despite slipping down by 14% in the 3 months the index revives as personal spending increased by 0.2% and incomes smoothed by 0.1%. The US offers the largest consumer market with a GDP of $18 trillion and even a marginal increase in consumer spending and income has massive impacts on the market. The trends since inception show the S&P Financial is a solid investment for investors with a long term horizon which exactly why it was retained.
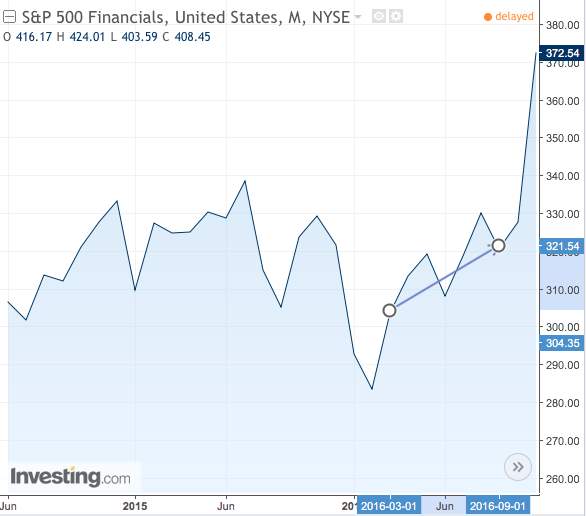
Chart 2.5: 6 Month Performance Of S&P 500 Financial.
New York Stock Exchange Financials:
The NYSE Financial Index is a sub category of NYSE Equity Indices that has given a 5 year annualized return of 11.37% and return of 10.4% as of 2016YTD. Financial markets in the US are the largest and most liquid in the world. In 2015, the US Financial Industry represented 7.2% or $1.29 trillion of the US GDP. By 2018, the industry is expected to represent 12% of the GDP. Underlying companies in this index consist of banking, insurance, asset management and venture capital. The NYSE Financial comprises companies with a market capitalization of at least 100 million dollars making sure that the companies are stable. The significant potential for growth was the primary for index selection.
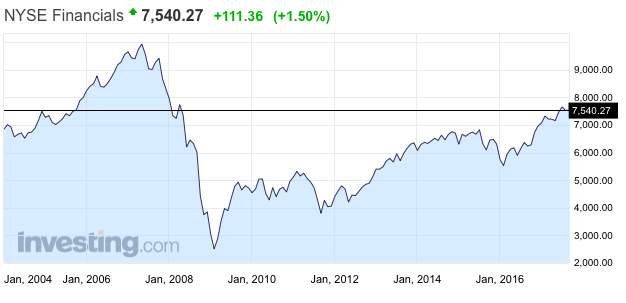
Chart 2.6: 13 Year Performance Of NYSE Financials.
NIFTY 50:
India is one of the fastest growing economies in the world, the added advantage of demography allows for a continuous growth potential. The Nifty from December’ 2011-December’2012 had a boom period crossing the 6000 points mark with 13 of the 50 stocks zooming between 51% and 87%. In 2014, the NIFTY surged by 30% due to the huge inflow from FII’s aided by government’s ‘majority’ win in Lok Sabha elections, sharp fall in inflation and crude oil prices, and hopes of reforms and rate cut by RBI. NIFTY50 has given a return of 11.08% since inception, the added domestic advantage of tax exemption makes for an attractive investment to HNI’s who fall in the highest tax bracket. In 15 years Nifty gave 12.83% of annualized return and investors holding on for a long term horizon have been the top gainers.
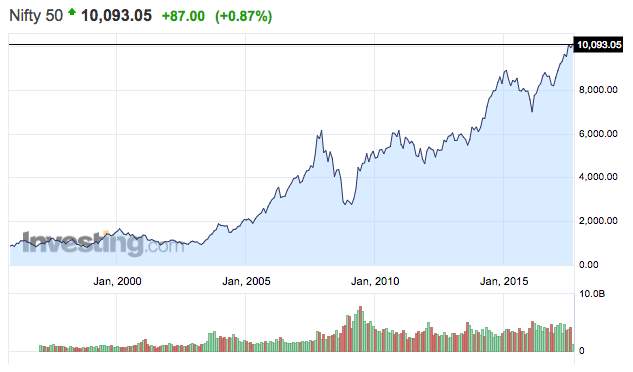
Chart 2.7: Year Performance of NIFTY 50 since inception
Hang Seng:
Hong Kong is one of the financial hubs of the world with benefits such as low taxation, port access and a free economy making it the world’s 5th largest stock exchange. The Hang Seng index was chosen because the index provides exposure to many American Depository Receipts(ADR) and Exchange Traded Funds.
The others benefits of investing in Hong Kong is that it provides a gateway to the China growth story. The corporate tax rate in Hong Kong is 17% against the US rate of 36%. This helps the Hong Kong companies to grow the better as the return on equity increases with the operating cash flow.
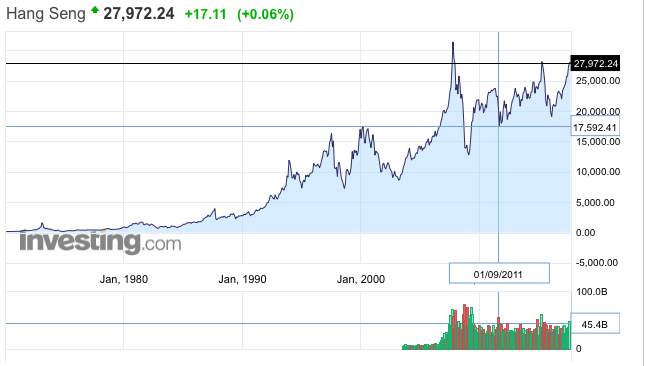
Chart 2.8: Financial Performance of Hang Seng
March 2012 – March 2017
The entire portfolio was held on for the above time period, reflecting the intermediate strategy of the fund especially as the portfolio gave an efficient return of 14% from Sept 2011-Sept 2016 despite sluggish patterns in global economy and after math of debt crisis. Expectation of market buoyancy and maintaining an open position are expected to be better than selling off the portfolio mix and churning it.
The Indian economy has seen influx of cash from FII’s, boosting market sentiment and NIFTY returns.
The NYSE gave an absolute return of 15.715 percent during the period of Sept’16-Mar’17. The uptick was seen in NYSE due to expectation by corporates of deregulation and corporate tax cut to be implemented by the Trump administration. prospects.
An absolute return of 5.01% was given by the Hang Seng Index for the period of Sept’16-Mar’17.
4. ASSET ALLOCATION PROCESS
1) Stock Selection Process: Decision was made on the following factors:
- Minimum market capitalization of INR 1000 crore
- Existence for a period of at least 7 years
- Strong fundamentals
- Low Dividend Payout percentage i.e. High reinvestment rate.
2) Data collection Process: The data was collected from http://www.bseindia.com and http://www.moneycontrol.com on a monthly basis for a period of 5 years namely:
- 1st March’2011-1st March’2016
- 1st September’2011-1st September’2017
- 1st March’2012-1st March’2017
3) Data analysis Process:
- Closing Prices of 4 stocks/indices were taken at one time with their respective month
- Holding period returns was calculated for each script individually using the formula

c) Average returns was calculated using the below formula
Average Returns = (Sum Total of Holding Period Returns)/Number of Holding period days
d) Average risk was calculated by finding the standard deviation of the holding period returns.
e) Annualized Returns was found by multiplying the average returns by 12.
f) Annualized Risk was found by multiplying the average risk by the square root of 12.
g) The above process was repeated for each stock for a total of 3 times for each of the mutual fund
f) A summary sheet was created comprising of the risk and return matrix of all the stocks/indices.


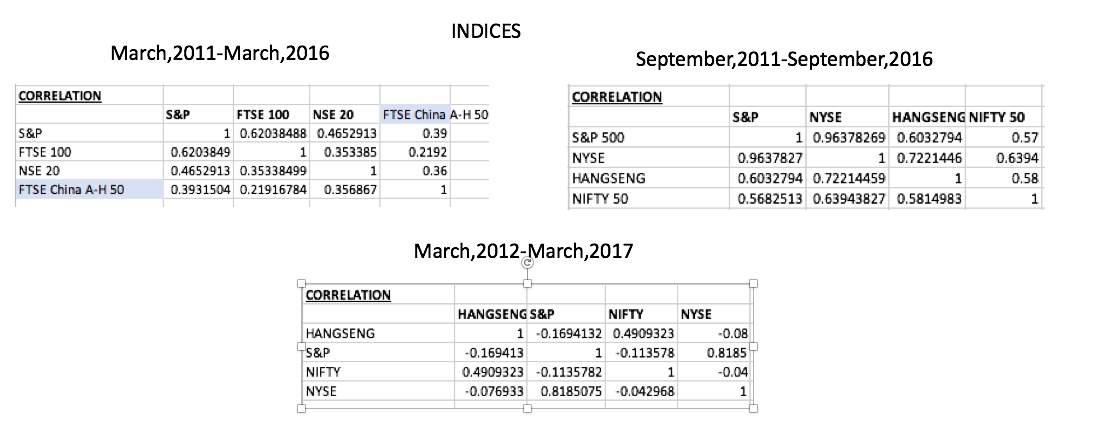
g) A correlation matrix was created to find out the correlation between the stocks to find out if the correlation is strong or weak using the excel function (=correl)
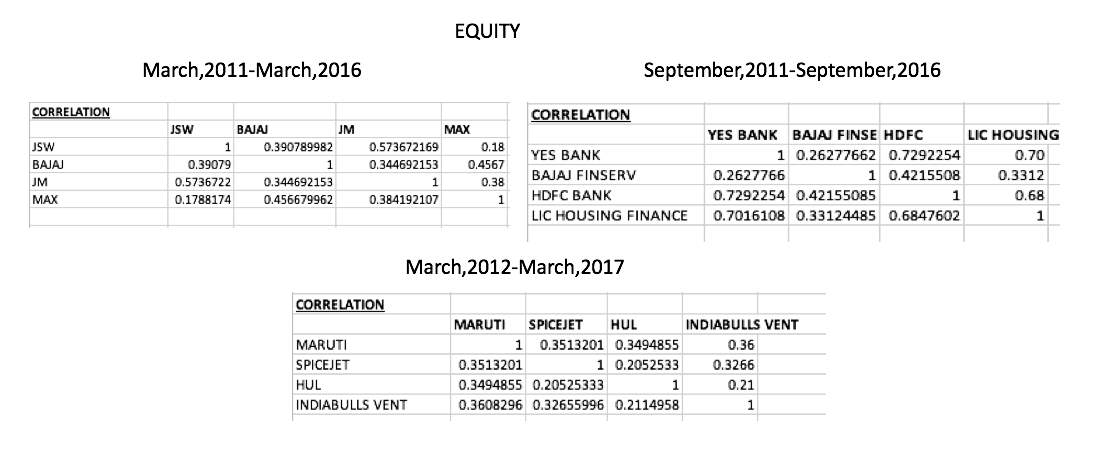
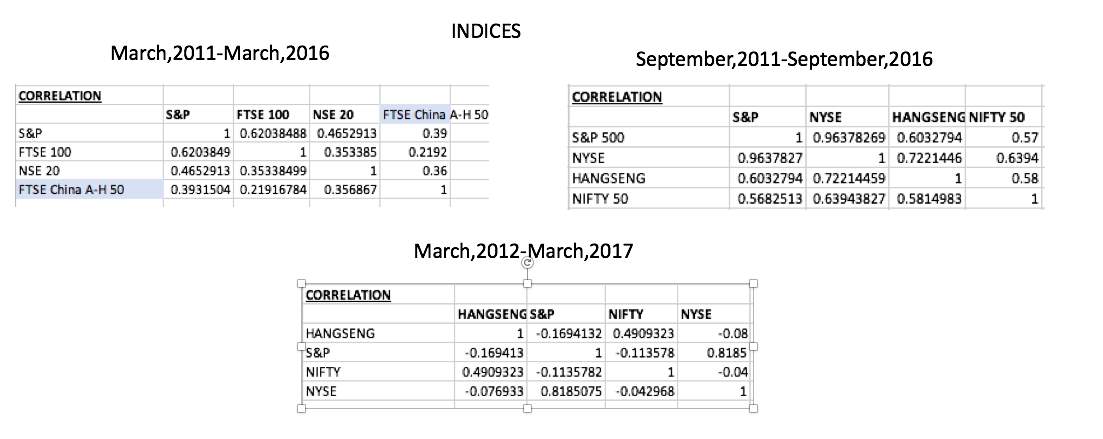
f) A covariance-matrix was created by multiplying the individual annualized risks of 2 stocks with their correlation co-efficient.
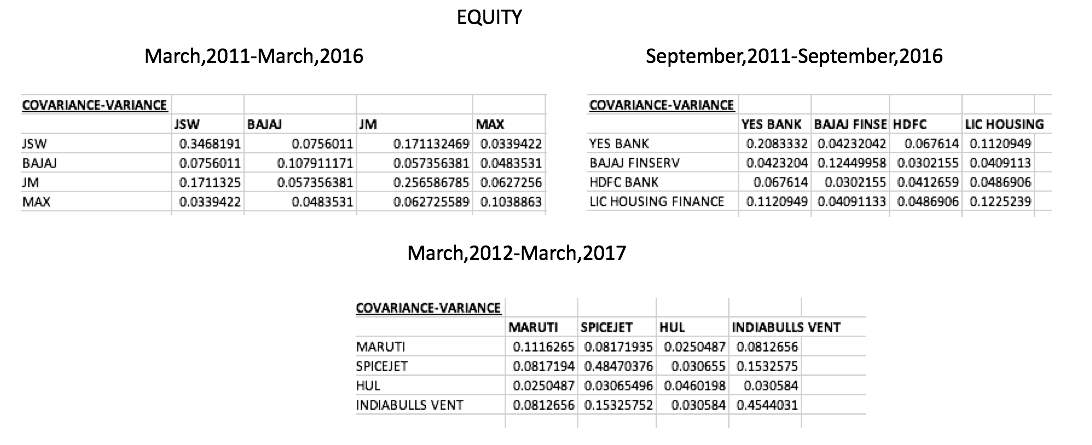
g) In order to proceed with the simulation a bordered covariance variance matrix was created with weights of 0.25 assigned to each stock to start the process.
f) Solver plugin was used in order to find the minimum risk for a unit of return using the following constraints:
- Sum of all weights should be equal to 1
- Each stock should have a weight greater than 0
- Each stock should have a weight less than 1
g) Using the solver and the bordered covariance a risk return summary chart with the respective weights was created
f) Using the above summary chart an efficient frontier chart was created using at least 3 points from the summary chart. This process was repeated 6 times to give us 3 efficient frontiers.
5. Portfolio Evaluation:
5.1 Equity Mutual Fund:
March 2011 to March 2016:
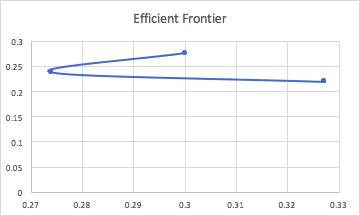
Bajaj Finserv was the top gainer, providing an overall annualized return of 28.72%. JM Financial and Max Financial were not too behind with a return of 21% and 20% respectively. Lack of diversification prevented mutual fund from optimizing returns and making the most of rallying of stocks. Sensex during this period gave a return of 6.5%. The portfolio thus outperformed the market. The risk for investment in Sensex stood at 15% while the Portfolio’s standard deviation was 30%. Investors were rewarded for their risk premium. Sharpe ratio calculated gave a value of 0.68, high value indicates the excess return investors earned.
( W1- Jindal Steel Works, W2-Bajaj Finance, W3- JM-Financial, W4- Max Financials)

September 2011 – September 2016 :
The top gainer is still Bajaj Finserv which was retained with 41% annualized returns closely followed by Yes Bank at 40%. The overall return on the portfolio is 36.9% with a risk of 28.9%. The Sensex is giving a return of 11.72%, so the portfolio has not only improved its performance with respect to previous time horizon it has also continued to outperform the market. The Sharpe ratio has also increased to 0.86, reflecting the improvement in the portfolio investment returns. ( W1- Yes Bank, W2- Bajaj Finserv, W3- HDFC Bank, W4- LIC Housing Finance)


March 2012 – March 2016:
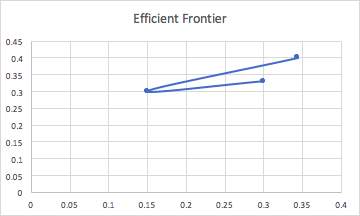
The portfolio gives a return of 40.2%, with the top gainer Indiabulls venture at annualized return of 55% as it is a multi – bagger stock. The Sensex gives a return of 11.5% during this period. The Sharpe ratio during this period is 0.82, a marginal decrease from the previous period. However, investors with a bigger risk appetite could earn big from this scheme.
(W1- Maruti Suzuki, W2- Spicejet, W3- HUL, W4- Indiabulls venture)

5.2 Indices Mutual Fund:
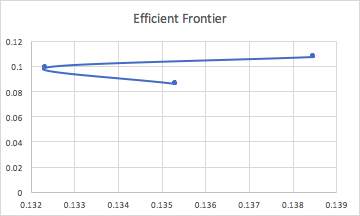
March 2011 – March 2016 : The portfolio gives a return of 10.77% with the top gainer German TECALL giving an annualized return of 12%. The Dow Jones during this period has a return of 7.9%. The Sharpe ratio is found to be 0.6181. Therefore, the portfolio earned an average excess return of 61.81% per unit of risk. The risk in TECALL and NSE20 is the same, however TECALL produces a return of 12% whereas NSE20 is only giving an annualized return of 1.5% for the same risk level. Whereas, in the case of FTSE China despite a risk of 36%, the index fails to reward the risk premium at returns are only 8%. (W1-S&P 500 Financial, W2-TECALL, W3-NSE20, W4-FTSE A-H50).

September 2011 – September 2016 :
The portfolio now gave a return of 14%, with the top gainer being S&P 500 at 15%. Dow Jones at this period gave a return of 10% indicating that global economies were also performing better. Sharpe ratio was 0.8470. Therefore, the portfolio earned an average excess return of 84.70% per unit of risk. The portfolio saw an improvement in performance as a result of diversification and focus on growing and developing or developed economies. The Hang Seng saw dips in performance but was expected to make a recovery due to the revival in market conditions. (W1-S&P 500 Financial, W2-NYSE Financial, W3-HangSeng, W4-NIFTY50)


March 2012 – March 2017:
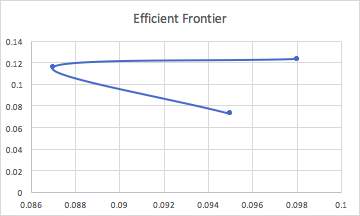
The entire portfolio of the previous period was held on as it gave promising returns and the CAGR was satisfactory to the investor’s objectives. The portfolio however failed to meet expectations and gave a return of 12.3% while Dow Jones gave a return of 9.5%. Although the indices failure wasn’t in isolation and aligned with global trends, perhaps churning the portfolio and eliminating the Hang Seng Index that once again failed to perform would’ve provided for increased satisfaction. The top gainer was once again the S&P 500 Financial with a return of 13.3%. The Sharpe ratio was found to be 1.028. Therefore, the portfolio earned an average excess return of 100.28% per unit of risk. (W1-S&P 500 Financial, W2-NYSE Financial, W3-HangSeng, W4-NIFTY50)

6. Costs (Loads): The firm will charge an investor 1% for redemption within 365 days.
7. Portfolio Managers Details:
The fund is managed by Mr. Yash Poojary, Ms. Zoya Bisht, Ms. Avantika Jain, Mr. Vaishnav Singh and Mr. Yashvardhan Jain. They have completed their BBA, MBA and are CFA’s, and have previously worked for global investment banks with a combined experience of 50+ years and have tracked the fund since 2011.
8. Conclusion:
The mutual fund schemes revealed the importance of diversification in a portfolio. A fund manager should focus not only on stock selection but also the market timing. In periods of boom, investing in one sector may give us good returns like in the case of the first portfolio of the equity mutual fund, but to manage risk return trade off diversification is required. The other factor that plays an important role is the weights assigned to each stock/index. Also, the efficient frontier helps us obtain a particular level of return for a specific level of risk or vice versa. In the case of indices mutual fund, the portfolio churning revealed that certain sectors that may look attractive are subject to a lot of volatility and it is important for the fund manager to exit the market before the investor losses mount.
Although underdeveloped economies make for an attractive investment with huge growth potential, the lack of infrastructure and slow pace of reforms go against the investor who must enter the market early and hold on for a long period to achieve the targeted return.
Finally, when it comes to an investment decision, the fund manager must take into consideration the investor’s objective and time horizon and plan strategy accordingly. In this case as investors had a long term horizon, it only made sense for the fund manager to invest in those companies that showed a long positive uptrend and had strong fundamentals.
G10 Wealth Builder Fund through its two mutual fund schemes and series of portfolios has revealed the abilities of fund managers to actively manage the fund and eliminate those underperforming stocks that bring down the returns of a portfolio and focus on the creation of efficient ones.
Reference links:
http://money.cnn.com/2011/09/30/markets/markets_newyork/index.htm
https://finance.yahoo.com/quote/%5ENYK/components?ltr=1
http://www.forbesindia.com/printcontent/43283
https://www.dynamiclevels.com/en/bajaj-finserv-company-history
https://www.fool.de/2015/01/22/17-facts-about-german-stocks-that-will-make-you-want-to-invest/
https://www.cnbc.com/id/100549214 2013
https://www.justetf.com/en/how-to/invest-in-china.html
https://www.justetf.com/en/how-to/invest-in-china.html
http://buzz.money.cnn.com/2012/12/27/nyse-nasdaq-ipo/
https://markets.ft.com/data/indices/tearsheet/constituents?s=NYA:PSE
https://www.nyse.com/indices/types
https://www.cnbc.com/id/100549214
https://live.mystocks.co.ke/stock=%5EN20I
https://www.bloomberg.com/quote/KNSMIDX:IND
https://us.spindices.com/indices/equity/sp-500-financials-sector
http://money.rediff.com/companies/YES-Bank-Ltd/14030144/ratio?src=comp_research
http://www.londonstockexchange.com/exchange/prices-and-markets/stocks/indices/ftse-indices.html
BOOKS:
The Intelligent Investor : Benjamin Graham
The Little Book That Beats the Market : Joel Greenblatt
The Dhandho Investor-The Low-Risk Value Method to High Returns : Mohnish Pabrai
One Up on Wall Street : John Rothchild and Peter Lynch
Annexure
Excel Files Attached:
- IAPM-MFINDICES
- IAPM-MFEQUITYSTOCKS
Cite This Work
To export a reference to this article please select a referencing stye below:
Related Services
View allRelated Content
All TagsContent relating to: "Finance"
Finance is a field of study involving matters of the management, and creation, of money and investments including the dynamics of assets and liabilities, under conditions of uncertainty and risk.
Related Articles
DMCA / Removal Request
If you are the original writer of this dissertation and no longer wish to have your work published on the UKDiss.com website then please:


