Dissection of Microrna-30D’s Function Roles in Mammalian Pancreatic-beta Cells
Info: 82296 words (329 pages) Dissertation
Published: 18th Feb 2022
ABSTRACT
MicroRNAs (miRNAs) are a group of small non-coding RNAs (about 21-22 nucleotides long) that fine tune target protein output through messenger RNA degradation or inhibition of its translation. Recent studies showing that miRNAs and their function components respond to cellular stress to maintain steady state physiology of the cells. Since there are thousands of microRNAs existing in all kind of cells, their functional characterization during the normal states or stress conditions is not fully addressed yet.
In this thesis, important aspects of pancreatic β-cell function under normal or stress condition such as apoptosis, proliferation, insulin production and release and their regulation by the miRNA were explored. Pancreatic β-cells is a group of insulin producing cells and plays critical role in maintaining glucose hemostasis. By combining mouse and cell line genetic approaches, high-throughput deep sequencing, a list of cell assays and molecular techniques, we have shed light on the novel roles of miR-30d, one highly expressed miRNA when β-cell responding to high glucose stimulus, in regulating β-cell mass on the middle-aged mice. We demonstrated that overexpress of miR-30d deteriorated glucose tolerance ability of the mice with high fat diet treatment by significantly reducing the β-cell mass with less insulin production.
Additionally, we demonstrated that both apoptosis pathway and proliferation pathway have been effected by miR-30d by targeting variety of protein factors’ expression. cyclin E2 (CCNE2) had been confirmed as miR-30d’s target and the effect of their regulation by miR-30d in pancreatic β-cell proliferation aspects have been addressed as well. BCL2 interacting protein 3 (BNIP3) had also been found out regulated by miR-30d expression.
Furthermore, we showed that silencing of miR-30d in MIN6 cell (β-cell mimicking cell line) by CRISPR-CAS9 gene editing system promotes the insulin secretion, which is through potentiated expression of MAFA, an insulin transcription factor. High-Seq analysis and further target searching of this silencing cell line revealed 13 candidate targets of miR-30d in MIN6 cells involved in various functions. Among them, CXCL10 appealed to be a strong potential target.
These studies uncovered novel functional roles of the miR-30d pathway in mediating β-cell function and fate. Further dissection of these pathways shall uncover the mechanisms by which the β-cells utilized to maximize their efficiency during disease states such as T2D.
Table of Contents
Click to expand Table of Contents
INTRODUCTION AND BACKGROUND
The Brief History of Diabetes and Research
Environmental and Genetic Contributions of T2D
The Islet Architecture and β-cell Fate
Glucose Stimulate Insulin Secretion (GSIS)
Compensatory Islet Expansion During Insulin Resistance
The Brief History of MicroRNAs
MicroRNA Induced Gene Silencing
MicroRNAs in Insulin-Responsive Cell and Beta-Cell Function
MiR-30d in Pancreatic β-Cells and Cancer Cells
AIM OF THIS STUDY
CHAPTER 1 microRNA-30d regulates mouse glucose homeostasis by inducing pancreatic -cell death and inhibiting the proliferation
1.1 Introduction
1.2 Methods and Materials
Culture of Pancreatic Beta Cell line MIN6
Transfection
Mouse Islet Isolation and Culture
Insulin Secretion Assay
RNA Extraction
cDNA Synthesis
Quantitative real-time PCR for mRNA Transcripts
Quantitative real-time PCR for microRNAs
Animal Care and Treatment
Genotyping of Mouse Tail Biopsies
Blood Glucose Measurement, In Vivo Glucose Tolerance Test and in vivo Insulin Tolerance Test
Insulin/Glucagon Quantification using an Elisa kit
Pancreatic Insulin or Glucagon Content
Western Blotting
Immunohisto-chemistry Staining and In-situ Hybridization
Pancreatic Cells and MIN6 Cells Proliferation Determination
In-situ TUNEL Assay
Slides Imaging and Quantification
Statistical Methods
1.3 Results
1.3.1 Generation of a transgenic mouse model that specifically overexpresses miR-30d at different levels in -cells.
1.3.2 Under normal diet condition, miR-30d does not affect the glucose homeostasis, nor -cell function.
1.3.3 Under high-fat diet, miR-30d worsen the glucose homeostasis in TgH mice
1.3.4 Highly overexpress miR-30d in β-cells induces cell death and inhibit compensate β-cell proliferation in response to high-fat diet
1.3.5 Overexpression of miR-30d inhibited β-cell proliferation and induced β-cell apoptosis under high-fat diet
1.3.6 CCNE2 is one of the targets of miR-30d to regulate the cell cycle
1.3.7 miR-30d promoted BNIP3 expression in β-cells
1.3.8 miR-30d may inhibit β-cell function as well
1.4 Discussion
CHAPTER 2 Identification of miR-30d’s targets in pancreatic β-cells
2.1 Introduction
2.2 Methods and Materials
Cell culture and generation of miR-30d knocked down lines
Transfection
RNA Extraction
Quantitative real-time PCR for mRNA Transcripts
RNA sequencing by HiSeq analysis
Statistical Analysis
2.3 Results
2.3.1 Identification of differentially expressed genes in miR-30d knockdown line using HiSeq analysis
2.3.2 Functional enrichment analysis of differently expressed genes in miR-30d KO
2.3.3 Identification of novel targets of miR-30d
2.4. Discussion
CHAPTER 3. Determination of miR-30d function in Cre-STTM30fl/fl mice
3.1 Introduction
3.2 Methods and Materials
Animal Care and Treatment
Mouse Islet Isolation and Culture
RNA Extraction
Quantitative real-time PCR for miRNA Transcripts
Genotyping of Mouse Tail Biopsies
Blood Glucose Measurement, In Vivo Tolerance Tests and in vivo Insulin Release
Insulin Quantification using an Elisa kit
Statistical Methods
3.3 Results
3.3.1 Generation of β-cell specific miR-30 KO mice (STTM-30fl/fl)
3.3.2 miR-30 knock out mice obtained normal body weight and glucose level
3.4 Discussion
REFERENCES
APPENDIX
A. List of all 1422 differently expressed genes in miR-30d KO cell line from HiSeq analysis
B. Table of functional enrichment analysis of differently expressed gene in miR-30d KO line
C. Figure reuse permissions
LIST OF FIGURES
Figure 1.1 Insulin regulates glucose homeostasis
Fig 1.2. Islet morphological changes during the progression of T2D
Fig 1.3 Glucose stimulated insulin secretion
Fig 1.4 microRNA biogenesis and function
Fig.1.5 microRNAs in the crosstalk of pancreas and insulin-responsive tissues to maintain the glucose homeostasis
Fig.2.1 miR-30d transgenic mice generation
Fig 2.2 miR-30d specifically overexpressed in pancreatic islet cells.
Fig 2.3 miR-30d does not change the glucose or insulin level
Fig 2.4 miR-30d does not change the glucose tolerance or insulin sensitivity
Fig 2.4 miR-30d decreased the insulin content in TgH mice
Fig 2.6 TgH mice exhibited hyperglycemia and decreased plasma insulin level under high-fat diet treatment
Fig 2.7 TgH mice exhibited glucose intolerance and poor glucose stimulated insulin secretion response
Fig 2.8 miR-30d induced significant β-cell loss in TgH mice
Fig 2.9 Overexpression of miR-30d inhibited β-cell proliferation and induced β-cell apoptosis under high-fat diet
Fig 2.10 CCNE2 is one of miR-30d’s targets in MIN6 cells
Fig 2.11 miR-30d promoted BNIP3 expression
Fig 2.11 miR-30d may inhibit β-cell function as well
Figure 3.1. Differentially expressed genes after knocking down miR-30d
Fig 2.3.2 Alignment details of miR-30d and 14 candidate targets using miRNA.org database
Fig 4.1 Transgene integration and genotyping of the STTM30 transgenic model
Fig 4.2 Validation of down-regulated expression in miR-30 KO mice
Fig 4.3 miR-30 KO mice maintained normal body weight and glucose level…….
Fig 4.4 miR-30 KO didn’t change the glucose or insulin tolerance under normal diet condition.
LIST OF TABLES
Table 1.2.1: Primer Sequences for Mouse Genotyping
Table 3.1 Functional Enrichment analysis of differently expressed genes in miR-30d KO cell.
Table 3.2. List of predicted targets of miR-30d in MIN6 cells
Table 4.1: Primer Sequences for Mouse Genotyping
INTRODUCTION AND BACKGROUND
The Brief History of Diabetes and Research
Long before terming “diabetes”, which means “to pass through” by Greek Apollonius of Memphis in 250 BCE and the re-discovery of ‘honey-like-urine’ (glycosuria) by Thomas Willis, who included the term “mellitus”, Diabetes has discovered its first saying around 1500 B.C. in an Egyptian manuscript. It was perceived as a disease related with ‘too great emptying of the urine’ (polyuria). Later, important discoveries includes Matthew Dobson’s first proof of elevated urine and blood glucose levels (hyperglycemia) in people with diabetes [3]. In 1889, Joseph von Mering and Oskar Minkowski were the first to give evidence that pancreas removal in dogs induced diabetes, proposing that pancreas functional related to glucose levels. Afterward, Edward Albert Sharpey-Schafer proposed that diabetes could be brought on by losing a pancreatic chemical, which he named as insulin in 1910 [4].
Taken together, diabetes is currently well recognized as a gathering of heterogeneous disorders characterized by hyperglycemia because of loss of insulin or its effectiveness. Current worldwide trends demonstrate a surprising 382 million individuals have diabetes and this is predicted to ascend to 592 million by the year 2035[5]. The cases of diabetes complications, including diabetic retinopathy, cardiovascular disease and renal failure are constantly rising and the death rate because of those are worsen every year.
Claude Bernard’s identification of liver as the major glucose production organ led to the first concept of “homeostasis” which has been termed and expanded by Walter Bradford in the mid-nineteenth century, to describe the maintaining of steady-state physiology of the cells [6]. This gave the notion that actually the disturbed glucose homeostasis is one of the important events of the diabetes progression. Given the evidences of insulin is involved in maintaining the glucose homeostasis, Frederick Banting and Charles Best integrated a series of scientific approaches, and were able to purify the insulin from the pancreas (Fig 1.1). Moreover, they successfully treated the patients who suffer from the diabetes, with their purified insulin [7, 8]. This landmark finding set the stage for treating the severe diabetes with insulin. However, it has been almost a century now since the first-time insulin was discovered and purified, diabetes remains the incurable disease, requires life-time attention and treatment because of its complexity.
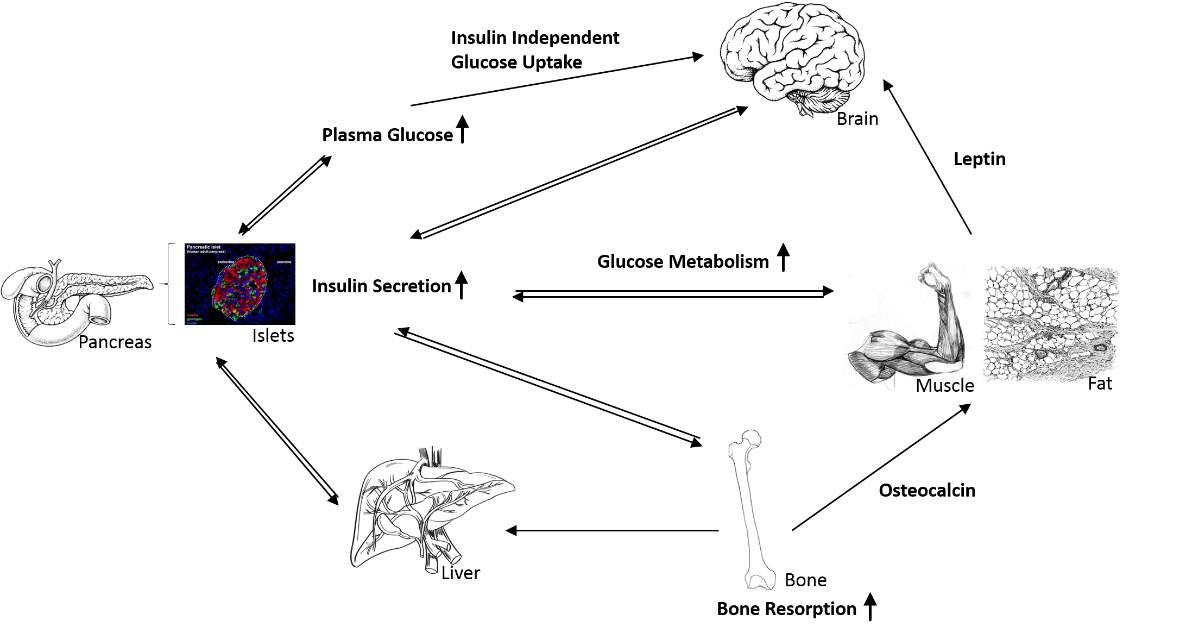
Figure 1.1 Insulin regulates glucose homeostasis
Increased blood glucose level induces pancreatic β-cells to secrete insulin into the blood. Insulin binds to a series of tissues including liver, muscle and adipose to promote the glycogenesis and glucose uptake, slower down the gluconeogenesis, for maintaining the normal glucose level. Besides responding to insulin, the insulin responsive tissues also secrete their own hormones to regulate other tissues through this network. Betatrophin is known to secreted by liver that can maintain β-cell mass; Leptin is a satiety hormone secreted by adipocytes which could crosstalk to brain to affect the appetite. Insulin could promote bone resorption and in return, osteocalcin, released by bone cells could crosstalk to liver, adipose and islets to maintain their function. Insulin can also regulate its own proliferation and insulin secretion in an autocrine way. [9] [10]
Diabetes has been classified as a couple different types nowadays, the major two types are known as the “Type I Diabetes” (T1D) or “Insulin Dependent Diabetes Mellitus” (IDDM) and “Type II Diabetes” (T2D) or “Non-Insulin Dependent Diabetes Mellitus” (NIDDM). Surprisingly, these two major types have been notified as early as 100-200 B.C by Indian physicians [11] . However, the first scientific evidence was brought by Wilhelm Falta and Harold Himsworth after they set the standardized glucose/insulin tolerance test in human to distinguish the insulin sensitive from non-sensitive patients [12]. Insulin dependent T1D is featured in insufficient insulin production due to autoimmune response to the pancreatic beta-cells and it mostly affects young kids.
T2D is more described as a “metabolic syndrome” with emergence of insulin resistance and obesity etc., and it is more common among adults [13]. In spite of the fact that there are uncommon monogenic types of T2D, most cases are results of extensive variety of environmental and genetic varieties [14]. One of the primary factor for T2D is the insulin resistance, the insulin responsive tissues, for example, the liver, muscle and adipose, ineffectively to respond to insulin. Therefore, gluconeogenesis is not shutting down in the liver and glucose in the blood is most certainly not taken up by muscle and fat. But insulin resistance itself does not really lead to T2D, beta-cell failure in later stage happens and ameliorate the progress of T2D [15].
Environmental and Genetic Contributions of T2D
Environmental factors are recognized to be one of the significant reason of the pathogenesis of diabetes [14]. Due to the life styles changes in the past 50 years, the incidence of T2D has been dramatically increased, therefore it is considered as the major risk factor for the progression of T2D. Excess food taking or imbalanced food consumption and lacking of physical activity synergistically result in overweight and obesity and constitute the major driver [16]. As an outcome, over-amount of free fatty acid (FFA) accumulates in the plasma and hampers the insulin-signaling pathway in muscle and liver [17]. Constant hyperglycemia because of excess food taking also brings glucotoxicity to both beta-cells and insulin-responsive cells and result in the dysfunction of them [18]. There are also some other risky reasons for the T2D include aging [19]. Recently, intrauterine condition has also been highlighted in contribution to the prevalence of T2D [14].
Besides the environmental factors, the genetic contributions have been considered as the fundamental reason for the pathogenesis of T2D for the past several years. The development of genome wide associate study techniques opens the gate for risky candidate gene searching and till 2012, there are about 65 variants have been identified, however, these variants contribute less than 30% of risk increment of T2D. The most intensely studied and confirmed diabetes risk single nucleotide polymorphism (rs1801282) with clear and obesity-independent effects on whole-body insulin sensitivity [20, 21] is located in exon 2 of the PPARG gene and results in the amino acid exchange P12A. PPARG encodes the lipid-activated nuclear receptor and transcription factor peroxisome proliferator-activated receptorγ(PPARγ). The P12Avariant, is only present in the PPARγ2 encoding transcript. This variant exerts its insulin-sensitizing effect directly inside adipose tissue, with increased release of fatty acids as a consequence of impaired adipose tissue insulin sensitivity which represents an attractive molecular mechanism of this SNP because fatty acids are well known to impair insulin sensitivity of skeletal muscle and liver [22].
Some of these gene with variants that have effect on insulin secretion or insulin sensitivity, but most part of these variations are located in non-coding regions of the gene, which makes it hard to study the physical functions. Therefore, even multiple genetic risk factors have been identified as strongly related with the pathogenesis of T2D, the pathological contributions are still not fully understood and requires further investigation.
The Islet Architecture and β-cell Fate
The endocrine part of pancreas is specifically named as the islets of Langerhans and are the only part producing the secreting hormones. They basically comprise of various cell sorts named α, β, δ, PP, and ε that secret the islet hormones glucagon, insulin, somatostatin, polypeptide Y, and ghrelin individually, and these hormones are required to maintain the glucose homeostasis at normal or stress state. Furthermore, the islets are known to have dynamic and plastic architecture that is proposed to be adjusted over the time of development[23]. During the progression of insulin resistance, pregnancy or T2D, the islets extend in size to make up for expanded insulin requirement . But afterwards, there is a considerable loss of β-cell mass because of environmental or genetic factors, inducing the serious hyperglycemia in cause of insulin deficiency. (Fig 1.2)
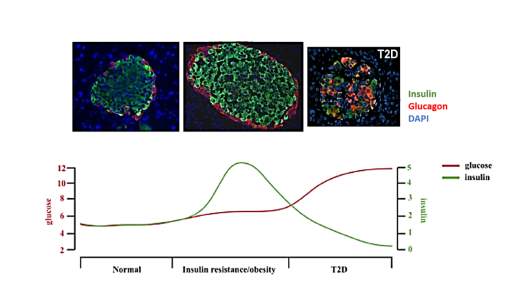
Fig 1.2. Islet morphological changes during the progression of T2D
Pancreatic islets contain different cell types includes α, β, ε and PP cells which respectively secrete glucagon, insulin, somatostatin and polypeptide Y. These hormones function together to maintain the glucose homeostasis. Islet has dynamic architecture when responding to stress condition such as insulin resistance or T2D. During the insulin resistance, large amount of insulin is required, which induced the compensatory expansion of islets to meet the high demand of insulin production. As the result, the glucose level would be maintained at normal physical level. When the β-cells could not meet the high demand due to a series of factors, there is a large β-cell loss result in low level of circulated insulin and constant hyperglycemia, which is the typical features of T2D [25].
While islets count to just ~1-2% of the whole pancreas, the insulin producing β-cells represent ~65-80% of the islet mass, constituting to roughly 2% of pancreatic weight. Furthermore, the rest other cell types are considered as non β-cells of the islets [26]. During the development, these distinctive cell types are known to emerge from a single progenitor cell that producing Neurogenin3 or Ngn3, a transcription factor that decides endocrine cell destiny [27]. Afterwards, other transcription factors, for example, Pdx1, Pax4, Nkx2.2, Nkx6.1, MafA, and Foxo1 help the β-cell fate determination [28]. While it had been learned as that β-cells proliferate by self-duplication from old β-cells instead of differentiation from stem cell [29], some other study suggested that multipotent cells inside the pancreas could differentiate into β-cells as well [30].
The latter study is also confirmed by researches showing how expressing the β-cell specific transcription factors in non β-cell could trigger a β-cell lineage in mice [31, 32]. Recent studies additionally showing that non-β cells, for example, α-and δ-cells could experience “trans-differentiation” into β-like cells when the mice are suffering from significant β-cell loss [33] [34]. On the other hand, a few researches demonstrate that the β-cells can likewise lose their fate or “dedifferentiate” into non-β or progenitor cells when losing any of the previously mentioned β-cell particular transcription factor [28]. Moreover, a current study demonstrated that human β-cells are capable of converting into α-cells with no genetic modification [35]. Taken together, all these researches have showed that the dynamic plasticity of islet cells.
Glucose Stimulate Insulin Secretion (GSIS)
One unique and significant feature of β-cells is to detect the blood glucose changes and secrete insulin into extracellular milieu in response to keeping the glucose levels within the range of 4-8mM [26, 36]. This is primarily accomplished by the take-up of extracellular glucose by the glucose transporter 2 [37] at the cell membrane. Right beyond the uptake of the glucose, the intracellular glucose sensor, glucokinase (Gck), subjects’ glucose moieties to quick metabolism system by glycolysis. This brings about the producing of three carbon products: pyruvate, which takes part in the tricarboxylic corrosive [38] cycle inside the mitochondrion to eventually create adenosine triphosphates [39] by means of the electron transport chain system.
The ATP therefore leads to the increase of ATP/ADP proportion in the cytoplasm, activating the closure of the ATP sensitive potassium (KATP) channel. Vitally, mutation in the kir6.2 subunit of this channel was demonstrated to induce neonatal diabetes in both mice and human because of loss of insulin secretion as a consequence of constitutively open KATP channel [40, 41]. It has long been realized that glucose stimulates the closure of these KATP channels thus leading the slow membrane depolarization [42]. This promotes extracellular calcium influx by voltage dependent calcium channels and potentiates the releasing of insulin [43] (Fig. 1.3).
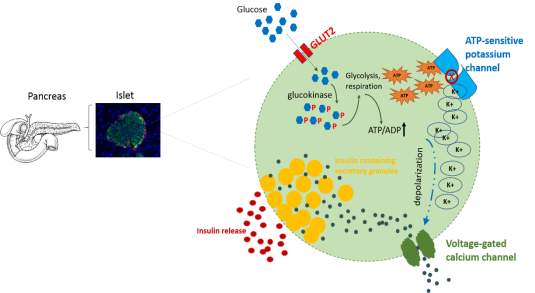
Fig 1.3 Glucose stimulated insulin secretion
One unique and significant feature of β-cells is to detect the blood glucose changes and secrete insulin into extracellular milieu in response to keeping the glucose levels within the range of 4-8m. Extracellular glucose was taken up by the glucose transporter 2 at the cell membrane. Right beyond the uptake of the glucose, the intracellular glucose sensor, glucokinase (Gck), subjects’ glucose moieties to quick metabolism system by glycolysis. This brings about the producing of three carbon products: pyruvate, which takes part in the tricarboxylic corrosive cycle inside the mitochondrion to eventually create adenosine triphosphates by means of the electron transport chain system. The ATP therefore leads to the increase of ATP/ADP proportion in the cytoplasm, activating the closure of the ATP sensitive potassium (KATP) channel, thus leading the slow membrane depolarization. This promotes extracellular calcium influx by voltage dependent calcium channels and potentiates the releasing of insulin.
Insulin is secreted in an oscillatory manner because of the blood glucose level and triggers downstream insulin signaling cascade in insulin-responsive tissues for the taking up glucose. It has well been shown that islets can be entrained to small changes in glucose and thus the plasma insulin has high frequency of oscillation. However, this capacity of entrainment of the islets is disturbed in patients with T2D [44]. It exhibits β-cell malfunction because of loss of insulin secretion is a major issue during the clinical indication of T2D.
Compensatory Islet Expansion During Insulin Resistance
During the state of obesity or insulin resistance, elevated plasma insulin levels (named hyperinsulinemia) has been found in polygenic mouse models showing insulin resistance and human subjects because of increasing of insulin secretion [45]. It has been suggested later that both in rodents and people, this improved insulin secretion is apparently because of an expansion in β-cell mass by either β-cell proliferation [46] or β-cell hypertrophy [47]. On the other hand, “β-cell failure” because of different genetic or environmental variables, is known to cause declined plasma insulin levels in diabetics. It has been showed that lessened levels of insulin are frequently associated with a noteworthy loss of β-cell mass because of β-cell apoptosis [48] [49].
Other than the diabetes perspective, it has been demonstrated that matured β-cells have long life-span and low proliferative rates at steady state. This is because of a potential limitation of the entry of matured β-cells into cell cycle [50, 51]. Other than this perception, later study suggested that adult β-cells do have the ability to proliferate [52]. In light of these findings on β-cell proliferation, a few research groups have revealed various proteins essential for assisting β-cell proliferation on knockout or transgenic mouse. Known cell cycle controllers including Cyclins D1 and D2, Cyclin subordinate kinase 4 (Cdk4), Cdk inhibitors (CKIs), transcription factors Retinoblastoma (Rb) and p53, have been proved on genetic mouse models as regulators of β-cell proliferation and survival [53].
Although transient high glucose has been considered as the result of insufficient insulin secretion or insulin resistance, it has also been revealed to promote the compensate β-cell mass expansion [54]. This hypothesis was further supported recently by another observation, that it is the glucose metabolism, instead the glucose itself that triggers compensatory β-cell proliferation in vivo [55]. Some other attentions have been centered on the effect of activation of insulin/IRS2 pathway on driving β-cell proliferation. The components of the pathway including IRS2 [56] and AKT [57] were demonstrated to be fundamental for β-cell survival.
Moreover, study has shown that the impact of insulin in β-cell proliferation is even stronger when with hyperglycemia [58]. It is notable that when in the state of severe insulin resistance, the pancreatic islets adjust themselves to meet the expanding requirement for producing and secretion more insulin by increasing their β-cell mass [47]. Other than the involvement of protein coding genes, a few non-coding RNAs (ncRNAs), mostly microRNAs and long ncRNAs (lncRNAs), have been shown in the “diabetogenes” list, adding on to the complex genetic architecture of human diabetes.
The Brief History of MicroRNAs
The most recent decade has seen huge attention regarding a new and special class of little ncRNAs such as microRNAs (miRNAs) in regulating the structure and function of β-cells. With the first observation of a miRNA, lin-4 in C. elegans, researchers showed how a gene product encodes two little RNAs, instead of a protein. Besides, they demonstrated that these small RNAs binds to the compensatory sites at the 3′ end of untranslated region [59] of lin-14, a development related heterochronic gene. This interaction is appeared to negatively regulate the expression of lin-14 by blocking its translation [60], proposing miRNAs as negative regulators of gene expression.
Even since the discovery of microRNAs, a lot of related research results have updated the mechanism of gene regulation to a novel level. miRNAs now are known as a group of small ncRNAs of ~21-22 nucleotides long that can complementary or non-complementary base-pairing the mRNA of protein coding genes, thus to regulate their expression at post-transcriptional level [61]. Actually, after the identification of lin-4, another miRNA called let-7 was revealed like lin-4 in both biogenesis and function level. Soon after, there starts a prevail in discovering new microRNAs mostly by high throughput sequencing technologies in research area and surprisingly, about 30,000 miRNA over about 200 species have been identified, which includes about 2,500 mature human miRNAs [62]. Many computational methods have also been produced to predict the potential targets of miRNAs based on the stable miRNA-target mRNA binding model [63].
MicroRNA Induced Gene Silencing
The intercellular gene silencing mechanism, termed as RNA silencing (RNAi) or post-transcriptional gene silencing (PTGS) is currently well known to be led by a group of small RNAs, for example, short interfering RNA (siRNA), piwi interacting RNA (piRNA), or the miRNAs. In general, their working mechanisms are similar and the difference exist mostly in their biogenesis inside the cells. Mature miRNA producing has been through several steps: transcribed from DNA by RNA polymerase II, primary miRNA (pri-miRNA) has much longer sequence. Once transcribed, the pri-miRNA is further processed to precursor miRNA (pre-miRNA) about 60 nucleotides long by enzyme Dorsa and DGCR8 protein complex [64]. Once pre-miRNAs are produced inside the nucleus, it will be export out of the nucleus by protein Exportin 5 to the cytoplasm in a Ran-GTP dependent manner [65]. Another important enzyme, which is also critical for mouse development, Dicer would recognize the pre-miRNA and process it to about 22 nucleotides long mature miRNA duplex form [66]. Only one of stands of the duplex will be transported to miRNA-induced silencing complex (RISC) by Dicer, and the other strand, termed miRNA* is usually degraded in the end [67].
There are several components on the RISC, and one key protein component is AGO family. There are four well characterized members of AGO family in human AGO1, AGO2, AGO3 and AGO4. And AGO2 is expressed more often than other forms [68]. All the AGO proteins have the ability to slice mRNA because of their PAZ and PIWI “cleavage” domains under the guidance of miRNA sequence. Each miRNA has an important “seed” region, typically from 2nd-7th nucleotides, that could fully or partially bind to the mRNA 3’ UTR sequence. The base pairing condition between the miRNA and target mRNA determines the target recognition and binding of miRISC, but also the fate of the mRNA- to be cleaved or to be repressed in translation. In animal system, the miRNA does not fully complementary bind to the 3’ UTR of the target mRNA, through blocking the translation machinery, miRNA silencing the gene expression, without interference of the target stability. However, recent studies on the miRNA mediated gene silencing in mammalian cells reveals that miRNA may act through two step modes: at first, repressing the translation, then deadenylation and destabilization of target mRNA [69]. The de-adenylation has been suggested to induce mRNA degradation [70] and translation inhibition is probably the requisite of mRNA degradation in mammalian cells [71] (Fig 1.4).
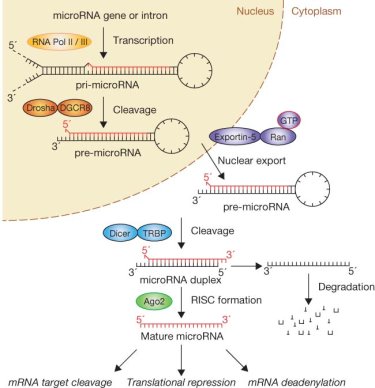
Fig 1.4 microRNA biogenesis and function
Initially, miRNA genes are transcribed as pri-miRNAs with a hairpin loop structure and processed to pre-miRNAs by the enzyme Drosha and DGCR8 inside the nucleus. After transport to the cytoplasm by Exportin-5, pre-miRNAs are processed by the Dicer complex, and turned into mature miRNAs. The mature miRNAs associate with the RNA-induced silencing complex (RISC) that mediates the interaction of miRNAs with target mRNAs. miRNAs mediate gene silencing in mammalian cells reveals that miRNA may act through two step modes: at first, repressing the translation, then deadenylation and destabilization of target mRNA. The de-adenylation has been suggested to induce mRNA degradation and translation inhibition is probably the requisite of mRNA degradation in mammalian cells. [72]
MicroRNAs in Insulin-Responsive Cell and Beta-Cell Function
Numerous microRNAs have now been known to play vital roles in monitoring glucose homeostasis. Hormones like insulin, glucagon emitted from β-cell and a-cells of pancreas separately have real parts in keeping up the body’s blood glucose level by cooperating in a synchronized way. The levels of hormones, like insulin and glucagon cooperating in a synchronized method to keep the glucose level, can be controlled by adipokines and free fatty acids secreted by adipose cells and liver. This organ crosstalk is controlled by miRNAs through targeting on the key components required for glucose homeostasis. These miRNAs are tissues specific or, on the other hand differentially located in pancreas or insulin responsive tissues (fat, muscle and liver) (Fig.1.5).
These miRNAs are assumed causing diabetes mellitus by controlling pathways required for insulin secretion, insulin production and β-cell fate, or affecting the insulin sensitivity in insulin responsive cells. miRNAs such as miR-143, miR-145, and miR-802 were shown upregulation in the livers of obese mice and humans, indicating the roles in glucose homeostasis off-regulating during insulin resistance [73, 74]. Adipose specific miR-103/107 and miR-133, were reported to contribute to insulin sensitivity in mice by controlling the expression of caveolin-1 and Prdm16, respectively [75] [76]. Other than liver and adipose, the muscle has been studied as well. Recent studies explored when using technique to specifically knock down Lin28a, an RNA binding protein known to block let-7 function [77] [78], or overexpress let-7, it could render mice insulin resistant and glucose intolerant [79, 80]. These studies implicate the role of Lin28a/Let7 axis in regulating glucose metabolism.
In the β-cells, miR-375 was discovered as the most abundant miRNA that was shown could control insulin secretion by targeting Myotrophin (Mtpn), a gene involved in insulin secretion pathway [81]. Furthermore, by silencing this miRNA in zebrafish or mice, it was demonstrated that miR-375 is basic for the keeping the islet mass [82]. Dysregulation of certain miRNAs have been suggested could affect the growth pathways thereby controlling β-cell proliferation. For example, miR-7 could promote β-cell proliferation by activating the mammalian Target of Rapamycin (mTOR) pathway [83]. Moreover, miR-7 can affect the insulin granule exocytosis process by targeting Pax6 and some other important factors [84] [85]. In light of the basic roles of the miRNA pathway in β-cells, a few research groups have exhibited miRNAs, for example, miR-375, let-7, miR-9 [86], miR-212 [87], miR-33a [88], miR-30a- 5p [89] and miR-7 [85] all play positive or negative role on insulin secretion of β-cells under normal or insulin resistance condition.
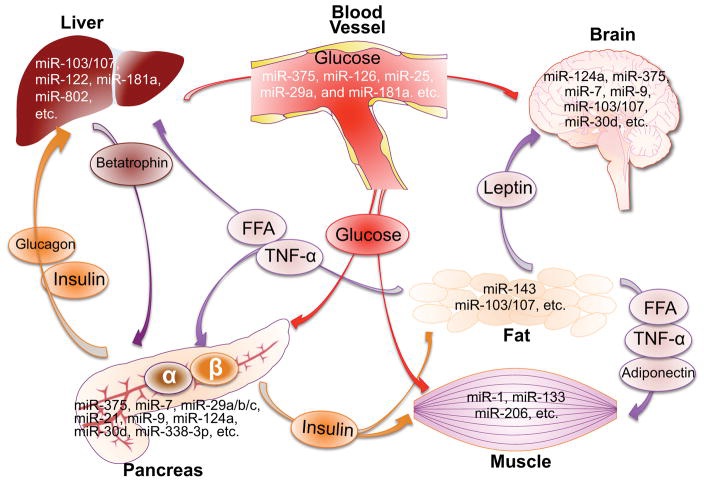
Fig.1.5 microRNAs in the crosstalk of pancreas and insulin-responsive tissues to maintain the glucose homeostasis
Pancreatic α-cells and β-cells secret glucagon and insulin, respectively, in response to the change of blood glucose level. Elevated glucose-stimulated insulin secretion increases glucose uptake in adipose and muscle, and decreases glucose production in the liver. Adipose fat cells release free fatty acids (FFAs) and adipokines (leptin, adiponectin and TNF-α) to regulate insulin sensitivity, food intake and energy expenditure. Liver cells can release factors such as betatrophin to regulate the β-cell proliferation. This inter-organ crosstalk is controlled by miRNAs through targeting the expression of key components required for glucose homeostasis. These miRNAs are tissue-specific or differentially expressed in pancreas or insulin targeting tissues. The circulating miRNAs may serve as long-distance communicators. Some diabetes-associated miRNAs are also abundantly expressed in the brain, but their functions in relation to glucose homeostasis remain to be determined.
MiR-30d in Pancreatic β-Cells and Cancer Cells
One of the many microRNAs, miR-30d, has been previously identified promoting insulin production, but not insulin secretion in pancreatic β-cell line via upregulating of the transcription factor MafA expression [90]. Further study discovered that miR-30d directly inhibits TNF-α-induced MAP4K4 and prevents the inhibitory effect of MAP4K4 on MafA and IRS2, leading to a partial compensation on TNF-α-induced suppression on insulin production and insulin secretion [90]. MAP4K4 has been known as a serine/threonine protein kinase, and it has previously been reported to induce insulin resistance in both insulin-responsive tissues [91]. While MafA, as a β-cell-specific transcription factor of the Maf family members, it correlates with other insulin transcription factors includes NeuroD and PDX1 and binds to the insulin promoter to initiate the insulin transcription [92]. MafA has also been discovered could increase insulin secretion when overexpress in β-cells [93]. While overexpression of miR-30d has no significant effect on insulin secretion in this study, it implicates miR-30d may target on more than one regulators in β-cell to affect its function. Identification of those potential target genes of miR-30d and complete the pathway will lead to a more comprehensive understanding of the roles of miR-30d in β-cells.
MiR-30d has been studied widely besides the pancreatic β-cells, and mostly in different cancer cells. There is several studies claiming that miR-30d is serving as an onco-microRNA by regulating cancer cell metastasis, proliferation, apoptosis as well as cell autophagy. One study found miR-30d affects multiple autophagy involved genes including BECN1, BNIP3L, ATG12, ATG5 and ATG2 and thus suppresses the cell autophagy [94]. Another study implicates that miR-30d could bind to the 3’ UTR of Beclin 1, resulting in the inhibition of the cisplatin-activated autophagic response, which could protect human anaplastic thyroid carcinoma cells from apoptosis [95]. Both of these studies implicate that miR-30d assists cancer cells to escape autophagy triggered cell death and promote the cancer aggression.
However, also in cancer cells, it is reported that miR-30d is negatively regulated by phosphoinositide 3-kinase (PI3K)/Akt signaling pathway and overexpression of miR-30d induces apoptosis and suppresses proliferation of renal cell carcinoma cells by destabilizing the mRNA of the oncoprotein metadherin (MTDH) [96]. This study reveals miR-30d’s role as a tumor suppressor, and combined with other study, it is further proved that miR-30d have multiple roles in cells and even though it has same predicted target mRNAs in different cells, the cell specific function mechanisms and pathways are guiding miR-30d’s specific functions in the cells, and it will be interesting to further explore how microRNAs are being regulated and how it regulates the cell functions under different circumstances.
AIM OF THIS STUDY
Dysregulated levels of miRNAs associated with T2D, insulin resistance or obesity may be restored to their physiological levels by using the techniques like miRNA mimics or miRNA inhibitors that are available. With the availability of such techniques, miRNA-based therapy actually provides a new insight of T2D treatment, which will significantly improve the treatment options for T2D. There are some findings about strong candidate miRNAs targets, but yet not enough.
The present thesis focuses on:
Objective 1. Elucidation of one important miRNA, miR-30d’s role in β-cells under normal physiological or food-induced diabetes condition using different cell or animal models.
Objective 2. This study tries to understand what are important target genes of the miR-30d pathway.
Objective 3. This thesis aims to understand how important targets mediate the function of the miR-30d pathway and how they contribute to the regulation of glucose and homeostasis in vitro.
Here we will mostly focus on the miR-30d’s role in regulating the β-cell fate under both normal and stress condition. This will shed light on the functional role of the miRNA pathway and further aims to understand how miRNAs orchestrate the regulation of energy homeostasis.
CHAPTER 1. microRNA-30d regulates mouse glucose homeostasis by inducing pancreatic -cell death and inhibiting the proliferation
Yiping Mao, Ramkumar Mohan, Jacob Schoenborn, Shungang Zhang, Weixiang Liu, Yiyou Gu, Xiaoqing Tang1
1This chapter is wrote as a manuscript for submission in the near future.
1.1 Introduction
Maintaining glucose homeostasis requires multiple hormones and enzymes, insulin from pancreatic β-cells is one of the essentials [97]. Adequate insulin secretion from β-cells is necessary to lower down the blood glucose level within a regular physiological range. Insufficient insulin secretion usually causes hyperglycemia and eventually β-cell death and reduced β-cell mass in both animal and human subjects with T2D [48] [98]. Apoptosis of β-cells is an important problem needed to be addressed also in islets transplantation for the treatment of T1D because it affects the durability of those cells [99]. Slowing down or stopping the apoptosis of β-cell is always a hot topic in studying the T2D, and so far, the molecular underpinnings remain incompletely understood, although multiple mechanisms have been suggested, including inflammatory cytokines, oxidative stress and endoplasmic reticulum stress [98] [100] [101]
MicroRNAs (miRNAs) are a group of noncoding RNAs about 22 nucleotides in length that negatively regulate gene expression by inhibition of protein translation or inducing mRNA degradation [102]. MicroRNAs primarily negatively regulate gene expression by binding to the 3’ untranslated region of their target mRNA with uncomplimentary binding by the seed region 8. Recent studies have discovered the importance of miRNAs in specialized β-cell functions [85, 103, 104]. miR-375, one of the most abundant and well-studied miRNAs existed in islets, is important for both insulin expression and secretion, and also in β-cell proliferation and adaptation to insulin resistance [105] [76]. Another miR-200 family (miR-141, miR-200c, miR-200a, miR-200b and miR-429) has been revealed play vital roles in β-cell fate [97]. Loss of miR-200 function could decrease the cell death under the stress or diabetic condition via affecting a series of apoptosis or stress related protein expression, including the essential beta cell chaperone Dnajc3, the caspase inhibitor Xiap and the tumor suppressor Trp53 [97].
One of the many microRNAs, miR-30d, has been previously identified promoting insulin production, but not insulin secretion in pancreatic β-cell line via up-regulating of the transcription factor MafA expression [84]. Further study discovered that miR-30d directly inhibits TNF-α-induced MAP4K4 and prevents the inhibitory effect of MAP4K4 on MafA and IRS2, leading to a partial compensation on TNF-α-induced suppression on insulin production and insulin secretion [84]. MAP4K4 has been known as a serine/threonine protein kinase, and it has previously been reported to induce insulin resistance in both insulin-responsive tissues [85]. While MafA, as a β-cell-specific transcription factor of the Maf family members, it correlates with other insulin transcription factors includes NeuroD and PDX1 and binds to the insulin promoter to initiate the insulin transcription [86]. MafA has also been discovered could increase insulin secretion when overexpress in β-cells [87]. While overexpression of miR-30d has no significant effect on insulin secretion in this study, it implicates miR-30d may target on more than one regulators in β-cell to affect its function. Identification of those potential target genes of miR-30d and complete the pathway will lead to a more comprehensive understanding of the roles of miR-30d in β-cells.
MiR-30d has been studied widely besides the pancreatic β-cells, and mostly in different cancer cells. There are several studies claiming that miR-30d is serving as an onco-microRNA by regulating cancer cell metastasis, proliferation, apoptosis as well as cell autophagy. One study found miR-30d affects multiple autophagy involved genes including BECN1, BNIP3L, ATG12, ATG5 and ATG2 and thus suppresses the cell autophagy [88]. Another study implicates that miR-30d could bind to the 3’ UTR of Beclin 1, resulting in the inhibition of the cisplatin-activated autophagic response, which could protect human anaplastic thyroid carcinoma cells from apoptosis [89]. Both studies implicate that miR-30d assists cancer cells to escape autophagy triggered cell death and promote the cancer aggression. However, also in cancer cells, it is reported that miR-30d is negatively regulated by phosphoinositide 3-kinase (PI3K)/Akt signaling pathway and overexpression of miR-30d induces apoptosis and suppresses proliferation of renal cell carcinoma cells by destabilizing the mRNA of the oncoprotein metadherin (MTDH) [90].
This study reveals miR-30d’s role as a tumor suppressor, and combined with other study, it is further proved that miR-30d have multiple roles in cells. This study, we explored the physiological role of the miR-30d in metabolic regulation in vivo, and studied its impact on β-cells survival in response to stress condition. We found that gain of function of miR-30d in mouse ameliorates β-cell apoptosis and glucose intolerance despite the fact of increased MafA expression. This gives hint of miR-30d’s multi-effects on cells, which are relevant to human diabetes.
1.2 Methods and Materials
Culture of Pancreatic Beta Cell line MIN6
The murine insulinoma cell line MIN6 was cultured in Dulbecco’s modified Eagle’s medium DMEM (GIBCO) containing 4.5g/l glucose supplemented with 15 % fetal bovin serum, 50 μM β- mercaptoethanol, 1 % penicillin-streptomycin (Invitrogen) in a humidified incubator at 37°C and 5 % CO2. The media was changed every two days and cells were passaged after reaching a confluency of about 80 %. Therefore cells were washed twice with 1xPBS and trypsinized with 0.05 % Trypsin (GIBCO) at 37°C for 3 minutes, centrifuged for 5 min at 700rpm and the cell pellet re-suspended in media.
Transfection
For loss and gain of function studies, MIN6 cells were transfected with 5 g of oligonucleotides (oligos) or 10 g of plasmid using the Amaxa Nucleofector II (Lonza) according to the manufacturer’s instructions. In brief, cells were trypsinyzed as previously described. Four million cells were centrifuged at 700 rpm for 5 min at 4 degree Celcius. The pellet was resuspended in 100 μl transfection solution and supplemented with either siRNA or plasmid DNA. As a control a pool of non-targeting siRNA or a plasmid containing an EGFP expression cassette was used. The cells were transferred to a cuvette and electroporated. Afterwards, cells were re-suspended in media and seeded in 6- or 24-well plates. 48 hours after transfection, cells were treated with low (1mM) or high (25mM) glucose without serum for 16 hours, then cell lysates or total RNA or cell based assays werer collected or performed and subjected to analysis by western blotting or real time RT-PCR or Elisa assay. For cytokine treatment, cells were treated with 10 ng/ml of cytokine mixture (TNF-α, IL-1 and IFNγ) in 25 mM glucose medium for specific time.
Mouse Islet Isolation and Culture
All mice were anethesized via i.p injection of mixure of α-chloralose at dosage of 100 mg/kg and urethane at dosage of 1000 mg/kg. Pancreatic islets were isolated and purified by intra-ductal perfusion of collagenase V (0.6 mg/ml) following the protocol described [106]. The purified islets were cultured in RPMI 1640 medium supplemented with 10% FBS and 1% penicillin-streptomycin for 24 to 72 hours according to the experiments. All experiments were carried out in accordance with the approval of the Animal Care Committee at the Michigan Technological University.
Insulin Secretion Assay
To measure the release of insulin, MIN6 cells were seeded following the transfection in 6-well plates. For secretion, cells were washed twice with Krebs Ringer secretion buffer and afterwards primed for 2 hours in secretion buffer containing 2.8 mM glucose at 37 °C. Subsequently buffer was replaced by 1 ml of secretion buffer containing 2.8 (low) followed by 25 mM [107] glucose and incubated at 37°C for 1 h respectively. Afterwards the supernatant was collected, centrifuged 5 min at 5,000 rpm to remove dead cells and insulin was measured using an Elisakit . The release of insulin was normalized to total insulin content of MIN6 cells. Therefore, cells were lysed in 1 ml of acid ethanol (1.5 % HCl, in 70 % ethanol) for overnight at -20°C, centrifuged at 14,000 rpm for 10 min at 4°C and insulin was measured in the supernatant using an Elisa kit as well.
Krebs Ringer buffer:
0.54 mM CaCl2,
4.74 mM KCl,
1.19 mM KH2PO4,
1.19 mM MgCl2
119 mM NaCl,
25 mM NaHCO3
10 mM HEPES,
0.5 % BSA
pH 7.4, sterile filtered, warm up to 37 °C before use
RNA Extraction
Total RNA was extracted as described in the manufactures’ instructions. In brief, isolated islets or cells were homogenized in TriZol (Life Technologies) reagent and incubated for 10 min at room temperature. Afterwards 200 l chloroform per ml TriZol was added and samples were vigorously and manually shook, followed by centrifugation at 13,000 rpm at 4 °C. The RNA containing upper aqueous phase was transferred to a new tube and RNA was precipitated by adding 500 l of isopropanol overnight at -20 °C. The next day, the whole liquid was transferred to column provided by miRNeasy kit, RNA was washed and dissolved in RNase free water followed the manufactures’ instructions. RNA concentrations were measured using the NanoDrop photometer.
cDNA Synthesis
cDNA was synthesized using the High Capacity cDNA Reverse Transcription Kit from Applied Biosystems. Therfore 800 to 2000 ng of total RNA were reversed transcribed using a pool of random hexamers and microRNA specific primers for 40 min at 42 °C in the presence of dNTPs, RNase inhibitor and reverse transcriptase. Afterwards the reaction was terminated for 5 min at 75 °C. cDNA was usually stored at -20 °C.
Quantitative real-time PCR for mRNA Transcripts
Quantitative realtime PCR was used to measure differences in RNA expression, using the Power SYBR green PCR Master kit from Applied Biosystems. In brief, a master mix was prepared for 10 l reactions, containing 2x SYBR Green Master Mix and 600 nM gene specific primer mix. The PCR reaction was carried out in 8-tubes strip format, combining 8 l of the master mix and 2 μl cDNA diluted template and using the Applied Biosystems StepOne Real-Time PCR System using following program: 10 mins at 95 °C, 40 cycles of 95 °C for 15 secs and 60 °C for 1 min. All samples were run in duplicate and the relative expression levels were calculated using the 2(-ΔΔCt) Method[108], with Hypoxanthine guanine phosphoribosyl transferase (Hprt) mRNA as an internal standard.
Quantitative real-time PCR for microRNAs
MiRNAs were quantified using TaqMan miRNA Assays from Life Technologies according to the manufactures protocol. For cDNA synthesis 2000 ng of total RNA were reverse-transcribed using a miRNA specific looped primer in a 25 μl reaction and the miRNA Reverse Transcription kit from Applied Biosystems. Subsequently, 4 μl of cDNA was used to run the qPCR reaction in a total volume of 15 μl and using miRNAspecific Primer. U6 small nuclear RNA was used as a normalizer. The qPCR reaction was performed in 8-tube strips and PCR reaction was monitored using the StepOne Real-Time PCR System from Applied Biosystems.
Animal Care and Treatment
Mice were maintained on a 12-hour light/dark cycle with ad libitum access to regular chow food, high fat diet (containing 60% kcal fat, Research Diets) in accordance to requirements. All experimental procedures were approved by Animal Care Facility of Michigan Technological University. All animals are on the C57BL/6 background except db/db mice (BKS. Cg-m+/+leprdb/J, stock no. 000642). MiR-30d overexpressed transgenic mouse founders are generated. Wild type and miR-30d overexpressed transgenic mice are backcrossed, controls from the same backcrossed generations are used for experiments.
Genotyping of Mouse Tail Biopsies
Mice were weaned at an age of 3 to 4 weeks and separated based on gender with not more than 5 mice per cage. The tail biopsies were digested in 600 μl tail lysis buffer TNES, supplemented with 35 μl Proteinase K (10 mg/ml) and incubated over night at 55 °C. Cell debris was spun down at 12,000 rpm for 10 min after mixing with 6M NaCl and supernatants were transferred to a new tube. Subsequently, genomic DNA was precipitated by adding 700 μl of Ethanol (100 %) at -80°C. Precipitated DNA was pelleted for 10 min at 13,000 rpm, washed once with 500 μl of Ethanol (70 %). The pellet was resuspended in nucleotiase free water and DNA concentration was determined using NanoDrop photometer.
1x TNES:
50 mM Tris
10 mM EDTA pH 8.0
0.4 M NaCl
0.5% SDS
Sterile by autoclaving
Genotyping-PCR was performed in a 20 μl reaction, using a Taq-Polymerase (LifeTechnologies) and following the manufacturer’s instructions. Gene specific Primers are summarized in Table 1.2.1.
1Table 1.2.1: Primer Sequences for Mouse Genotyping
Table 1.2.1: Primer Sequences for Mouse Genotyping
| allele | Forward Primer (5’-3’) | Reverse Primer (5’-3’) | |
| GFP | ATCCACGCTGTTTTGACCTC | GAGCAGGAGAAGCAAGAACG | |
| Globin | TAGATGTGCTTTACTAAGTCATCGCG | GAGATCGAGCGGGCCCTCGATGGTAG | |
Blood Glucose Measurement, In Vivo Glucose Tolerance Test and in vivo Insulin Tolerance Test
For glucose tolerance tests, mice were starved for 16h and interperitoneally (i.p.) injected with glucose in saline at 1.0 g/kg body weight. For an insulin tolerance test, mice were fasted for 6h i.p. injected with 0.75 units insulin per kg body weight. For all tolerance tests, plasma glucose levels were measured after 0, 15, 30, 45, 60, 90 and 120 min from tail vein blood. To measure the release of insulin in vivo, blood was drawn from the postorbital vein after 0, 15, 30 and 45 min. The blood was spun for 10 min at 6,000 rpm at 4°C and plasma was transferred to a new tube. Insulin was quantified in 20 μl plasma using an Insulin ELISA kit.
Insulin/Glucagon Quantification using an Elisa kit
Insulin/Glucagon was quantified in mouse plasma, tissue extracts or cell culture supernatants using the Mouse insulin or glucagon Elisa kit or Ultrasensitive Elisa kit. Briefly, samples were collected and diluted respectively according to the sample source and 10 or 20 l of samples were transferred to the wells which coated with anti-insulin or anti-glucagon antibody at the bottom. Following the manufactures protocol, the sample were incubated with100 l enzyme conjugated buffer provided from the kit in room temperature at 800 rpm for 2 hours for insulin assay, and overnight at 4°C for glucagon assay. The wells were washed 5 times with wash buffer and dried. 200 l Substrate TMB were added into each well and react in room temperature for 15 mins followed by 50 l reaction stop buffer. The wells were read at 450nm. The OD values were normalized to the calibrators and the final insulin concentration results were recorded.
Pancreatic Insulin or Glucagon Content
The pancreatic insulin content was measured in pancreatic lysates. Briefly, mice were scarified at the pancreas was carefully dissected and the weight was measured using an analytical balance. Afterwards the tissue was homogenized in 5 ml of acid ethanol (1.5 % HCl, in 70 % ethanol) for three times 20 secs on ice. The homogenates were stored over night at -20 °C. Next, lysates were vortexed for 30 secs and spun for 15 min at 2000 rpm and 4 °C. The supernatants were transferred to a new tube and the 5 ml of acid ethanol was added again to the pellet and homogenate again. Repeat the above procedure and about 13-15ml supernatant was finally collected. The lysates were 1:500 diluted in PBS and insulin or glucagon was measured using an Elisa kit. The content of insulin or glucagon in the lysates was normalized by pancreatic weight.
Western Blotting
For Western Blotting, cells or tissues were homogenized and lysed in an appropriate volume of lysis buffer with protease inhibitors and phosphatase inhibitors cocktails and agitated for 12 min on ice. Afterwards, lysates were spun for 10 min at 13,000 rpm and 4 °C and supernatants were transferred to a new tube. The protein concentration was done using a bicinchoninic acid-assay (BCA) and different bovine serum albumin (BSA) concentrations as a standard. 80-100 g of protein was boiled for 10 min at 95 °C along with 1x SDS sample buffer. Protein lysates were resolved by SDS polyacrylamide gel electrophoresis (PAGE) using 1x SDS running buffer and subsequently transferred at 4 °C onto nitrocellulose membranes in 1x transfer buffer for overnight. The membranes were blocked for 2h with 5 % milk in 1x TBST at room temperature and subsequently incubated with respective primary antibodies over night at 4 °C. The next day, membranes were washed 3 times with 1x TBST and incubated with HRP-conjugated secondary antibodies. Followed by another 3 washes, membranes were developed based on chemiluminescence.
1x SDS sample buffer:
310 mM Tris/HCl
10 % sodium dodecyl sulfate
50 % glycerol
mM EDTA
0.5 % bromophenol blue
5 % β-mercaptoethanol
1X SDS running buffer:
25 mM Tris/HCl
192 mM glycine,
0.1 % SDS, pH 8.3
1x Transfer Buffer:
25 mM Tris/HCl, pH 8.4
192 mM glycine
20 % methanol
1x TBST:
20 mM Tris/HCl
137 mM NaCl, pH 7.6
0.05 % Tween20
Immunohisto-chemistry Staining and In-situ Hybridization
For MIN 6 cell staining, cells were seeded on the acid treated coverslip till they grew into required population. The coverslips were transferred into a new 6-well plate and washed five minutes with 1x PBS for three times. The cells then were fixed using fresh 4% paraformaldehyde (PH7.4) for 20 minutes, followed by glycine and Triton-X treatment for 15 minutes, respectively. If BrdU was stained later, the cells were treated with extra 20 minutes of 2x HCl at 37°C. The whole coverslips were blocked with 5% Normal Donkey Serum (NDS) for 1 hour and primary antibody for overnight later at 4°C. Mouse anti-BrdU antibody was used for primary antibody incubation at 1:500 dilution in this study. The next day, cells were washed again with 1x PBS and treated with secondary antibody Mouse Alexa-Fluor 488nm at 1:500 dilution in 5% NDS in PBS for 2 hours at room temperature. Then the coverslips were incubated with DAPI for 1 minutes and mount on the glass slides with mounting medium [109].
Dissected mouse pancreas was fixed in 4% formaldehyde (pH 7.4) for 24h at 4°C and then processed routinely for paraffin embedding. Tissues were cut into 5 μm sections and adhere to glass slides (Superflost, Fisher Scientific).
For immunohistochemistry, slides are deparaffinized and rehydrated using xylene and a series of ethanol at different concentration from high to low respectively, followed by antigen retrieval steamed in sodium citrate buffer (PH 8.3) for 14 minutes. If BrdU will be stained, the slides were treated extra 20 minutes of 2x HCl at 37°C. After 2 hours blocking in PBS with 3% BSA on the tissue, mouse anti-insulin antibody, rabbit anti-GFP antibody, mouse anti-BrdU antibody, rabbit anti-BrdU antibody, rabbit anti-glucagon diluted in PBS with 1% BSA followed manufacturer’s recommendation for overnight incubation at 4°C. The next day, the immunodetection is processed with rabbit or mouse Alexa Fluor 488- or Alexa Fluor 596 conjugated secondary antibodies (Invitrogen) incubation for 2 h at room temperature. The slides were treated with DAPI solution and then cover slipped with anti-fading mounting media [109]. The images are captured on Olympus FluoView FV1000 Confocal microscopy or normal Leica fluorescence microscopy.
For in-situ hybridization, pancreas tissue slides are first deparaffinized and rehydrated and then treated with 40g/ml proteinase K (Roche Applied Science). Briefly, a total of 3 pmol of digoxigenin-labeled locked nucleic acid (LNA) probes (Exiqon) are diluted into hybridization buffer, and applied on the slides at 37 °C for overnight. Slides are then washed at 37 °C at 2xSSC solution and incubated with alkaline phosphatase-conjugated sheep anti-digoxigenin antibody at 1:1000 dilution (Roche Applied Science) for overnight at 4 °C. Alkaline phosphatase reaction was carried out with 50 mg/ml nitro blue tetrazolium/5-bromo-4-chloro-3-indolyl phosphate (NBT/BCIP) staining solution for overnight. Slides are coverslipped with mounting media and images are captured on Olympus fluorescence microscopy.
Pancreatic Cells and MIN6 Cells Proliferation Determination
Islet analysis after intraperitoneal injections of BrdU on seven consecutive days (100 μg/g Body Weight, Sigma) was performed on 5 μm sections of paraffin-embedded pancreas approximately 50 μm apart. The slides were performed normal immunohisto-chemistry staining using anti-BrdU and anti-insulin antibody. Images were obtained and quantified later.
For MIN6 cells, about 1x 10⁴ cells were firstly seeded on 1M HCl pre-treated coverslip in 6-well plate with normal growing medium, allow them to grow two days. Then the plate was washed twice with 1x PBS and change to DMEM medium containing 25mM glucose for 16hrs. 10μl BrdU(0.33mg/ml) were added to the each 1ml medium for 4 extra hours of incubation. The plates were then processed to stain BrdU.
In-situ TUNEL Assay
The paraffin embedded pancreas slides were deparaffinized and rehydrated, followed by proteinase K (1 KUnit/ml) treatment for 20 minutes. Fresh 4% paraformaldehyde was used for post-fixation for 20 minutes. Then the slides were washed, and incubated with 50 l TUNEL enzyme solution provided from the TUNEL assay kit (Roche), covered by coverslip and incubated at 37 °C for 1 hour. The slides were then processed from immunohisto-chemistry staining starting from blocking with 5% NDS in PBS, and used Mouse anti-Insulin antibody or Rabbit Anti-Glucagon antibody as primary antibody for overnight incubation, and Alexa anti-mouse 594 nm or Alexa anti-rabbit 594 nm were used for secondary antibody incubation. Slides were mounted with mounting medium and the images are captured on Olympus FluoView FV1000 confocal microscopy or Leica fluorescence microscopy.
Slides Imaging and Quantification
Cell numbers from all islets in 3 sections were counted with ImagePro software from 4x or 20x images and normalized by tissue area. Beta cell mass was measured as the ratio of insulin-positive cell area to the total tissue area, multiplied by the weight of the pancreas using ImagePro software. For the quantification of BrdU-positive and TUNEL-positive cells, islets from at least 20 islets per slide and 3 different sections per animal were analyzed and normalized by total number of insulin positive cells. For quantification of islet size, insulin-positive cell area was calculated and divided by the total islet numbers in total 3 different sections per animal.
Statistical Methods
All results are expressed as mean ± Standard Error of Mean (SEM). Statistical significance is determined by unpaired Student’s t-test (two-tailed) and ANOVA analysis was performed for comparisons of three or more groups. A p-value of less than or equal to 0.05 was considered statistically significant (*, p
1.3 Results
1.3.1 Generation of a transgenic mouse model that specifically overexpresses miR-30d at different levels in -cells.
To fully understand the physiological function of miR-30d in -cells in vivo, one transgenic mouse model which over-expressing miR-30d was generated. Briefly, the primary miR-30d fragment was inserted into a β-globin intron associated with an enhanced GFP reporter driven by mouse insulin I gene promoter[110], terminated by a fragment of the human growth hormone [2] terminator, resulting in a 12 kb MIP-miR30d-GFP-hGH for high-level expression of miR-30d (Fig 2.1A). The fragment was later microinjected into the fertilized eggs of mixed C57BL/6 and SJL mice by our collaborative Transgenic Animal Core Facility at the University of Michigan. The transgenic mice were screened for the presence of miR-30d transgene using PCR from tail biopsies (Fig 2.1B).
7 transgenic founders have been identified and breed in the animal facility at the Michigan Tech University. The transgenic mice were backcrossed with wild-type C57BL6 mice to obtain sufficient offspring for further study. Experiments were performed to confirm the miR-30d’s exclusive expression. RNA was collected from pancreatic islets of male mice from all 7 founder lines, and miR-30d expression level were checked. miR-30d in all transgenic lines exhibit higher expression level than wild type, but at different levels (data not shown). For better understanding the miR-30d’s role, two specific lines which have lower overexpression (TgL) and higher overexpression (TgH) were chosen for further study. The expression level of miR-30d in TgL pancreatic islets exhibited 2.5 times higher compared to wild type while TgH has about 15 times more than wild type has (Fig 2.2 A). Total RNA was collected also from liver, muscle, brain, heart, lungs, spleen and kidney of these mice, and miR-30d’s expression level showed no significant difference compared to wild type (Fig 2.2 B). This indicates the miR-30d is overexpressed specifically in pancreatic cells under the insulin promoter.
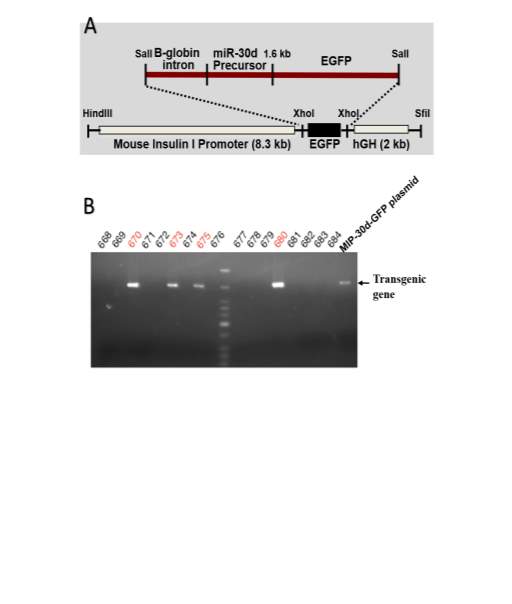
Fig.2.1 miR-30d transgenic mice generation
Double-staining immunohistochemistry for GFP, a miR-30d-associated reporter, and insulin was performed on the pancreas sections from 8-week-old mice (Fig 2.2 C). While insulin staining was detected exclusively in islets of both transgenic and non-transgenic mice, GFP-staining was detected only in islets of transgenic mice, and just perfectly overlapped with the insulin staining, indicating that the GFP associated miR-30d was also specifically expressed in the beta-cells. Indeed, In situ hybridization for miR-30d on same pancreas section showed a significantly increased signals in the islets of transgenic mice compared to the islets of non-transgenic mice (Fig 2.2 C). All the data above proved the successful transgenic mice were generated.
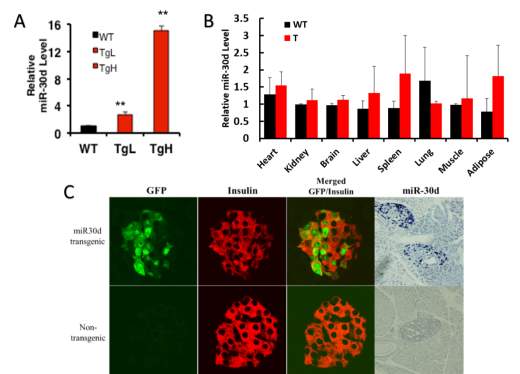
Fig 2.2 miR-30d specifically overexpressed in pancreatic islet cells.
(A) RNA was harvested from islets of 14 weeks old male mice, miR-30d expression level were tested using RT-PCR. TgL line showing about 2.5 times overexpression of miR-30d while TgH line has more than 15 times higher miR-30d exists in the pancreatic islets.
(B) RNA harvested from major organs, including heart, kidney, brain, liver, spleen, lung, muscle and adipose tissue of 14 weeks old random transgenic male mice, miR-30d expression level were tested using RT-PCR. None of the tissue has significant difference at miR-30d level between wild type and transgenic mice.
(C) Immunohistochemistry was performed on tissue section of 12 weeks old male mice. Anti-Insulin (Red) and anti-GFP (green) antibodies were used, 60x images were taken. GFP was specifically located only in the insulin positive area on transgenic mice tissue, and was perfectly overlaid with that area, but not on wild type sides. In situ hybridization was performed on slides from same mouse tissue, DIG-labeled miR-30d probe (blue) (20x images) were used to detect miR-30d level. miR-30d was only found on transgenic mice but not wild type mice slides. (**p
1.3.2 Under normal diet condition, miR-30d does not affect the glucose homeostasis, nor -cell function.
TgL and TgH mouse lines kept crossing with wild type and transgenic or non-transgenic pups from same litters were used for further studies. To look at if miR-30d has any effects on the glucose homeostasis of mice, general related parameters were monitored including weekly body weight change, blood glucose level, plasma insulin level, glucose clearance ability and insulin response related insulin sensitivity test.
Firstly, body weight was measured weekly starting from 4 weeks old till 12 weeks old. While TgL showed no significant difference compared to wild type at both genders, TgH male mice were much leaner than wild-type starting from 5 weeks old (Fig 2.3 A), and females of TgH mice had no significant changes on body weight (Data no shown). Random blood glucose level was also checked biweekly or monthly starting from 4 weeks till 12 weeks old on both genders, no significant difference was identified (Fig 2.3 B). Blood samples were collected for checking the insulin level at plasma monthly from 8 weeks till 16 weeks old, though insulin were slightly increased in TgL at certain age, there was not dramatic difference for both lines in both genders (Fig 2.4 C, female data not shown).
It is possible that miR-30d doesn’t contribute to the blood glucose or insulin changes under normal physiological conditions without any stimulus or stress. To fully test if there are any glucose homeostasis related phenotypes on transgenic mice, glucose tolerance test followed by insulin tolerance test had been done. 14 weeks old mice where challenged with glucose or insulin administration after certain hours of fasting, and then glucose levels were measured every 15 minutes after and later every half an hour till 2 hours.
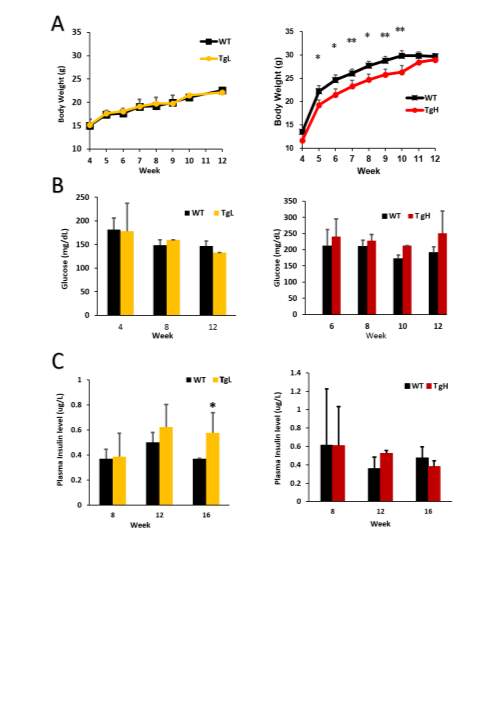
Fig 2.3 miR-30d does not change the glucose or insulin level
1.1g glucose per kg of mouse body weight were administrated into mice via i.p injection after 16 hours fasting with only water access. It is found the glucose tolerance ability didn’t change with miR-30d overexpressed since the curves after the injection for both early 4 weeks old and later 14 weeks old mice showed no big difference in both transgenic lines (Fig 2.4 A, B). Plasma samples were collected simultaneously at 0, 15, 30, 45, 90 minutes after glucose administration and after later insulin analysis, both wild type and transgenic had similar response to glucose and insulin released (Fig 2.4 C). 0.75 Unit of insulin per kg of mouse body weight was injected after 6 hours of fasting with water access only for the mice and glucose level was measured every half an hour after till 90 minutes. This insulin sensitivity test was performed only on TgL line, and not surprisingly, the wild type and transgenic mice obtained about same insulin sensitivity (Fig 2.4 D).
Realizing under normal physiological condition, miR-30d didn’t have much effect on maintaining the glucose homeostasis which is reasonable since glucose homeostasis was well regulated under this condition, and the body only required that much insulin releasing from islets to maintain it even the islets possible was producing more insulin within the cell. To fully look through if miR-30d has any function on β-cells under normal condition, mouse pancreas tissues were collected at 4, 14 and 20 weeks old for immunohistochemistry or total insulin content identification. For immunohistochemistry, anti-insulin and DAPI were used to localize the β-cells and nuclei. Images were taken and total β-cell mass and average islet size were quantitively analyzed.
Image J or Image Pro software were used for pancreas immunohistochemistry images analysis. TgL and TgH mice data were analyzed separately and normalized to wild type mice. While β-cell mass didn’t have much change on both transgenic lines, which means β-cells had not significant proliferation or death with miR-30d overexpression, average islets size didn’t get any affected as well (Fig 2.5 A, B). Total pancreas was also isolated and homogenized with acid ethanol (75% ethanol with 1.5% HCl) on these mice to collect total insulin content from pancreas samples, which is to roughly check the insulin production in all islets of pancreas. While TgL showed no big difference again, TgH surprisingly had half fold decrement in insulin content (Fig 2.5 C). Protein samples were also isolated from islets of these mice and western blot was performed to check the MafA’s expression since miR-30d could promote MafA’s level through targeting Map4k4 in vitro. As expected, transgenic mice showed increased MafA level in both TgL and TgH mice and TgH mice has more compared to TgL (Fig 2.5 D).
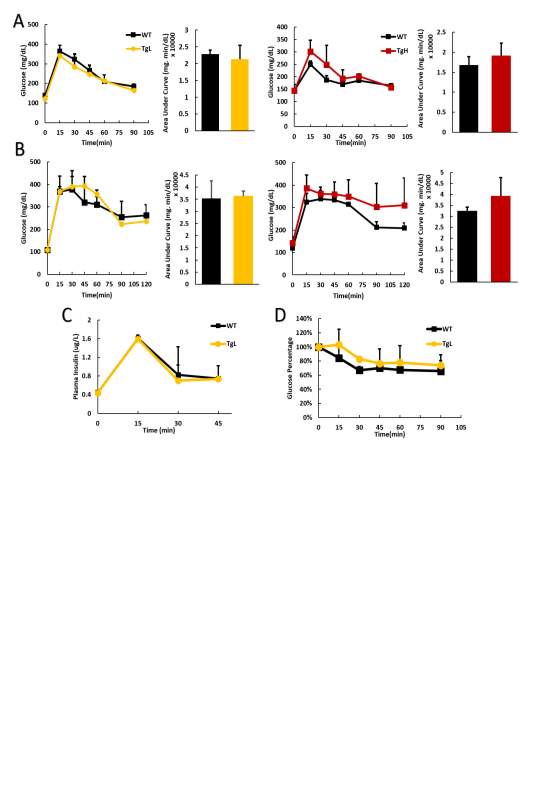
Fig 2.4 miR-30d does not change the glucose tolerance or insulin sensitivity
Since more MafA was produced in transgenic mice, but not more insulin was stored in the islets, even TgH line had less insulin content, this means miR-30d may target some other key proteins which is against the insulin production. The comparable glucose level and glucose clearance ability between both transgenic lines and wild type is possible that even with less insulin content, the cells could still compensate the requirements under the normal physiological condition to maintain the glucose homeostasis. These finding implicates that miR-30d may have stronger effects on β-cells when they are under stress condition.
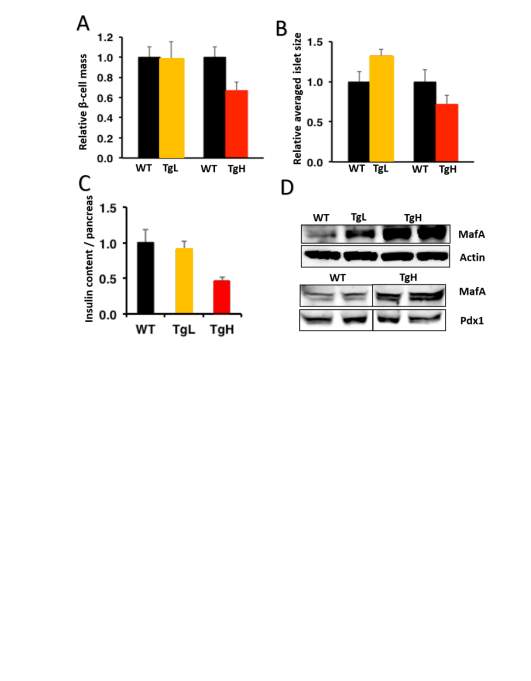
Fig 2.4 miR-30d decreased the insulin content in TgH mice
1.3.3 Under high-fat diet, miR-30d worsen the glucose homeostasis in TgH mice
High-fat food induced obesity is a common model for studying β-cells under stress condition since the body is actively responding to the extra high glucose or lipid brought by high fat diet but the glucose homeostasis is still maintained by β-cell compensation. During the state of obesity or insulin resistance, elevated plasma insulin levels has been found in polygenic mouse models showing insulin resistance and human subjects because of increasing of insulin secretion [45]. It has been suggested later that both in rodents and people, this improved insulin secretion is apparently because of an expansion in β-cell mass by either β-cell proliferation [46] or β-cell hypertrophy [47].
Mice from 4 weeks old started to have high-fat diet till the pancreas were collected at 16 weeks old or 20 weeks old. During the high fat feeding, general metabolic/glucose index was monitored weekly or monthly. It was not surprising that both TgH and TgL mice had slightly slower body weight gain starting from 7 weeks and no big difference between two transgenic lines (Fig 2.6 A). The glucose level of TgH also starting to rise dramatically starting from 8 weeks old till the end compared to wildtype. TgL mice however maintains comparable glucose level as wild type (Fig 2.6 B). Since mice were under high-fat diet feeding, the longer feeding to the mice, the larger chance those mice will develop insulin resistance which is featured as increased plasma insulin level. Wild type mice showed steady increased insulin in blood as the age grows, however, the plasma insulin of transgenic mice didn’t follow this rule. TgH mice surprising had lower plasma insulin as older which explained the increased glucose level (Fig 2.6 C) and insulin of TgL mice didn’t show much change.
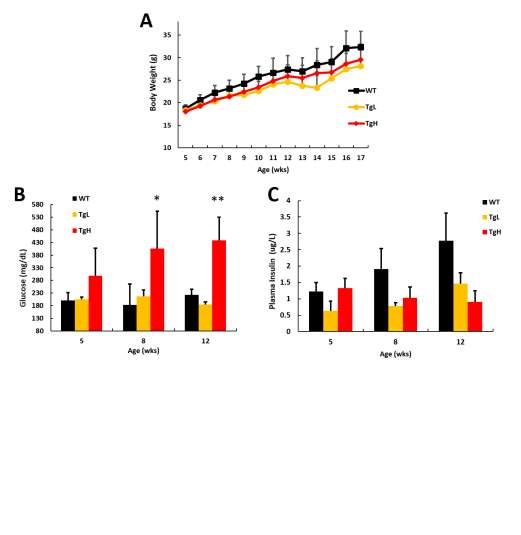
Fig 2.6 TgH mice exhibited hyperglycemia and decreased plasma insulin level under high-fat diet treatment
Glucose tolerance test was performed on male mice at 16 weeks old when they substantially exhibited food induced obesity. Surprisingly, when wild type still could retrieve the normal blood glucose 2 hours after the glucose injection, both transgenic mice revealed glucose intolerance compared to wild type, and the blood glucose of TgH mice stayed above 400 mg/dl even 1 hour after glucose administration. Area under curve analysis of GTT result implicated that TgH has significant decreased glucose clearance ability (Fig 2.7 A). To figure out what led to this, insulin tolerance test and plasma insulin analysis during GTT were performed and surprisingly, TgH mice had much significantly decreased plasma insulin (Fig 2.7 B) from the beginning till 45 minutes after the glucose injection. Moreover, TgH didn’t showing any strong glucose stimulated insulin secretion response as the insulin level barely elevated after the glucose injection (Fig 2.7 B). However, TgL mice still obtained regular glucose response and had comparable insulin released in plasma as wild type (Fig 2.7 B). Insulin tolerance test on these mice revealed TgH mice has better insulin sensitivity as the glucose level decreased much faster and more dramatically, and stayed at low level even 90 minutes after insulin injection when compared to both wild type and TgL mice.
The overall random glucose, plasma insulin level, GTT, ITT and glucose stimulated insulin secretion analysis implicates that TgH mice had poorly maintained glucose homeostasis with constant hyperglycemia and extremely low insulin secretion. With insufficient insulin, the insulin responsive tissues exhibited increased insulin sensitivity as a result. This could be caused by insulin secretion disability of β-cells or hampered insulin production.
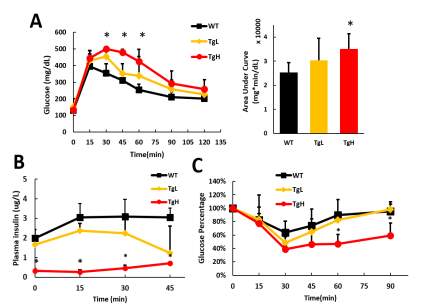
Fig 2.7 TgH mice exhibited glucose intolerance and poor glucose stimulated insulin secretion response
(A) Glucose tolerance test was performed on 20 weeks old male mice, 0.8g glucose per kg of body weight was i.p injected and glucose were measured every 15 or 30 minutes after till 2 hours. Area Under Curve was calculated as quantification of the glucose tolerance test curve.
(B) Blood samples were collected simultaneously during the glucose tolerance test on 20-week male mice before glucose injection, 15, 30 and 45 minutes after injection. insulin level was checked using the plasma isolated from the blood.
(D) Insulin tolerance test was performed on 20 weeks old male mice, 0.75 Unite insulin per kg of body weight was used for injection, glucose level was measured every 15 minutes after till 90 minutes. The glucose levels were all normalized to the starting glucose level of each individual before injection. (*p
1.3.4 Highly overexpress miR-30d in β-cells induces cell death and inhibit compensate β-cell proliferation in response to high-fat diet
In order to figure out whether the insulin secretion or insulin production was affected by miR-30d, β-cell mass and average islet size were analyzed on the pancreas tissue slides after all the in vivo tests and measurements. Using anti-insulin antibody for slides immune-staining, β-cell area was clearly visualized under microscope. While the islets of wild types were largely expanded in response to high demand of insulin as a result of high-fat diet, transgenic mice were not having similar responses (Fig 2.8 A). The islets of TgL mice maintained normal morphology as under normal diet condition without proliferation. However, TgH islets exhibited tiny, shrank and irregular shape which implicated they were not healthy (Fig 2.8 A). Besides, in some of the TgH islets, the insulin positive area counted less than 50% of the individual islet area from the images. Consider under normal physiological condition, 70%-80% of the islets cells are β-cells, TgH β-cells were assumed suffering a large number loss. Based on the islets images, quantifications were done to further confirm this hypothesis. It was surprising that β-cell mass of TgH was about just 20% as much as wild types’ and islet size was about 50%. TgL mice also had down-regulated β-cell mass and islet size, but not as dramatic as TgH mice (Fig 2.8 B, C).
Since transgenic mice had decreased β-cell population, the total insulin content which measuring the insulin storage within the whole pancreatic β-cells was also significantly below wild type level, about 20% as much as wild type for TgH mice while 70% for TgL mice (Fig 2.8D). Correspondingly, the total glucagon content of TgH mice significantly elevated as more α-cells proliferated in response to β-cell loss. TgL mice had increased glucagon content as well but not as much as TgH mice (Fig 2.8 E).
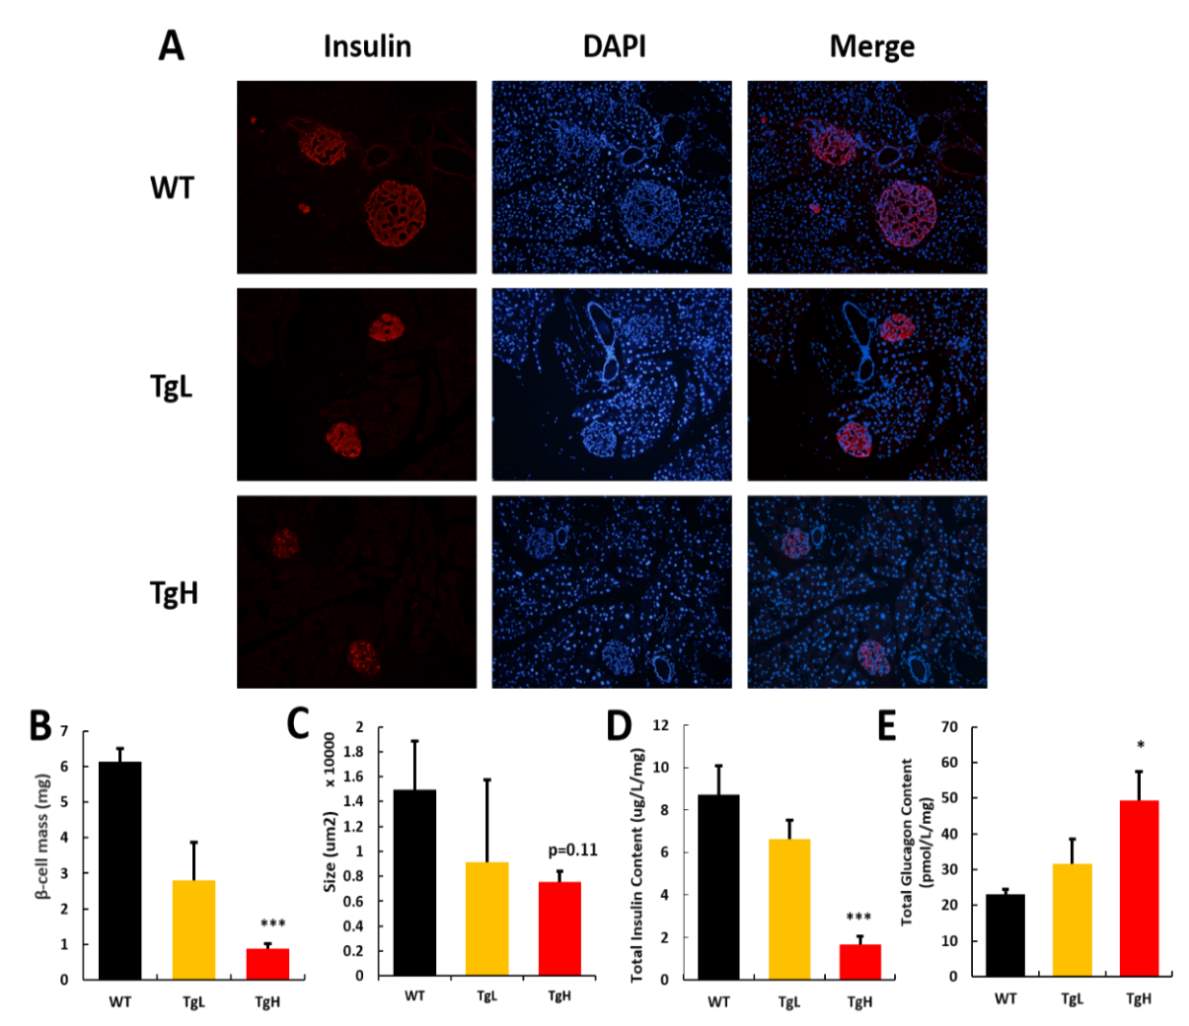
Fig 2.8 miR-30d induced significant β-cell loss in TgH mice
(A) Pancreas tissues were collected from 20 weeks old male mice for fixation. Anti-insulin antibody and DAPI were used for paraffin slides immune-staining. Insulin (Red) and nucleus (Blue) images were taken at 20x objective and merged as overlay image.
(B) 4x images were taken on insulin and nucleus stained slides. All the insulin positive area and pancreas area were counted using ImagePro software. β-cell mass (mg) was roughly calculated as insulin area to pancreas area ratio by the whole pancreas wet weight (mg).
(C) 20x images were taken on insulin and nucleus stained slides. All the islets on slides were counted and measured and average size (µm2) was calculated as area sum up divided by the islet number.
(D) Whole pancreas tissues were collected from 20 weeks old male mice and homogenized in acid ethanol. Insulin was determined using Elisa kit and collected supernatant.
(E) Whole pancreas tissues were collected from 20 weeks old male mice and homogenized in acid ethanol. Glucagon was determined using Elisa kit and collected supernatant. (*p
1.3.5 Overexpression of miR-30d inhibited β-cell proliferation and induced β-cell apoptosis under high-fat diet
To understand if the decreased β-cell mass and islet size was because of inhibited β-cell compensate proliferation in response to high-fat diet or miR-30d induced some other factors to trigger the β-cell death, β-cell proliferation and apoptosis were both examined. For proliferation, high-fat diet fed mice were received BrdU i.p injection (10mg per g of body weight) for 7 consecutive days and pancreas were collected and fixed for preparing tissue slides. Anti-BrdU antibody, anti-Insulin antibody and DAPI were used to stain BrdU, insulin and nucleus respectively. Islets image were taken and BrdU positive cell numbers in insulin positive area were manually counted. Wild type mice exhibited vigorously BrdU uptaking in islets while TgL mice had less BrdU counts. Moreover, only a few BrdU positive cells were identified on TgH mouse islets (Fig 2.9 A).
The quantification of BrdU positive cell ratio in β-cells showed TgH had significant decreased proliferation. However, TgL had comparable BrdU positive β-cell ratio as wild type which implicated that low overexpression of miR-30d did not affect the proliferation but only highly overexpressed would (Fig 2.9 B). To further confirm miR-30d’s proliferation inhibiting role under stress condition or certain stimulation, similar research conducted on 12 weeks old normal diet fed female mice which were pregnant. Islets during pregnancy was known to have adaptive proliferation in response to placental lactogen secretion [111]. BrdU incorporation in islets started to increase significantly from pregnancy day 10 and reached peak at day 14 [111]. In our case, TgH females had only half of BrdU positive cell ratio of wild type and TgL had lower but not significantly compare to wild type (Fig 2.9 C).
Furthermore, in situ TUNEL signal which represents the DNA fragments results from apoptotic signaling cascades was also detected. Since β-cells are proliferating still in this state yet, barely any positive TUNEL was discovered on wild type mouse pancreas. TgL mice had average less than five cells per islets that containing TUNEL while surprisingly tremendous amount of TUNEL covered most part of the TgH mouse islets (Fig 2.9 D). Quantification data showed TgH had 70-fold increment in TUNEL signal compare to wild type while TgL had about 7-fold higher (Fig 2.9 E). These results demonstrate that miR-30d was giving a “toxic” effects including inhibiting proliferation and triggering apoptosis on β-cells under stress condition when given a high “dose”. Low “dose” also had similar effects but in a much mild condition and didn’t cause significant changes. And among these two reasons leading the β-cell population loss, stimulation on apoptosis pathway plays major role.
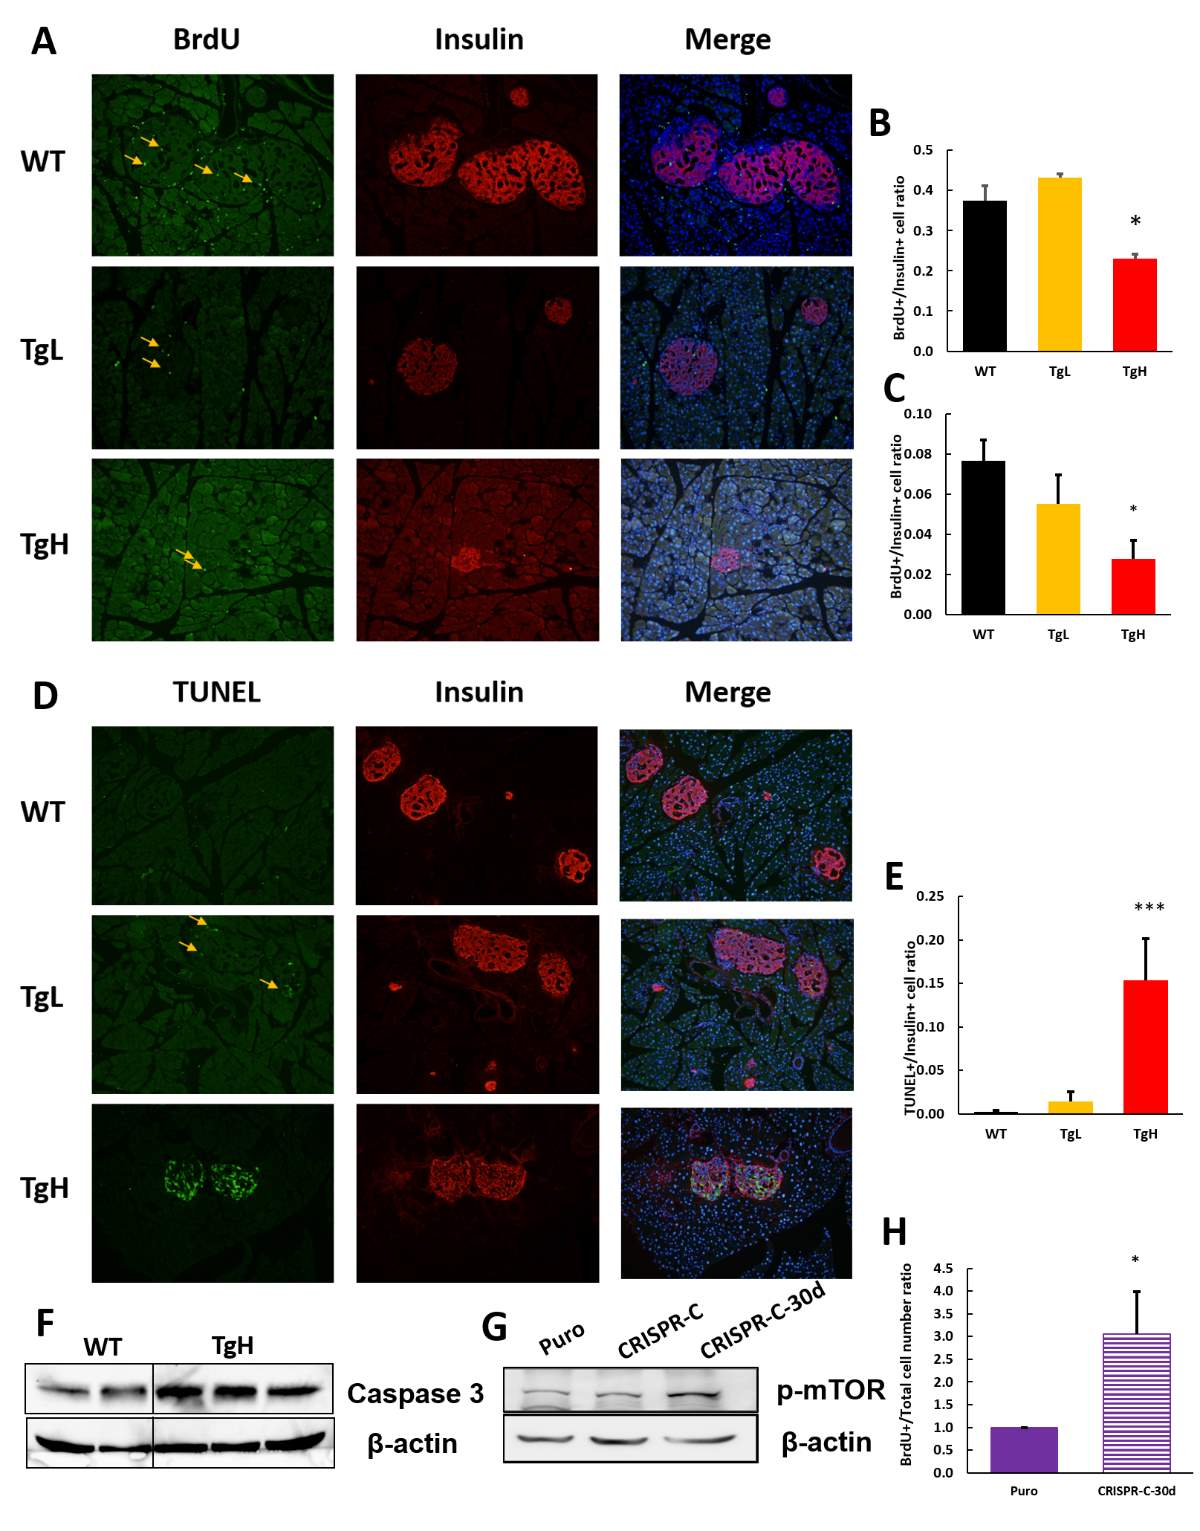
Fig 2.9 Overexpression of miR-30d inhibited β-cell proliferation and induced β-cell apoptosis under high-fat diet
(A, B) 10mg/g BrdU was administrated for 7 consecutive days through i.p. injection on 20 weeks old high-fat diet fed mice. Pancreas was collected after and fixed for tissue slides. Insulin (Red) and BrdU (Green) was immune-stained, DAPI (Blue) was used for nucleus staining. Images were taken under 20x objectives and total at least 2000 β-cells per slide were manually counted for quantification.
(C) 10mg/g BrdU was adiministrated for 7 days on 12 weeks old normal diet female mice since E.4.5. Pancreas tissues were collected and fixed at E10.5. Slides were stained for BrdU, DAPI and insulin. More than 2000 β-cell per slides were manually counted for quantification.
(D, E) Pancreas slides from 20 weeks old high-fat diet fed mice were stained for TUNEL(Green) using in situ TUNEL kit, followed by immune-staining for Insulin (Red) and DAPI (Blue). Images were taken under 20x objective and total at least 2000 β-cells per slide were manually counted for quantification.
(F) The expression of CASP3 was analyzed in wild type and TgH mouse islets by western blot. β-actin was internal control.
(G) MIN6 cells was transfected with self-designed Puro [1], CRISPR-Cas9-C [1] and CRISPR-Cas9-miR30d plasmids.
Cells were incubated in DMEM medium without any serum or growth hormones for 16 hours and treated with cytokine mixture (TNF-α, IL-6, IL-10) for 6 hours. Cell lysates were collected later to analyze the expression of phosphor- mTOR. β-actin was internal control. (H) CRISPR-Cas9-30d transgected MIN6 cells were seeded on coverslip and treated with DMEM for 16 hrs without serum or growth hormone followed by 6 hours of cytokine mixture treatmen with 4 hours BrdU incubation. Cells were fixed and stained for BrdU and nucleus later and BrdU positive cells were manually calculated (*p
To further confirm that cell proliferation was inhibited and apoptosis was increased, cell lysates were collected and western blot was performed to see if any important proliferation or apoptosis factors had change or not. Not surprisingly, Caspase 3(CASP3) had significantly elevated expression in TgH mice islets (Fig 2.9 F). CASP3 is one of the cysteine-aspartic acid protease family members [112] and sequentially activation of them plays a central role of cell apoptosis signaling cascade [113]. One other evidence was found in permanently miR30d knock-out MIN6 cell line using CRISPR-Cas9 systems to introduce miR-30d DNA cleavage techniques. MiR-30d presented less than half-fold in MIN6 cells after introduction (Data not shown). In these MIN6 cells, phosphorylated-mTOR (p-mTOR) was found significantly increased under cytokines treatment when knock down the miR-30d expression (Fig 2.9 G).
mTOR, which is short of mechanistic target of rapamycin, was recognized as a member of the phosphatidylinositol 3-kinase-related kinase family [114] and functioned as a protein kinase that regulates cell proliferation, cell growth, cell survival protein synthesis and metabolism etc [115]. Similarly, when looking at the BrdU positive cells in this miR-30d knock out MIN6 cells, the ratio increased 3-fold compared to control group after cytokine mixture treatment. In overall, these results demonstrated that miR-30d induced cell apoptosis and blocked the proliferation in β-cells under high-fat diet feeding.
1.3.6 CCNE2 is one of the targets of miR-30d to regulate the cell cycle
To understand which target genes are negatively regulated by miR-30d in activating cell apoptosis and inhibiting cell proliferation, we predicted candidate target genes using miRNA target prediction programs. Among many candidates, CCNE2 shows to have two miR- 30d complementary sites at 237 bp and 1298 bp region on its 3’-UTR (Fig. 2.10 A). These two complementary sites are highly conserved among its homologs in various mammalian species including humans and mice, suggesting a critical role of miR-30d in regulating CCNE2 which may function in pancreatic cells (Fig. 2.10 A).
CCNE2 has been reported as one of miR-30d-5p’s targets in lung cancer cells and affects tumor cell proliferation [116] while in MIN6 cells, CCNE2 protein expression had decreased when overexpressed miR-30d and when knock down it, CCNE2 protein increased in expression (Fig 2.10 B). However, CCNE2 messenger RNA level didn’t change significantly when overexpressed miR-30d under high glucose (G25mM) treatment (Fig 2.10 C). Silencing CCNE2 in MIN 6 cells seems had feedback effect on miR-30d level that miR-30d all decreased under both low and high glucose treatment (Fig 2.10 D) significance will be determined after experiment repeating). Consider CCNE2 is a cyclin protein which controls the cell cycle transition [117] [118] [119], and miR-30d also had negative regulation on β-cell proliferation, BrdU ratio in MIN6 cell was determined after silencing CCNE2 using siRNAs.
Surprisingly, BrdU ratio didn’t change between control and CCNE2 silenced cells under either low and high, with or without cytokine mixture treatments (Fig 2.10 E, significance will be determined after experiment repeating). However, with reduced CCNE2 protein (Fig 2.9 F), MIN 6 cells exhibited less MafA and IRS2 expression under cytokine mixtures treatment, but without cytokine induced stress condition, there was no change (Fig 2.10 G). In summary, CCNE2 is one of the miR-30d’s targets in MIN6 cells and it may contribute to insulin function by affect MafA and IRS2. However how it regulates proliferation still worth further exploration.
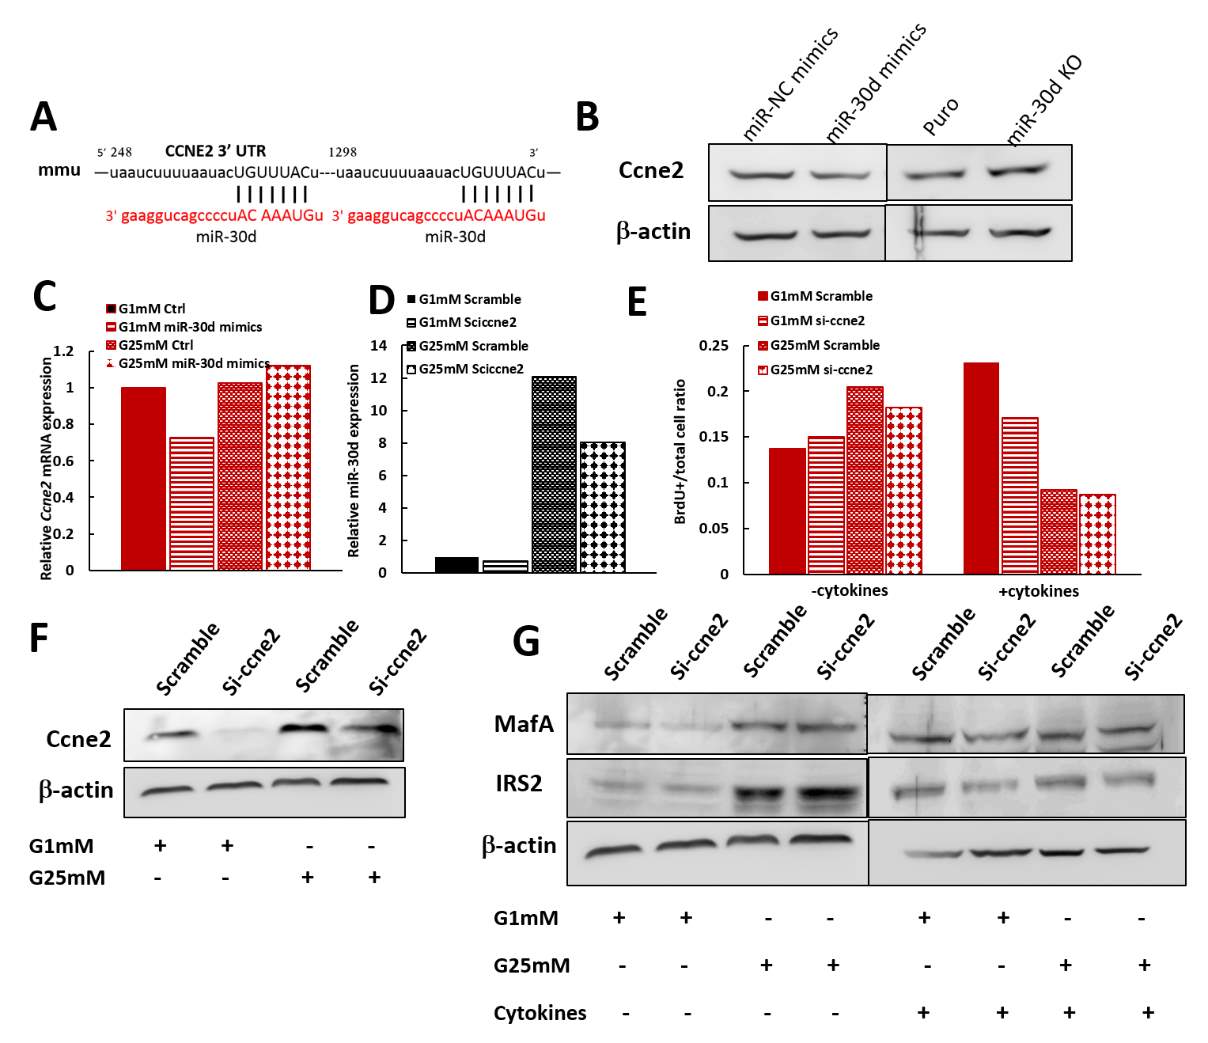
Fig 2.10 CCNE2 is one of miR-30d’s targets in MIN6 cells
(A) Bioinformatics prediction of the interaction between miR-30d and the 3’-UTRs of CCNE2 of mouse species.
(B) Overexpression of miR-30d down-regulates CCNE2 protein expression in MIN6. Knock down miR-30d up-regulates CCNE2 in MIN6. Both were under G25 Mm treatment for 16 hours before harvested lysate.
(C) CCNE2 messenger RNA levels after overexpressing miR-30d in MIN6 cells.
(D) miR-30d level after silencing ccne2 in MIN 6 cells.
(E) BrdU positive cell ratio after silencing ccne2 in MIN 6 cells. Cells were treated with BrdU for 4 hours two days after transfection and then fixed for BrdU staining.
(F) CCNE2 protein level decreased after si-ccne2 plasmid transfection under both G1Mm and G25Mm conditions.
(G) Silencing of ccne2 de-activated the expression of IRS2. 48h after transfection with siRNA against ccne2 or Scrambler in MIN6 cells, cytokine mixtures were added or not added into the medium for 16 hours and cell lysates were prepared for Western blots to detect the expression of IRS2, MafA and Actin.
1.3.7 miR-30d promoted BNIP3 expression in β-cells
Consider miR-30d induced severe cell apoptosis in vivo under high-fat diet feeding, several classical apoptosis pathway related genes expression has been tested. Among them, BCL2/adenovirus E1B 19 kDa protein-interacting protein 3 (BNIP3) coded genehad been identified as a one that had significantly 3.8-fold increased level in transgenic mice (Fig 2.11 A). BNIP3 has been known induces an atypical programmed cell death pathway through its BN3 domain or other protein interactions [120]. Furthermore, BNIP3 protein level had been determined in both transgenic mice and CRISPR-C-miR30d MIN6 cells, and it increased in transgenic mice lysates and inhibited in miR-30d knock out MIN6 cells (Fig 2.11 B).
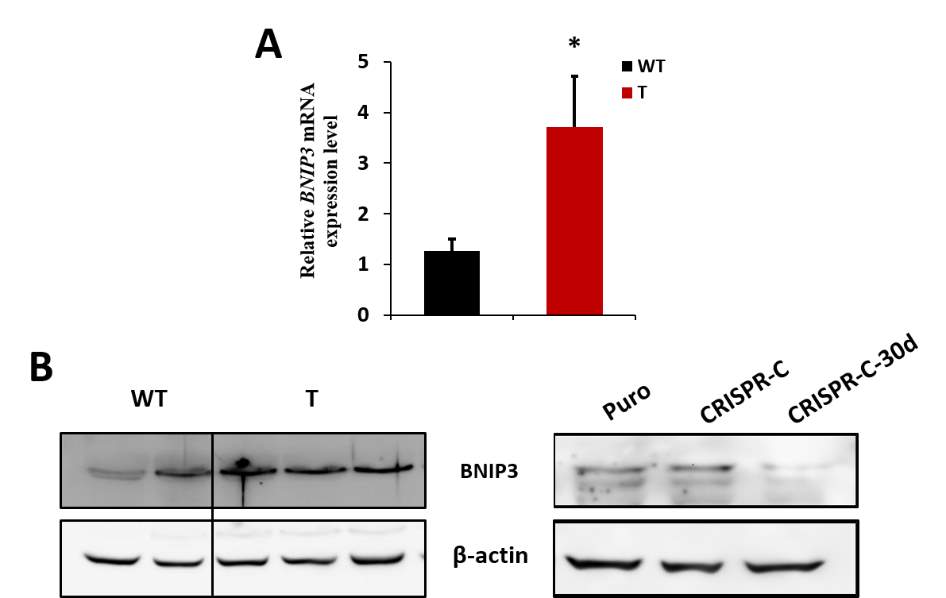
Fig 2.11 miR-30d promoted BNIP3 expression
(A) BNIP3 m RNA level was determined from total RNA isolated from islets of 16 weeks old male mice using Taqman q-PCR. HPRT was used as internal control.
(B) BNIP3 protein level was determined for proteins isolated from islets of 16 weeks old male mice (Left) or CRISPR-Cas9-miR-30d transfected MIN6 cells (Right). (*p
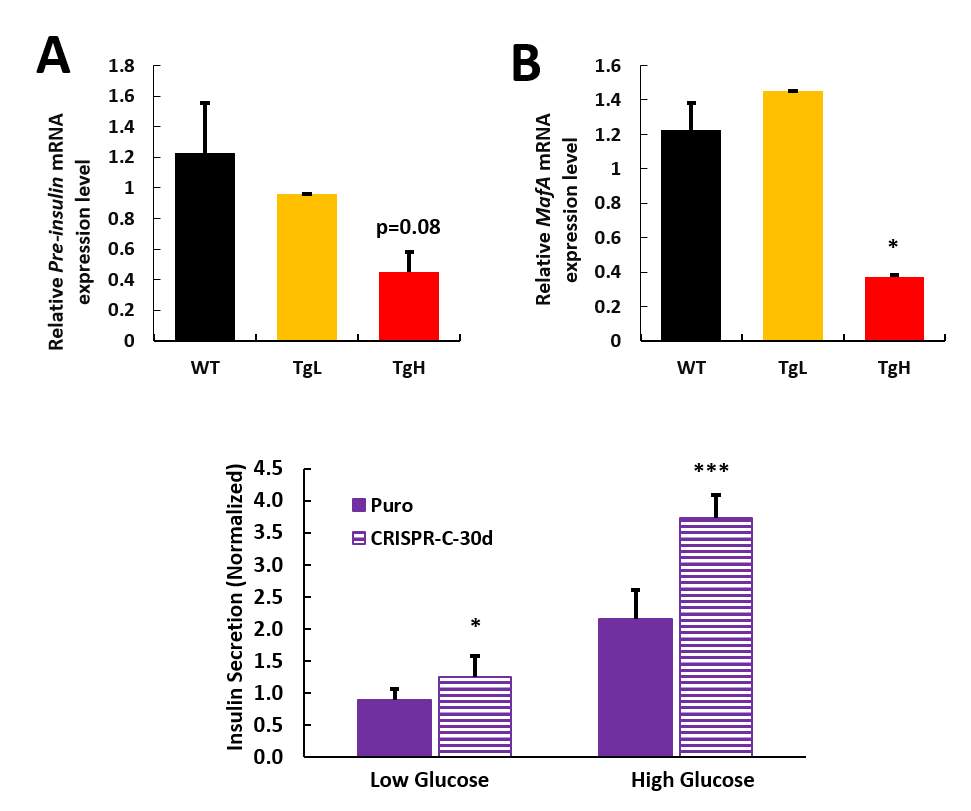
Fig 2.11 miR-30d may inhibit β-cell function as well
(A, B) Pre-insulin and MafA m RNA level was determined from total RNA isolated from islets of 16 weeks old high-fat diet fed male mice using Taqman q-PCR. HPRT was used as internal control.
(B) Insulin secretion assay was determined on CRISPR-Cas9-miR-30d transfected MIN6 cells under G2 mM (Low glucose) and G 20 mM (High glucose) respectively.
Insulin was determined using Elisa and normalized to total insulin level of each individual. All data normalized to level of Puro[1] under low glucose condition. (*p
1.3.8 miR-30d may inhibit β-cell function as well
Since miR-30d highly inhibited the total insulin production in pancreas, it was not yet known if the decreased insulin production was because of significantly decreased β-cell population only or if miR-30d affected insulin transcription in each as well. To exclude this possibility, mRNA extracted from islets of high-fat diet fed mice was used for Pre-insulin expression determination. Surprisingly, Pre-insulin decreased in TgH mice and MafA also had inhibited expression, but only in TgH mice (Fig 2.12 A, B). Furthermore, glucose stimulate insulin secretion assay was performed on CRISPR-C-30d MIN6 cells, interestingly, miR-30d knocking out significantly improved insulin secretion under both low and high glucose conditions (Fig 2.12 C). These data implicated that miR-30d may be involved in specific β-cell function including insulin gene transcription and insulin secretion besides inducing cell apoptosis.
1.4 Discussion
Diabetes is one of the most common and complicate metabolic diseases, and type 2 diabetes is usually featured of defects in both β-cell function and insulin sensitivity [121]. The mechanism driven β-cell dysfunction had been widely studied, yet not completely known. Recently, a group of miRNAs was identified in human pancreatic β-cells using the next-generation sequencing technology, and the relation between these miRNAs and diabetes pathogenesis was revealed [122]. Some other studies on pancreas development and β-cell functions had implicated miRNAs’ pivotal roles in regulating the expression of a variety of genes critical for cell survival and insulin secretion [123]. Some plasma-based microarray data also discovered that many miRNAs were potential biomarkers which could indicate the progress of diabetes [124]. Among all these dysregulated miRNAs during diabetes, miR-30d was found differentially expressed in both diabetic islets and MIN6 cells under high glucose stimulation [90]. Further study showed that miR-30d regulated insulin gene transcription under stress condition. Based on these findings, we speculated that miR-30d might participate in diabetes progress.
Our results obtained from miR-30d transgenic mice showed that under normal physiological condition, overexpression miR-30d at different level didn’t induce any glucose homeostasis changes, including glucose tolerance, random blood glucose level or any sign of diabetes progress. Mouse model of obesity induced by high-fat diet feeding for at least 12 weeks presented surprisingly impaired glucose metabolism in transgenic mice, especially TgH mice across indexes of body weight, random glucose level, glucose tolerance. Furthermore, we found miR-30d significantly decreased total insulin production in pancreas by inhibiting obesity induced β-cell compensate proliferation and triggered widely and wild β-cell death, while knocking out miR-30d in MIN6 cells promoted cell proliferation even under stress condition as well as lessen the dying cell numbers. These findings suggested that miR-30d was involved in the progress of diabetes pathogenesis.
Previous study about miR-30d mainly known to be focused on its regulation of cancer progression. Several studies claiming that miR-30d is serving as an onco-microRNA by regulating cancer cell metastasis, proliferation, apoptosis as well as cell autophagy. miR-30d affects multiple autophagy involved genes including BECN1, BNIP3L, ATG12, ATG5 and ATG2 and suppresses the cell autophagy [88]. Another study reveals that miR-30d could target Beclin 1, resulting in the inhibition of the cisplatin-activated autophagic response, which protects human anaplastic thyroid carcinoma cells from apoptosis [89]. Both studies implicate that miR-30d assists cancer cells to escape autophagy triggered cell death and promote the cancer aggression. However, also in cancer cells, it is reported that miR-30d is negatively regulated by phosphoinositide 3-kinase (PI3K)/Akt signaling pathway and overexpression of miR-30d induces apoptosis and suppresses proliferation of renal cell carcinoma cells by destabilizing the mRNA of the oncoprotein metadherin (MTDH) [90].
These investigations implicated that miR-30d was highly possible to relate to apoptosis but with complex mechanisms. Our results were somehow consistent with these findings based on cancer, showing a negative role of miR-30d in pancreatic β-cell survival in response to stress condition, indicating similar molecular function network in diabetes and cancer.
Cycline E2 (CCNE2) was discovered targeted by miR-30d in result of inhibiting the non-small cell lung cancer (NSCLC) proliferation [116] and a study reported CCNE could be one of the factors used as screening markers which activate human β-cell proliferations [125]. Limited literature reported CCNE2’s role in β-cell, but it is widely known as a factor that specifically interact with CDK inhibitors and plays a role in cell cycle G1/S transition. Our results are consistent with previous findings in both cancer and β-cells, and more importantly, confirmed the important molecular relation between miR-30d and CCNE2 in β-cells.
While our results were showing that miR-30d had more significantly role in triggering apoptosis other than inhibiting proliferation, the direct target of miR-30d that induced the cell death pathway had yet been found. However, multiple cell death related factors had been found upregulated by miR-30d, including BNIP3. BNIP3 was known as a proapoptotic protein that could induce autophagy, apoptosis etc and dysregulated under stress such as hypoxia through hypoxia inducing factor-1 [126]. BNIP3 expression was implicated played a role in de-regulation of cell apoptosis in many types of cancers [127] [128] [129] [130] and also heart diseases [131, 132]. Since β-cell suffered from cell death during the later stage of T2D, miR-30d promoted BNIP3 up-expression may reveal a possibility of BNIP3’s new role in T2D pathogenesis. But how miR-30d up-regulated BNIP3 as an indirect target still needs to be explored. Interestingly, another BNIP3 like factor, BNIP3L was confirmed one of the targets of miR-30d in different human cancer cells [94] [133], however, BNIP3L wasn’t targeted in β-cells by miR-30d (Data not shown).
Downregulation of miR-30d expression by CRISPR-Cas9 system effectively increased the glucose induced insulin secretion in MIN6 cells revealed miR-30d’s role in regulating specific β-cell function more than monitoring the cell survival, which means miR-30d had a complex regulation network in β-cells. This role need to be further proved in vivo, and through which pathway did miR-30d affected the insulin secretion will be question to solve in the further.
Although more and more therapy or drugs are available that has improved the lives of all patients affected by diabetes, it is still one of the most challenging diseases in the world. Our findings suggest that miR-30d significantly triggered β-cell death under food induced obesity by affecting CCNE2 and BNIP3 and loss of miR-30d may induce insulin secretion. This implicate that miR-30d can be considered as a candidate for diabetes treatment and the therapeutic effects of miR-30d worth further exploration.
CHAPTER 2. Identification of miR-30d’s targets in pancreatic β-cells
Yiping Mao, Shungang Zhang, Guiliang Tang, Xiaoqing Tang1
1The following chapter is part of the manuscript under preparation.
2.1 Introduction
MicroRNAs (miRNAs) are one of the three classes of small RNAs (including small interfering RNAs, microRNA and Piwi-interacting RNAs) which are about 20-24 nucleotides long. The discovery of miRNA biology emerged since gene lin-4 and let-7 had been identified controlling the timing in C. elegans but without coding any protein. Instead, they acted as a short RNA transcript that regulated timing involved gene expression on post-transcriptional level [60, 134, 135]. Since then, more and more miRNAs had been identified and have been shown to regulate variety of gene expression by targeting to their 3’ untranslated regions (UTRs) and inhibiting the translation initiation (in animals) or conducting mRNA cleavage (in plants) [136-138].
In animals, mature miRNA synthesis has been through several steps: transcribed from DNA by RNA polymerase II, primary miRNA (pri-miRNA) transcript has much longer sequence and is further processed to precursor miRNA (pre-miRNA) about 60 nucleotides long by enzyme Dorsa and DGCR8 protein complex [139]. Pre-miRNAs are exported out of the nucleus and are cleaved by RNase III domain-containing protein Dicer to about 22 nucleotides long mature miRNA duplex form [140]. One strand of the duplex will be transported to miRNA-induced silencing complex (RISC) by Dicer, and the other strand, termed miRNA* is usually degraded in the end [67]. In mammalian cells, RISC mainly consists of Dicer, Argonaute 2, transactivating response RNA-binding protein (TRBP) and protein activator of the interferon-induced protein (PACT) etc. In RISC, miRNA plays the main role of targeting the mRNA by uncomplimentary binding to the target 3’UTR. Many animal miRNAs are highly conserved between species (citation 34), especially when looking at the crucial ‘seed’ region of each miRNA, which are mostly taking responsibility of specific targeting [141].
The miRNA study came across from biosynthesis to function and target recognition. Since one miRNA targets a variety of gene transcripts through the seed region of miRNA binding to the 3’ UTR of mRNA, miRNAs have been predicted to target more than 60% of human genome [102]. There are many bioinformatics online tools that could predict miRNA: mRNA interactions. miRbase, as the biggest online registry, collects miRNAs information from various of species which were identified already in research or using computational methods [142]. Another famous RNA database is named Rfam, which provides miRNA sequences and helpful for both miRNA identification and target prediction [143]. Even with the availability of these online tools, there is still possibilities that the predictions are not correct when tested in vitro or in vivo because of cell type or species specificities. In this case, target-specific experimental validation is a necessary way in recognition the interactions. The methods include well-established techniques such as quantitative real-time PCR (qRT-PCR) [144], Northern blot analysis, western blot [145] and 5’-rapid amplification of cDNA ends (5’-RACE) [146].
Firstly, the miRNA and its target mRNA should be co-expressed in a specific cell type which is typically confirmed by Northern blot analysis or qRT-PCR [147]. Although most of miRNA targets are known regulated at both mRNA and protein level, some targets are manifested regulation at only protein level [148]. Therefore, a typical approach to validate the function of miRNA: mRNA interaction is to overexpression or knock down of a given miRNA in a cell and then followed by western blot analysis and qRT-PCR.
In recent decades, advancements in gene editing field have given us many options to change the expression of a specific miRNA. To gain of functions, miRNA mimic or specific recombinant adeno virus vectors could be used to selectively overexpress a miRNA. However, these approaches only allow transient overexpression and require performing the follow experiments within a short time. To achieve loss of function study of a particular miRNA, there are various methods available include antagomirs [149], short tandem target mimics (STTMs) [150], classic zinc finger nuclease (ZFN) [151] and transcription activator-like effector nucleases (TALENs) [152]. However, these methods could not perfectly silence miRNAs and had some disadvantages like off-target effects and not being able to completely knock out gene expression. Thus, researchers are constantly looking for techniques that could better silence genes. Recently, CRISPR/Cas9 system is turning to a trend topic in gene silencing or gene editing field.
CRISPR (Clustered regularly interspaced short palindromic repeats) and the nuclease Cas9 are one of the machineries that prokaryotes utilize to help protect themselves from virus invading [153]. CRISPR loci typically consists of conserved CRISPR associated (Cas) genes and a series of repetitive sequences separated by variable unique sequences called ‘spacers’ which match the foreign genes (protospacers) [154-156]. Firstly, the protospacer region of the viruses or plasmids introduces into the CRISPR loci as a new spacer by Cas protein. The spacer array is later transcribed to the CRISPR RNAs (crRNAs) which is modified by Cas endoribonucleases at the repeat sequences, from long precursor turned to short sequences. The small crRNAs direct a Cas ribonucleoprotein complex to cut the target double DNA strands in the viruses or plasmid genome [157]. Scientist has reengineered this system and utilized this to cut their interested target DNA gene sequences. Because CRISPR/Cas9 guided DNA cutting requires only 20nt long guide sequence in crRNAs that could match the target DNA and a short-conserved motif in the downstream of the crRNA binding region, called protospacer adjacent motif (PAM) whose sequence canonically is 5’-NGG-3’, the easy designable and high target DNA silencing efficiency made the CRIPSR/Cas9 system a new star of gene editing tool [158].
In this study, we picked synthesized multiple guide sequence of miR-30d gene, incorporated the plasmid into MIN6 cells and successfully and permanently knocked down miR-30d expression in MIN6 cells using this CRISPR/Cas9 system. We chose the line with maximum efficiency of gene knocking down and used it throughout the study to find targets of miR-30d in pancreatic β-cells.
2.2 Methods and Materials
Cell culture and generation of miR-30d knocked down lines
The murine insulinoma cell line MIN6 was cultured in Dulbecco’s modified Eagle’s medium DMEM (GIBCO) containing 4.5g/l glucose supplemented with 15 % fetal bovin serum, 50 μM β- mercaptoethanol, 1 % penicillin-streptomycin (Invitrogen) in a humidified incubator at 37°C and 5 % CO2. The media was changed every two days and cells were passaged after reaching a confluency of about 80 %. Therefore cells were washed twice with 1xPBS and trypsinized with 0.05 % Trypsin (GIBCO) at 37°C for 3 minutes, centrifuged for 5 min at 700rpm and the cell pellet re-suspended in media.
Transfection
For loss and gain of function studies, MIN6 cells were transfected 10 g of plasmid using the Amaxa Nucleofector II (Lonza) according to the manufacturer’s instructions. In brief, cells were trypsinyzed as previously described. Four million cells were centrifuged at 700 rpm for 5 min at 4 degree Celcius. The pellet was resuspended in 100 μl transfection solution and supplemented with plasmid DNA. The cells were transferred to a cuvette and electroporated. Afterwards, cells were re-suspended in media and seeded in 6- or 24-well plates and treated with puromycin for antibiotics screening.
For required analysis, cells were treated with low (1mM) or high (25mM) glucose without serum for 16 hours, then cell lysates or total RNA or cell based assays werer collected or performed and subjected to analysis by western blotting or real time RT-PCR or Elisa assay. For cytokine treatment, cells were treated with 10 ng/ml of cytokine mixture (TNF-α, IL-1 and IFNγ) in 25 mM glucose medium for specific time.
RNA Extraction
Total RNA was extracted as described in the manufactures’ instructions. In brief, isolated islets or cells were homogenized in TriZol (Life Technologies) reagent and incubated for 10 min at room temperature. Afterwards 200 l chloroform per ml TriZol was added and samples were vigorously and manually shook, followed by centrifugation at 13,000 rpm at 4 °C. The RNA containing upper aqueous phase was transferred to a new tube and RNA was precipitated by adding 500 l of isopropanol overnight at -20 °C. The next day, the whole liquid was transferred to column provided by miRNeasy kit, RNA was washed and dissolved in RNase free water followed the manufactures’ instructions. RNA concentrations were measured using the NanoDrop photometer. cDNA was synthesized using the High Capacity cDNA Reverse Transcription Kit from Applied Biosystems. Therfore 800 to 2000 ng of total RNA were reversed transcribed using a pool of random hexamers and microRNA specific primers for 40 min at 42 °C in the presence of dNTPs, RNase inhibitor and reverse transcriptase. Afterwards the reaction was terminated for 5 min at 75 °C. cDNA was usually stored at -20 °C.
Quantitative real-time PCR for mRNA Transcripts
Quantitative realtime PCR was used to measure differences in RNA expression, using the Power SYBR green PCR Master kit from Applied Biosystems. In brief, a master mix was prepared for 10 l reactions, containing 2x SYBR Green Master Mix and 600 nM gene specific primer mix. The PCR reaction was carried out in 8-tubes strip format, combining 8 l of the master mix and 2 μl cDNA diluted template and using the Applied Biosystems StepOne Real-Time PCR System using following program: 10 mins at 95 °C, 40 cycles of 95 °C for 15 secs and 60 °C for 1 min. All samples were run in duplicate and the relative expression levels were calculated using the 2(-ΔΔCt) Method[108], with Hypoxanthine guanine phosphoribosyl transferase (Hprt) mRNA as an internal standard.
RNA sequencing by HiSeq analysis
Total RNA from cells was isolated and checked for its RNA integrity number (RIN) using Bio-analyzer. cDNA library was constructed in University of Michigan DNA sequencing core facility. Libraries were then carefully sequenced using Illumina HiSeq platform and enumerated signals reflecting RNA expression levels were then measured.
Statistical Analysis
All results are expressed as mean ± Standard Error of Mean (SEM). Statistical significance is determined by unpaired Student’s t-test (two-tailed). A p-value of less than or equal to 0.05 was considered statistically significant (*, p
2.3 Results
2.3.1 Identification of differentially expressed genes in miR-30d knockdown line using HiSeq analysis
In total 5 different guide RNAs were designed targeting different locations on miR-30d coding gene sequence with a PAM site in downstream. MIN6 cells were transfected with the constructed plasmid and screened by antibiotics incubation. RNA was collected from the survived cells to check miR-30d expression. Because of off-target effects, not all the construction was effective. The cell line with maximum knockdown expression of miR-30d (miR-30d KO) along with its negative control (Puro) were used for later analysis.
Total RNA was extracted from control and miR-30d KO cells, the quality of samples was analyzed using Bio-analyzer. Only the samples with RNA integrity number higher than 8 were chose to sequence the transcripts using Illumina HiSeq. The raw data had been analyzed and categorized. In total 23283 genes’ expression had been examined, differentially expressed transcripts were determined based on 3 criteria: Test status, False discovery rate (FDR) with q-value less than or equal to 0.05 and Fold change of the differential expression greater than or equal to 1.5 or less than or equal to 0.67. Results showed that about 6% genes (1422) out of the total 23283 genes were differentially expressed (Fig 3.1 A). Among these differentially expressed genes, 652 genes were upregulated with fold change greater than or equal to 1.5 and 770 genes were downregulated with fold change less than or equal to 0.67 (Fig 3.2 B). List of all differentially expressed genes were provided in Appendix A.
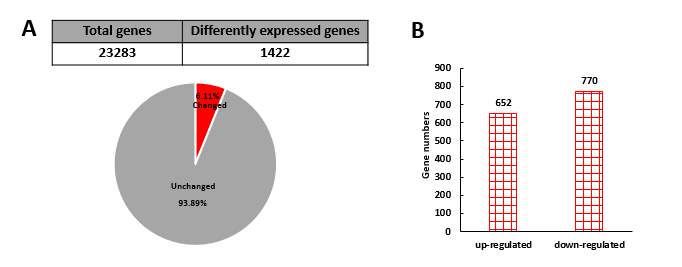
Fig 3.1. Differentially expressed genes after knocking down miR-30d
(A, B) HiSeq analysis of total RNA samples collected from control (puro) and miR-30d knocked down (miR-30d KO) MIN6 cell lines revealed 6% of the total genes which is 23283 had expressed differentially. Among these differently expressed genes, 652 genes were up-regulated for at least more than or equal to 1.5-fold change and 770 genes were down-regulated to at least less than or equal to 0.67-fold change.
2.3.2 Functional enrichment analysis of differently expressed genes in miR-30d KO
Database for Annotation, visualization and Integrated Discovery (DAVID) bioinformatics analysis tool was used to categorized the differently expressed genes based on the gene function to further understand data results. Some other resource and online tools were applied in annotate the result, including Gene Ontology (GO), PANTHER, KEGG pathways, INTERPRO and SMART protein domains. Index for each category consists gene list, copy number of genes, p-values, FDR, Bonferroni and Benjamini corrections. The enrichment analysis showed that the differently expressed genes were largely correlated with cell membrane (29%), cell signaling (23%), ion binding (21%), ion channel activity (1.5%), secretion (1.4%) etc. which implicated that miR-30d might have role in regulating β-cell secretion activity. Other than that, it was revealed that knocking down miR-30d also had large effect on cell proliferation (4.7%) and cell apoptosis (3.9%) and cell cycle (4.2%) with significance. Some other cell homeostasis and metabolic related gene had been significantly changed as well including glycoprotein coding genes, genes regulate protein kinase cascade, cell morphogenesis etc. (Table 3.1)
The functional enrichment analysis proved that miR-30d’s multiple potential roles in MIN6 cells and further confirmed the in vivo findings in miR-30d OV mice that miR-30d regulates the cell proliferation, cell apoptosis and might involve in insulin secretion activity as well. Complete analysis results are provided in Appendix B.
Table 3.1 Functional Enrichment analysis of differently expressed genes in miR-30d KO cell.
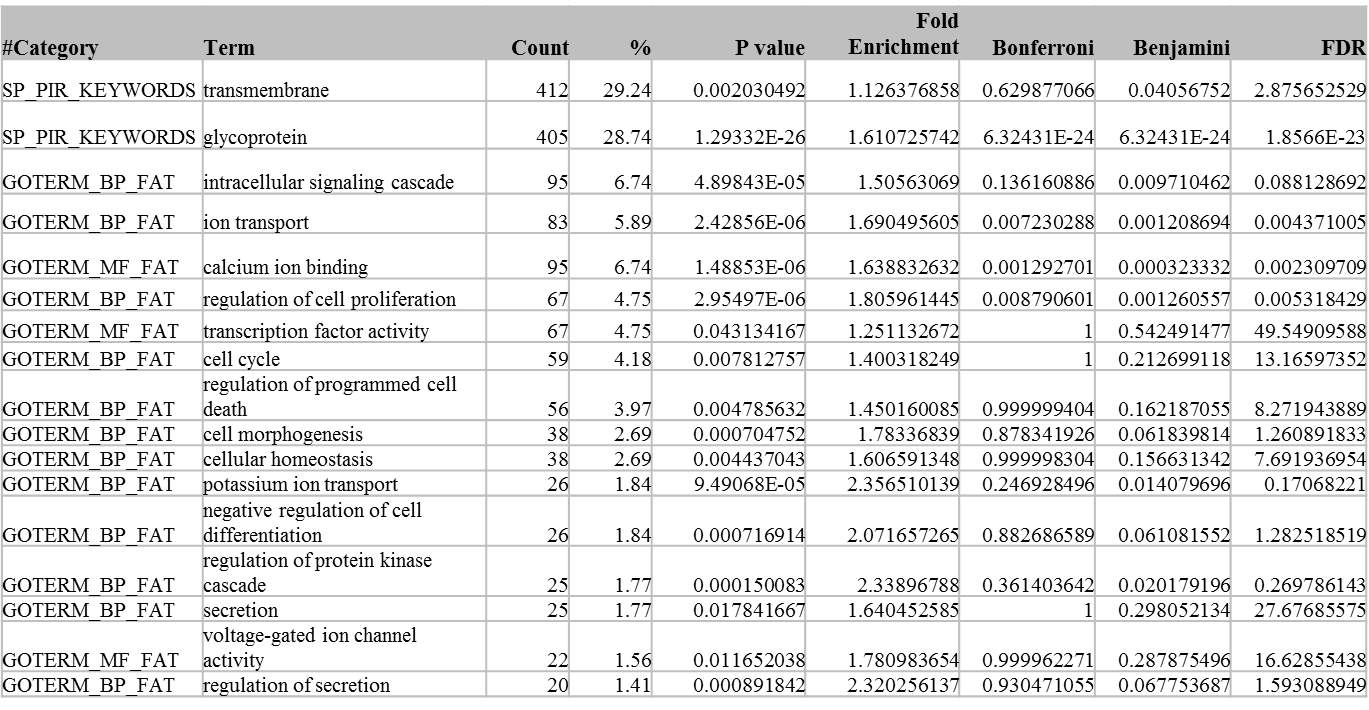
Table 3.2. List of predicted targets of miR-30d in MIN6 cells
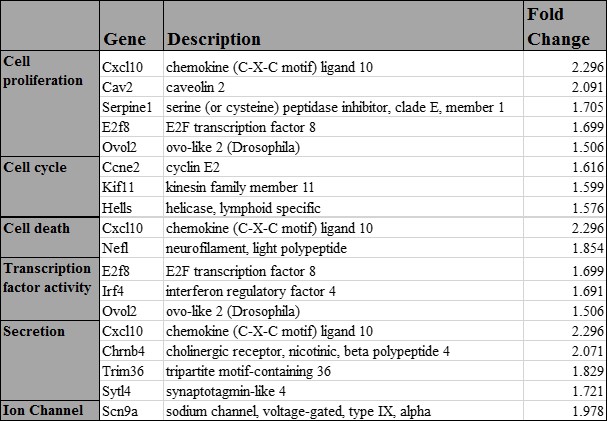
2.3.3 Identification of novel targets of miR-30d
To narrow down the researching range, differently expressed genes of interested categories had been chosen to for further identify the potential targets of miR-30d, including genes involved in cell proliferation (67 genes), cell death (56 genes), cell cycle (59 genes), transcription factor activity (67 genes), regulation of secretion (25 genes) and ion-channel activity (52 genes). Since microRNAs’ function was to inhibit the mRNA translation in mammalian cells, candidates with increased fold change were only chosen for further validation. miRDB, miRWalk and miRanda, three microRNA target prediction databases were used to predict the targets for mmu-mir-30d based on the complementary binding site on 3’ UTR to miR-30d seed region sequence. All the candidates were screened for miR-30d binding sites (Fig 3.2) and 14 potential targets of miR-30d in MIN6 cells were found (Table 3.2). Among them, Ccne2 had already been confirmed as miR-30d’s actual target in different type of cells [116]. Although it still requires further validation of these candidates, like luciferase assay, q-PCR and western blot, these findings implicated the multi possible roles of miR-30d and provided some future directions of miR-30d study in β-cells.
2.4. Discussion
In order to analyze how microRNA delivers the function, identifying microRNA targets is always an important part of microRNA functional studies among all species, which requires systematic detailed approaches. In this part of study, we were able to identify some of the potential novel targets of miR-30d in pancreatic β-cells using high throughput sequencing technique and CRIPSR/Cas9 system.
CRISPR/Cas9 is widely used in genome editing research. Compared to common techniques to introduce miRNA loss of function, like antisense inhibitors, ZFN and TALEN, CRISPR/Cas9 system has improved competencies and could target a specific miRNA loss of function in both of in vivo and in vitro conditions despite the small size of miRNA [159] [160] [161] [162]. More importantly, it is able to deliver stable mutation(s) to knock down the miRNA expression under in vitro condition. In this case, we incorporated the use of this tool in MIN6 cell line, generated miR-30d loss of function stable cell line, in aims to understand the genome wide impact of miR-30d expression knockdown.
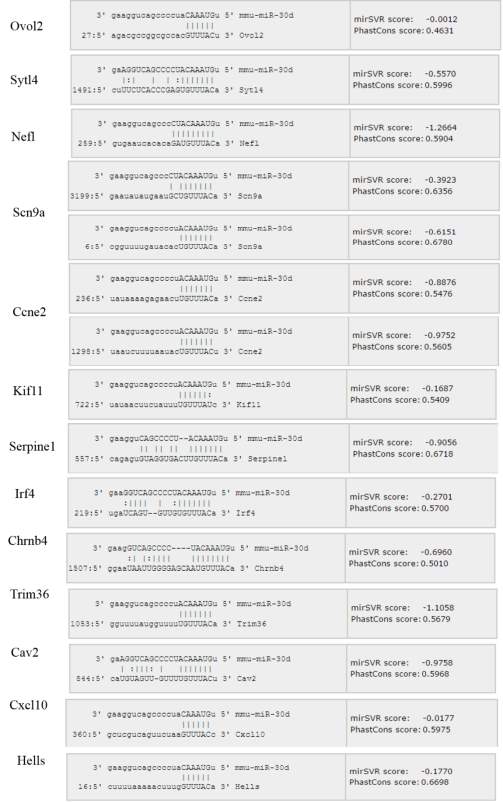
Fig 3.2 Alignment details of miR-30d and 14 candidate targets using miRNA.org database
Dr. Guiliang Tang kindly helped designed 5 different guide RNAs for targeting miR-30d coding gene, Shungang Zhang constructed each of them into vectors with chimeric gRNA and Cas9 protein coding sequence and transfected into MIN6 cells. Cells were screened using puromycin treatments and survived cells were analyzed miR-30d expression level to test the CRIPSR/Cas9 introduced knockout or knockdown. Interestingly, only 2 out of 5 lines showing significant miR-30d down-regulation (data not shown), considered off-target effects, and the knocking down was stable between passages. Single line with maximum reduction of miR-30d level (~60%) was picked for further studies.
The purpose of this study was using stable miR-30d knocked down cell line as a loss of function model to screen out the potential miR-30d targets since microRNA has direct inhibiting roles of their targets. Using high throughput sequencing technology combined with gene database based functional enrichment analysis, we were able to identify total more than 1400 differently expressed genes in knockdown cells out of total 23283 genes. Among the up-regulated 652 genes, interested gene function categories were chosen for further analysis including cell death, proliferation, cell cycle, ion-channel activity, transcription factor activity and secretion. Multiple miRNA database, like miRDB, miRWALK and miRanda were combined to the final screening of the candidates which should have complementary or uncomplimentary binding sequence at their 3’ UTR to miR-30d. And we found 14 genes met all the requirements, which implicated that their potential roles as miR-30d targets in MIN6 cells. As an uncompleted study, further procedures still needed to confirm these targets including using luciferase assay, qRT-PCR and western blot in both MIN6 cell and pancreatic β-cells.
These 14 candidate targets cover different functions in cells. Among them, Ccne2 has already been confirmed as miR-30d direct target in cancer cells regulating cell cycles [116] and also in β-cells (Chapter 1), no other genes have been learned in microRNA study. However, some of them already suggested regulates pancreatic β-cell function.
Chemokine (C-X-C motif) ligand 10 (CXCL10) is expressed in a variety of cells including human islets in response to IFN-γ [163], and increased level in serum of patients with T1D [164] and T2D [165]. Treating CXCL10 to human islets, the cells exhibited decreased viability, impaired insulin secretion with less insulin mRNA as a result of sustained activation of Akt, JNK and cleavage of PAK-2 which switched Akt signals from proliferation to apoptosis [166] [167]. Another strategy using CXCL10 DNA vaccination to neutralize CXCL10 in a spontaneous diabetes model of NOD mice was able to enhance the proliferation of pancreatic β-cells, thus suggested to be useful in maintaining β-cell mass against T1D [168]. Based on these studies, CXCL10 was revealed playing roles in regulating β-cell proliferation, apoptosis and secretion as well, which was consistent with the phenotypes of miR-30d OV and KO in vivo and in vitro and thus made it a strong candidate target of miR-30d in β-cells. Another candidate from the list we identified, Kif11, was found as a T2D risk gene. Genome-wide association studies on different large populations had revealed that single-nucleotide polymorphisms in IDE-KIF11-HHEX gene locus are associated with susceptibility to T2D [169] [170] [171]. Candidate gene Irf4 was recently implicated as required for insulin sensitization during obesity and endotoxemia [172]. And Serpine1 could in part induce insulin secretion under the inducement of porphyromonas gingivalis [173].
Most of the candidates we have found haven’t been studied in diabetic models or β-cells, but widely studied in other areas. The genes involved in cell proliferation, cell cycle and cell death mostly played roles in tumorigenesis, tumor cell migration and invasion. For example, Serpine1 was known for enhancing cell migration and apoptosis resistance in head and neck carcinoma [174], Hells, a chromatin remodeling gene, was identified could mediate the epigenetic deregulation genes which drive retinoblastoma [175] and also recognized as novel prognostic marker in renal cell carcinoma [176]. Upregulation of E2f8 promotes cell proliferation in breast cancer [177], lung cancer [178] as well as papillary thyroid cancer [179] through regulating cell cycle. In variety of microRNA studies, many microRNAs have been found involved in mediating cancer cell proliferation and death. miR-30d also had been revealed pivotal roles in tumorigenesis [180] [181] [182]. These candidates provide some insights about miR-30d’s unknown yet significant roles in pancreatic β-cells survival. However, experiments like luciferase reporter assay are needed to further validate the interaction.
Conclusively, this study carries a tremendous amount of information and meanings. Further studies on these identified potential targets of miR-30d will certainly enhance the complete understanding about the multi-functions of miR-30d and its interactions with multi-targets in pancreatic β-cells.
CHAPTER 3. Determination of miR-30d function in Cre-STTM30fl/fl
Yiping Mao, Ramkumar Mohan, Jacob Schoenborn, Guiliang Tang, Xiaoqing Tang1
1The following chapter is part of the manuscript under preparation.
3.1 Introduction
To validate one gene’s importance as a therapeutic target, in vivo model is often necessary. Using gain-of-function transgenic rodent model is one of the ways, However, loss-of-function knockout or knockdown rodent model is more prevalently used and more convincing in illustrate the importance of the interested gene. While using continuous expressed vector to generate specific gene overexpressed mice, it is prevalent to apply drug induced Cre-LoxP recombination in generating gene knock out mouse which is headed in flexibility of the gene knock out timing and cell-type specificity (proposal 40). In here, we have generated a pancreatic β-cell specific miR-30 knockout mouse model to dissect the physiological function of miR-30d.
To study the miRNA function, much of the analysis has relied on gain-of-function approaches, for example miRNA overexpression [183, 184]. This method is informative, however has to be interpreted with caution. Since usually a strong constitutive promoter is required for overexpression approach, not only will the miRNA be mis-expressed, but at high level that the endogenous role of the miRNA might be misrepresented [185] [186]. In this case, conclusion drawn from these gain-of-function strategies often requires further confirmation in more standard loss-of-function mutation models. When talking about generating miRNA knockout animal model, either therapeutic methods to decrease miRNA or genetic manipulation to silence miRNA are available to choose. However, a challenge lies in identifying the phenotype in these models. Due to the small size of the gene that lower chances to find a mutation within the gene or miRNA redundancy that most miRNAs have highly related family members which could compensate the function loss of the miRNA and thus minimize the possible phenotypes, it is unfeasible to generating mutants of a miRNA with many family members [186] [187]. To address these issues, numbers of alternative methods have been developed to inhibit miRNA function in animals, including miRNA sponges, using modified oligonucleotides that are complimentary to miRNA sequence in animal cell culture [188] [189], artificial miRNA take use of RNAi machinery [190] and miRNA target mimicry [191]. Short tandem target mimicry (STTM) methodology was developed by Dr. Guiliang Tang which contains two copies of miRNA partially complementary sequences linked by a spacer. When introduced in vivo, STTM triggers target miRNA degradation thus generate the loss-of-function model [150]. More importantly, it simultaneously blocks all the members in a miRNA family through single introduction event [192] to exclude the possible miRNA redundancy effect.
In this study, we utilized STTM technology to block all miR-30 family members’ expression and inducible Cre recombinase system to manipulate the conditional silencing timing in mice for better control [193]. In our miR-30 knockout mice, STTM-30 is constantly inhibited in the control mice and only when Cre recombinase is active, the stop cassette between the two loxP sites will be cleavage out and STTM-30 thus is functional to inhibit miR-30 expression.
Similar models have been available for some other microRNA functional studies in pancreatic β-cells, like miR-200 family [97], miR-375 [194] and miR-7 [83] but not miR-30. Since miR-30d has been shown to regulate pancreatic β-cell proliferation and apoptosis under stress condition and also may affect glucose stimulated insulin secretion, using STTM-30 mice, miR-30’s function will be validated and some other metabolic phenotypes might be identified as well.
3.2 Methods and Materials
Animal Care and Treatment
Mice were maintained on a 12-hour light/dark cycle with ad libitum access to regular chow food or high fat diet (containing 60% kcal fat, Research Diets) in accordance to requirements. All experimental procedures were approved by Animal Care Facility of Michigan Technological University. All animals are on the C57BL/6 background except db/db mice (BKS. Cg-m+/+leprdb/J, stock no. 000642). STTM-30f/f mouse founders are generated from company (Applied Stem Cell). Ins-Cre mouse were crossed with STTM-30f/f to produce Cre;STTM30f/f mice.
Mouse Islet Isolation and Culture
All mice were anethesized via i.p injection of mixure of α-chloralose at dosage of 100 mg/kg and urethane at dosage of 1000 mg/kg. Pancreatic islets were isolated and purified by intra-ductal perfusion of collagenase V (0.6 mg/ml) following the protocol described [106]. The purified islets were cultured in RPMI 1640 medium supplemented with 10% FBS and 1% penicillin-streptomycin for 24 to 72 hours according to the experiments. All experiments were carried out in accordance with the approval of the Animal Care Committee at the Michigan Technological University.
RNA Extraction
Total RNA was extracted as described in the manufactures’ instructions. In brief, isolated islets or cells were homogenized in TriZol (Life Technologies) reagent and incubated for 10 min at room temperature. Afterwards 200 l chloroform per ml TriZol was added and samples were vigorously and manually shook, followed by centrifugation at 13,000 rpm at 4 °C. The RNA containing upper aqueous phase was transferred to a new tube and RNA was precipitated by adding 500 l of isopropanol overnight at -20 °C. The next day, the whole liquid was transferred to column provided by miRNeasy kit, RNA was washed and dissolved in RNase free water followed the manufactures’ instructions. RNA concentrations were measured using the NanoDrop photometer.
Quantitative real-time PCR for miRNA Transcripts
cDNA was synthesized using the High Capacity cDNA Reverse Transcription Kit from Applied Biosystems. Therfore 800 to 2000 ng of total RNA were reversed transcribed using a pool of random hexamers and microRNA specific primers for 40 min at 42 °C in the presence of dNTPs, RNase inhibitor and reverse transcriptase. Afterwards the reaction was terminated for 5 min at 75 °C. cDNA was usually stored at -20 °C.
Quantitative realtime PCR was used to measure differences in RNA expression, using the Power SYBR green PCR Master kit from Applied Biosystems. In brief, a master mix was prepared for 10 l reactions, containing 2x SYBR Green Master Mix and 600 nM gene specific primer mix. The PCR reaction was carried out in 8-tubes strip format, combining 8 l of the master mix and 2 μl cDNA diluted template and using the Applied Biosystems StepOne Real-Time PCR System using following program: 10 mins at 95 °C, 40 cycles of 95 °C for 15 secs and 60 °C for 1 min. All samples were run in duplicate and the relative expression levels were calculated using the 2(-ΔΔCt) Method [108], with Hypoxanthine guanine phosphoribosyl transferase (Hprt) mRNA as an internal standard.
Genotyping of Mouse Tail Biopsies
Mice were weaned at an age of 3 to 4 weeks and separated based on gender with not more than 5 mice per cage. The tail biopsies were digested in 600 μl tail lysis buffer TNES, supplemented with 35 μl Proteinase K (10 mg/ml) and incubated over night at 55 °C. Cell debris was spun down at 12,000 rpm for 10 min after mixing with 6M NaCl and supernatants were transferred to a new tube. Subsequently, genomic DNA was precipitated by adding 700 μl of Ethanol (100 %) at -80°C. Precipitated DNA was pelleted for 10 min at 13,000 rpm, washed once with 500 μl of Ethanol (70 %). The pellet was resuspended in nucleotiase free water and DNA concentration was determined using NanoDrop photometer.
Genotyping-PCR was performed in a 20 μl reaction, using a Taq-Polymerase (LifeTechnologies) and following the manufacturer’s instructions. Gene specific Primers are summarized in Table 4.1.
Table 4.1: Primer Sequences for Mouse Genotyping
| allele | Forward Primer (5’-3’) | Reverse Primer (5’-3’) |
| STTM-30/eGFP | TGATCATGGTTGAGGTCTGA | GTGAGCCACTCACTGTGCAC |
| Cre | GCGGTCTGGCAGTAAAAACTATC | GTGAAACAGCATTGCTGTCACTT |
| Globin | TAGATGTGCTTTACTAAGTCATCGCG | GAGATCGAGCGGGCCCTCGATGGTAG |
| PolyA-Fu/Frt-R1 | CTAGATAACTGATCATAATCAGCCATACCACAT | CCGCGAAGTTCCTATACCTTTTG |
| 425N/CAG-R | GGTGATAGGTGGCAAGTGGTATTCCGTAAG | CATATATGGGCTATGAACTAATGACCCCGT |
Blood Glucose Measurement, In Vivo Tolerance Tests and in vivo Insulin Release
For glucose tolerance tests, mice were starved for 16h and interperitoneally (i.p.) injected with glucose in saline at 1.0 g/kg body weight. For an insulin tolerance test, mice were fasted for 6h i.p. injected with 0.75 units insulin per kg body weight. For all tolerance tests, plasma glucose levels were measured after 0, 15, 30, 45, 60, 90 and 120 min from tail vein blood. To measure the release of insulin in vivo, blood was drawn from the postorbital vein after 0, 15, 30 and 45 min. The blood was spun for 10 min at 6,000 rpm at 4°C and plasma was transferred to a new tube. Insulin was quantified in 20 μl plasma using an Insulin ELISA kit.
Insulin Quantification using an Elisa kit
Insulin was quantified in mouse plasma using the Mouse insulin Elisa kit or Ultrasensitive Elisa kit. Briefly, samples were collected and diluted respectively according to the sample source and 10 or 20 l of samples were transferred to the wells which coated with anti-insulin antibody at the bottom. Following the manufactures protocol, the sample were incubated with100 l enzyme conjugated buffer provided from the kit in room temperature at 800 rpm for 2 hours for insulin assay, and overnight at 4°C for glucagon assay. The wells were washed 5 times with wash buffer and dried. 200 l Substrate TMB were added into each well and react in room temperature for 15 mins followed by 50 l reaction stop buffer. The wells were read at 450nm. The OD values were normalized to the calibrators and the final insulin concentration results were recorded.
Statistical Methods
All results are expressed as mean ± Standard Error of Mean (SEM). Statistical significance is determined by unpaired Student’s t-test (two-tailed) and ANOVA analysis was performed for comparisons of three or more groups. A p-value of less than or equal to 0.05 was considered statistically significant (*, p ≤ 0.05; **, p ≤ 0.01; and ***, p ≤ 0.001).
3.3 Results
3.3.1 Generation of β-cell specific miR-30 KO mice (STTM-30fl/fl)
STTM-30 construct was designed and completed by Ruiwen Fan, and then used for the generation of the STTM30-shRNA transgenic mouse model. It involved several steps. Firstly, a genetically modified mouse line was generated, designated H11-3attP (H11P3), by knocking in three tandem attP sites (3attP), namely landing pad, into the mouse H11 locus (Fig 4.1 A). The second step was to integrate the STTM30 sequence into the H11P3 sites. It was accomplished by microinjecting integration cocktail into the pronuclei of heterozygous zygotes from H11P3 FVB X FVB WT mice. The integration cocktail consisted of plasmid pBT346-STTM-30 vector DNA and in vitro transcribed ϕC31 mRNA. Since the STTM30 transgene is adjacent to an attB site, the ϕC31 integrase enzyme will catalyze site-specific DNA integration between attB on the TARGATT donor vector and attP within the H11P3 modified locus in the mouse genome (Fig 4.1 B). Later, zygotes were injected with the integration cocktail were implanted into CD1 foster mice to produce offspring. Finally, STTM30 transgenic founder mice was identified by PCR-based genotyping (Fig 4.1 C, D).
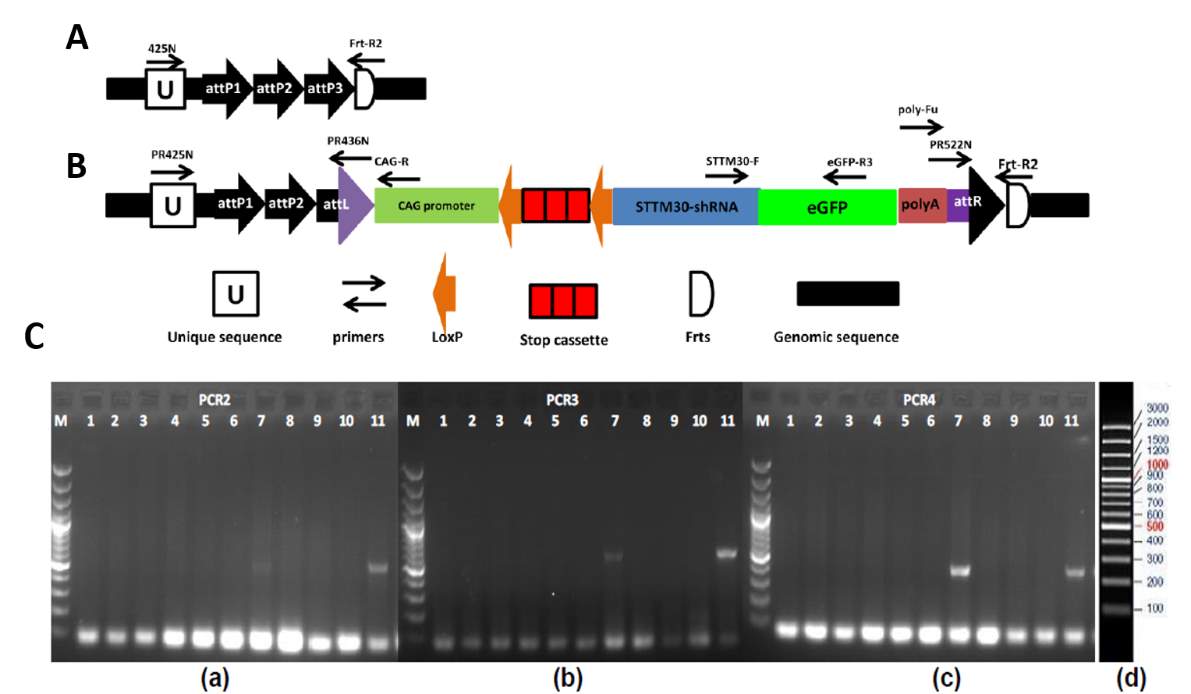
Fig 4.1 Transgene integration and genotyping of the STTM30 transgenic model.
(A) genomic sequence with H11P3 landing pad, (B) founder with STTM30 transgene inserted at third attP site. (C) Genotyping STTM-30 founder mice, 1141#11A 1 to 11 (lanes 1 to 11). Primers: a, 425N/CAG-R; b, STTM30-F/eGFP-R3; c, polyA-Fu/Frt-R1; d, 100bp ladder DNA marker used in lanes “M”.
Once STTM-30fl/fl mice were obtained, they were crossed with Cre mice to generate miR-30d KO mice. Total RNAs were collected from the islets of miR-30d KO mice to check the miR-30 family member expression thus to confirm the knock out efficiency. From the results (Fig 4.2), both miR-30d and miR-30a from miR-30 family were down-regulated about one-fold in the islets, while other random miRNA like miR-9 didn’t show alter in expression. This confirmed the STTM-30-shRNA transgene and the Cre-loxP system worked out successfully. miR-30 KO mice would be used for further exploration of function of miR-30 family in pancreatic β-cell.
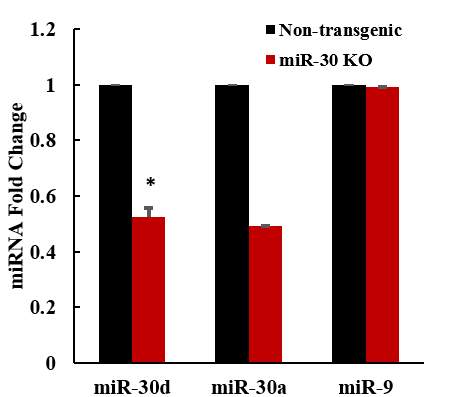
Fig 4.2 Validation of down-regulated expression in miR-30 KO mice
Islets were harvested and hand-picked from both non-transgenic and miR-30 KO mice. Total RNA was extracted and miR-30a, miR-30d and miR-9 level were quantified using qRT-PCR. Results showed a significant decrease of miR-30a and miR-30d expression level from miR-30 family in miR-30 KO mice, while miR-9 selected as a random miRNA had no change. All expression of miRNAs was normalized to snor202 level and the data are shown as mean ±SD. (* with p
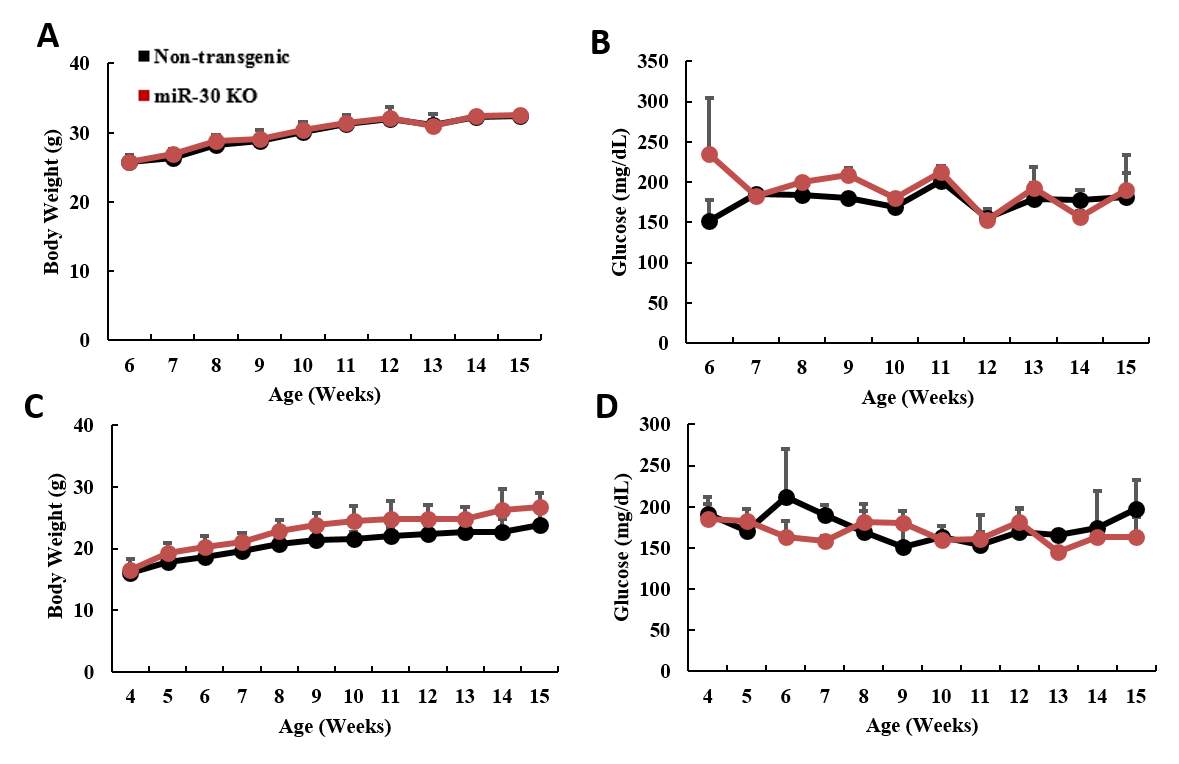
Fig 4.3 miR-30 KO mice maintained normal body weight and glucose level
Mice were separated in gender at age of 4 weeks. Both non-transgenic control and miR-30 KO mice were treated with normal rodent diet with regular water access. Male mice showed no significant change in terms of (A) body weight and (B) random fed blood glucose level between control and knockout mice over the 10 weeks. Similarly, no difference was observed in female group regards to their (C) body weight and (D) random fed glucose level.
3.3.2 miR-30 knock out mice obtained normal body weight and glucose level
miR-30 KO mice were treated with normal diet first to observe the phenotype. To eliminate the gender bias, male and female were separated at 4 weeks old and started measurement at the age of 5 weeks. Body weight and blood glucose level were monitored weekly under fed conditions till age of 15 weeks. Results have shown no significant difference in their body weight or random fed glucose level between control and miR-30 KO mice groups in male group. Female miR-30 KO mice had slightly increased body weight over the whole measure period, however was not statistic significant. (Fig 4.3 A-D).
Male miR-30 KO mice were tested for glucose or insulin tolerance level at 15-16 weeks old. For glucose tolerance test, both non-transgenic and miR-30 KO were starved for 16 hours, followed by 10% glucose 10 μL per gram body weight administration. Blood glucose level then was measured before injection and then every 15 minutes after till 2 hours. Blood samples were also collected simultaneously when checking the glucose at 0, 15, 30, 45 minutes. For insulin tolerance test, mice were fasted for 6 hours and followed by 0.75 Unit per kilogram body weight insulin injection. Results showed actually miR-30 KO mice didn’t have tolerance difference compared to controls (Fig 4.4 A, B), and the glucose stimulated insulin secretion was comparable between miR-30 KO and control as well (Fig 4.4 C). Though there were not any difference in body weight, glucose and clearance when knockout miR-30, it was consistent with the known fact that overexpression miR-30d didn’t change any glucose metabolism in vivo under normal diet condition (Chapter 1).
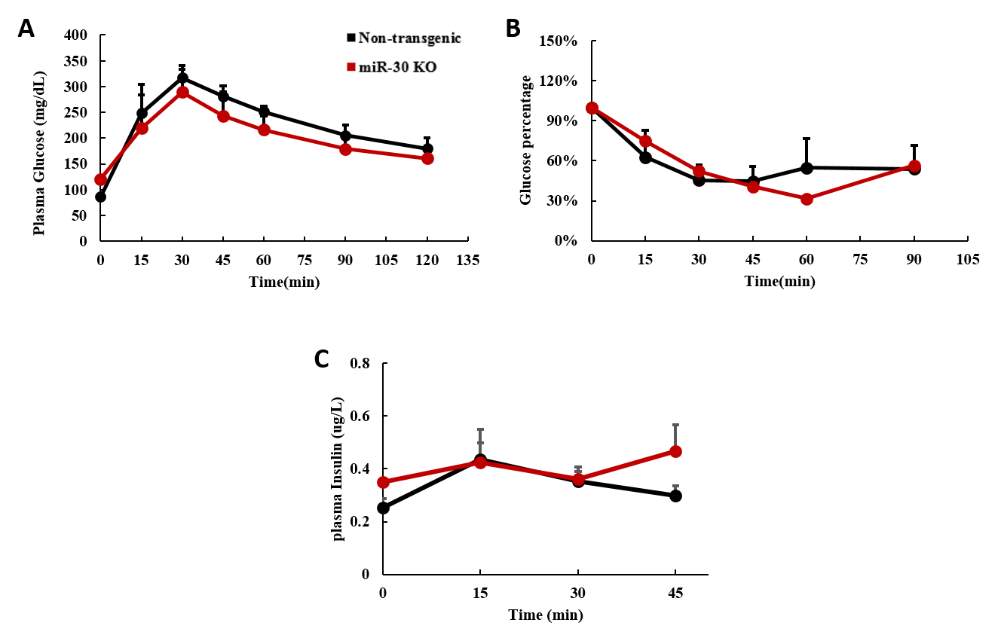
Fig 4.4 miR-30 KO didn’t change the glucose or insulin tolerance under normal diet condition
At age of 15-16 weeks, male mice were subjected to glucose tolerance test and insulin tolerance test. (A) After 16 hours of starvation, glucose tolerance test was performed. Glucose was measured before glucose injection and every 15 minutes after injection till 2 hours. (B) Mice were fasted for 6 hours before insulin injection and glucose level was measure before injection and every 15 minutes after injection till 90 minutes for insulin sensitivity test. All glucose levels were normalized to the glucose level before injection at 0 minute and showed as percentage. (C) Plasma was collected simultaneously during glucose tolerance test at 0, 15, 30, 45-minute time point for checking plasma insulin level before and after glucose stimulation.
3.4 Discussion
In this part of study, we have successfully generated pancreatic β-cell specific miR-30 knockout mouse model using STTM and Cre-loxP recombination system. This created STTM-30 floxed mice can be crossed with drug induced Cre mice or constitutively active Cre mice which express Cre recombinase driven by insulin gene promoter, to trigger the stop cassette deletion between two loxP site to active downstream STTM-30, thus knock out miR-30 only in pancreatic β-cell. There are variable β-cell specific Cre mouse models, including (Ins2-cre)25Mgn, (Ins2-cre)23Herrand (Ins2-cre/ERT)1Dam [195] which all are driven by Ins2 promoter. Ins2 is generally known as rat-insulin promoter (RIP) and firstly used in creating mouse model in 1999 [196]. In year 2000, RIP has been reported having non-specific expression in mouse brain which interfered the later experiments [197] [198].
Methods like replace it with longer DNA sequence of this promoter had been tried to eliminate the expression of Ins2 in brain, but failed. In this case, we chose to use Ins1 promoter, or called mouse insulin promoter (MIP) drived β-cell specific Cre mouse model since its expression is less than Ins2 [198] although it requires tamoxifen induced activation [199]. Another study recently showed that this mouse model induces high expression of human growth hormone as a result of its own transgene [200] even under no tamoxifen induced circumstances. In this case, proper control group is required to distinguish the “side effect” brought by the transgene when using this model. Here, we were using (Ins1-cre) tm1.1 Thor and (Ins1-cre/ERT2) tm2.1 Thorto constitutive or inducible knockout miR-30 expression in pancreatic β-cell.
The mouse strain that was using was C57BL/6J background, known for developing diet-induced obesity and diabetes [201]. To study the glucose metabolism related physiological changes, routine body weight, glucose level, glucose tolerance and insulin sensitivity were monitored on miR-30 KO mice. It is well known that gender has some major influence in body metabolism that male and female had different physical responses to diet, environment etc [202] [203] [204]. Our data implicated female had different responses to miR-30 knockout on body weight as male though not significantly. However, the glucose level for both gender didn’t show any difference compared to control mice under normal diet condition.
Tolerance tests were performed on male mice, and miR-30 knockout didn’t affect glucose clearance or insulin sensitivity under this normal circumstance as well. Though no phenotypes under normal food condition had been found, it was consistent with the findings on miR-30d overexpression mice that no random glucose level, glucose tolerance and β-cell mass had been changed in young age under physiological condition. It is possible when challenged with stress condition, such as high-fat diet or streptozotocin treatment, miR-30 KO mice will exhibit some improved glucose hemostasis or defects, and that’s also the future plan of this study.
REFERENCES
1. International, H.I.V.C.S., et al., The major genetic determinants of HIV-1 control affect HLA class I peptide presentation. Science, 2010. 330(6010): p. 1551-7.
2. Shaer, A., et al., Differentiation of Human-Induced Pluripotent Stem Cells Into Insulin-Producing Clusters by MicroRNA-7. Exp Clin Transplant, 2016. 14(5): p. 555-563.
3. Dobson, Nature of the urine in diabetes. Medical Observations and Inquiries, 1776. 5: p. 298-310.
4. Polonsky, K.S., The past 200 years in diabetes. N Engl J Med, 2012. 367(14): p. 1332-40.
5. Atlas, I.D., IDF Diabetes Atlas. 6th ed. 2013.
6. Robin, E.D., Claude Bernard. Pioneer of regulatory biology. JAMA, 1979. 242(12): p. 1283-4.
7. Banting, F.G., et al., Pancreatic Extracts in the Treatment of Diabetes Mellitus. Can Med Assoc J, 1922. 12(3): p. 141-6.
8. Banting, F.G., W.R. Campbell, and A.A. Fletcher, Further Clinical Experience with Insulin (Pancreatic Extracts) in the Treatment of Diabetes Mellitus. Br Med J, 1923. 1(3236): p. 8-12.
9. Saltiel, A.R. and C.R. Kahn, Insulin signalling and the regulation of glucose and lipid metabolism. Nature, 2001. 414(6865): p. 799-806.
10. Tiano, J.P. and F. Mauvais-Jarvis, Molecular mechanisms of estrogen receptors’ suppression of lipogenesis in pancreatic beta-cells. Endocrinology, 2012. 153(7): p. 2997-3005.
11. Araki, E., et al., Alternative pathway of insulin signalling in mice with targeted disruption of the IRS-1 gene. Nature, 1994. 372(6502): p. 186-90.
12. Himsworth, H., Diabetes mellitus: its differentiation into insulin-sensitive and insulin-insensitive types. Lancet, 1936. 227: p. 127-130.
13. Moller, D.E., New drug targets for type 2 diabetes and the metabolic syndrome. Nature, 2001. 414(6865): p. 821-7.
14. Doria, A., M.E. Patti, and C.R. Kahn, The emerging genetic architecture of type 2 diabetes. Cell Metab, 2008. 8(3): p. 186-200.
15. Schwartz, M.W., et al., Cooperation between brain and islet in glucose homeostasis and diabetes. Nature, 2013. 503(7474): p. 59-66.
16. Hu, F.B., et al., Diet, lifestyle, and the risk of type 2 diabetes mellitus in women. N Engl J Med, 2001. 345(11): p. 790-7.
17. Perry, R.J., et al., The role of hepatic lipids in hepatic insulin resistance and type 2 diabetes. Nature, 2014. 510(7503): p. 84-91.
18. Del Prato, S., Role of glucotoxicity and lipotoxicity in the pathophysiology of Type 2 diabetes mellitus and emerging treatment strategies. Diabet Med, 2009. 26(12): p. 1185-92.
19. Gong, Z. and R.H. Muzumdar, Pancreatic function, type 2 diabetes, and metabolism in aging. Int J Endocrinol, 2012. 2012: p. 320482.
20. Deeb, S.S., et al., A Pro12Ala substitution in PPARgamma2 associated with decreased receptor activity, lower body mass index and improved insulin sensitivity. Nat Genet, 1998. 20(3): p. 284-7.
21. Yang, J., et al., The association of Pro12Ala polymorphism in the peroxisome proliferator-activated receptor-gamma2 gene with the metabolic characteristics in Chinese women with polycystic ovary syndrome. Int J Clin Exp Pathol, 2013. 6(9): p. 1894-902.
22. Wolf, G., Role of fatty acids in the development of insulin resistance and type 2 diabetes mellitus. Nutr Rev, 2008. 66(10): p. 597-600.
23. Steiner, D.J., et al., Pancreatic islet plasticity: interspecies comparison of islet architecture and composition. Islets, 2010. 2(3): p. 135-45.
24. Bonner-Weir, S., et al., The pancreatic ductal epithelium serves as a potential pool of progenitor cells. Pediatr Diabetes, 2004. 5 Suppl 2: p. 16-22.
25. TATTIKOTA, S.G., Dissecting the microRNA pathway in the pancreatic β-cell during insulin resistance. 2014.
26. Weir, G.C. and S. Bonner-Weir, Islet beta cell mass in diabetes and how it relates to function, birth, and death. Ann N Y Acad Sci, 2013. 1281: p. 92-105.
27. Edlund, H., Pancreatic organogenesis–developmental mechanisms and implications for therapy. Nat Rev Genet, 2002. 3(7): p. 524-32.
28. Ziv, O., B. Glaser, and Y. Dor, The plastic pancreas Dev Cell, 2013. 26(1): p. 3-7.
29. Dor, Y., et al., Adult pancreatic beta-cells are formed by self-duplication rather than stem-cell differentiation. Nature, 2004. 429(6987): p. 41-6.
30. Xu, X., et al., Beta cells can be generated from endogenous progenitors in injured adult mouse pancreas. Cell, 2008. 132(2): p. 197-207.
31. Collombat, P., et al., The ectopic expression of Pax4 in the mouse pancreas converts progenitor cells into alpha and subsequently beta cells. Cell, 2009. 138(3): p. 449-62.
32. Al-Hasani, R., J.G. McCall, and M.R. Bruchas, Exposure to chronic mild stress prevents kappa opioid-mediated reinstatement of cocaine and nicotine place preference. Front Pharmacol, 2013. 4: p. 96.
33. Thorel, F., et al., Conversion of adult pancreatic alpha-cells to beta-cells after extreme beta-cell loss. Nature, 2010. 464(7292): p. 1149-54.
34. Chera, S., et al., Diabetes recovery by age-dependent conversion of pancreatic delta-cells into insulin producers. Nature, 2014. 514(7523): p. 503-7.
35. Spijker, H.S., et al., Conversion of mature human beta-cells into glucagon-producing alpha-cells. Diabetes, 2013. 62(7): p. 2471-80.
36. Weir, G.C., C. Aguayo-Mazzucato, and S. Bonner-Weir, beta-cell dedifferentiation in diabetes is important, but what is it? Islets, 2013. 5(5): p. 233-7.
37. Bell, G.I., et al., Molecular biology of mammalian glucose transporters. Diabetes Care, 1990. 13(3): p. 198-208.
38. Dong, H., et al., Immuno-isolation of pancreatic islet allografts using pegylated nanotherapy leads to long-term normoglycemia in full MHC mismatch recipient mice. PLoS One, 2012. 7(12): p. e50265.
39. Pipatpiboon, N., et al., DPP4-inhibitor improves neuronal insulin receptor function, brain mitochondrial function and cognitive function in rats with insulin resistance induced by high-fat diet consumption. Eur J Neurosci, 2013. 37(5): p. 839-49.
40. Koster, J.C., et al., Targeted overactivity of beta cell K(ATP) channels induces profound neonatal diabetes. Cell, 2000. 100(6): p. 645-54.
41. Gloyn, A.L., et al., Activating mutations in the gene encoding the ATP-sensitive potassium-channel subunit Kir6.2 and permanent neonatal diabetes. N Engl J Med, 2004. 350(18): p. 1838-49.
42. Ashcroft, F.M., D.E. Harrison, and S.J. Ashcroft, Glucose induces closure of single potassium channels in isolated rat pancreatic beta-cells. Nature, 1984. 312(5993): p. 446-8.
43. Matschinsky, F.M., B. Glaser, and M.A. Magnuson, Pancreatic beta-cell glucokinase: closing the gap between theoretical concepts and experimental realities. Diabetes, 1998. 47(3): p. 307-15.
44. Mao, C.S., et al., Glucose entrainment of high-frequency plasma insulin oscillations in control and type 2 diabetic subjects. Diabetes, 1999. 48(4): p. 714-21.
45. Polonsky, K.S., et al., Abnormal patterns of insulin secretion in non-insulin-dependent diabetes mellitus. N Engl J Med, 1988. 318(19): p. 1231-9.
46. Steil, G.M., et al., Adaptation of beta-cell mass to substrate oversupply: enhanced function with normal gene expression. Am J Physiol Endocrinol Metab, 2001. 280(5): p. E788-96.
47. Weir, G.C. and S. Bonner-Weir, Five stages of evolving beta-cell dysfunction during progression to diabetes. Diabetes, 2004. 53 Suppl 3: p. S16-21.
48. Butler, A.E., et al., Beta-cell deficit and increased beta-cell apoptosis in humans with type 2 diabetes. Diabetes, 2003. 52(1): p. 102-10.
49. Rhodes, C.J., Type 2 diabetes-a matter of beta-cell life and death? Science, 2005. 307(5708): p. 380-4.
50. Teta, M., et al., Very slow turnover of beta-cells in aged adult mice. Diabetes, 2005. 54(9): p. 2557-67.
51. Kushner, J.A., The role of aging upon beta cell turnover. J Clin Invest, 2013. 123(3): p. 990-5.
52. Stolovich-Rain, M., et al., Pancreatic beta cells in very old mice retain capacity for compensatory proliferation. J Biol Chem, 2012. 287(33): p. 27407-14.
53. Heit, J.J., S.K. Karnik, and S.K. Kim, Intrinsic regulators of pancreatic beta-cell proliferation. Annu Rev Cell Dev Biol, 2006. 22: p. 311-38.
54. Bonner-Weir, S., et al., Compensatory growth of pancreatic beta-cells in adult rats after short-term glucose infusion. Diabetes, 1989. 38(1): p. 49-53.
55. Porat, S., et al., Control of pancreatic beta cell regeneration by glucose metabolism. Cell Metab, 2011. 13(4): p. 440-9.
56. Withers, D.J., et al., Disruption of IRS-2 causes type 2 diabetes in mice. Nature, 1998. 391(6670): p. 900-4.
57. Bernal-Mizrachi, E., et al., Islet beta cell expression of constitutively active Akt1/PKB alpha induces striking hypertrophy, hyperplasia, and hyperinsulinemia. J Clin Invest, 2001. 108(11): p. 1631-8.
58. Paris, M., et al., Specific and combined effects of insulin and glucose on functional pancreatic beta-cell mass in vivo in adult rats. Endocrinology, 2003. 144(6): p. 2717-27.
59. Lu, Y., et al., Amplification and overexpression of Hsa-miR-30b, Hsa-miR-30d and KHDRBS3 at 8q24.22-q24.23 in medulloblastoma. PLoS One, 2009. 4(7): p. e6159.
60. Wightman, B., I. Ha, and G. Ruvkun, Posttranscriptional regulation of the heterochronic gene lin-14 by lin-4 mediates temporal pattern formation in C. elegans. Cell, 1993. 75(5): p. 855-62.
61. Bartel, D.P., MicroRNAs: genomics, biogenesis, mechanism, and function. Cell, 2004. 116(2): p. 281-97.
62. Kozomara, A. and S. Griffiths-Jones, miRBase: annotating high confidence microRNAs using deep sequencing data. Nucleic Acids Res, 2014. 42(Database issue): p. D68-73.
63. Lewis, B.P., et al., Prediction of mammalian microRNA targets. Cell, 2003. 115(7): p. 787-98.
64. Lee, Y., et al., The nuclear RNase III Drosha initiates microRNA processing. Nature, 2003. 425(6956): p. 415-9.
65. Lund, E., et al., Nuclear export of microRNA precursors. Science, 2004. 303(5654): p. 95-8.
66. Bernstein, E., et al., Dicer is essential for mouse development. Nat Genet, 2003. 35(3): p. 215-7.
67. Schwarz, D.S., et al., Asymmetry in the assembly of the RNAi enzyme complex. Cell, 2003. 115(2): p. 199-208.
68. Wang, D., et al., Quantitative functions of Argonaute proteins in mammalian development. Genes Dev, 2012. 26(7): p. 693-704.
69. Fabian, M.R. and N. Sonenberg, The mechanics of miRNA-mediated gene silencing: a look under the hood of miRISC. Nat Struct Mol Biol, 2012. 19(6): p. 586-93.
70. Eulalio, A., et al., Deadenylation is a widespread effect of miRNA regulation. Rna-a Publication of the Rna Society, 2009. 15(1): p. 21-32.
71. Meijer, H.A., et al., Translational Repression and eIF4A2 Activity Are Critical for MicroRNA-Mediated Gene Regulation. Science, 2013. 340(6128): p. 82-85.
72. Winter, J., et al., Many roads to maturity: microRNA biogenesis pathways and their regulation. Nat Cell Biol, 2009. 11(3): p. 228-34.
73. Jordan, S.D., et al., Obesity-induced overexpression of miRNA-143 inhibits insulin-stimulated AKT activation and impairs glucose metabolism. Nat Cell Biol, 2011. 13(4): p. 434-46.
74. Kornfeld, J.W., et al., Obesity-induced overexpression of miR-802 impairs glucose metabolism through silencing of Hnf1b. Nature, 2013. 494(7435): p. 111-5.
75. Trajkovski, M., et al., MicroRNAs 103 and 107 regulate insulin sensitivity. Nature, 2011. 474(7353): p. 649-53.
76. Trajkovski, M., et al., MyomiR-133 regulates brown fat differentiation through Prdm16. Nat Cell Biol, 2012. 14(12): p. 1330-5.
77. Viswanathan, S.R., G.Q. Daley, and R.I. Gregory, Selective blockade of microRNA processing by Lin28. Science, 2008. 320(5872): p. 97-100.
78. Viswanathan, S.R. and G.Q. Daley, Lin28: A microRNA regulator with a macro role. Cell, 2010. 140(4): p. 445-9.
79. Frost, R.J. and E.N. Olson, Control of glucose homeostasis and insulin sensitivity by the Let-7 family of microRNAs. Proc Natl Acad Sci U S A, 2011. 108(52): p. 21075-80.
80. Zhu, H., et al., The Lin28/let-7 axis regulates glucose metabolism. Cell, 2011. 147(1): p. 81-94.
81. Poy, M.N., et al., A pancreatic islet-specific microRNA regulates insulin secretion. Nature, 2004. 432(7014): p. 226-30.
82. Kloosterman, W.P., et al., Targeted inhibition of miRNA maturation with morpholinos reveals a role for miR-375 in pancreatic islet development. PLoS Biol, 2007. 5(8): p. e203.
83. Wang, Y., et al., MicroRNA-7 regulates the mTOR pathway and proliferation in adult pancreatic beta-cells. Diabetes, 2013. 62(3): p. 887-95.
84. Kredo-Russo, S., et al., Regulation of pancreatic microRNA-7 expression. Exp Diabetes Res, 2012. 2012: p. 695214.
85. Latreille, M., et al., MicroRNA-7a regulates pancreatic beta cell function. J Clin Invest, 2014. 124(6): p. 2722-35.
86. Plaisance, V., et al., MicroRNA-9 controls the expression of Granuphilin/Slp4 and the secretory response of insulin-producing cells. J Biol Chem, 2006. 281(37): p. 26932-42.
87. Soni, M.S., et al., Downregulation of carnitine acyl-carnitine translocase by miRNAs 132 and 212 amplifies glucose-stimulated insulin secretion. Diabetes, 2014. 63(11): p. 3805-14.
88. Wijesekara, N., et al., miR-33a modulates ABCA1 expression, cholesterol accumulation, and insulin secretion in pancreatic islets. Diabetes, 2012. 61(3): p. 653-8.
89. Kim, J.W., et al., miRNA-30a-5p-mediated silencing of Beta2/NeuroD expression is an important initial event of glucotoxicity-induced beta cell dysfunction in rodent models. Diabetologia, 2013. 56(4): p. 847-55.
90. Zhao, X., et al., MicroRNA-30d induces insulin transcription factor MafA and insulin production by targeting mitogen-activated protein 4 kinase 4 (MAP4K4) in pancreatic beta-cells. J Biol Chem, 2012. 287(37): p. 31155-64.
91. Bouzakri, K. and J.R. Zierath, MAP4K4 gene silencing in human skeletal muscle prevents tumor necrosis factor-alpha-induced insulin resistance. J Biol Chem, 2007. 282(11): p. 7783-9.
92. Andrali, S.S., et al., Glucose regulation of insulin gene expression in pancreatic beta-cells. Biochem J, 2008. 415(1): p. 1-10.
93. Zhang, C., et al., MafA is a key regulator of glucose-stimulated insulin secretion. Mol Cell Biol, 2005. 25(12): p. 4969-76.
94. Yang, X., et al., mir-30d Regulates multiple genes in the autophagy pathway and impairs autophagy process in human cancer cells. Biochem Biophys Res Commun, 2013. 431(3): p. 617-22.
95. Zhang, Y., et al., Regulation of autophagy by miR-30d impacts sensitivity of anaplastic thyroid carcinoma to cisplatin. Biochem Pharmacol, 2014. 87(4): p. 562-70.
96. Wu, C., et al., MiR-30d induces apoptosis and is regulated by the Akt/FOXO pathway in renal cell carcinoma. Cell Signal, 2013. 25(5): p. 1212-21.
97. Belgardt, B.F., et al., The microRNA-200 family regulates pancreatic beta cell survival in type 2 diabetes. Nat Med, 2015. 21(6): p. 619-27.
98. Song, B., et al., Chop deletion reduces oxidative stress, improves beta cell function, and promotes cell survival in multiple mouse models of diabetes. J Clin Invest, 2008. 118(10): p. 3378-89.
99. Barlow, A.D., M.L. Nicholson, and T.P. Herbert, Evidence for rapamycin toxicity in pancreatic beta-cells and a review of the underlying molecular mechanisms. Diabetes, 2013. 62(8): p. 2674-82.
100. Robertson, R.P., et al., Beta-cell glucose toxicity, lipotoxicity, and chronic oxidative stress in type 2 diabetes. Diabetes, 2004. 53 Suppl 1: p. S119-24.
101. Volchuk, A. and D. Ron, The endoplasmic reticulum stress response in the pancreatic beta-cell. Diabetes Obes Metab, 2010. 12 Suppl 2: p. 48-57.
102. Friedman, R.C., et al., Most mammalian mRNAs are conserved targets of microRNAs. Genome Res, 2009. 19(1): p. 92-105.
103. Kameswaran, V., et al., Epigenetic regulation of the DLK1-MEG3 microRNA cluster in human type 2 diabetic islets. Cell Metab, 2014. 19(1): p. 135-45.
104. Xu, G., et al., Thioredoxin-interacting protein regulates insulin transcription through microRNA-204. Nat Med, 2013. 19(9): p. 1141-6.
105. Vidigal, J.A. and A. Ventura, The biological functions of miRNAs: lessons from in vivo studies. Trends Cell Biol, 2015. 25(3): p. 137-47.
106. Brissova, M., et al., Intraislet endothelial cells contribute to revascularization of transplanted pancreatic islets. Diabetes, 2004. 53(5): p. 1318-25.
107. Salaverria, I., et al., Translocations activating IRF4 identify a subtype of germinal center-derived B-cell lymphoma affecting predominantly children and young adults. Blood, 2011. 118(1): p. 139-47.
108. Livak, K.J. and T.D. Schmittgen, Analysis of relative gene expression data using real-time quantitative PCR and the 2(-Delta Delta C(T)) Method. Methods, 2001. 25(4): p. 402-8.
109. Davidson, A.E., et al., Autosomal-Dominant Corneal Endothelial Dystrophies CHED1 and PPCD1 Are Allelic Disorders Caused by Non-coding Mutations in the Promoter of OVOL2. Am J Hum Genet, 2016. 98(1): p. 75-89.
110. Kos, C.H., Cre/loxP system for generating tissue-specific knockout mouse models. Nutr Rev, 2004. 62(6 Pt 1): p. 243-6.
111. Parsons, J.A., T.C. Brelje, and R.L. Sorenson, Adaptation of islets of Langerhans to pregnancy: increased islet cell proliferation and insulin secretion correlates with the onset of placental lactogen secretion. Endocrinology, 1992. 130(3): p. 1459-66.
112. Alnemri, E.S., et al., Human ICE/CED-3 protease nomenclature. Cell, 1996. 87(2): p. 171.
113. Salvesen, G.S., Caspases: opening the boxes and interpreting the arrows. Cell Death Differ, 2002. 9(1): p. 3-5.
114. Mitra, A., et al., Dual mTOR Inhibition Is Required to Prevent TGF-beta-Mediated Fibrosis: Implications for Scleroderma. J Invest Dermatol, 2015. 135(11): p. 2873-6.
115. Lipton, J.O. and M. Sahin, The neurology of mTOR. Neuron, 2014. 84(2): p. 275-91.
116. Chen, D., et al., MicroRNA-30d-5p inhibits tumour cell proliferation and motility by directly targeting CCNE2 in non-small cell lung cancer. Cancer Lett, 2015. 362(2): p. 208-17.
117. Deng, J., et al., The loss of miR-26a-mediated post-transcriptional regulation of cyclin E2 in pancreatic cancer cell proliferation and decreased patient survival. PLoS One, 2013. 8(10): p. e76450.
118. Liang, W., et al., Down-regulation of SOSTDC1 promotes thyroid cancer cell proliferation via regulating cyclin A2 and cyclin E2. Oncotarget, 2015. 6(31): p. 31780-91.
119. Dapas, B., et al., Role of E2F1-cyclin E1-cyclin E2 circuit in human coronary smooth muscle cell proliferation and therapeutic potential of its downregulation by siRNAs. Mol Med, 2009. 15(9-10): p. 297-306.
120. Bocharov, E.V., et al., Unique dimeric structure of BNip3 transmembrane domain suggests membrane permeabilization as a cell death trigger. J Biol Chem, 2007. 282(22): p. 16256-66.
121. Kahn, S.E., Clinical review 135: The importance of beta-cell failure in the development and progression of type 2 diabetes. J Clin Endocrinol Metab, 2001. 86(9): p. 4047-58.
122. van de Bunt, M., et al., The miRNA profile of human pancreatic islets and beta-cells and relationship to type 2 diabetes pathogenesis. PLoS One, 2013. 8(1): p. e55272.
123. Shantikumar, S., A. Caporali, and C. Emanueli, Role of microRNAs in diabetes and its cardiovascular complications. Cardiovasc Res, 2012. 93(4): p. 583-93.
124. Zampetaki, A., et al., Plasma microRNA profiling reveals loss of endothelial miR-126 and other microRNAs in type 2 diabetes. Circ Res, 2010. 107(6): p. 810-7.
125. Scharfmann, R., et al., Development of a conditionally immortalized human pancreatic beta cell line. J Clin Invest, 2014. 124(5): p. 2087-98.
126. Burton, T.R. and S.B. Gibson, The role of Bcl-2 family member BNIP3 in cell death and disease: NIPping at the heels of cell death. Cell Death Differ, 2009. 16(4): p. 515-23.
127. Shaida, N., et al., Expression of BNIP3 correlates with hypoxia-inducible factor (HIF)-1alpha, HIF-2alpha and the androgen receptor in prostate cancer and is regulated directly by hypoxia but not androgens in cell lines. Prostate, 2008. 68(3): p. 336-43.
128. Burton, T.R., et al., The pro-cell death Bcl-2 family member, BNIP3, is localized to the nucleus of human glial cells: Implications for glioblastoma multiforme tumor cell survival under hypoxia. Int J Cancer, 2006. 118(7): p. 1660-9.
129. Tan, E.Y., et al., BNIP3 as a progression marker in primary human breast cancer; opposing functions in in situ versus invasive cancer. Clin Cancer Res, 2007. 13(2 Pt 1): p. 467-74.
130. Giatromanolaki, A., et al., BNIP3 expression is linked with hypoxia-regulated protein expression and with poor prognosis in non-small cell lung cancer. Clin Cancer Res, 2004. 10(16): p. 5566-71.
131. Pitts, K.R., et al., Differentially regulated functional gene clusters identified during ischemia and reperfusion in isolated cardiac myocytes using coverslip hypoxia. J Pharmacol Toxicol Methods, 2008. 57(1): p. 42-51.
132. Regula, K.M., K. Ens, and L.A. Kirshenbaum, Inducible expression of BNIP3 provokes mitochondrial defects and hypoxia-mediated cell death of ventricular myocytes. Circ Res, 2002. 91(3): p. 226-31.
133. Yang, X.J., et al., Mir-30d increases intracellular survival of Helicobacter pylori through inhibition of autophagy pathway. World J Gastroenterol, 2016. 22(15): p. 3978-91.
134. Lee, R.C., R.L. Feinbaum, and V. Ambros, The C. elegans heterochronic gene lin-4 encodes small RNAs with antisense complementarity to lin-14. Cell, 1993. 75(5): p. 843-54.
135. Reinhart, B.J., et al., The 21-nucleotide let-7 RNA regulates developmental timing in Caenorhabditis elegans. Nature, 2000. 403(6772): p. 901-6.
136. Brennecke, J., et al., Principles of microRNA-target recognition. PLoS Biol, 2005. 3(3): p. e85.
137. Lytle, J.R., T.A. Yario, and J.A. Steitz, Target mRNAs are repressed as efficiently by microRNA-binding sites in the 5′ UTR as in the 3′ UTR. Proc Natl Acad Sci U S A, 2007. 104(23): p. 9667-72.
138. Ding, J., et al., Genome-wide search for miRNA-target interactions in Arabidopsis thaliana with an integrated approach. BMC Genomics, 2012. 13 Suppl 3: p. S3.
139. Carthew, R.W. and E.J. Sontheimer, Origins and Mechanisms of miRNAs and siRNAs. Cell, 2009. 136(4): p. 642-55.
140. Kim, V.N., J. Han, and M.C. Siomi, Biogenesis of small RNAs in animals. Nat Rev Mol Cell Biol, 2009. 10(2): p. 126-39.
141. Ruby, J.G., et al., Large-scale sequencing reveals 21U-RNAs and additional microRNAs and endogenous siRNAs in C. elegans. Cell, 2006. 127(6): p. 1193-207.
142. Kozomara, A. and S. Griffiths-Jones, miRBase: integrating microRNA annotation and deep-sequencing data. Nucleic Acids Res, 2011. 39(Database issue): p. D152-7.
143. Gardner, P.P., et al., Rfam: Wikipedia, clans and the “decimal” release. Nucleic Acids Res, 2011. 39(Database issue): p. D141-5.
144. VanGuilder, H.D., K.E. Vrana, and W.M. Freeman, Twenty-five years of quantitative PCR for gene expression analysis. Biotechniques, 2008. 44(5): p. 619-26.
145. Towbin, H., T. Staehelin, and J. Gordon, Electrophoretic transfer of proteins from polyacrylamide gels to nitrocellulose sheets: procedure and some applications. Proc Natl Acad Sci U S A, 1979. 76(9): p. 4350-4.
146. Anon, Rapid amplification of 5′ complementary DNA ends (5′ RACE). Nat Methods, 2005. 2(8): p. 629-30.
147. Kuhn, D.E., et al., Experimental validation of miRNA targets. Methods, 2008. 44(1): p. 47-54.
148. Baek, D., et al., The impact of microRNAs on protein output. Nature, 2008. 455(7209): p. 64-71.
149. Hutvagner, G., et al., Sequence-specific inhibition of small RNA function. PLoS Biol, 2004. 2(4): p. E98.
150. Yan, J., et al., Effective small RNA destruction by the expression of a short tandem target mimic in Arabidopsis. Plant Cell, 2012. 24(2): p. 415-27.
151. Kim, Y.K., et al., TALEN-based knockout library for human microRNAs. Nat Struct Mol Biol, 2013. 20(12): p. 1458-64.
152. Kim, Y.G., J. Cha, and S. Chandrasegaran, Hybrid restriction enzymes: zinc finger fusions to Fok I cleavage domain. Proc Natl Acad Sci U S A, 1996. 93(3): p. 1156-60.
153. Barrangou, R., et al., CRISPR provides acquired resistance against viruses in prokaryotes. Science, 2007. 315(5819): p. 1709-12.
154. Barrangou, R. and L.A. Marraffini, CRISPR-Cas systems: Prokaryotes upgrade to adaptive immunity. Mol Cell, 2014. 54(2): p. 234-44.
155. Bondy-Denomy, J. and A.R. Davidson, To acquire or resist: the complex biological effects of CRISPR-Cas systems. Trends Microbiol, 2014. 22(4): p. 218-25.
156. Gasiunas, G., T. Sinkunas, and V. Siksnys, Molecular mechanisms of CRISPR-mediated microbial immunity. Cell Mol Life Sci, 2014. 71(3): p. 449-65.
157. Charpentier, E. and L.A. Marraffini, Harnessing CRISPR-Cas9 immunity for genetic engineering. Curr Opin Microbiol, 2014. 19: p. 114-9.
158. Boettcher, M. and M.T. McManus, Choosing the Right Tool for the Job: RNAi, TALEN, or CRISPR. Mol Cell, 2015. 58(4): p. 575-85.
159. Chang, H., et al., CRISPR/cas9, a novel genomic tool to knock down microRNA in vitro and in vivo. Sci Rep, 2016. 6: p. 22312.
160. Zhao, Y., et al., Sequence-specific inhibition of microRNA via CRISPR/CRISPRi system. Sci Rep, 2014. 4: p. 3943.
161. Ho, T.T., et al., Targeting non-coding RNAs with the CRISPR/Cas9 system in human cell lines. Nucleic Acids Res, 2015. 43(3): p. e17.
162. Jiang, Q., et al., Small indels induced by CRISPR/Cas9 in the 5′ region of microRNA lead to its depletion and Drosha processing retardance. RNA Biol, 2014. 11(10): p. 1243-9.
163. Cardozo, A.K., et al., IL-1beta and IFN-gamma induce the expression of diverse chemokines and IL-15 in human and rat pancreatic islet cells, and in islets from pre-diabetic NOD mice. Diabetologia, 2003. 46(2): p. 255-66.
164. Nicoletti, F., et al., Serum concentrations of the interferon-gamma-inducible chemokine IP-10/CXCL10 are augmented in both newly diagnosed Type I diabetes mellitus patients and subjects at risk of developing the disease. Diabetologia, 2002. 45(8): p. 1107-10.
165. Xu, H., et al., [Elevated plasma concentration of IP-10 in patients with type 2 diabetes mellitus]. Nihon Jinzo Gakkai Shi, 2005. 47(5): p. 524-30.
166. Paroni, F., E. Domsgen, and K. Maedler, CXCL10- a path to beta-cell death. Islets, 2009. 1(3): p. 256-9.
167. Schulthess, F.T., et al., CXCL10 impairs beta cell function and viability in diabetes through TLR4 signaling. Cell Metab, 2009. 9(2): p. 125-39.
168. Shigihara, T., et al., CXCL10 DNA vaccination prevents spontaneous diabetes through enhanced beta cell proliferation in NOD mice. J Immunol, 2005. 175(12): p. 8401-8.
169. Furukawa, Y., et al., Polymorphisms in the IDE-KIF11-HHEX gene locus are reproducibly associated with type 2 diabetes in a Japanese population. J Clin Endocrinol Metab, 2008. 93(1): p. 310-4.
170. Hu, C., et al., PPARG, KCNJ11, CDKAL1, CDKN2A-CDKN2B, IDE-KIF11-HHEX, IGF2BP2 and SLC30A8 are associated with type 2 diabetes in a Chinese population. PLoS One, 2009. 4(10): p. e7643.
171. Qian, Y., et al., Genetic variants of IDE-KIF11-HHEX at 10q23.33 associated with type 2 diabetes risk: a fine-mapping study in Chinese population. PLoS One, 2012. 7(4): p. e35060.
172. Cavallari, J.F., et al., Muramyl Dipeptide-Based Postbiotics Mitigate Obesity-Induced Insulin Resistance via IRF4. Cell Metab, 2017. 25(5): p. 1063-1074 e3.
173. Bhat, U.G. and K. Watanabe, Serpine1 Mediates Porphyromonas gingivalis Induced Insulin Secretion in the Pancreatic Beta Cell Line MIN6. J Oral Biol (Northborough), 2015. 2(2).
174. Pavon, M.A., et al., Enhanced cell migration and apoptosis resistance may underlie the association between high SERPINE1 expression and poor outcome in head and neck carcinoma patients. Oncotarget, 2015. 6(30): p. 29016-33.
175. Benavente, C.A., et al., Chromatin remodelers HELLS and UHRF1 mediate the epigenetic deregulation of genes that drive retinoblastoma tumor progression. Oncotarget, 2014. 5(20): p. 9594-608.
176. Chen, D., et al., TOP2A, HELLS, ATAD2, and TET3 Are Novel Prognostic Markers in Renal Cell Carcinoma. Urology, 2017. 102: p. 265 e1-265 e7.
177. Ye, L., et al., Upregulation of E2F8 promotes cell proliferation and tumorigenicity in breast cancer by modulating G1/S phase transition. Oncotarget, 2016. 7(17): p. 23757-71.
178. Park, S.A., et al., E2F8 as a Novel Therapeutic Target for Lung Cancer. J Natl Cancer Inst, 2015. 107(9).
179. Sun, J., et al., E2F8, a direct target of miR-144, promotes papillary thyroid cancer progression via regulating cell cycle. J Exp Clin Cancer Res, 2017. 36(1): p. 40.
180. Zhang, P., et al., EZH2-miR-30d-KPNB1 pathway regulates malignant peripheral nerve sheath tumour cell survival and tumourigenesis. J Pathol, 2014. 232(3): p. 308-18.
181. Kobayashi, N., et al., Identification of miR-30d as a novel prognostic maker of prostate cancer. Oncotarget, 2012. 3(11): p. 1455-71.
182. Esposito, F., et al., Down-regulation of the miR-25 and miR-30d contributes to the development of anaplastic thyroid carcinoma targeting the polycomb protein EZH2. J Clin Endocrinol Metab, 2012. 97(5): p. E710-8.
183. Bushati, N. and S.M. Cohen, microRNA functions. Annu Rev Cell Dev Biol, 2007. 23: p. 175-205.
184. Garcia, D., A miRacle in plant development: role of microRNAs in cell differentiation and patterning. Semin Cell Dev Biol, 2008. 19(6): p. 586-95.
185. Reichel, M., J. Li, and A.A. Millar, Silencing the silencer: strategies to inhibit microRNA activity. Biotechnol Lett, 2011. 33(7): p. 1285-92.
186. Allen, R.S., et al., MicroR159 regulation of most conserved targets in Arabidopsis has negligible phenotypic effects. Silence, 2010. 1(1): p. 18.
187. Sieber, P., et al., Redundancy and specialization among plant microRNAs: role of the MIR164 family in developmental robustness. Development, 2007. 134(6): p. 1051-60.
188. Orom, U.A., S. Kauppinen, and A.H. Lund, LNA-modified oligonucleotides mediate specific inhibition of microRNA function. Gene, 2006. 372: p. 137-41.
189. Davis, S., et al., Improved targeting of miRNA with antisense oligonucleotides. Nucleic Acids Res, 2006. 34(8): p. 2294-304.
190. Vaistij, F.E., et al., Suppression of microRNA accumulation via RNA interference in Arabidopsis thaliana. Plant Mol Biol, 2010. 73(4-5): p. 391-7.
191. Todesco, M., et al., A collection of target mimics for comprehensive analysis of microRNA function in Arabidopsis thaliana. PLoS Genet, 2010. 6(7): p. e1001031.
192. Tang, G., et al., Construction of short tandem target mimic (STTM) to block the functions of plant and animal microRNAs. Methods, 2012. 58(2): p. 118-25.
193. Feil, S., N. Valtcheva, and R. Feil, Inducible Cre mice. Methods Mol Biol, 2009. 530: p. 343-63.
194. El Ouaamari, A., et al., miR-375 targets 3′-phosphoinositide-dependent protein kinase-1 and regulates glucose-induced biological responses in pancreatic beta-cells. Diabetes, 2008. 57(10): p. 2708-17.
195. Magnuson, M.A. and A.B. Osipovich, Pancreas-specific Cre driver lines and considerations for their prudent use. Cell Metab, 2013. 18(1): p. 9-20.
196. Ray, M.K., et al., Development of a transgenic mouse model using rat insulin promoter to drive the expression of CRE recombinase in a tissue-specific manner. Int J Pancreatol, 1999. 25(3): p. 157-63.
197. Song, J., et al., Brain expression of Cre recombinase driven by pancreas-specific promoters. Genesis, 2010. 48(11): p. 628-34.
198. Wicksteed, B., et al., Conditional gene targeting in mouse pancreatic ss-Cells: analysis of ectopic Cre transgene expression in the brain. Diabetes, 2010. 59(12): p. 3090-8.
199. Feil, R., et al., Ligand-activated site-specific recombination in mice. Proc Natl Acad Sci U S A, 1996. 93(20): p. 10887-90.
200. Oropeza, D., et al., Phenotypic Characterization of MIP-CreERT1Lphi Mice With Transgene-Driven Islet Expression of Human Growth Hormone. Diabetes, 2015. 64(11): p. 3798-807.
201. Surwit, R.S., et al., Diet-induced type II diabetes in C57BL/6J mice. Diabetes, 1988. 37(9): p. 1163-7.
202. Galipeau, D., S. Verma, and J.H. McNeill, Female rats are protected against fructose-induced changes in metabolism and blood pressure. Am J Physiol Heart Circ Physiol, 2002. 283(6): p. H2478-84.
203. Hevener, A., et al., Female rats do not exhibit free fatty acid-induced insulin resistance. Diabetes, 2002. 51(6): p. 1907-12.
204. Galipeau, D.M., L. Yao, and J.H. McNeill, Relationship among hyperinsulinemia, insulin resistance, and hypertension is dependent on sex. Am J Physiol Heart Circ Physiol, 2002. 283(2): p. H562-7.
205. Qi, L., et al., Heterogeneity of neuroblastoma cell lines in insulin-like growth factor 1 receptor/Akt pathway-mediated cell proliferative responses. Cancer Sci, 2013. 104(9): p. 1162-71.
Appendix
A. List of all 1422 differently expressed genes in miR-30d KO cell line from HiSeq analysis
| Gene | Description | Fold Change |
| Sst | somatostatin | 68.76011249 |
| Serpinb1a | serine (or cysteine) peptidase inhibitor, clade B, member 1a | 12.24745427 |
| Dppa4 | developmental pluripotency associated 4 | 10.61961825 |
| Serpinb1c | serine (or cysteine) peptidase inhibitor, clade B, member 1c | 10.43971194 |
| Gm14139 | predicted gene 14139 | 8.841554237 |
| Fam163a | family with sequence similarity 163, member A | 8.769958404 |
| Gip | gastric inhibitory polypeptide | 7.439058279 |
| 5830473C10Rik | RIKEN cDNA 5830473C10 gene | 7.203260105 |
| S100a6 | S100 calcium binding protein A6 (calcyclin) | 6.959820026 |
| Tspan8 | tetraspanin 8 | 6.037159846 |
| Vdr | vitamin D receptor | 5.570705312 |
| Gimap6 | GTPase, IMAP family member 6 | 5.275215386 |
| Mybpc1 | myosin binding protein C, slow-type | 5.163788817 |
| Rxfp2 | relaxin/insulin-like family peptide receptor 2 | 5.022236613 |
| Pla2g5 | phospholipase A2, group V | 4.912985564 |
| Tfpi | tissue factor pathway inhibitor | 4.911827857 |
| Ppy | pancreatic polypeptide | 4.880875661 |
| Slfn3 | schlafen 3 | 4.811644315 |
| Sparcl1 | SPARC-like 1 | 4.767986001 |
| Hfm1 | HFM1, ATP-dependent DNA helicase homolog (S. cerevisiae) | 4.712785437 |
| Mesp1 | mesoderm posterior 1 | 4.698303789 |
| Abca13 | ATP-binding cassette, sub-family A (ABC1), member 13 | 4.66944149 |
| Igfbp5 | insulin-like growth factor binding protein 5 | 4.668794213 |
| Ulbp1 | UL16 binding protein 1 | 4.647452114 |
| Rhox2h | reproductive homeobox 2H | 4.619414484 |
| Ggt6 | gamma-glutamyltransferase 6 | 4.571539229 |
| Egr2 | early growth response 2 | 4.570620384 |
| Clrn3 | clarin 3 | 4.48149473 |
| Adrb3 | adrenergic receptor, beta 3 | 4.446129594 |
| Cd19 | CD19 antigen | 4.396300494 |
| Ifih1 | interferon induced with helicase C domain 1 | 4.35650138 |
| Plau | plasminogen activator, urokinase | 4.268265739 |
| Sult1d1 | sulfotransferase family 1D, member 1 | 4.213911456 |
| Cyp26b1 | cytochrome P450, family 26, subfamily b, polypeptide 1 | 4.162845456 |
| Enpp3 | ectonucleotide pyrophosphatase/phosphodiesterase 3 | 4.093514484 |
| Hdgfrp3 | hepatoma-derived growth factor, related protein 3 | 4.009243384 |
| Ppp1r27 | protein phosphatase 1, regulatory subunit 27 | 3.960273315 |
| Rbp2 | retinol binding protein 2, cellular | 3.940585489 |
| Slc6a19 | solute carrier family 6 (neurotransmitter transporter), member 19 | 3.835620538 |
| Rhox2g | reproductive homeobox 2G | 3.810393519 |
| Aldh1a3 | aldehyde dehydrogenase family 1, subfamily A3 | 3.799501112 |
| Olfr1372-ps1 | olfactory receptor 1372, pseudogene 1 | 3.773857636 |
| Arhgap36 | Rho GTPase activating protein 36 | 3.740108181 |
| Mug1 | murinoglobulin 1 | 3.725773573 |
| Tns1 | tensin 1 | 3.715406336 |
| AI467606 | expressed sequence AI467606 | 3.653122165 |
| Spn | sialophorin | 3.592180887 |
| A730085A09Rik | KN motif and ankyrin repeat domains 4, opposite strand | 3.591757627 |
| Gpr133 | adhesion G protein-coupled receptor D1 | 3.590114856 |
| Fev | FEV (ETS oncogene family) | 3.57819001 |
| Acot5 | acyl-CoA thioesterase 5 | 3.540173336 |
| Fbxw15 | F-box and WD-40 domain protein 15 | 3.501419696 |
| Coch | coagulation factor C homolog (Limulus polyphemus) | 3.500157884 |
| Trim12c | tripartite motif-containing 12C | 3.464098613 |
| Sectm1a | secreted and transmembrane 1A | 3.459419572 |
| Slfn4 | schlafen 4 | 3.455321614 |
| C530028O21Rik | PILR alpha associated neural protein | 3.438787578 |
| 4930502E18Rik | RIKEN cDNA 4930502E18 gene | 3.376199136 |
| Stat4 | signal transducer and activator of transcription 4 | 3.367971663 |
| Cat | catalase | 3.356179784 |
| Ppp1r1b | protein phosphatase 1, regulatory (inhibitor) subunit 1B | 3.346748175 |
| Chrna3 | cholinergic receptor, nicotinic, alpha polypeptide 3 | 3.343988764 |
| Zfp811 | zinc finger protein 811 | 3.311970907 |
| Nr1h3 | nuclear receptor subfamily 1, group H, member 3 | 3.277350564 |
| Usp25 | ubiquitin specific peptidase 25 | 3.266940093 |
| 9130024F11Rik | RIKEN cDNA 9130024F11 gene | 3.262934439 |
| Plk2 | polo-like kinase 2 | 3.249077147 |
| Tle6 | transducin-like enhancer of split 6, homolog of Drosophila E(spl) | 3.193326349 |
| 2010005H15Rik | RIKEN cDNA 2010005H15 gene | 3.184197893 |
| Gm11549 | predicted gene 11549 | 3.174259334 |
| 4930555B11Rik | RIKEN cDNA 4930555B11 gene | 3.144781975 |
| Fndc5 | fibronectin type III domain containing 5 | 3.107533621 |
| Msn | moesin | 3.10464863 |
| Mfap5 | microfibrillar associated protein 5 | 3.101099895 |
| Gm1965 | predicted gene 1965 | 3.098585978 |
| 6430548G04 | dopamine beta hydroxylase, opposite strand | 3.074006041 |
| Dock8 | dedicator of cytokinesis 8 | 3.072621372 |
| Spink4 | serine peptidase inhibitor, Kazal type 4 | 3.049494259 |
| Prlhr | prolactin releasing hormone receptor | 3.026939836 |
| Dlk1 | delta-like 1 homolog (Drosophila) | 3.022935088 |
| Cd209c | CD209c antigen | 3.017220221 |
| Il4 | interleukin 4 | 3.016613783 |
| St6galnac2 | ST6 (alpha-N-acetyl-neuraminyl-2,3-beta-galactosyl-1,3)-N-acetylgalactosaminide alpha-2,6-sialyltransferase 2 | 3.001887685 |
| Serinc2 | serine incorporator 2 | 2.964070988 |
| Fetub | fetuin beta | 2.957175775 |
| Psmb8 | proteasome (prosome, macropain) subunit, beta type 8 (large multifunctional peptidase 7) | 2.907582243 |
| Nqo1 | NAD(P)H dehydrogenase, quinone 1 | 2.899170137 |
| Kcnq2 | potassium voltage-gated channel, subfamily Q, member 2 | 2.890101178 |
| 1810011O10Rik | RIKEN cDNA 1810011O10 gene | 2.868646107 |
| Psd4 | pleckstrin and Sec7 domain containing 4 | 2.866559053 |
| Neurod4 | neurogenic differentiation 4 | 2.850075228 |
| Aqp3 | aquaporin 3 | 2.844115393 |
| Npl | N-acetylneuraminate pyruvate lyase | 2.830761102 |
| Csn3 | casein kappa | 2.807410441 |
| Slfn8 | schlafen 8 | 2.799404569 |
| Sult1c2 | sulfotransferase family, cytosolic, 1C, member 2 | 2.799171731 |
| Cldn2 | claudin 2 | 2.790879818 |
| Syt16 | synaptotagmin XVI | 2.774369609 |
| Fam151a | family with sequence simliarity 151, member A | 2.76266379 |
| Syde2 | synapse defective 1, Rho GTPase, homolog 2 (C. elegans) | 2.759238186 |
| Samd9l | sterile alpha motif domain containing 9-like | 2.758473269 |
| Nlrp10 | NLR family, pyrin domain containing 10 | 2.744798038 |
| Fmnl2 | formin-like 2 | 2.739817883 |
| Rasl10b | RAS-like, family 10, member B | 2.734031756 |
| Klra5 | killer cell lectin-like receptor, subfamily A, member 5 | 2.731891147 |
| Col28a1 | collagen, type XXVIII, alpha 1 | 2.722986821 |
| Fosb | FBJ osteosarcoma oncogene B | 2.722062137 |
| Cox7b2 | cytochrome c oxidase subunit VIIb2 | 2.718310014 |
| Flrt3 | fibronectin leucine rich transmembrane protein 3 | 2.716369992 |
| Oasl2 | 2′-5′ oligoadenylate synthetase-like 2 | 2.713415535 |
| Dsp | desmoplakin | 2.709036816 |
| Ahsg | alpha-2-HS-glycoprotein | 2.699140357 |
| Cd34 | CD34 antigen | 2.695401147 |
| Slfn9 | schlafen 9 | 2.694784675 |
| Adamtsl2 | ADAMTS-like 2 | 2.684605312 |
| Mndal | myeloid nuclear differentiation antigen like | 2.68274513 |
| Anpep | alanyl (membrane) aminopeptidase | 2.65663495 |
| 5730559C18Rik | RIKEN cDNA 5730559C18 gene | 2.654978172 |
| Uba7 | ubiquitin-like modifier activating enzyme 7 | 2.633606862 |
| Clvs2 | clavesin 2 | 2.615777809 |
| Spsb1 | splA/ryanodine receptor domain and SOCS box containing 1 | 2.608752359 |
| Apol9a | apolipoprotein L 9a | 2.598970035 |
| Pmp22 | peripheral myelin protein 22 | 2.582162867 |
| Cyp4x1 | cytochrome P450, family 4, subfamily x, polypeptide 1 | 2.5664604 |
| Cyp4v3 | cytochrome P450, family 4, subfamily v, polypeptide 3 | 2.559372256 |
| Anks4b | ankyrin repeat and sterile alpha motif domain containing 4B | 2.55839673 |
| Zeb2 | zinc finger E-box binding homeobox 2 | 2.534989901 |
| Sh3bgrl2 | SH3 domain binding glutamic acid-rich protein like 2 | 2.530881571 |
| Ralyl | RALY RNA binding protein-like | 2.527410492 |
| BC028528 | cDNA sequence BC028528 | 2.5189282 |
| Pdzd3 | PDZ domain containing 3 | 2.517811016 |
| Gm16576 | predicted gene 16576 | 2.493254234 |
| Elovl3 | elongation of very long chain fatty acids (FEN1/Elo2, SUR4/Elo3, yeast)-like 3 | 2.49021447 |
| Casp1 | caspase 1 | 2.487471507 |
| Tmprss2 | transmembrane protease, serine 2 | 2.486506151 |
| Gfra3 | glial cell line derived neurotrophic factor family receptor alpha 3 | 2.484611007 |
| BC021767 | cingulin pseudogene | 2.482682891 |
| Fgfr1 | fibroblast growth factor receptor 1 | 2.473356159 |
| Mest | mesoderm specific transcript | 2.471967884 |
| Vwf | Von Willebrand factor homolog | 2.463261854 |
| Slc14a2 | solute carrier family 14 (urea transporter), member 2 | 2.460821478 |
| Nfatc1 | nuclear factor of activated T cells, cytoplasmic, calcineurin dependent 1 | 2.456135239 |
| Fmnl1 | formin-like 1 | 2.448044868 |
| Gm10578 | predicted gene 10578 | 2.438425677 |
| Tdh | L-threonine dehydrogenase | 2.437749696 |
| Cxcr4 | chemokine (C-X-C motif) receptor 4 | 2.42749782 |
| Vwa5a | von Willebrand factor A domain containing 5A | 2.417490131 |
| Wscd1 | WSC domain containing 1 | 2.416652438 |
| Crhbp | corticotropin releasing hormone binding protein | 2.395737764 |
| Mfi2 | antigen p97 (melanoma associated) identified by monoclonal antibodies 133.2 and 96.5 | 2.389286735 |
| 4930519F09Rik | pyruvate dehydrogenase E1 alpha 1 pseudogene | 2.388955532 |
| Car8 | carbonic anhydrase 8 | 2.380822391 |
| Slc30a3 | solute carrier family 30 (zinc transporter), member 3 | 2.371072867 |
| Gsto1 | glutathione S-transferase omega 1 | 2.365491538 |
| Gbp7 | guanylate binding protein 7 | 2.343687146 |
| Pou2f2 | POU domain, class 2, transcription factor 2 | 2.337246666 |
| Ceacam10 | carcinoembryonic antigen-related cell adhesion molecule 10 | 2.334736928 |
| Fam154b | stablizer of axonemal microtubules 2 | 2.334526556 |
| Enpp1 | ectonucleotide pyrophosphatase/phosphodiesterase 1 | 2.329402587 |
| Gm12522 | predicted gene 12522 | 2.319831468 |
| Ccnjl | cyclin J-like | 2.316569555 |
| Slc2a2 | solute carrier family 2 (facilitated glucose transporter), member 2 | 2.305117034 |
| Fos | FBJ osteosarcoma oncogene | 2.30438217 |
| Rab19 | RAB19, member RAS oncogene family | 2.304350224 |
| Cib3 | calcium and integrin binding family member 3 | 2.303791253 |
| Tm6sf1 | transmembrane 6 superfamily member 1 | 2.299005632 |
| Cxcl10 | chemokine (C-X-C motif) ligand 10 | 2.296441448 |
| Frmpd4 | FERM and PDZ domain containing 4 | 2.295661612 |
| Ccno | cyclin O | 2.28613405 |
| Csmd3 | CUB and Sushi multiple domains 3 | 2.286070666 |
| Satb2 | special AT-rich sequence binding protein 2 | 2.272090027 |
| Slc38a8 | solute carrier family 38, member 8 | 2.268769432 |
| Capg | capping protein (actin filament), gelsolin-like | 2.264213498 |
| 2310008N11Rik | RIKEN cDNA 2310008N11 gene | 2.26255051 |
| Arl5c | ADP-ribosylation factor-like 5C | 2.257365452 |
| Fndc1 | fibronectin type III domain containing 1 | 2.256943026 |
| Gpr124 | adhesion G protein-coupled receptor A3 | 2.252098613 |
| Irgm2 | immunity-related GTPase family M member 2 | 2.246781766 |
| Sgcd | sarcoglycan, delta (dystrophin-associated glycoprotein) | 2.234063201 |
| Slc25a13 | solute carrier family 25 (mitochondrial carrier, adenine nucleotide translocator), member 13 | 2.228001185 |
| Ces1d | carboxylesterase 1D | 2.220800811 |
| Rbp4 | retinol binding protein 4, plasma | 2.218446867 |
| Cldn4 | claudin 4 | 2.206423916 |
| Cntnap5b | contactin associated protein-like 5B | 2.197952182 |
| Pik3cg | phosphoinositide-3-kinase, catalytic, gamma polypeptide | 2.192185679 |
| Prrt2 | proline-rich transmembrane protein 2 | 2.191091906 |
| Pde6b | phosphodiesterase 6B, cGMP, rod receptor, beta polypeptide | 2.180380617 |
| Tgm2 | transglutaminase 2, C polypeptide | 2.174584846 |
| 2010001M09Rik | marginal zone B and B1 cell-specific protein 1 | 2.174238193 |
| Slc17a7 | solute carrier family 17 (sodium-dependent inorganic phosphate cotransporter), member 7 | 2.172174492 |
| Olfr1259 | olfactory receptor 1259 | 2.170398567 |
| Tnnt1 | troponin T1, skeletal, slow | 2.168278391 |
| Zfp703 | zinc finger protein 703 | 2.153450259 |
| Ifi203 | interferon activated gene 203 | 2.147443241 |
| Sept1 | septin 1 | 2.137078644 |
| Ucp2 | uncoupling protein 2 (mitochondrial, proton carrier) | 2.133615188 |
| Slc41a2 | solute carrier family 41, member 2 | 2.131723024 |
| Mr1 | major histocompatibility complex, class I-related | 2.1309105 |
| Magea8 | melanoma antigen, family A, 8 | 2.130615114 |
| Zfp185 | zinc finger protein 185 | 2.130186876 |
| Plekhb1 | pleckstrin homology domain containing, family B (evectins) member 1 | 2.130053992 |
| Phex | phosphate regulating endopeptidase homolog, X-linked | 2.12989159 |
| C130026I21Rik | RIKEN cDNA C130026I21 gene | 2.120096598 |
| Kctd12b | potassium channel tetramerisation domain containing 12b | 2.115721892 |
| Sult6b1 | sulfotransferase family, cytosolic, 6B, member 1 | 2.106138045 |
| Slc16a5 | solute carrier family 16 (monocarboxylic acid transporters), member 5 | 2.100437707 |
| Kctd16 | potassium channel tetramerisation domain containing 16 | 2.100204774 |
| Psmb9 | proteasome (prosome, macropain) subunit, beta type 9 (large multifunctional peptidase 2) | 2.091068032 |
| Cav2 | caveolin 2 | 2.090763676 |
| F5 | coagulation factor V | 2.0892136 |
| Nacc2 | nucleus accumbens associated 2, BEN and BTB (POZ) domain containing | 2.084180172 |
| Arhgap29 | Rho GTPase activating protein 29 | 2.066343355 |
| Fbxw24 | F-box and WD-40 domain protein 24 | 2.066028277 |
| 3930402G23Rik | RIKEN cDNA 3930402G23 gene | 2.064095898 |
| Npy | neuropeptide Y | 2.061465047 |
| Emilin1 | elastin microfibril interfacer 1 | 2.061450758 |
| Baiap3 | BAI1-associated protein 3 | 2.053763417 |
| Stard8 | START domain containing 8 | 2.05353566 |
| Tgfb1i1 | transforming growth factor beta 1 induced transcript 1 | 2.053151377 |
| Olfr1258 | olfactory receptor 1258 | 2.049369323 |
| Tmem117 | transmembrane protein 117 | 2.047310611 |
| Itpr1 | inositol 1,4,5-trisphosphate receptor 1 | 2.046970059 |
| Gpr119 | G-protein coupled receptor 119 | 2.043567646 |
| Epb4.1l4a | erythrocyte protein band 4.1 like 4a | 2.042548025 |
| BC060267 | EF-hand calcium binding domain 12 | 2.036977437 |
| Hkdc1 | hexokinase domain containing 1 | 2.036596253 |
| Pram1 | PML-RAR alpha-regulated adaptor molecule 1 | 2.035269724 |
| Pde6a | phosphodiesterase 6A, cGMP-specific, rod, alpha | 2.034606783 |
| AI662270 | expressed sequence AI662270 | 2.030112954 |
| Dact1 | dapper homolog 1, antagonist of beta-catenin (xenopus) | 2.029972242 |
| Clic5 | chloride intracellular channel 5 | 2.028987532 |
| Npr1 | natriuretic peptide receptor 1 | 2.026415476 |
| Tfr2 | transferrin receptor 2 | 2.025657131 |
| Tlr3 | toll-like receptor 3 | 2.024772755 |
| Gcgr | glucagon receptor | 2.024337727 |
| Fgd2 | FYVE, RhoGEF and PH domain containing 2 | 2.023033205 |
| Chrnb4 | cholinergic receptor, nicotinic, beta polypeptide 4 | 2.017473887 |
| Ankrd34c | ankyrin repeat domain 34C | 2.01599212 |
| Rprml | reprimo-like | 2.015503097 |
| Acot11 | acyl-CoA thioesterase 11 | 2.015028159 |
| Ccdc13 | coiled-coil domain containing 13 | 2.006887854 |
| Zfp345 | zinc finger protein 345 | 2.00619244 |
| Gm1141 | predicted gene 1141 | 2.004705064 |
| Slc25a33 | solute carrier family 25, member 33 | 2.003857614 |
| Gimap8 | GTPase, IMAP family member 8 | 2.003829835 |
| Cbln2 | cerebellin 2 precursor protein | 2.003246561 |
| Adam5 | a disintegrin and metallopeptidase domain 5 | 1.993728554 |
| Tcea3 | transcription elongation factor A (SII), 3 | 1.991322654 |
| Fbxo48 | F-box protein 48 | 1.987595251 |
| Rasl11a | RAS-like, family 11, member A | 1.98546785 |
| Cyp2j9 | cytochrome P450, family 2, subfamily j, polypeptide 9 | 1.983730443 |
| A530032D15Rik | RIKEN cDNA A530032D15Rik gene | 1.983295985 |
| Scn9a | sodium channel, voltage-gated, type IX, alpha | 1.9781187 |
| Txnip | thioredoxin interacting protein | 1.977130364 |
| Tram2 | translocating chain-associating membrane protein 2 | 1.977061843 |
| 2410004P03Rik | RIKEN cDNA 2410004P03 gene | 1.976743937 |
| Casc5 | cancer susceptibility candidate 5 | 1.974899174 |
| Frmd4b | FERM domain containing 4B | 1.971392442 |
| Slc39a8 | solute carrier family 39 (metal ion transporter), member 8 | 1.969835287 |
| Scnn1g | sodium channel, nonvoltage-gated 1 gamma | 1.963471966 |
| Fmo5 | flavin containing monooxygenase 5 | 1.959544044 |
| Mmd2 | monocyte to macrophage differentiation-associated 2 | 1.959265622 |
| Srgap1 | SLIT-ROBO Rho GTPase activating protein 1 | 1.957889033 |
| Tmc3 | transmembrane channel-like gene family 3 | 1.952243488 |
| Als2cl | ALS2 C-terminal like | 1.951865984 |
| Alox12 | arachidonate 12-lipoxygenase | 1.950994891 |
| Mesp2 | mesoderm posterior 2 | 1.948140867 |
| Galnt14 | UDP-N-acetyl-alpha-D-galactosamine:polypeptide N-acetylgalactosaminyltransferase 14 | 1.947536005 |
| C2 | complement component 2 (within H-2S) | 1.944864978 |
| Zbtb32 | zinc finger and BTB domain containing 32 | 1.93964012 |
| Nhlh2 | nescient helix loop helix 2 | 1.937647316 |
| Irf7 | interferon regulatory factor 7 | 1.935558618 |
| Cpne7 | copine VII | 1.933165295 |
| F730035M05Rik | RIKEN cDNA F730035M05 gene | 1.926688045 |
| 3830403N18Rik | RIKEN cDNA 3830403N18 gene | 1.924188317 |
| Abtb2 | ankyrin repeat and BTB (POZ) domain containing 2 | 1.922788393 |
| Gpbar1 | G protein-coupled bile acid receptor 1 | 1.921599925 |
| Acvr1c | activin A receptor, type IC | 1.919628317 |
| Egr1 | early growth response 1 | 1.916659419 |
| Nes | nestin | 1.912951106 |
| Sstr5 | somatostatin receptor 5 | 1.909906484 |
| A330049N07Rik | RIKEN cDNA A330049N07 gene | 1.90492606 |
| Rtp4 | receptor transporter protein 4 | 1.900813516 |
| Rapgef5 | Rap guanine nucleotide exchange factor (GEF) 5 | 1.900397218 |
| Lcor | ligand dependent nuclear receptor corepressor | 1.894615379 |
| Il17rd | interleukin 17 receptor D | 1.892792156 |
| Kcnh4 | potassium voltage-gated channel, subfamily H (eag-related), member 4 | 1.888137722 |
| Kcnk9 | potassium channel, subfamily K, member 9 | 1.887178647 |
| LOC100503280 | predicted gene, 38425 | 1.885691932 |
| 0610009B14Rik | pleckstrin homology domain containing, family D (with coiled-coil domains) member 1, opposite strand | 1.882390572 |
| 2810442I21Rik | Egfr long non-coding downstream RNA | 1.88137182 |
| Pydc3 | pyrin domain containing 3 | 1.879481872 |
| Cd74 | CD74 antigen (invariant polypeptide of major histocompatibility complex, class II antigen-associated) | 1.874055917 |
| Gldc | glycine decarboxylase | 1.873768861 |
| Zfp641 | zinc finger protein 641 | 1.873122171 |
| Prr15l | proline rich 15-like | 1.870669898 |
| Fam83b | family with sequence similarity 83, member B | 1.869700255 |
| Gen1 | Gen homolog 1, endonuclease (Drosophila) | 1.869267449 |
| Fmo1 | flavin containing monooxygenase 1 | 1.867091978 |
| Wdr93 | WD repeat domain 93 | 1.865780151 |
| Npas4 | neuronal PAS domain protein 4 | 1.864718686 |
| Rgs8 | regulator of G-protein signaling 8 | 1.858159056 |
| Htr5b | 5-hydroxytryptamine (serotonin) receptor 5B | 1.855245361 |
| Nefl | neurofilament, light polypeptide | 1.854153904 |
| 9130230L23Rik | RIKEN cDNA 9130230L23 gene | 1.848770315 |
| Apol10b | apolipoprotein L 10B | 1.84636656 |
| Ccdc15 | coiled-coil domain containing 15 | 1.843646423 |
| Jun | jun proto-oncogene | 1.843526302 |
| Dll1 | delta-like 1 (Drosophila) | 1.842755929 |
| Fmn1 | formin 1 | 1.838769957 |
| Plscr4 | phospholipid scramblase 4 | 1.836148828 |
| Dmbx1 | diencephalon/mesencephalon homeobox 1 | 1.831979043 |
| Trim36 | tripartite motif-containing 36 | 1.829599656 |
| 6330403K07Rik | RIKEN cDNA 6330403K07 gene | 1.826216742 |
| Pycard | PYD and CARD domain containing | 1.825644674 |
| Epor | erythropoietin receptor | 1.825047483 |
| Plcxd3 | phosphatidylinositol-specific phospholipase C, X domain containing 3 | 1.820687094 |
| Lpar1 | lysophosphatidic acid receptor 1 | 1.819552906 |
| H2-M3 | histocompatibility 2, M region locus 3 | 1.818003529 |
| D630039A03Rik | RIKEN cDNA D630039A03 gene | 1.814152832 |
| Chrm4 | cholinergic receptor, muscarinic 4 | 1.80193129 |
| Muc1 | mucin 1, transmembrane | 1.798053565 |
| Kctd12 | potassium channel tetramerisation domain containing 12 | 1.797364484 |
| Itpkb | inositol 1,4,5-trisphosphate 3-kinase B | 1.795604977 |
| Trim21 | tripartite motif-containing 21 | 1.791401849 |
| Ism1 | isthmin 1 homolog (zebrafish) | 1.789990586 |
| Npas1 | neuronal PAS domain protein 1 | 1.788328784 |
| Riiad1 | regulatory subunit of type II PKA R-subunit (RIIa) domain containing 1 | 1.781233932 |
| Zbtb46 | zinc finger and BTB domain containing 46 | 1.781116643 |
| Igsf5 | immunoglobulin superfamily, member 5 | 1.780722857 |
| Myb | myeloblastosis oncogene | 1.777169147 |
| Lrrc15 | leucine rich repeat containing 15 | 1.774126646 |
| Meg3 | maternally expressed 3 | 1.772921919 |
| Inadl | InaD-like (Drosophila) | 1.766008149 |
| Nnat | neuronatin | 1.765975098 |
| Cd68 | CD68 antigen | 1.763499296 |
| Gapdhs | glyceraldehyde-3-phosphate dehydrogenase, spermatogenic | 1.760879272 |
| Depdc1a | DEP domain containing 1a | 1.760691318 |
| Cdh1 | cadherin 1 | 1.757244574 |
| Pgm2l1 | phosphoglucomutase 2-like 1 | 1.756499298 |
| Syt14 | synaptotagmin XIV | 1.75599532 |
| Nags | N-acetylglutamate synthase | 1.754753036 |
| Sult5a1 | sulfotransferase family 5A, member 1 | 1.753408322 |
| Tnfrsf26 | tumor necrosis factor receptor superfamily, member 26 | 1.751807195 |
| Ccdc138 | coiled-coil domain containing 138 | 1.751003539 |
| Itga2 | integrin alpha 2 | 1.750683151 |
| Zdhhc23 | zinc finger, DHHC domain containing 23 | 1.749850901 |
| Spink2 | serine peptidase inhibitor, Kazal type 2 | 1.746872121 |
| Ncapg2 | non-SMC condensin II complex, subunit G2 | 1.746337012 |
| Itgb8 | integrin beta 8 | 1.74443761 |
| Pvrl4 | poliovirus receptor-related 4 | 1.743592617 |
| Arc | activity regulated cytoskeletal-associated protein | 1.74114216 |
| Gpr165 | G protein-coupled receptor 165 | 1.73753134 |
| Cit | citron | 1.736766736 |
| AI182371 | expressed sequence AI182371 | 1.736269624 |
| Espl1 | extra spindle pole bodies 1, separase | 1.73620945 |
| Tppp3 | tubulin polymerization-promoting protein family member 3 | 1.734602387 |
| Pif1 | PIF1 5′-to-3′ DNA helicase homolog (S. cerevisiae) | 1.734190035 |
| Ppp1r32 | protein phosphatase 1, regulatory subunit 32 | 1.731643563 |
| Igfbp4 | insulin-like growth factor binding protein 4 | 1.731549943 |
| C130083M11Rik | RIKEN cDNA C130083M11 gene | 1.731353119 |
| Pkp3 | plakophilin 3 | 1.731260715 |
| Has1 | hyaluronan synthase1 | 1.729830883 |
| Capn9 | calpain 9 | 1.72369438 |
| Sytl4 | synaptotagmin-like 4 | 1.721623887 |
| Zim1 | zinc finger, imprinted 1 | 1.720188899 |
| Gpr155 | G protein-coupled receptor 155 | 1.719552305 |
| AI506816 | expressed sequence AI506816 | 1.717359411 |
| Tacr3 | tachykinin receptor 3 | 1.716797642 |
| Cd22 | CD22 antigen | 1.71619918 |
| Igtp | interferon gamma induced GTPase | 1.714782977 |
| Phf16 | jade family PHD finger 3 | 1.714072343 |
| Cenpl | centromere protein L | 1.713967793 |
| H2-T10 | histocompatibility 2, T region locus 10 | 1.713898888 |
| Kcnq4 | potassium voltage-gated channel, subfamily Q, member 4 | 1.713819295 |
| Pygl | liver glycogen phosphorylase | 1.713219496 |
| Parp14 | poly (ADP-ribose) polymerase family, member 14 | 1.712904834 |
| Cbl | Casitas B-lineage lymphoma | 1.712076302 |
| Pax5 | paired box 5 | 1.711506771 |
| Cdca7l | cell division cycle associated 7 like | 1.711281384 |
| S100z | S100 calcium binding protein, zeta | 1.71119361 |
| Oas1d | 2′-5′ oligoadenylate synthetase 1D | 1.710958776 |
| Hist2h2be | histone cluster 2, H2be | 1.710557973 |
| Cyp27b1 | cytochrome P450, family 27, subfamily b, polypeptide 1 | 1.707093406 |
| Gm14393 | predicted gene 14393 | 1.705817139 |
| Serpine1 | serine (or cysteine) peptidase inhibitor, clade E, member 1 | 1.704526466 |
| Rph3a | rabphilin 3A | 1.70394173 |
| Trpa1 | transient receptor potential cation channel, subfamily A, member 1 | 1.703425675 |
| C130074G19Rik | RIKEN cDNA C130074G19 gene | 1.703122256 |
| Aif1l | allograft inflammatory factor 1-like | 1.701556433 |
| Pak3 | p21 protein (Cdc42/Rac)-activated kinase 3 | 1.701157833 |
| Myo18b | myosin XVIIIb | 1.700990401 |
| E2f8 | E2F transcription factor 8 | 1.699972019 |
| Ptgs1 | prostaglandin-endoperoxide synthase 1 | 1.699511354 |
| Oas1b | 2′-5′ oligoadenylate synthetase 1B | 1.698496211 |
| Tnfrsf14 | tumor necrosis factor receptor superfamily, member 14 (herpesvirus entry mediator) | 1.694760019 |
| Irf4 | interferon regulatory factor 4 | 1.691390757 |
| Cacna1h | calcium channel, voltage-dependent, T type, alpha 1H subunit | 1.690046569 |
| Itpripl1 | inositol 1,4,5-triphosphate receptor interacting protein-like 1 | 1.689604989 |
| Ppl | periplakin | 1.686565093 |
| Itpr3 | inositol 1,4,5-triphosphate receptor 3 | 1.686537036 |
| Crybb1 | crystallin, beta B1 | 1.682669688 |
| Dnahc11 | dynein, axonemal, heavy chain 11 | 1.681584178 |
| Nmi | N-myc (and STAT) interactor | 1.68110286 |
| Barx2 | BarH-like homeobox 2 | 1.680908274 |
| Slc6a13 | solute carrier family 6 (neurotransmitter transporter, GABA), member 13 | 1.68056693 |
| Naip5 | NLR family, apoptosis inhibitory protein 5 | 1.679951985 |
| Enkur | enkurin, TRPC channel interacting protein | 1.679510715 |
| Eno4 | enolase 4 | 1.677079407 |
| Apbb1ip | amyloid beta (A4) precursor protein-binding, family B, member 1 interacting protein | 1.67527159 |
| Prr11 | proline rich 11 | 1.674976669 |
| 1810041L15Rik | RIKEN cDNA 1810041L15 gene | 1.673951815 |
| Clspn | claspin | 1.673469202 |
| Eri2 | exoribonuclease 2 | 1.672638876 |
| Atp1b2 | ATPase, Na+/K+ transporting, beta 2 polypeptide | 1.6690417 |
| Rian | RNA imprinted and accumulated in nucleus | 1.668007759 |
| Kif14 | kinesin family member 14 | 1.667086542 |
| Tmem217 | transmembrane protein 217 | 1.665372608 |
| Zfp69 | zinc finger protein 69 | 1.663553195 |
| Cdh7 | cadherin 7, type 2 | 1.661454748 |
| Aldh1a1 | aldehyde dehydrogenase family 1, subfamily A1 | 1.66120256 |
| Bcmo1 | beta-carotene oxygenase 1 | 1.661127717 |
| Tap2 | transporter 2, ATP-binding cassette, sub-family B (MDR/TAP) | 1.660816866 |
| Nr5a1 | nuclear receptor subfamily 5, group A, member 1 | 1.660517584 |
| Dnahc2 | dynein, axonemal, heavy chain 2 | 1.66008487 |
| Col6a6 | collagen, type VI, alpha 6 | 1.657511638 |
| Card10 | caspase recruitment domain family, member 10 | 1.655901663 |
| Egr4 | early growth response 4 | 1.655665237 |
| 4930558J18Rik | RIKEN cDNA 4930558J18 gene | 1.654479023 |
| 6330545A04Rik | REM2 and RAB-like small GTPase 1 | 1.65417515 |
| Grem1 | gremlin 1 | 1.654018075 |
| 5730590G19Rik | TOPBP1-interacting checkpoint and replication regulator | 1.652818148 |
| 2810047C21Rik1 | RIKEN cDNA 2810047C21 gene 1 | 1.65113605 |
| Fam46c | family with sequence similarity 46, member C | 1.651077682 |
| Npnt | nephronectin | 1.650979264 |
| Glyatl3 | glycine-N-acyltransferase-like 3 | 1.650670312 |
| Nlrc5 | NLR family, CARD domain containing 5 | 1.650654294 |
| Nfatc2 | nuclear factor of activated T cells, cytoplasmic, calcineurin dependent 2 | 1.650150946 |
| Sacs | sacsin | 1.64588667 |
| Tec | tec protein tyrosine kinase | 1.645502251 |
| Hdc | histidine decarboxylase | 1.644865933 |
| Kntc1 | kinetochore associated 1 | 1.644447557 |
| Foxn3 | forkhead box N3 | 1.644011055 |
| E2f7 | E2F transcription factor 7 | 1.643817344 |
| Dnajc22 | DnaJ (Hsp40) homolog, subfamily C, member 22 | 1.643273936 |
| Tmie | transmembrane inner ear | 1.641281841 |
| Nusap1 | nucleolar and spindle associated protein 1 | 1.640184376 |
| Mks1 | Meckel syndrome, type 1 | 1.637979158 |
| Sass6 | spindle assembly 6 homolog (C. elegans) | 1.636570781 |
| E330016A19Rik | Mab-21 domain containing 1 | 1.635744024 |
| Casp7 | caspase 7 | 1.633807488 |
| Nptx1 | neuronal pentraxin 1 | 1.633711231 |
| Fcer1g | Fc receptor, IgE, high affinity I, gamma polypeptide | 1.632402698 |
| Fras1 | Fraser syndrome 1 homolog (human) | 1.631042076 |
| Il18rap | interleukin 18 receptor accessory protein | 1.630817112 |
| Gabrq | gamma-aminobutyric acid [205] A receptor, subunit theta | 1.627309878 |
| Crtac1 | cartilage acidic protein 1 | 1.626751631 |
| Serpinb5 | serine (or cysteine) peptidase inhibitor, clade B, member 5 | 1.625755157 |
| Serping1 | serine (or cysteine) peptidase inhibitor, clade G, member 1 | 1.624733391 |
| Mov10 | Moloney leukemia virus 10 | 1.62361548 |
| Atf7ip | activating transcription factor 7 interacting protein | 1.623411794 |
| Trim56 | tripartite motif-containing 56 | 1.623400542 |
| Plcl1 | phospholipase C-like 1 | 1.623166505 |
| Six1 | sine oculis-related homeobox 1 | 1.620186622 |
| S100a11 | S100 calcium binding protein A11 | 1.619063983 |
| Mapk15 | mitogen-activated protein kinase 15 | 1.618467056 |
| Col6a3 | collagen, type VI, alpha 3 | 1.617936515 |
| Saa3 | serum amyloid A 3 | 1.617914086 |
| Phactr3 | phosphatase and actin regulator 3 | 1.617405026 |
| Mfsd4 | major facilitator superfamily domain containing 4 | 1.617374757 |
| Ccne2 | cyclin E2 | 1.6161398 |
| Ltbp4 | latent transforming growth factor beta binding protein 4 | 1.615855288 |
| Eps8l1 | EPS8-like 1 | 1.614777064 |
| Ier5l | immediate early response 5-like | 1.613093428 |
| Stx1b | syntaxin 1B | 1.612612712 |
| Slc26a10 | solute carrier family 26, member 10 | 1.611623782 |
| Cd44 | CD44 antigen | 1.610397681 |
| Zfp871 | zinc finger protein 871 | 1.60982515 |
| Barhl1 | BarH-like 1 (Drosophila) | 1.609625426 |
| Rttn | rotatin | 1.609596418 |
| Hmgb2 | high mobility group box 2 | 1.607645149 |
| Ttf2 | transcription termination factor, RNA polymerase II | 1.607564919 |
| Map3k13 | mitogen-activated protein kinase kinase kinase 13 | 1.607019015 |
| Lgi1 | leucine-rich repeat LGI family, member 1 | 1.606897605 |
| Itgal | integrin alpha L | 1.606459934 |
| Bok | BCL2-related ovarian killer | 1.605189918 |
| Aspm | asp (abnormal spindle)-like, microcephaly associated (Drosophila) | 1.601106196 |
| Tmem158 | transmembrane protein 158 | 1.600863168 |
| Pla2g16 | phospholipase A2, group XVI | 1.600243002 |
| Kif11 | kinesin family member 11 | 1.598954626 |
| Plek2 | pleckstrin 2 | 1.598457072 |
| 4933433C11Rik | RIKEN cDNA 4933433C11 gene | 1.597143565 |
| Cd200 | CD200 antigen | 1.595843304 |
| Gm5779 | ribosomal protein, large, P0 pseudogene | 1.595588909 |
| Agt | angiotensinogen (serpin peptidase inhibitor, clade A, member 8) | 1.594944254 |
| Elf4 | E74-like factor 4 (ets domain transcription factor) | 1.594610418 |
| Herc6 | hect domain and RLD 6 | 1.593683341 |
| Dnmt3b | DNA methyltransferase 3B | 1.593583925 |
| Rsad2 | radical S-adenosyl methionine domain containing 2 | 1.591668617 |
| Tph1 | tryptophan hydroxylase 1 | 1.590974817 |
| Nrg1 | neuregulin 1 | 1.589850379 |
| Alox5ap | arachidonate 5-lipoxygenase activating protein | 1.589718145 |
| Necab3 | N-terminal EF-hand calcium binding protein 3 | 1.589243293 |
| Esrp2 | epithelial splicing regulatory protein 2 | 1.588748761 |
| 4930422G04Rik | zinc finger, GRF-type containing 1 | 1.587395917 |
| Fam92b | family with sequence similarity 92, member B | 1.587257286 |
| Sp100 | nuclear antigen Sp100 | 1.586955859 |
| Emid1 | EMI domain containing 1 | 1.58690086 |
| 4831426I19Rik | spectrin repeat containing, nuclear envelope family member 3 | 1.586595102 |
| Rgs16 | regulator of G-protein signaling 16 | 1.586498327 |
| Ccdc8 | coiled-coil domain containing 8 | 1.585047418 |
| Eps8 | epidermal growth factor receptor pathway substrate 8 | 1.584900202 |
| Mdh1b | malate dehydrogenase 1B, NAD (soluble) | 1.584504767 |
| Atad5 | ATPase family, AAA domain containing 5 | 1.583894233 |
| Plagl1 | pleiomorphic adenoma gene-like 1 | 1.579899731 |
| Zfp773 | zinc finger protein 773 | 1.578560987 |
| Pnpt1 | polyribonucleotide nucleotidyltransferase 1 | 1.578412187 |
| Tnfsf13b | tumor necrosis factor (ligand) superfamily, member 13b | 1.577272575 |
| Mctp2 | multiple C2 domains, transmembrane 2 | 1.577057213 |
| Mycl1 | v-myc myelocytomatosis viral oncogene homolog, lung carcinoma derived (avian) | 1.576943532 |
| Hells | helicase, lymphoid specific | 1.57630641 |
| Dclre1b | DNA cross-link repair 1B, PSO2 homolog (S. cerevisiae) | 1.574844081 |
| Ddx11 | DEAD/H (Asp-Glu-Ala-Asp/His) box helicase 11 | 1.572593722 |
| Nr1d1 | nuclear receptor subfamily 1, group D, member 1 | 1.572470552 |
| Glyat | glycine-N-acyltransferase | 1.571915864 |
| Bcl2l11 | BCL2-like 11 (apoptosis facilitator) | 1.571148994 |
| Met | met proto-oncogene | 1.56931395 |
| D8Ertd82e | DNA segment, Chr 8, ERATO Doi 82, expressed | 1.568395057 |
| H2-T23 | histocompatibility 2, T region locus 23 | 1.567642944 |
| Pik3c2g | phosphatidylinositol 3-kinase, C2 domain containing, gamma polypeptide | 1.567473443 |
| Kif18a | kinesin family member 18A | 1.567215966 |
| Zbtb26 | zinc finger and BTB domain containing 26 | 1.565475576 |
| Ifit2 | interferon-induced protein with tetratricopeptide repeats 2 | 1.56540396 |
| Cx3cl1 | chemokine (C-X3-C motif) ligand 1 | 1.565369239 |
| Pabpc5 | poly(A) binding protein, cytoplasmic 5 | 1.565006881 |
| Synpo | synaptopodin | 1.564640268 |
| Dapp1 | dual adaptor for phosphotyrosine and 3-phosphoinositides 1 | 1.562782494 |
| 2810417H13Rik | RIKEN cDNA 2810417H13 gene | 1.561013485 |
| Mybl1 | myeloblastosis oncogene-like 1 | 1.560151359 |
| Insrr | insulin receptor-related receptor | 1.559127596 |
| Rasal1 | RAS protein activator like 1 (GAP1 like) | 1.558061305 |
| Pttg1 | pituitary tumor-transforming gene 1 | 1.558007307 |
| Pyroxd2 | pyridine nucleotide-disulphide oxidoreductase domain 2 | 1.557957632 |
| Icam5 | intercellular adhesion molecule 5, telencephalin | 1.557842087 |
| Hjurp | Holliday junction recognition protein | 1.557497665 |
| B3gnt7 | UDP-GlcNAc:betaGal beta-1,3-N-acetylglucosaminyltransferase 7 | 1.557120938 |
| Hpca | hippocalcin | 1.555685034 |
| Zfp551 | zinc fingr protein 551 | 1.555390681 |
| Zfp442 | zinc finger protein 442 | 1.555308746 |
| Ncaph | non-SMC condensin I complex, subunit H | 1.555013386 |
| Junb | jun B proto-oncogene | 1.554409906 |
| Eda2r | ectodysplasin A2 receptor | 1.554112562 |
| C1galt1 | core 1 synthase, glycoprotein-N-acetylgalactosamine 3-beta-galactosyltransferase, 1 | 1.554107176 |
| Lnpep | leucyl/cystinyl aminopeptidase | 1.55275477 |
| Rbm15 | RNA binding motif protein 15 | 1.552600869 |
| Parp9 | poly (ADP-ribose) polymerase family, member 9 | 1.552128497 |
| Aff2 | AF4/FMR2 family, member 2 | 1.551510005 |
| Oplah | 5-oxoprolinase (ATP-hydrolysing) | 1.551102472 |
| Arhgap27 | Rho GTPase activating protein 27 | 1.550438177 |
| Prex1 | phosphatidylinositol-3,4,5-trisphosphate-dependent Rac exchange factor 1 | 1.550216808 |
| Ttk | Ttk protein kinase | 1.549523892 |
| Ccrl2 | chemokine (C-C motif) receptor-like 2 | 1.547949064 |
| Iqgap2 | IQ motif containing GTPase activating protein 2 | 1.546832519 |
| Recql4 | RecQ protein-like 4 | 1.546574145 |
| Zwilch | zwilch kinetochore protein | 1.546023233 |
| Mybl2 | myeloblastosis oncogene-like 2 | 1.545729637 |
| Lrp2bp | Lrp2 binding protein | 1.545528223 |
| Arhgap11a | Rho GTPase activating protein 11A | 1.544071971 |
| Ankrd45 | ankyrin repeat domain 45 | 1.543992773 |
| Baz1a | bromodomain adjacent to zinc finger domain 1A | 1.542731506 |
| 1700001L05Rik | RIKEN cDNA 1700001L05 gene | 1.542480232 |
| Gsdmd | gasdermin D | 1.54238401 |
| Col9a2 | collagen, type IX, alpha 2 | 1.53804104 |
| Agbl2 | ATP/GTP binding protein-like 2 | 1.537512351 |
| Gas2l3 | growth arrest-specific 2 like 3 | 1.537307746 |
| Mapk13 | mitogen-activated protein kinase 13 | 1.536768657 |
| Fancd2 | Fanconi anemia, complementation group D2 | 1.536442738 |
| Rbm43 | RNA binding motif protein 43 | 1.53570169 |
| Hmmr | hyaluronan mediated motility receptor (RHAMM) | 1.53533875 |
| 5330437I02Rik | O-acyltransferase like | 1.534939721 |
| Kif20b | kinesin family member 20B | 1.533580609 |
| 1500004A13Rik | RIKEN cDNA 1500004A13 gene | 1.533202228 |
| Irak4 | interleukin-1 receptor-associated kinase 4 | 1.531255472 |
| Rasd2 | RASD family, member 2 | 1.530652724 |
| Dtl | denticleless homolog (Drosophila) | 1.53000355 |
| Ncapg | non-SMC condensin I complex, subunit G | 1.529938859 |
| Fam134b | family with sequence similarity 134, member B | 1.528747352 |
| Syne2 | spectrin repeat containing, nuclear envelope 2 | 1.528388174 |
| Pard3 | par-3 family cell polarity regulator | 1.528243043 |
| Mtap1a | microtubule-associated protein 1 A | 1.527840563 |
| Cacna1g | calcium channel, voltage-dependent, T type, alpha 1G subunit | 1.52778126 |
| Bub1 | budding uninhibited by benzimidazoles 1 homolog (S. cerevisiae) | 1.527609715 |
| Coro1a | coronin, actin binding protein 1A | 1.526906795 |
| Meis2 | Meis homeobox 2 | 1.526873986 |
| Vrk1 | vaccinia related kinase 1 | 1.526478215 |
| Pola1 | polymerase (DNA directed), alpha 1 | 1.526287773 |
| Dlgap3 | discs, large (Drosophila) homolog-associated protein 3 | 1.526253919 |
| Trim68 | tripartite motif-containing 68 | 1.526207372 |
| Ttc12 | tetratricopeptide repeat domain 12 | 1.525522015 |
| Fam72a | family with sequence similarity 72, member A | 1.523863839 |
| Icosl | icos ligand | 1.523589235 |
| Dtx3l | deltex 3-like (Drosophila) | 1.523180591 |
| Itpka | inositol 1,4,5-trisphosphate 3-kinase A | 1.522780499 |
| Nrgn | neurogranin | 1.522575744 |
| Smtn | smoothelin | 1.522570467 |
| Elk4 | ELK4, member of ETS oncogene family | 1.522326697 |
| Atad2 | ATPase family, AAA domain containing 2 | 1.521671561 |
| Cep192 | centrosomal protein 192 | 1.521477501 |
| 4930588N13Rik | testis expressed 26 | 1.520977699 |
| Pxmp2 | peroxisomal membrane protein 2 | 1.520197746 |
| Ncapd2 | non-SMC condensin I complex, subunit D2 | 1.519845844 |
| Wdr76 | WD repeat domain 76 | 1.519166503 |
| Stac2 | SH3 and cysteine rich domain 2 | 1.518885376 |
| Defb41 | defensin beta 41 | 1.517398482 |
| Cdh24 | cadherin-like 24 | 1.514654767 |
| 1700048O20Rik | RIKEN cDNA 1700048O20 gene | 1.514600174 |
| Espnl | espin-like | 1.514412265 |
| Rab39 | RAB39, member RAS oncogene family | 1.51427056 |
| Selenbp1 | selenium binding protein 1 | 1.513979846 |
| Per3 | period circadian clock 3 | 1.513715417 |
| Mki67 | antigen identified by monoclonal antibody Ki 67 | 1.513610498 |
| Ankle1 | ankyrin repeat and LEM domain containing 1 | 1.513353477 |
| Polq | polymerase (DNA directed), theta | 1.513254876 |
| Mdc1 | mediator of DNA damage checkpoint 1 | 1.513077621 |
| Dusp1 | dual specificity phosphatase 1 | 1.513065036 |
| Rps6ka5 | ribosomal protein S6 kinase, polypeptide 5 | 1.512767213 |
| Fanci | Fanconi anemia, complementation group I | 1.51272527 |
| Tal1 | T cell acute lymphocytic leukemia 1 | 1.512026055 |
| Wdr62 | WD repeat domain 62 | 1.511651945 |
| Dtx2 | deltex 2 homolog (Drosophila) | 1.511293641 |
| D430020J02Rik | RIKEN cDNA D430020J02 gene | 1.511124995 |
| Lonrf3 | LON peptidase N-terminal domain and ring finger 3 | 1.510819176 |
| Lfng | LFNG O-fucosylpeptide 3-beta-N-acetylglucosaminyltransferase | 1.510241221 |
| Gabpb2 | GA repeat binding protein, beta 2 | 1.510030825 |
| Cttnbp2nl | CTTNBP2 N-terminal like | 1.509582915 |
| Pclo | piccolo (presynaptic cytomatrix protein) | 1.508686448 |
| Prc1 | protein regulator of cytokinesis 1 | 1.507835454 |
| Fanca | Fanconi anemia, complementation group A | 1.507343268 |
| Zbtb37 | zinc finger and BTB domain containing 37 | 1.506978673 |
| Anln | anillin, actin binding protein | 1.506023206 |
| Ovol2 | ovo-like 2 (Drosophila) | 1.505520132 |
| Gpx2 | glutathione peroxidase 2 | 1.505259268 |
| Tspyl5 | testis-specific protein, Y-encoded-like 5 | 1.504758535 |
| Gm13889 | predicted gene 13889 | 1.504595833 |
| Meox1 | mesenchyme homeobox 1 | 1.503504306 |
| Baiap2 | brain-specific angiogenesis inhibitor 1-associated protein 2 | 1.503424063 |
| Bspry | B-box and SPRY domain containing | 1.503370917 |
| Alms1 | Alstrom syndrome 1 | 1.50309063 |
| Ctsh | cathepsin H | 1.500735782 |
| Mbl2 | mannose-binding lectin (protein C) 2 | 1.500699374 |
| Pparg | peroxisome proliferator activated receptor gamma | 1.50019392 |
| Onecut2 | one cut domain, family member 2 | 1.500059784 |
| Abcc3 | ATP-binding cassette, sub-family C (CFTR/MRP), member 3 | 0.66666505 |
| Fam195a | family with sequence similarity 195, member A | 0.666508879 |
| Ppm1j | protein phosphatase 1J | 0.666503797 |
| C2cd4a | C2 calcium-dependent domain containing 4A | 0.666200342 |
| Izumo4 | IZUMO family member 4 | 0.665312018 |
| Sik1 | salt inducible kinase 1 | 0.665034919 |
| 2210016F16Rik | RIKEN cDNA 2210016F16 gene | 0.664613268 |
| Acot13 | acyl-CoA thioesterase 13 | 0.66406299 |
| Prkar1a | protein kinase, cAMP dependent regulatory, type I, alpha | 0.663852209 |
| Haghl | hydroxyacylglutathione hydrolase-like | 0.663668635 |
| Calca | calcitonin/calcitonin-related polypeptide, alpha | 0.663565139 |
| 5730528L13Rik | Myb/SANT-like DNA-binding domain containing 3 | 0.663464878 |
| Kcnab2 | potassium voltage-gated channel, shaker-related subfamily, beta member 2 | 0.663361413 |
| Phgdh | 3-phosphoglycerate dehydrogenase | 0.662927038 |
| Dtx1 | deltex 1 homolog (Drosophila) | 0.662269352 |
| Leprel4 | prolyl 3-hydroxylase family member 4 (non-enzymatic) | 0.661910013 |
| Mcfd2 | multiple coagulation factor deficiency 2 | 0.661733398 |
| Il11 | interleukin 11 | 0.661628828 |
| Tm7sf2 | transmembrane 7 superfamily member 2 | 0.661488509 |
| Bcar3 | breast cancer anti-estrogen resistance 3 | 0.661408275 |
| Serpinb6a | serine (or cysteine) peptidase inhibitor, clade B, member 6a | 0.661128219 |
| Hist1h1d | histone cluster 1, H1d | 0.660781866 |
| Inpp4b | inositol polyphosphate-4-phosphatase, type II | 0.660725532 |
| Fam71e1 | family with sequence similarity 71, member E1 | 0.660592273 |
| Ripk2 | receptor (TNFRSF)-interacting serine-threonine kinase 2 | 0.660390833 |
| Slc25a29 | solute carrier family 25 (mitochondrial carrier, palmitoylcarnitine transporter), member 29 | 0.659842679 |
| H2-M10.1 | histocompatibility 2, M region locus 10.1 | 0.659539056 |
| Cyb5r1 | cytochrome b5 reductase 1 | 0.658411756 |
| Isca1 | iron-sulfur cluster assembly 1 homolog (S. cerevisiae) | 0.658398065 |
| Mdga1 | MAM domain containing glycosylphosphatidylinositol anchor 1 | 0.658381179 |
| Tmsb4x | thymosin, beta 4, X chromosome | 0.658331438 |
| Vopp1 | vesicular, overexpressed in cancer, prosurvival protein 1 | 0.658128407 |
| Tgif1 | TGFB-induced factor homeobox 1 | 0.657832869 |
| 2310034G01Rik | RIKEN cDNA 2310034G01 gene | 0.65768287 |
| Cdhr2 | cadherin-related family member 2 | 0.657628624 |
| Clu | clusterin | 0.657572559 |
| Igf2 | insulin-like growth factor 2 | 0.657462721 |
| Eid2 | EP300 interacting inhibitor of differentiation 2 | 0.65705999 |
| Gstm6 | glutathione S-transferase, mu 6 | 0.657038584 |
| Rab24 | RAB24, member RAS oncogene family | 0.656603798 |
| Lmf1 | lipase maturation factor 1 | 0.656302576 |
| Fabp3 | fatty acid binding protein 3, muscle and heart | 0.655851456 |
| Pdzk1ip1 | PDZK1 interacting protein 1 | 0.655426541 |
| Lhfpl2 | lipoma HMGIC fusion partner-like 2 | 0.654710036 |
| Ropn1l | ropporin 1-like | 0.654418755 |
| Hhip | Hedgehog-interacting protein | 0.654131684 |
| Rps6ka6 | ribosomal protein S6 kinase polypeptide 6 | 0.654017434 |
| Elovl6 | ELOVL family member 6, elongation of long chain fatty acids (yeast) | 0.653599144 |
| Uqcrb | ubiquinol-cytochrome c reductase binding protein | 0.653485441 |
| Apold1 | apolipoprotein L domain containing 1 | 0.652986015 |
| Map3k8 | mitogen-activated protein kinase kinase kinase 8 | 0.652907718 |
| Cabp1 | calcium binding protein 1 | 0.652895046 |
| Shisa4 | shisa family member 4 | 0.652850697 |
| Bicc1 | bicaudal C homolog 1 (Drosophila) | 0.652500992 |
| Muted | biogenesis of lysosomal organelles complex-1, subunit 5, muted | 0.652389289 |
| Tex15 | testis expressed gene 15 | 0.65159164 |
| Idua | iduronidase, alpha-L- | 0.651298135 |
| Atp4a | ATPase, H+/K+ exchanging, gastric, alpha polypeptide | 0.651127962 |
| Gde1 | glycerophosphodiester phosphodiesterase 1 | 0.651043118 |
| Aldh5a1 | aldhehyde dehydrogenase family 5, subfamily A1 | 0.650923092 |
| Bpgm | 2,3-bisphosphoglycerate mutase | 0.650748055 |
| Ell2 | elongation factor RNA polymerase II 2 | 0.650546461 |
| Prdx6 | peroxiredoxin 6 | 0.650288132 |
| Kazn | kazrin, periplakin interacting protein | 0.650033962 |
| Mef2b | myocyte enhancer factor 2B | 0.649945205 |
| Ryr2 | ryanodine receptor 2, cardiac | 0.649493503 |
| Folr1 | folate receptor 1 (adult) | 0.649479998 |
| 2210408F21Rik | RIKEN cDNA 2210408F21 gene | 0.648997128 |
| Txndc5 | thioredoxin domain containing 5 | 0.64874706 |
| Slc46a1 | solute carrier family 46, member 1 | 0.6485317 |
| Slc3a2 | solute carrier family 3 (activators of dibasic and neutral amino acid transport), member 2 | 0.648374834 |
| Sfxn1 | sideroflexin 1 | 0.648061664 |
| 4921530D09Rik | coiled-coil domain containing 183 | 0.647472579 |
| Nceh1 | neutral cholesterol ester hydrolase 1 | 0.647380583 |
| Kcnk1 | potassium channel, subfamily K, member 1 | 0.64710557 |
| Mrpl36 | mitochondrial ribosomal protein L36 | 0.647010935 |
| Slc35f4 | solute carrier family 35, member F4 | 0.646917211 |
| Mfsd1 | major facilitator superfamily domain containing 1 | 0.646064003 |
| 2310014L17Rik | ring finger protein 225 | 0.645575172 |
| Pcbd2 | pterin 4 alpha carbinolamine dehydratase/dimerization cofactor of hepatocyte nuclear factor 1 alpha (TCF1) 2 | 0.645424389 |
| Sdr42e1 | short chain dehydrogenase/reductase family 42E, member 1 | 0.645150207 |
| Entpd2 | ectonucleoside triphosphate diphosphohydrolase 2 | 0.64503395 |
| Atp1a3 | ATPase, Na+/K+ transporting, alpha 3 polypeptide | 0.644988347 |
| Cdh6 | cadherin 6 | 0.644978064 |
| Gm4262 | predicted gene 4262 | 0.644731778 |
| Drp2 | dystrophin related protein 2 | 0.643951973 |
| Col16a1 | collagen, type XVI, alpha 1 | 0.642837056 |
| Psg23 | pregnancy-specific glycoprotein 23 | 0.642613413 |
| Ptprj | protein tyrosine phosphatase, receptor type, J | 0.642533242 |
| Derl3 | Der1-like domain family, member 3 | 0.6423756 |
| Porcn | porcupine homolog (Drosophila) | 0.642254055 |
| Cpm | carboxypeptidase M | 0.642150338 |
| Gm15706 | predicted gene 15706 | 0.642070224 |
| Ffar2 | free fatty acid receptor 2 | 0.642047527 |
| Svop | SV2 related protein | 0.641183409 |
| Stk35 | serine/threonine kinase 35 | 0.64088393 |
| Txndc15 | thioredoxin domain containing 15 | 0.640684503 |
| Slc39a11 | solute carrier family 39 (metal ion transporter), member 11 | 0.640462497 |
| Tmed6 | transmembrane emp24 protein transport domain containing 6 | 0.639686526 |
| 6530402F18Rik | RIKEN cDNA 6530402F18 gene | 0.639641301 |
| Pycr1 | pyrroline-5-carboxylate reductase 1 | 0.639484812 |
| Dscam | Down syndrome cell adhesion molecule | 0.639334565 |
| Adamts6 | a disintegrin-like and metallopeptidase (reprolysin type) with thrombospondin type 1 motif, 6 | 0.639047024 |
| Syngr3 | synaptogyrin 3 | 0.63884684 |
| Auh | AU RNA binding protein/enoyl-coenzyme A hydratase | 0.638067519 |
| 2610029I01Rik | thiosulfate sulfurtransferase (rhodanese)-like domain containing 3 | 0.637871179 |
| Sncb | synuclein, beta | 0.637439356 |
| Cplx2 | complexin 2 | 0.637263528 |
| Lrrc8b | leucine rich repeat containing 8 family, member B | 0.63700341 |
| Car13 | carbonic anhydrase 13 | 0.6367893 |
| Ier3 | immediate early response 3 | 0.636413789 |
| Palld | palladin, cytoskeletal associated protein | 0.636029241 |
| Wnt9a | wingless-type MMTV integration site family, member 9A | 0.635583246 |
| Tmem91 | transmembrane protein 91 | 0.635389432 |
| Cetn4 | centrin 4 | 0.634603771 |
| Clec11a | C-type lectin domain family 11, member a | 0.634561105 |
| 2810405K02Rik | family with sequence similarity 213, member B | 0.634530756 |
| Thrb | thyroid hormone receptor beta | 0.634055925 |
| Tmem221 | transmembrane protein 221 | 0.633943864 |
| Trnp1 | TMF1-regulated nuclear protein 1 | 0.633855108 |
| Pfkp | phosphofructokinase, platelet | 0.633021322 |
| Naglu | alpha-N-acetylglucosaminidase (Sanfilippo disease IIIB) | 0.632691448 |
| Mreg | melanoregulin | 0.632323174 |
| Gm20594 | predicted gene, 20594 | 0.632193453 |
| Lman2 | lectin, mannose-binding 2 | 0.632132108 |
| Serpina1b | serine (or cysteine) preptidase inhibitor, clade A, member 1B | 0.631820214 |
| Cd248 | CD248 antigen, endosialin | 0.631665201 |
| Dhrs7 | dehydrogenase/reductase (SDR family) member 7 | 0.631557502 |
| B930041F14Rik | RIKEN cDNA B930041F14 gene | 0.631168889 |
| Smad3 | SMAD family member 3 | 0.630986918 |
| Fam69b | family with sequence similarity 69, member B | 0.630968549 |
| Ddit3 | DNA-damage inducible transcript 3 | 0.63085922 |
| Gp5 | glycoprotein 5 (platelet) | 0.63026218 |
| Lrrc29 | leucine rich repeat containing 29 | 0.630214564 |
| Arg1 | arginase, liver | 0.629981339 |
| T2 | brachyury 2 | 0.629633846 |
| Fignl2 | fidgetin-like 2 | 0.629392547 |
| Tceal3 | transcription elongation factor A (SII)-like 3 | 0.628905431 |
| Dusp5 | dual specificity phosphatase 5 | 0.628837431 |
| Wdr25 | WD repeat domain 25 | 0.628696658 |
| Tnfaip2 | tumor necrosis factor, alpha-induced protein 2 | 0.6283747 |
| Lypd1 | Ly6/Plaur domain containing 1 | 0.628290208 |
| Fam189a1 | family with sequence similarity 189, member A1 | 0.628234902 |
| Slc5a1 | solute carrier family 5 (sodium/glucose cotransporter), member 1 | 0.626967689 |
| Frzb | frizzled-related protein | 0.626773461 |
| Snca | synuclein, alpha | 0.625920356 |
| Boc | biregional cell adhesion molecule-related/down-regulated by oncogenes (Cdon) binding protein | 0.625777634 |
| Amph | amphiphysin | 0.625677878 |
| Gmpr | guanosine monophosphate reductase | 0.625547785 |
| P2rx4 | purinergic receptor P2X, ligand-gated ion channel 4 | 0.62519667 |
| Mycn | v-myc myelocytomatosis viral related oncogene, neuroblastoma derived (avian) | 0.625116505 |
| Col20a1 | collagen, type XX, alpha 1 | 0.624833626 |
| Iqsec3 | IQ motif and Sec7 domain 3 | 0.624743547 |
| Nfkbiz | nuclear factor of kappa light polypeptide gene enhancer in B cells inhibitor, zeta | 0.624279934 |
| Car12 | carbonic anyhydrase 12 | 0.624198156 |
| Ak4 | adenylate kinase 4 | 0.623976673 |
| Asb5 | ankyrin repeat and SOCs box-containing 5 | 0.623789857 |
| Nrxn3 | neurexin III | 0.623147674 |
| Rhou | ras homolog gene family, member U | 0.623054384 |
| Limch1 | LIM and calponin homology domains 1 | 0.622803087 |
| Kcnt2 | potassium channel, subfamily T, member 2 | 0.62238621 |
| Tmed9 | transmembrane emp24 protein transport domain containing 9 | 0.620950426 |
| Fam84b | family with sequence similarity 84, member B | 0.620824759 |
| Rab6b | RAB6B, member RAS oncogene family | 0.619705638 |
| Nfil3 | nuclear factor, interleukin 3, regulated | 0.619465568 |
| Iapp | islet amyloid polypeptide | 0.619416621 |
| Slc7a3 | solute carrier family 7 (cationic amino acid transporter, y+ system), member 3 | 0.61939129 |
| Rab20 | RAB20, member RAS oncogene family | 0.619150483 |
| Dctd | dCMP deaminase | 0.618812395 |
| Zfhx4 | zinc finger homeodomain 4 | 0.61845563 |
| Sema4d | sema domain, immunoglobulin domain (Ig), transmembrane domain (TM) and short cytoplasmic domain, (semaphorin) 4D | 0.617107186 |
| Gm11127 | predicted gene 11127 | 0.616756534 |
| Ptp4a3 | protein tyrosine phosphatase 4a3 | 0.61671806 |
| Ankrd34b | ankyrin repeat domain 34B | 0.616590685 |
| Gna15 | guanine nucleotide binding protein, alpha 15 | 0.616486839 |
| Magee2 | melanoma antigen, family E, 2 | 0.616478292 |
| Rad51ap2 | RAD51 associated protein 2 | 0.616130987 |
| Ctsl | cathepsin L | 0.615838941 |
| Slc41a3 | solute carrier family 41, member 3 | 0.615448908 |
| 1110007C09Rik | RIKEN cDNA 1110007C09 gene | 0.615166992 |
| B4galt7 | xylosylprotein beta1,4-galactosyltransferase, polypeptide 7 (galactosyltransferase I) | 0.615048464 |
| Ak3 | adenylate kinase 3 | 0.614299026 |
| AA467197 | expressed sequence AA467197 | 0.614189179 |
| Tmed3 | transmembrane emp24 domain containing 3 | 0.614179388 |
| Gpt2 | glutamic pyruvate transaminase (alanine aminotransferase) 2 | 0.613619825 |
| Slc7a5 | solute carrier family 7 (cationic amino acid transporter, y+ system), member 5 | 0.613559006 |
| Aicda | activation-induced cytidine deaminase | 0.613439937 |
| Wipf3 | WAS/WASL interacting protein family, member 3 | 0.612792268 |
| S1pr4 | sphingosine-1-phosphate receptor 4 | 0.612180077 |
| Synpo2 | synaptopodin 2 | 0.611828408 |
| Ndufs6 | NADH dehydrogenase (ubiquinone) Fe-S protein 6 | 0.611574009 |
| Sorcs2 | sortilin-related VPS10 domain containing receptor 2 | 0.611364633 |
| Cyp46a1 | cytochrome P450, family 46, subfamily a, polypeptide 1 | 0.610762758 |
| Syn3 | synapsin III | 0.610391594 |
| Fxyd6 | FXYD domain-containing ion transport regulator 6 | 0.60998979 |
| Cpne5 | copine V | 0.609582335 |
| Dmrtc1a | DMRT-like family C1a | 0.609417148 |
| Mblac2 | metallo-beta-lactamase domain containing 2 | 0.60926932 |
| Asns | asparagine synthetase | 0.609195842 |
| Satb1 | special AT-rich sequence binding protein 1 | 0.608940427 |
| Tmc7 | transmembrane channel-like gene family 7 | 0.60877457 |
| Sdf2l1 | stromal cell-derived factor 2-like 1 | 0.608632804 |
| Rspo1 | R-spondin homolog (Xenopus laevis) | 0.608210657 |
| Bglap-rs1 | bone gamma-carboxyglutamate protein 3 | 0.607772793 |
| Dusp26 | dual specificity phosphatase 26 (putative) | 0.607432919 |
| Pid1 | phosphotyrosine interaction domain containing 1 | 0.607390816 |
| Higd2a | HIG1 domain family, member 2A | 0.607326826 |
| Podn | podocan | 0.607201812 |
| Odc1 | ornithine decarboxylase, structural 1 | 0.606954384 |
| Fam194a | glutamate rich 6 | 0.606371982 |
| Pm20d2 | peptidase M20 domain containing 2 | 0.605349822 |
| AI593442 | expressed sequence AI593442 | 0.605250806 |
| Fam193b | family with sequence similarity 193, member B | 0.604494031 |
| Slc2a9 | solute carrier family 2 (facilitated glucose transporter), member 9 | 0.604445429 |
| Vsig8 | V-set and immunoglobulin domain containing 8 | 0.603969248 |
| Scn1b | sodium channel, voltage-gated, type I, beta | 0.603825672 |
| Arhgef37 | Rho guanine nucleotide exchange factor (GEF) 37 | 0.603713514 |
| Gnmt | glycine N-methyltransferase | 0.603511012 |
| 2210411K11Rik | transmembrane protein 238 | 0.603404767 |
| Pnma3 | paraneoplastic antigen MA3 | 0.602969946 |
| Sil1 | endoplasmic reticulum chaperone SIL1 homolog (S. cerevisiae) | 0.602593493 |
| 9030617O03Rik | RIKEN cDNA 9030617O03 gene | 0.602492004 |
| Csf1 | colony stimulating factor 1 (macrophage) | 0.602298679 |
| Tm4sf4 | transmembrane 4 superfamily member 4 | 0.601842962 |
| Dusp15 | dual specificity phosphatase-like 15 | 0.60101504 |
| Cpz | carboxypeptidase Z | 0.600936726 |
| C1qa | complement component 1, q subcomponent, alpha polypeptide | 0.600071368 |
| Dse | dermatan sulfate epimerase | 0.598062846 |
| Cthrc1 | collagen triple helix repeat containing 1 | 0.59795466 |
| Prkcb | protein kinase C, beta | 0.597397042 |
| Vldlr | very low density lipoprotein receptor | 0.596539676 |
| Ero1lb | ERO1-like beta (S. cerevisiae) | 0.596476002 |
| Nucb2 | nucleobindin 2 | 0.595914807 |
| Sepw1 | selenoprotein W, muscle 1 | 0.595913981 |
| Crem | cAMP responsive element modulator | 0.595553492 |
| Lingo4 | leucine rich repeat and Ig domain containing 4 | 0.594716909 |
| Rab11fip5 | RAB11 family interacting protein 5 (class I) | 0.594257454 |
| AI118078 | expressed sequence AI118078 | 0.594184551 |
| Lst1 | leukocyte specific transcript 1 | 0.593805351 |
| Sat1 | spermidine/spermine N1-acetyl transferase 1 | 0.592872177 |
| Cebpb | CCAAT/enhancer binding protein (C/EBP), beta | 0.592755891 |
| Amz1 | archaelysin family metallopeptidase 1 | 0.592631822 |
| Pck2 | phosphoenolpyruvate carboxykinase 2 (mitochondrial) | 0.591943752 |
| Hs3st1 | heparan sulfate (glucosamine) 3-O-sulfotransferase 1 | 0.591674654 |
| A330023F24Rik | RIKEN cDNA A330023F24 gene | 0.591468811 |
| Psph | phosphoserine phosphatase | 0.59044517 |
| Lamc2 | laminin, gamma 2 | 0.590255302 |
| Bcl2l14 | BCL2-like 14 (apoptosis facilitator) | 0.586517476 |
| Fam123c | APC membrane recruitment 3 | 0.586477229 |
| Cd82 | CD82 antigen | 0.586286605 |
| Krt222 | keratin 222 | 0.586016829 |
| Defb1 | defensin beta 1 | 0.585127934 |
| Iars | isoleucine-tRNA synthetase | 0.584662514 |
| Trp53i11 | transformation related protein 53 inducible protein 11 | 0.58457539 |
| Ppp1r9a | protein phosphatase 1, regulatory (inhibitor) subunit 9A | 0.583582287 |
| Gm13003 | predicted gene 13003 | 0.583328715 |
| Grik2 | glutamate receptor, ionotropic, kainate 2 (beta 2) | 0.583004935 |
| Susd2 | sushi domain containing 2 | 0.582798068 |
| Aldh1l2 | aldehyde dehydrogenase 1 family, member L2 | 0.582142802 |
| Jag1 | jagged 1 | 0.580579686 |
| Fank1 | fibronectin type 3 and ankyrin repeat domains 1 | 0.58048794 |
| Creb3l1 | cAMP responsive element binding protein 3-like 1 | 0.579377273 |
| Gm5124 | nucleolar and coiled-body phosphoprotein 1 pseudogene | 0.579004313 |
| Cdh18 | cadherin 18 | 0.578752329 |
| Slc7a11 | solute carrier family 7 (cationic amino acid transporter, y+ system), member 11 | 0.578645229 |
| Epm2a | epilepsy, progressive myoclonic epilepsy, type 2 gene alpha | 0.577614955 |
| Vstm2b | V-set and transmembrane domain containing 2B | 0.577367978 |
| Ptgs2 | prostaglandin-endoperoxide synthase 2 | 0.576376332 |
| Pla2g12a | phospholipase A2, group XIIA | 0.575694367 |
| B630019K06Rik | novel protein similar to F-box and leucine-rich repeat protein 17 (Fbxl17) | 0.575579055 |
| Immp2l | IMP2 inner mitochondrial membrane peptidase-like (S. cerevisiae) | 0.575353288 |
| Fam78b | family with sequence similarity 78, member B | 0.57418717 |
| Clptm1l | CLPTM1-like | 0.573751927 |
| Adcy5 | adenylate cyclase 5 | 0.573696253 |
| Rbp3 | retinol binding protein 3, interstitial | 0.573445784 |
| Cplx1 | complexin 1 | 0.572534684 |
| Nr0b2 | nuclear receptor subfamily 0, group B, member 2 | 0.570872313 |
| Gys2 | glycogen synthase 2 | 0.570685179 |
| Cldn23 | claudin 23 | 0.569565237 |
| Zfp454 | zinc finger protein 454 | 0.569365507 |
| Kcnk16 | potassium channel, subfamily K, member 16 | 0.568890147 |
| Pecam1 | platelet/endothelial cell adhesion molecule 1 | 0.568511722 |
| Arhgap6 | Rho GTPase activating protein 6 | 0.568297392 |
| Lcn2 | lipocalin 2 | 0.568285575 |
| Slc34a1 | solute carrier family 34 (sodium phosphate), member 1 | 0.567894561 |
| Cdk18 | cyclin-dependent kinase 18 | 0.56783237 |
| Grid1 | glutamate receptor, ionotropic, delta 1 | 0.567551022 |
| Hpn | hepsin | 0.567516011 |
| Megf11 | multiple EGF-like-domains 11 | 0.567455828 |
| Grid2ip | glutamate receptor, ionotropic, delta 2 (Grid2) interacting protein 1 | 0.566654001 |
| Pcdh7 | protocadherin 7 | 0.566609619 |
| Gpr162 | G protein-coupled receptor 162 | 0.566259008 |
| Tmsb10 | thymosin, beta 10 | 0.566181298 |
| Guca2a | guanylate cyclase activator 2a (guanylin) | 0.565745849 |
| Hk1 | hexokinase 1 | 0.565292319 |
| Rell2 | RELT-like 2 | 0.564604683 |
| Lamb3 | laminin, beta 3 | 0.564549505 |
| Ccl28 | chemokine (C-C motif) ligand 28 | 0.564410996 |
| Col18a1 | collagen, type XVIII, alpha 1 | 0.564340972 |
| Gpr3 | G-protein coupled receptor 3 | 0.563398255 |
| Gmds | GDP-mannose 4, 6-dehydratase | 0.562927097 |
| Slc16a1 | solute carrier family 16 (monocarboxylic acid transporters), member 1 | 0.56267158 |
| Pdxk-ps | pyridoxal (pyridoxine, vitamin B6) kinase, pseudogene | 0.56246569 |
| Ttyh1 | tweety homolog 1 (Drosophila) | 0.562038553 |
| Cxx1c | CAAX box 1C | 0.561655731 |
| Wnk2 | WNK lysine deficient protein kinase 2 | 0.561497304 |
| Bcat1 | branched chain aminotransferase 1, cytosolic | 0.561199255 |
| A730090N16Rik | RIKEN cDNA A730090N16 gene | 0.560582262 |
| Pnma5 | paraneoplastic antigen family 5 | 0.560041639 |
| Fut1 | fucosyltransferase 1 | 0.55856884 |
| Fbxw4 | F-box and WD-40 domain protein 4 | 0.556352054 |
| Nfam1 | Nfat activating molecule with ITAM motif 1 | 0.556114169 |
| Sh2b2 | SH2B adaptor protein 2 | 0.555228296 |
| Sphk1 | sphingosine kinase 1 | 0.554074931 |
| Fam123a | APC membrane recruitment 2 | 0.554028079 |
| 1700045I19Rik | 0.553489556 | |
| Pamr1 | peptidase domain containing associated with muscle regeneration 1 | 0.552938143 |
| Ccl2 | chemokine (C-C motif) ligand 2 | 0.552376175 |
| Krtap17-1 | keratin associated protein 17-1 | 0.552342866 |
| 4933408B17Rik | RIKEN cDNA 4933408B17 gene | 0.55179336 |
| Ankrd34a | ankyrin repeat domain 34A | 0.551667158 |
| Thsd7a | thrombospondin, type I, domain containing 7A | 0.551327321 |
| Nipal2 | NIPA-like domain containing 2 | 0.550709347 |
| Prss23 | protease, serine 23 | 0.550497532 |
| Slc45a1 | solute carrier family 45, member 1 | 0.550012381 |
| Crispld2 | cysteine-rich secretory protein LCCL domain containing 2 | 0.54981684 |
| Flt4 | FMS-like tyrosine kinase 4 | 0.549187997 |
| Tspan17 | tetraspanin 17 | 0.54857052 |
| Cxcl12 | chemokine (C-X-C motif) ligand 12 | 0.547801834 |
| Dio1 | deiodinase, iodothyronine, type I | 0.547304263 |
| Cpne4 | copine IV | 0.546705578 |
| Ggh | gamma-glutamyl hydrolase | 0.546059854 |
| Cdx2 | caudal type homeobox 2 | 0.545939126 |
| Serpinf1 | serine (or cysteine) peptidase inhibitor, clade F, member 1 | 0.544727648 |
| Phldb2 | pleckstrin homology-like domain, family B, member 2 | 0.544172516 |
| Pcp4 | Purkinje cell protein 4 | 0.543816941 |
| Cox6b2 | cytochrome c oxidase subunit VIb polypeptide 2 | 0.543773594 |
| Hyal1 | hyaluronoglucosaminidase 1 | 0.543254829 |
| 5133401N09Rik | idnK gluconokinase homolog (E. coli) | 0.543190819 |
| Fstl5 | follistatin-like 5 | 0.542914906 |
| Mocos | molybdenum cofactor sulfurase | 0.54287276 |
| Adam23 | a disintegrin and metallopeptidase domain 23 | 0.542698942 |
| Cdcp1 | CUB domain containing protein 1 | 0.542156399 |
| Hist2h3c1 | histone cluster 2, H3c1 | 0.541841951 |
| Brsk2 | BR serine/threonine kinase 2 | 0.538870681 |
| Scn2a1 | sodium channel, voltage-gated, type II, alpha 1 | 0.538228988 |
| Dtx4 | deltex 4 homolog (Drosophila) | 0.537662963 |
| Prokr1 | prokineticin receptor 1 | 0.537657 |
| Meig1 | meiosis expressed gene 1 | 0.536780065 |
| Ptpn18 | protein tyrosine phosphatase, non-receptor type 18 | 0.53611968 |
| Apcdd1 | adenomatosis polyposis coli down-regulated 1 | 0.535966599 |
| 0610009L18Rik | RIKEN cDNA 0610009L18 gene | 0.535608589 |
| Klhl35 | kelch-like 35 | 0.535568495 |
| Slc9a3r2 | solute carrier family 9 (sodium/hydrogen exchanger), member 3 regulator 2 | 0.534320769 |
| Ppp1r3f | protein phosphatase 1, regulatory (inhibitor) subunit 3F | 0.533553928 |
| Slc1a4 | solute carrier family 1 (glutamate/neutral amino acid transporter), member 4 | 0.533152072 |
| Tspan9 | tetraspanin 9 | 0.533036784 |
| Sestd1 | SEC14 and spectrin domains 1 | 0.532297981 |
| Cdc42ep3 | CDC42 effector protein (Rho GTPase binding) 3 | 0.530315933 |
| Foxd2 | forkhead box D2 | 0.530313728 |
| Me3 | malic enzyme 3, NADP(+)-dependent, mitochondrial | 0.530060522 |
| Panx1 | pannexin 1 | 0.52951006 |
| Gm600 | nuclear GTPase, germinal center associated | 0.528037758 |
| Bdnf | brain derived neurotrophic factor | 0.527127915 |
| 9430020K01Rik | RIKEN cDNA 9430020K01 gene | 0.527010642 |
| Chrna4 | cholinergic receptor, nicotinic, alpha polypeptide 4 | 0.526979593 |
| Syt5 | synaptotagmin V | 0.526529037 |
| Gm9079 | transmembrane emp24 domain trafficking protein 2 pseudogene | 0.526383072 |
| Gprc5a | G protein-coupled receptor, family C, group 5, member A | 0.526181708 |
| Micall2 | MICAL-like 2 | 0.525621794 |
| E030010A14Rik | transmembrane protein 252 | 0.524739755 |
| Sv2c | synaptic vesicle glycoprotein 2c | 0.524254411 |
| Ccdc147 | cilia and flagella associated protein 58 | 0.523667872 |
| Lix1 | limb expression 1 homolog (chicken) | 0.522908345 |
| Bves | blood vessel epicardial substance | 0.522777516 |
| Adssl1 | adenylosuccinate synthetase like 1 | 0.521119086 |
| Chchd10 | coiled-coil-helix-coiled-coil-helix domain containing 10 | 0.521050099 |
| Anxa3 | annexin A3 | 0.520419527 |
| Popdc3 | popeye domain containing 3 | 0.520177896 |
| Tgm5 | transglutaminase 5 | 0.519549819 |
| Gabra4 | gamma-aminobutyric acid [205] A receptor, subunit alpha 4 | 0.519549459 |
| Chgb | chromogranin B | 0.519527852 |
| Dnm3 | dynamin 3 | 0.51948176 |
| Flrt2 | fibronectin leucine rich transmembrane protein 2 | 0.51940615 |
| Efcab4b | calcium release activated channel regulator 2A | 0.518635908 |
| Thrsp | thyroid hormone responsive | 0.518465178 |
| Pde3a | phosphodiesterase 3A, cGMP inhibited | 0.518316778 |
| 5530401A14Rik | RIKEN cDNA 5530401A14 gene | 0.518248521 |
| Sox13 | SRY (sex determining region Y)-box 13 | 0.517735088 |
| Mospd1 | motile sperm domain containing 1 | 0.517302475 |
| Gm4013 | predicted gene 4013 | 0.51652497 |
| Ecel1 | endothelin converting enzyme-like 1 | 0.516088003 |
| Snai1 | snail family zinc finger 1 | 0.515059854 |
| Usp11 | ubiquitin specific peptidase 11 | 0.51437342 |
| Dok3 | docking protein 3 | 0.512516373 |
| Rpgr | retinitis pigmentosa GTPase regulator | 0.512153082 |
| Tmem179 | transmembrane protein 179 | 0.51041513 |
| 2810055F11Rik | L-3-hydroxyproline dehydratase (trans-) | 0.510198655 |
| Olfm2 | olfactomedin 2 | 0.509691783 |
| Rassf4 | Ras association (RalGDS/AF-6) domain family member 4 | 0.509590045 |
| Mfsd6l | major facilitator superfamily domain containing 6-like | 0.509334024 |
| Fzd1 | frizzled homolog 1 (Drosophila) | 0.508591762 |
| Slc9a9 | solute carrier family 9 (sodium/hydrogen exchanger), member 9 | 0.508573784 |
| Jam2 | junction adhesion molecule 2 | 0.508018521 |
| Fbp2 | fructose bisphosphatase 2 | 0.506136352 |
| Vangl1 | vang-like 1 (van gogh, Drosophila) | 0.505867689 |
| Cth | cystathionase (cystathionine gamma-lyase) | 0.505849807 |
| Lif | leukemia inhibitory factor | 0.505571134 |
| Tmcc3 | transmembrane and coiled coil domains 3 | 0.505191055 |
| Eda | ectodysplasin-A | 0.505125227 |
| B4galt2 | UDP-Gal:betaGlcNAc beta 1,4- galactosyltransferase, polypeptide 2 | 0.504863401 |
| Adam11 | a disintegrin and metallopeptidase domain 11 | 0.503758437 |
| Slc24a3 | solute carrier family 24 (sodium/potassium/calcium exchanger), member 3 | 0.502928773 |
| Six2 | sine oculis-related homeobox 2 | 0.502121707 |
| Fxyd1 | FXYD domain-containing ion transport regulator 1 | 0.500755754 |
| Arhgap22 | Rho GTPase activating protein 22 | 0.500706469 |
| Reln | reelin | 0.500616935 |
| Gm6484 | predicted gene 6484 | 0.500075559 |
| Lrig1 | leucine-rich repeats and immunoglobulin-like domains 1 | 0.50006412 |
| Kcnk10 | potassium channel, subfamily K, member 10 | 0.499310794 |
| Cct6b | chaperonin containing Tcp1, subunit 6b (zeta) | 0.498480854 |
| Proz | protein Z, vitamin K-dependent plasma glycoprotein | 0.497652294 |
| D630003M21Rik | RIKEN cDNA D630003M21 gene | 0.497648845 |
| Spns2 | spinster homolog 2 | 0.495624703 |
| Igsf3 | immunoglobulin superfamily, member 3 | 0.494266146 |
| Sorl1 | sortilin-related receptor, LDLR class A repeats-containing | 0.494252442 |
| Etnk2 | ethanolamine kinase 2 | 0.493718291 |
| B230319C09Rik | RIKEN cDNA B230319C09 gene | 0.493451432 |
| Egfr | epidermal growth factor receptor | 0.493270187 |
| Kcnc2 | potassium voltage gated channel, Shaw-related subfamily, member 2 | 0.493133443 |
| Slc2a13 | solute carrier family 2 (facilitated glucose transporter), member 13 | 0.493109516 |
| A730017C20Rik | RIKEN cDNA A730017C20 gene | 0.492521975 |
| 4933406I18Rik | RIKEN cDNA 4933406I18 gene | 0.491512496 |
| Csf1r | colony stimulating factor 1 receptor | 0.490528886 |
| Gdpd5 | glycerophosphodiester phosphodiesterase domain containing 5 | 0.489072415 |
| Sytl1 | synaptotagmin-like 1 | 0.48833057 |
| Gpr39 | G protein-coupled receptor 39 | 0.488053091 |
| Sdc4 | syndecan 4 | 0.488053091 |
| Cck | cholecystokinin | 0.487917793 |
| Arl4c | ADP-ribosylation factor-like 4C | 0.487721677 |
| Prickle2 | prickle homolog 2 (Drosophila) | 0.487137179 |
| Trib3 | tribbles homolog 3 (Drosophila) | 0.486202764 |
| Echdc3 | enoyl Coenzyme A hydratase domain containing 3 | 0.485687412 |
| Kcnd2 | potassium voltage-gated channel, Shal-related family, member 2 | 0.485468637 |
| Rbfox1 | RNA binding protein, fox-1 homolog (C. elegans) 1 | 0.485098627 |
| Kcnt1 | potassium channel, subfamily T, member 1 | 0.484023836 |
| Olfml3 | olfactomedin-like 3 | 0.482636858 |
| Fam189a2 | family with sequence similarity 189, member A2 | 0.482456241 |
| Inha | inhibin alpha | 0.482402738 |
| Pgr | progesterone receptor | 0.481130446 |
| C77370 | expressed sequence C77370 | 0.48083706 |
| Tmprss6 | transmembrane serine protease 6 | 0.479814945 |
| Chac1 | ChaC, cation transport regulator 1 | 0.479050615 |
| Mgam | maltase-glucoamylase | 0.479043974 |
| Gpr27 | G protein-coupled receptor 27 | 0.478791684 |
| Pon3 | paraoxonase 3 | 0.478585967 |
| Kcnip4 | Kv channel interacting protein 4 | 0.478231147 |
| Pkd2l1 | polycystic kidney disease 2-like 1 | 0.477717622 |
| Wif1 | Wnt inhibitory factor 1 | 0.474944223 |
| Gm5458 | predicted gene 5458 | 0.474835597 |
| D630032N06Rik | amyloid beta precursor protein (cytoplasmic tail) binding protein 2, opposite strand | 0.47430928 |
| Cpn1 | carboxypeptidase N, polypeptide 1 | 0.47341916 |
| Cyp4f39 | cytochrome P450, family 4, subfamily f, polypeptide 39 | 0.472645361 |
| Mfhas1 | malignant fibrous histiocytoma amplified sequence 1 | 0.472347327 |
| Cgref1 | cell growth regulator with EF hand domain 1 | 0.472065842 |
| Xlr3c | X-linked lymphocyte-regulated 3C | 0.472042938 |
| 1500009C09Rik | RIKEN cDNA 1500009C09 gene | 0.471941518 |
| Tmeff1 | transmembrane protein with EGF-like and two follistatin-like domains 1 | 0.471470693 |
| Dok6 | docking protein 6 | 0.471196262 |
| Fxyd2 | FXYD domain-containing ion transport regulator 2 | 0.468382799 |
| Fbln5 | fibulin 5 | 0.468123144 |
| Rbms1 | RNA binding motif, single stranded interacting protein 1 | 0.468038788 |
| Spon2 | spondin 2, extracellular matrix protein | 0.467993371 |
| Hist1h4h | histone cluster 1, H4h | 0.467095678 |
| Acsl6 | acyl-CoA synthetase long-chain family member 6 | 0.46671379 |
| Fam184b | family with sequence similarity 184, member B | 0.465231278 |
| Fbp1 | fructose bisphosphatase 1 | 0.464792921 |
| Epha5 | Eph receptor A5 | 0.463326145 |
| Lrp3 | low density lipoprotein receptor-related protein 3 | 0.462940922 |
| Lsamp | limbic system-associated membrane protein | 0.462187453 |
| Fa2h | fatty acid 2-hydroxylase | 0.461448004 |
| 4833424O15Rik | lipid phosphate phosphatase-related protein type 5 | 0.46017994 |
| Gm16197 | tumor protein p53 pathway corepressor 1 | 0.460135286 |
| Amdhd2 | amidohydrolase domain containing 2 | 0.459810081 |
| Gap43 | growth associated protein 43 | 0.458886732 |
| Apof | apolipoprotein F | 0.458517912 |
| Stc2 | stanniocalcin 2 | 0.457949367 |
| Ncan | neurocan | 0.457108959 |
| Pgr15l | G protein-coupled receptor 15-like | 0.455173982 |
| Rgs20 | regulator of G-protein signaling 20 | 0.454650549 |
| Moxd1 | monooxygenase, DBH-like 1 | 0.45462849 |
| Pmepa1 | prostate transmembrane protein, androgen induced 1 | 0.45342945 |
| Chrd | chordin | 0.452735393 |
| Tspyl3 | TSPY-like 3 | 0.452663222 |
| Cacng3 | calcium channel, voltage-dependent, gamma subunit 3 | 0.452390331 |
| Creb3l3 | cAMP responsive element binding protein 3-like 3 | 0.451444331 |
| Gsg1l | GSG1-like | 0.450681458 |
| Btbd11 | BTB (POZ) domain containing 11 | 0.450531536 |
| Prkd3 | protein kinase D3 | 0.4500228 |
| Sorcs1 | sortilin-related VPS10 domain containing receptor 1 | 0.449598772 |
| Hs3st5 | heparan sulfate (glucosamine) 3-O-sulfotransferase 5 | 0.448571541 |
| Kcp | kielin/chordin-like protein | 0.448419214 |
| 1700003M07Rik | RIKEN cDNA 1700003M07 gene | 0.448211012 |
| Rassf10 | Ras association (RalGDS/AF-6) domain family (N-terminal) member 10 | 0.447338862 |
| Serpina1a | serine (or cysteine) peptidase inhibitor, clade A, member 1A | 0.447131162 |
| Tpd52l1 | tumor protein D52-like 1 | 0.445979716 |
| Gpr125 | adhesion G protein-coupled receptor A2 | 0.445707765 |
| Chrna7 | cholinergic receptor, nicotinic, alpha polypeptide 7 | 0.445272371 |
| Sox12 | SRY (sex determining region Y)-box 12 | 0.445201389 |
| Eif4ebp1 | eukaryotic translation initiation factor 4E binding protein 1 | 0.445053291 |
| Serpina3n | serine (or cysteine) peptidase inhibitor, clade A, member 3N | 0.44452609 |
| Ptpla | 3-hydroxyacyl-CoA dehydratase 1 | 0.443642659 |
| Tox | thymocyte selection-associated high mobility group box | 0.443461265 |
| Matn2 | matrilin 2 | 0.442632104 |
| Serpina10 | serine (or cysteine) peptidase inhibitor, clade A (alpha-1 antiproteinase, antitrypsin), member 10 | 0.442524734 |
| Ttr | transthyretin | 0.441082369 |
| Rprm | reprimo, TP53 dependent G2 arrest mediator candidate | 0.440569033 |
| Sod3 | superoxide dismutase 3, extracellular | 0.440059345 |
| Pdyn | prodynorphin | 0.438910899 |
| Spp2 | secreted phosphoprotein 2 | 0.436683523 |
| Wdr64 | WD repeat domain 64 | 0.436256944 |
| Cntnap2 | contactin associated protein-like 2 | 0.433802418 |
| 4931408A02Rik | eva-1 homolog C (C. elegans) | 0.433757317 |
| 2900011O08Rik | RIKEN cDNA 2900011O08 gene | 0.433141407 |
| Spry1 | sprouty homolog 1 (Drosophila) | 0.433108382 |
| Atf5 | activating transcription factor 5 | 0.432373497 |
| Scrt2 | scratch homolog 2, zinc finger protein (Drosophila) | 0.429872284 |
| Pax2 | paired box 2 | 0.429377947 |
| Ror2 | receptor tyrosine kinase-like orphan receptor 2 | 0.427581103 |
| Tgfb2 | transforming growth factor, beta 2 | 0.42699468 |
| Rbp7 | retinol binding protein 7, cellular | 0.425788828 |
| Serpina1e | serine (or cysteine) peptidase inhibitor, clade A, member 1E | 0.423974676 |
| Clybl | citrate lyase beta like | 0.423962921 |
| Slc2a6 | solute carrier family 2 (facilitated glucose transporter), member 6 | 0.423390264 |
| 9430083A17Rik | RIKEN cDNA 9430083A17 gene | 0.422882862 |
| Btbd16 | BTB (POZ) domain containing 16 | 0.422806658 |
| Col11a1 | collagen, type XI, alpha 1 | 0.422507835 |
| Gabrg2 | gamma-aminobutyric acid [205] A receptor, subunit gamma 2 | 0.422378996 |
| Slc6a9 | solute carrier family 6 (neurotransmitter transporter, glycine), member 9 | 0.422115585 |
| Wnt4 | wingless-type MMTV integration site family, member 4 | 0.420984786 |
| Phlda3 | pleckstrin homology-like domain, family A, member 3 | 0.420704746 |
| 9530008L14Rik | androgen dependent TFPI regulating protein | 0.419185291 |
| Ano3 | anoctamin 3 | 0.419042942 |
| Lass4 | ceramide synthase 4 | 0.418630694 |
| Opn3 | opsin 3 | 0.417981212 |
| Ms4a10 | membrane-spanning 4-domains, subfamily A, member 10 | 0.416691045 |
| Abcb1a | ATP-binding cassette, sub-family B (MDR/TAP), member 1A | 0.4144299 |
| Adcy8 | adenylate cyclase 8 | 0.413910284 |
| Metrnl | meteorin, glial cell differentiation regulator-like | 0.413726708 |
| Tnfrsf21 | tumor necrosis factor receptor superfamily, member 21 | 0.413680827 |
| Plcxd1 | phosphatidylinositol-specific phospholipase C, X domain containing 1 | 0.410302543 |
| Hapln1 | hyaluronan and proteoglycan link protein 1 | 0.40804778 |
| A630023A22Rik | RIKEN cDNA A630023A22 gene | 0.407157815 |
| Clec2l | C-type lectin domain family 2, member L | 0.406483867 |
| Alpl | alkaline phosphatase, liver/bone/kidney | 0.406236 |
| Lama4 | laminin, alpha 4 | 0.405310653 |
| Ugt3a2 | UDP glycosyltransferases 3 family, polypeptide A2 | 0.405024196 |
| Gm12409 | predicted gene 12409 | 0.401299148 |
| Ptprk | protein tyrosine phosphatase, receptor type, K | 0.401015526 |
| Ltb | lymphotoxin B | 0.399966202 |
| Bend4 | BEN domain containing 4 | 0.398331092 |
| 2200002K05Rik | V-set and transmembrane domain containing 5 | 0.398173745 |
| Sept4 | septin 4 | 0.396469008 |
| Mgat4a | mannoside acetylglucosaminyltransferase 4, isoenzyme A | 0.395944466 |
| Impa2 | inositol (myo)-1(or 4)-monophosphatase 2 | 0.395387728 |
| Ntng2 | netrin G2 | 0.394872828 |
| Ngfr | nerve growth factor receptor (TNFR superfamily, member 16) | 0.393618518 |
| Aard | alanine and arginine rich domain containing protein | 0.391346921 |
| Nxf7 | nuclear RNA export factor 7 | 0.390829155 |
| Dpep1 | dipeptidase 1 (renal) | 0.389855124 |
| Pcsk6 | proprotein convertase subtilisin/kexin type 6 | 0.389193629 |
| Stx11 | syntaxin 11 | 0.388097219 |
| 3632451O06Rik | RIKEN cDNA 3632451O06 gene | 0.387935847 |
| Anxa10 | annexin A10 | 0.386387412 |
| B4galnt4 | beta-1,4-N-acetyl-galactosaminyl transferase 4 | 0.385525983 |
| Neurl3 | neuralized E3 ubiquitin protein ligase 3 | 0.385042607 |
| Adm2 | adrenomedullin 2 | 0.384258745 |
| Jdp2 | Jun dimerization protein 2 | 0.383851449 |
| Ephb6 | Eph receptor B6 | 0.383032841 |
| Gm266 | predicted gene 266 | 0.382454493 |
| Slc1a1 | solute carrier family 1 (neuronal/epithelial high affinity glutamate transporter, system Xag), member 1 | 0.37803193 |
| Hsd17b13 | hydroxysteroid (17-beta) dehydrogenase 13 | 0.374238529 |
| Pon2 | paraoxonase 2 | 0.373826306 |
| Gm9767 | predicted gene 9767 | 0.371473191 |
| Reep1 | receptor accessory protein 1 | 0.370098194 |
| Sgk1 | serum/glucocorticoid regulated kinase 1 | 0.370028937 |
| C87198 | expressed sequence C87198 | 0.368031205 |
| Ephb2 | Eph receptor B2 | 0.367585051 |
| Smyd3 | SET and MYND domain containing 3 | 0.367320164 |
| Tmem35 | transmembrane protein 35 | 0.366887587 |
| Map6d1 | MAP6 domain containing 1 | 0.365035834 |
| Lats2 | large tumor suppressor 2 | 0.364085704 |
| Lor | loricrin | 0.358585734 |
| Rbm11 | RNA binding motif protein 11 | 0.357161876 |
| Oit1 | oncoprotein induced transcript 1 | 0.357003469 |
| Lrfn5 | leucine rich repeat and fibronectin type III domain containing 5 | 0.356328554 |
| Fgf21 | fibroblast growth factor 21 | 0.356108802 |
| Cntnap4 | contactin associated protein-like 4 | 0.352325304 |
| Lta | lymphotoxin A | 0.352300884 |
| Fcer2a | Fc receptor, IgE, low affinity II, alpha polypeptide | 0.35200553 |
| Pik3r5 | phosphoinositide-3-kinase, regulatory subunit 5, p101 | 0.351771376 |
| Igfbp7 | insulin-like growth factor binding protein 7 | 0.351678733 |
| St6galnac3 | ST6 (alpha-N-acetyl-neuraminyl-2,3-beta-galactosyl-1,3)-N-acetylgalactosaminide alpha-2,6-sialyltransferase 3 | 0.350396435 |
| Mdfic | MyoD family inhibitor domain containing | 0.347474738 |
| Twist2 | twist basic helix-loop-helix transcription factor 2 | 0.345151103 |
| Atp8a2 | ATPase, aminophospholipid transporter-like, class I, type 8A, member 2 | 0.345045853 |
| Grid2 | glutamate receptor, ionotropic, delta 2 | 0.344730296 |
| Nupr1 | nuclear protein transcription regulator 1 | 0.343790122 |
| St7 | suppression of tumorigenicity 7 | 0.341103154 |
| Col5a3 | collagen, type V, alpha 3 | 0.340640057 |
| Serpine2 | serine (or cysteine) peptidase inhibitor, clade E, member 2 | 0.340022 |
| Nrn1 | neuritin 1 | 0.339807594 |
| Matn1 | matrilin 1, cartilage matrix protein | 0.338057369 |
| Cldn14 | claudin 14 | 0.335131686 |
| 2310007L24Rik | proline rich 29 | 0.334416978 |
| Nptx2 | neuronal pentraxin 2 | 0.332913666 |
| Camk1d | calcium/calmodulin-dependent protein kinase ID | 0.330604897 |
| Spred1 | sprouty protein with EVH-1 domain 1, related sequence | 0.329723816 |
| Chsy3 | chondroitin sulfate synthase 3 | 0.328963631 |
| Timp2 | tissue inhibitor of metalloproteinase 2 | 0.325524944 |
| Sdc3 | syndecan 3 | 0.325292621 |
| Tex13 | testis expressed gene 13 | 0.322352259 |
| Kcna4 | potassium voltage-gated channel, shaker-related subfamily, member 4 | 0.321377314 |
| Nhlrc1 | NHL repeat containing 1 | 0.32113237 |
| Srgap3 | SLIT-ROBO Rho GTPase activating protein 3 | 0.320107859 |
| P4ha2 | procollagen-proline, 2-oxoglutarate 4-dioxygenase (proline 4-hydroxylase), alpha II polypeptide | 0.316579557 |
| Asb4 | ankyrin repeat and SOCS box-containing 4 | 0.315536761 |
| Ccnb1ip1 | cyclin B1 interacting protein 1 | 0.314669663 |
| Gm5148 | predicted gene 5148 | 0.31390937 |
| Rin2 | Ras and Rab interactor 2 | 0.312897058 |
| Samd5 | sterile alpha motif domain containing 5 | 0.309111664 |
| C3 | complement component 3 | 0.30745134 |
| Extl1 | exostoses (multiple)-like 1 | 0.306916901 |
| Plcg2 | phospholipase C, gamma 2 | 0.306345168 |
| Marveld1 | MARVEL (membrane-associating) domain containing 1 | 0.305647358 |
| Thnsl2 | threonine synthase-like 2 (bacterial) | 0.304075187 |
| Ank1 | ankyrin 1, erythroid | 0.300809076 |
| Lyzl4 | lysozyme-like 4 | 0.299504586 |
| Slc26a4 | solute carrier family 26, member 4 | 0.299454766 |
| Galnt5 | UDP-N-acetyl-alpha-D-galactosamine:polypeptide N-acetylgalactosaminyltransferase 5 | 0.298408389 |
| Nlgn1 | neuroligin 1 | 0.29794749 |
| Hebp1 | heme binding protein 1 | 0.29691667 |
| Clstn2 | calsyntenin 2 | 0.296330699 |
| Qrich2 | glutamine rich 2 | 0.296324537 |
| Dennd2c | DENN/MADD domain containing 2C | 0.295180638 |
| Neto1 | neuropilin (NRP) and tolloid (TLL)-like 1 | 0.293062443 |
| Vegfc | vascular endothelial growth factor C | 0.290800166 |
| Fibcd1 | fibrinogen C domain containing 1 | 0.289488913 |
| Dync1i1 | dynein cytoplasmic 1 intermediate chain 1 | 0.28774046 |
| Emp1 | epithelial membrane protein 1 | 0.286798623 |
| Lrmp | lymphoid-restricted membrane protein | 0.286067994 |
| Gpr135 | G protein-coupled receptor 135 | 0.285072346 |
| Aldh1l1 | aldehyde dehydrogenase 1 family, member L1 | 0.281432335 |
| Accn1 | acid-sensing (proton-gated) ion channel 2 | 0.278307173 |
| Rrad | Ras-related associated with diabetes | 0.276338791 |
| Pros1 | protein S (alpha) | 0.275167121 |
| Tpbg | trophoblast glycoprotein | 0.275117535 |
| Adarb2 | adenosine deaminase, RNA-specific, B2 | 0.273601871 |
| Mrc2 | mannose receptor, C type 2 | 0.272464467 |
| Srpk3 | serine/arginine-rich protein specific kinase 3 | 0.270663077 |
| Gnai1 | guanine nucleotide binding protein (G protein), alpha inhibiting 1 | 0.267592577 |
| Slit1 | slit homolog 1 (Drosophila) | 0.265900796 |
| Stmn2 | stathmin-like 2 | 0.265331892 |
| Ptprg | protein tyrosine phosphatase, receptor type, G | 0.264131817 |
| Rasgef1c | RasGEF domain family, member 1C | 0.262541974 |
| Sct | secretin | 0.262174632 |
| Ccl20 | chemokine (C-C motif) ligand 20 | 0.261951204 |
| Gfra1 | glial cell line derived neurotrophic factor family receptor alpha 1 | 0.259376558 |
| Kcnab1 | potassium voltage-gated channel, shaker-related subfamily, beta member 1 | 0.25893825 |
| Olfr5 | olfactory receptor 5 | 0.258226685 |
| Lbp | lipopolysaccharide binding protein | 0.257922583 |
| Cd55 | CD55 molecule, decay accelerating factor for complement | 0.257797468 |
| Ppargc1a | peroxisome proliferative activated receptor, gamma, coactivator 1 alpha | 0.251646424 |
| Ncam2 | neural cell adhesion molecule 2 | 0.251583637 |
| Diras2 | DIRAS family, GTP-binding RAS-like 2 | 0.246448824 |
| Gm2694 | predicted gene 2694 | 0.246083529 |
| Slitrk5 | SLIT and NTRK-like family, member 5 | 0.24433628 |
| 5033411D12Rik | succinyl-CoA glutarate-CoA transferase | 0.243659774 |
| Ntn1 | netrin 1 | 0.242154547 |
| Ndst4 | N-deacetylase/N-sulfotransferase (heparin glucosaminyl) 4 | 0.240441862 |
| Pdzrn3 | PDZ domain containing RING finger 3 | 0.239420734 |
| Arrb1 | arrestin, beta 1 | 0.239312888 |
| Ankrd55 | ankyrin repeat domain 55 | 0.236663644 |
| Ppfibp2 | PTPRF interacting protein, binding protein 2 (liprin beta 2) | 0.236489822 |
| Vnn3 | vanin 3 | 0.236059099 |
| Csf2ra | colony stimulating factor 2 receptor, alpha, low-affinity (granulocyte-macrophage) | 0.235650394 |
| Cdh23 | cadherin 23 (otocadherin) | 0.234196269 |
| Shh | sonic hedgehog | 0.233030387 |
| Slc22a4 | solute carrier family 22 (organic cation transporter), member 4 | 0.231516994 |
| Rtn1 | reticulon 1 | 0.231040872 |
| Tlr4 | toll-like receptor 4 | 0.228888994 |
| Efcab6 | EF-hand calcium binding domain 6 | 0.227533362 |
| Mgmt | O-6-methylguanine-DNA methyltransferase | 0.225198637 |
| Apba2 | amyloid beta (A4) precursor protein-binding, family A, member 2 | 0.224514418 |
| Tmc1 | transmembrane channel-like gene family 1 | 0.224319975 |
| Gm11747 | predicted gene 11747 | 0.220312003 |
| Slc2a3 | solute carrier family 2 (facilitated glucose transporter), member 3 | 0.218160225 |
| C1qtnf1 | C1q and tumor necrosis factor related protein 1 | 0.217230713 |
| Hpx | hemopexin | 0.213534339 |
| Enpep | glutamyl aminopeptidase | 0.212767544 |
| Ugt1a9 | UDP glucuronosyltransferase 1 family, polypeptide A9 | 0.212466899 |
| Hist2h3c2 | histone cluster 2, H3c2 | 0.209087685 |
| Cyb5r2 | cytochrome b5 reductase 2 | 0.205178291 |
| Syt17 | synaptotagmin XVII | 0.203363124 |
| Cartpt | CART prepropeptide | 0.199434928 |
| Cxcl1 | chemokine (C-X-C motif) ligand 1 | 0.198065567 |
| Basp1 | brain abundant, membrane attached signal protein 1 | 0.198053211 |
| Dlgap2 | discs, large (Drosophila) homolog-associated protein 2 | 0.195493155 |
| Ngf | nerve growth factor | 0.194590071 |
| Egfl6 | EGF-like-domain, multiple 6 | 0.194556354 |
| Dapl1 | death associated protein-like 1 | 0.193472443 |
| Clec2d | C-type lectin domain family 2, member d | 0.190972922 |
| Gm1078 | SH3 domain binding kinase family, member 3 | 0.190153975 |
| Foxp2 | forkhead box P2 | 0.188326771 |
| Tceal5 | transcription elongation factor A (SII)-like 5 | 0.18412788 |
| Galnt13 | UDP-N-acetyl-alpha-D-galactosamine:polypeptide N-acetylgalactosaminyltransferase 13 | 0.183760679 |
| Parm1 | prostate androgen-regulated mucin-like protein 1 | 0.183429807 |
| C1rl | complement component 1, r subcomponent-like | 0.180918269 |
| Nmnat2 | nicotinamide nucleotide adenylyltransferase 2 | 0.176579528 |
| Ptpn14 | protein tyrosine phosphatase, non-receptor type 14 | 0.17610283 |
| Maf | avian musculoaponeurotic fibrosarcoma (v-maf) AS42 oncogene homolog | 0.171884338 |
| Serpina3i | serine (or cysteine) peptidase inhibitor, clade A, member 3I | 0.168474249 |
| Scn1a | sodium channel, voltage-gated, type I, alpha | 0.1674184 |
| Olfr1349 | olfactory receptor 1349 | 0.166193977 |
| Itih1 | inter-alpha trypsin inhibitor, heavy chain 1 | 0.163363773 |
| Kcnmb4 | potassium large conductance calcium-activated channel, subfamily M, beta member 4 | 0.16256854 |
| Pde5a | phosphodiesterase 5A, cGMP-specific | 0.162434501 |
| Tbx3 | T-box 3 | 0.156079179 |
| Cbln1 | cerebellin 1 precursor protein | 0.153776825 |
| Bhlhe22 | basic helix-loop-helix family, member e22 | 0.148392491 |
| Nov | nephroblastoma overexpressed gene | 0.14473944 |
| Tmem45a | transmembrane protein 45a | 0.144715364 |
| Rab27b | RAB27B, member RAS oncogene family | 0.143085561 |
| Usp13 | ubiquitin specific peptidase 13 (isopeptidase T-3) | 0.142237128 |
| Slitrk3 | SLIT and NTRK-like family, member 3 | 0.140822523 |
| Gabra3 | gamma-aminobutyric acid [205] A receptor, subunit alpha 3 | 0.139113082 |
| 1700040L02Rik | RIKEN cDNA 1700040L02 gene | 0.13895407 |
| Fnbp1l | formin binding protein 1-like | 0.134583178 |
| Mal2 | mal, T cell differentiation protein 2 | 0.134264518 |
| Trpc6 | transient receptor potential cation channel, subfamily C, member 6 | 0.132430745 |
| Slc6a5 | solute carrier family 6 (neurotransmitter transporter, glycine), member 5 | 0.128878186 |
| Cdh10 | cadherin 10 | 0.126992922 |
| Tceal6 | transcription elongation factor A (SII)-like 6 | 0.125285382 |
| Car2 | carbonic anhydrase 2 | 0.124819912 |
| Syk | spleen tyrosine kinase | 0.121910982 |
| Slc22a21 | solute carrier family 22 (organic cation transporter), member 21 | 0.118594581 |
| Klhl13 | kelch-like 13 | 0.117206948 |
| Htra1 | HtrA serine peptidase 1 | 0.116332008 |
| 1700058G18Rik | potassium large conductance calcium-activated channel, subfamily M, beta member 4, opposite strand 1 | 0.113522487 |
| Zcchc3 | zinc finger, CCHC domain containing 3 | 0.112879859 |
| Gng3 | guanine nucleotide binding protein (G protein), gamma 3 | 0.110592848 |
| Epdr1 | ependymin related protein 1 (zebrafish) | 0.109393582 |
| A830018L16Rik | RIKEN cDNA A830018L16 gene | 0.107526935 |
| Cadm3 | cell adhesion molecule 3 | 0.104908974 |
| Lrch2 | leucine-rich repeats and calponin homology (CH) domain containing 2 | 0.102882535 |
| Evc | Ellis van Creveld gene syndrome | 0.100611701 |
| Morc1 | microrchidia 1 | 0.0985958 |
| Tac1 | tachykinin 1 | 0.096133295 |
| Kit | kit oncogene | 0.088750558 |
| Evc2 | Ellis van Creveld syndrome 2 | 0.076413428 |
| Hecw2 | HECT, C2 and WW domain containing E3 ubiquitin protein ligase 2 | 0.074567459 |
| Tram1l1 | translocation associated membrane protein 1-like 1 | 0.06836634 |
| 2810011L19Rik | Tcl1 upstream neural differentiation associated RNA | 0.066992342 |
| Luzp2 | leucine zipper protein 2 | 0.056050071 |
| Olfm3 | olfactomedin 3 | 0.051639541 |
| Tshz2 | teashirt zinc finger family member 2 | 0.04888718 |
| Mef2c | myocyte enhancer factor 2C | 0.040850569 |
| Thbs1 | thrombospondin 1 | 0.031492672 |
| Cntn5 | contactin 5 | 0.018557421 |
| Mirlet7c-2 | microRNA let7c-2 | 0 |
| Snord89 | small nucleolar RNA, C/D box 89 | 0 |
B. Table of functional enrichment analysis of differently expressed gene in miR-30d KO line
| #Category | Term | Count | % | P value | Fold Enrichment | Bonferroni | Benjamini | FDR |
| SP_PIR_KEYWORDS | membrane | 500 | 35.49 | 5.5904E-13 | 1.299942087 | 2.7335E-10 | 6.83374E-11 | 8.02458E-10 |
| GOTERM_CC_FAT | GO:0031224~intrinsic to membrane | 450 | 31.94 | 0.019956867 | 1.072646299 | 0.999411868 | 0.226246563 | 24.26064199 |
| SP_PIR_KEYWORDS | transmembrane | 412 | 29.24 | 0.002030492 | 1.126376858 | 0.629877066 | 0.04056752 | 2.875652529 |
| SP_PIR_KEYWORDS | glycoprotein | 405 | 28.74 | 1.29332E-26 | 1.610725742 | 6.32431E-24 | 6.32431E-24 | 1.8566E-23 |
| UP_SEQ_FEATURE | glycosylation site:N-linked (GlcNAc…) | 387 | 27.47 | 1.98913E-20 | 1.51283123 | 5.77842E-17 | 5.77842E-17 | 3.56893E-17 |
| UP_SEQ_FEATURE | transmembrane region | 386 | 27.40 | 4.62671E-08 | 1.263488386 | 0.000134397 | 2.24007E-05 | 8.30133E-05 |
| SP_PIR_KEYWORDS | signal | 328 | 23.28 | 1.5675E-19 | 1.581198783 | 7.66509E-17 | 3.83254E-17 | 2.25021E-16 |
| UP_SEQ_FEATURE | signal peptide | 328 | 23.28 | 1.41416E-15 | 1.490338262 | 4.19276E-12 | 2.09632E-12 | 2.58682E-12 |
| GOTERM_MF_FAT | GO:0043167~ion binding | 307 | 21.79 | 0.005222163 | 1.130822142 | 0.989432269 | 0.194799764 | 7.803105021 |
| GOTERM_MF_FAT | GO:0043169~cation binding | 296 | 21.01 | 0.022487987 | 1.104055668 | 0.999999997 | 0.397578859 | 29.73705373 |
| GOTERM_MF_FAT | GO:0046872~metal ion binding | 294 | 20.87 | 0.020878538 | 1.106564885 | 0.999999989 | 0.399096153 | 27.92035923 |
| UP_SEQ_FEATURE | topological domain:Cytoplasmic | 288 | 20.44 | 4.33091E-10 | 1.394730669 | 1.25813E-06 | 3.14532E-07 | 7.7706E-07 |
| GOTERM_CC_FAT | GO:0005886~plasma membrane | 269 | 19.09 | 3.77131E-07 | 1.304914375 | 0.000139152 | 4.6386E-05 | 0.000519845 |
| SP_PIR_KEYWORDS | disulfide bond | 265 | 18.81 | 1.11614E-13 | 1.536716877 | 5.45614E-11 | 1.81871E-11 | 1.60172E-10 |
| UP_SEQ_FEATURE | disulfide bond | 253 | 17.96 | 6.16143E-10 | 1.431755098 | 1.78989E-06 | 3.57979E-07 | 1.1055E-06 |
| UP_SEQ_FEATURE | topological domain:Extracellular | 237 | 16.82 | 2.60387E-10 | 1.467680301 | 7.56422E-07 | 2.52141E-07 | 4.67191E-07 |
| GOTERM_CC_FAT | GO:0005576~extracellular region | 190 | 13.48 | 1.21468E-11 | 1.594298599 | 4.48218E-09 | 4.48218E-09 | 1.67435E-08 |
| SP_PIR_KEYWORDS | Secreted | 163 | 11.57 | 1.43606E-10 | 1.64349481 | 7.02232E-08 | 1.40446E-08 | 2.06151E-07 |
| GOTERM_CC_FAT | GO:0044459~plasma membrane part | 160 | 11.36 | 1.10762E-05 | 1.381208184 | 0.004078807 | 0.000817096 | 0.015266644 |
| SP_PIR_KEYWORDS | cell membrane | 153 | 10.86 | 0.000959065 | 1.278801523 | 0.374502324 | 0.025730279 | 1.367990105 |
| SP_PIR_KEYWORDS | transport | 134 | 9.51 | 0.010206005 | 1.221230635 | 0.993371513 | 0.145092356 | 13.69336697 |
| GOTERM_CC_FAT | GO:0044421~extracellular region part | 103 | 7.31 | 3.92575E-10 | 1.875951513 | 1.4486E-07 | 7.24301E-08 | 5.41135E-07 |
| GOTERM_MF_FAT | GO:0005509~calcium ion binding | 95 | 6.74 | 1.48853E-06 | 1.638832632 | 0.001292701 | 0.000323332 | 0.002309709 |
| GOTERM_BP_FAT | GO:0007242~intracellular signaling cascade | 95 | 6.74 | 4.89843E-05 | 1.50563069 | 0.136160886 | 0.009710462 | 0.088128692 |
| SP_PIR_KEYWORDS | calcium | 84 | 5.96 | 6.97341E-06 | 1.64524654 | 0.003404202 | 0.00042616 | 0.01001012 |
| GOTERM_BP_FAT | GO:0006811~ion transport | 83 | 5.89 | 2.42856E-06 | 1.690495605 | 0.007230288 | 0.001208694 | 0.004371005 |
| GOTERM_BP_FAT | GO:0007155~cell adhesion | 72 | 5.11 | 3.8314E-07 | 1.861168024 | 0.001144167 | 0.000381535 | 0.0006896 |
| GOTERM_BP_FAT | GO:0022610~biological adhesion | 72 | 5.11 | 4.07803E-07 | 1.857856337 | 0.001217772 | 0.000304582 | 0.000733989 |
| UP_SEQ_FEATURE | mutagenesis site | 69 | 4.90 | 0.02556917 | 1.284853028 | 1 | 0.938384117 | 37.16979563 |
| GOTERM_BP_FAT | GO:0042127~regulation of cell proliferation | 67 | 4.76 | 2.95497E-06 | 1.805961445 | 0.008790601 | 0.001260557 | 0.005318429 |
| GOTERM_MF_FAT | GO:0003700~transcription factor activity | 67 | 4.76 | 0.043134167 | 1.251132672 | 1 | 0.542491477 | 49.54909588 |
| GOTERM_CC_FAT | GO:0005615~extracellular space | 64 | 4.54 | 1.00657E-05 | 1.765567879 | 0.003707359 | 0.000928131 | 0.013873857 |
| SP_PIR_KEYWORDS | ion transport | 64 | 4.54 | 4.67673E-05 | 1.687521137 | 0.022610216 | 0.001903997 | 0.067115226 |
| GOTERM_BP_FAT | GO:0006812~cation transport | 63 | 4.47 | 1.08564E-05 | 1.77398224 | 0.031918717 | 0.004046693 | 0.019538377 |
| GOTERM_BP_FAT | GO:0030001~metal ion transport | 59 | 4.19 | 1.43235E-06 | 1.935734051 | 0.004270714 | 0.000855606 | 0.002578008 |
| GOTERM_CC_FAT | GO:0030054~cell junction | 59 | 4.19 | 2.1924E-05 | 1.769617885 | 0.008057401 | 0.001347431 | 0.030216301 |
| GOTERM_BP_FAT | GO:0007049~cell cycle | 59 | 4.19 | 0.007812757 | 1.400318249 | 1 | 0.212699118 | 13.16597352 |
| GOTERM_CC_FAT | GO:0031226~intrinsic to plasma membrane | 58 | 4.12 | 0.002528612 | 1.481201902 | 0.607115498 | 0.060382724 | 3.429718258 |
| GOTERM_BP_FAT | GO:0042592~homeostatic process | 57 | 4.05 | 0.007240597 | 1.415395974 | 1 | 0.208226304 | 12.26027218 |
| GOTERM_CC_FAT | GO:0042995~cell projection | 57 | 4.05 | 0.00911327 | 1.397437381 | 0.965891659 | 0.13130126 | 11.85573859 |
| GOTERM_CC_FAT | GO:0005887~integral to plasma membrane | 56 | 3.97 | 0.00280153 | 1.486684629 | 0.644850147 | 0.06265228 | 3.793297108 |
| GOTERM_BP_FAT | GO:0043067~regulation of programmed cell death | 56 | 3.97 | 0.004785632 | 1.450160085 | 0.999999404 | 0.162187055 | 8.271943889 |
| GOTERM_BP_FAT | GO:0010941~regulation of cell death | 56 | 3.97 | 0.005337415 | 1.442432767 | 0.999999886 | 0.173345097 | 9.183009011 |
| SP_PIR_KEYWORDS | lipoprotein | 56 | 3.97 | 0.016582445 | 1.361262276 | 0.9997189 | 0.193602882 | 21.34058885 |
| SP_PIR_KEYWORDS | cell junction | 54 | 3.83 | 2.68012E-06 | 1.972317235 | 0.001309721 | 0.000187208 | 0.003847339 |
| GOTERM_BP_FAT | GO:0006955~immune response | 54 | 3.83 | 0.00027018 | 1.66260392 | 0.553987447 | 0.030576933 | 0.485174428 |
| GOTERM_MF_FAT | GO:0022838~substrate specific channel activity | 53 | 3.76 | 2.68913E-07 | 2.133357567 | 0.000233658 | 0.000116836 | 0.000417267 |
| GOTERM_MF_FAT | GO:0015267~channel activity | 53 | 3.76 | 4.19245E-07 | 2.104133491 | 0.000364257 | 0.000121434 | 0.000650533 |
| GOTERM_MF_FAT | GO:0022803~passive transmembrane transporter activity | 53 | 3.76 | 4.19245E-07 | 2.104133491 | 0.000364257 | 0.000121434 | 0.000650533 |
| GOTERM_BP_FAT | GO:0042981~regulation of apoptosis | 53 | 3.76 | 0.013269904 | 1.389846013 | 1 | 0.260952584 | 21.37180332 |
| GOTERM_MF_FAT | GO:0005216~ion channel activity | 52 | 3.69 | 2.43557E-07 | 2.159077345 | 0.000211629 | 0.000211629 | 0.000377923 |
| GOTERM_MF_FAT | GO:0043565~sequence-specific DNA binding | 52 | 3.69 | 0.021849267 | 1.35524819 | 0.999999995 | 0.396613702 | 29.02127579 |
| GOTERM_BP_FAT | GO:0007610~behavior | 51 | 3.62 | 4.01531E-05 | 1.826127515 | 0.113061627 | 0.009186755 | 0.072245626 |
| SP_PIR_KEYWORDS | cell adhesion | 50 | 3.55 | 2.28842E-05 | 1.883889756 | 0.011128143 | 0.001016803 | 0.032846159 |
| GOTERM_BP_FAT | GO:0055085~transmembrane transport | 50 | 3.55 | 0.001511682 | 1.576260962 | 0.989114512 | 0.086440248 | 2.686153399 |
| GOTERM_BP_FAT | GO:0009611~response to wounding | 47 | 3.34 | 1.35368E-05 | 1.964193776 | 0.039641194 | 0.004484172 | 0.024361717 |
| SP_PIR_KEYWORDS | ionic channel | 46 | 3.26 | 1.00329E-06 | 2.188065976 | 0.000490489 | 8.17649E-05 | 0.001440251 |
| INTERPRO | IPR013032:EGF-like region, conserved site | 45 | 3.19 | 2.684E-06 | 2.134519868 | 0.004314596 | 0.00215963 | 0.004497972 |
| SP_PIR_KEYWORDS | Signal-anchor | 45 | 3.19 | 0.002337963 | 1.590840239 | 0.681649539 | 0.043068215 | 3.304335055 |
| GOTERM_BP_FAT | GO:0006952~defense response | 45 | 3.19 | 0.01097918 | 1.456634014 | 1 | 0.240346917 | 18.02072646 |
| GOTERM_CC_FAT | GO:0045202~synapse | 44 | 3.12 | 3.26616E-05 | 1.944407728 | 0.011979979 | 0.001720278 | 0.045012091 |
| GOTERM_MF_FAT | GO:0022836~gated channel activity | 43 | 3.05 | 1.55084E-06 | 2.217442767 | 0.001346771 | 0.0002695 | 0.002406382 |
| GOTERM_CC_FAT | GO:0031012~extracellular matrix | 43 | 3.05 | 3.29747E-05 | 1.961712328 | 0.012094142 | 0.001519828 | 0.045443554 |
| GOTERM_BP_FAT | GO:0006928~cell motion | 43 | 3.05 | 0.000806477 | 1.699097648 | 0.910249817 | 0.064771682 | 1.441646167 |
| GOTERM_MF_FAT | GO:0046873~metal ion transmembrane transporter activity | 41 | 2.91 | 1.95846E-05 | 2.048689505 | 0.016875139 | 0.002125132 | 0.030384705 |
| GOTERM_BP_FAT | GO:0007267~cell-cell signaling | 40 | 2.84 | 4.39154E-05 | 2.000220807 | 0.122977085 | 0.009329222 | 0.079012532 |
| GOTERM_CC_FAT | GO:0005578~proteinaceous extracellular matrix | 40 | 2.84 | 0.000132462 | 1.898579937 | 0.047706279 | 0.004876248 | 0.18243442 |
| GOTERM_BP_FAT | GO:0044093~positive regulation of molecular function | 40 | 2.84 | 0.000141584 | 1.895634099 | 0.344976136 | 0.019945247 | 0.254526703 |
| GOTERM_CC_FAT | GO:0009986~cell surface | 40 | 2.84 | 0.00023188 | 1.848781119 | 0.082014442 | 0.007105769 | 0.319155498 |
| GOTERM_BP_FAT | GO:0032989~cellular component morphogenesis | 40 | 2.84 | 0.002160012 | 1.652604086 | 0.998436919 | 0.096025954 | 3.817181452 |
| GOTERM_BP_FAT | GO:0048878~chemical homeostasis | 40 | 2.84 | 0.004172709 | 1.589216532 | 0.999996251 | 0.151594515 | 7.249811674 |
| GOTERM_BP_FAT | GO:0030182~neuron differentiation | 40 | 2.84 | 0.017024219 | 1.453794572 | 1 | 0.289681832 | 26.58573724 |
| GOTERM_MF_FAT | GO:0005261~cation channel activity | 39 | 2.77 | 2.64353E-06 | 2.278784254 | 0.002294594 | 0.000382799 | 0.004101843 |
| GOTERM_BP_FAT | GO:0008284~positive regulation of cell proliferation | 39 | 2.77 | 6.11612E-05 | 1.991417019 | 0.167028109 | 0.010692738 | 0.110025052 |
| GOTERM_BP_FAT | GO:0000902~cell morphogenesis | 38 | 2.70 | 0.000704752 | 1.78336839 | 0.878341926 | 0.061839814 | 1.260891833 |
| GOTERM_MF_FAT | GO:0046983~protein dimerization activity | 38 | 2.70 | 0.003836096 | 1.619552248 | 0.964562252 | 0.169356283 | 5.789496831 |
| GOTERM_BP_FAT | GO:0019725~cellular homeostasis | 38 | 2.70 | 0.004437043 | 1.606591348 | 0.999998304 | 0.156631342 | 7.691936954 |
| GOTERM_BP_FAT | GO:0015672~monovalent inorganic cation transport | 37 | 2.63 | 0.000953716 | 1.770822547 | 0.942217099 | 0.070495995 | 1.702720015 |
| GOTERM_BP_FAT | GO:0030030~cell projection organization | 37 | 2.63 | 0.00235347 | 1.682003861 | 0.999124274 | 0.101180993 | 4.152262189 |
| GOTERM_MF_FAT | GO:0008289~lipid binding | 37 | 2.63 | 0.008379863 | 1.554078359 | 0.999333043 | 0.253613241 | 12.24109011 |
| SP_PIR_KEYWORDS | transmembrane protein | 37 | 2.63 | 0.027227536 | 1.431756215 | 0.999998628 | 0.240797983 | 32.71824001 |
| GOTERM_BP_FAT | GO:0010647~positive regulation of cell communication | 36 | 2.56 | 6.39714E-08 | 2.762209686 | 0.000191128 | 0.000191128 | 0.00011514 |
| SP_PIR_KEYWORDS | cleavage on pair of basic residues | 36 | 2.56 | 2.22229E-05 | 2.16568167 | 0.010808282 | 0.001086121 | 0.03189705 |
| GOTERM_MF_FAT | GO:0004857~enzyme inhibitor activity | 36 | 2.56 | 2.55567E-05 | 2.14677491 | 0.02196427 | 0.002464633 | 0.039648578 |
| GOTERM_BP_FAT | GO:0060429~epithelium development | 36 | 2.56 | 0.000238873 | 1.926411922 | 0.51023856 | 0.028149677 | 0.429067903 |
| INTERPRO | IPR006210:EGF-like | 35 | 2.48 | 8.87659E-07 | 2.535253483 | 0.001428997 | 0.001428997 | 0.001487601 |
| SP_PIR_KEYWORDS | egf-like domain | 35 | 2.48 | 1.21509E-05 | 2.257273312 | 0.005924193 | 0.000659983 | 0.017441602 |
| SMART | SM00181:EGF | 35 | 2.48 | 2.33695E-05 | 2.165488782 | 0.007032817 | 0.007032817 | 0.031255799 |
| GOTERM_BP_FAT | GO:0001775~cell activation | 35 | 2.48 | 7.66609E-05 | 2.063235894 | 0.20472833 | 0.011984008 | 0.137889722 |
| GOTERM_BP_FAT | GO:0051674~localization of cell | 35 | 2.48 | 0.001142795 | 1.787169119 | 0.967176979 | 0.074712308 | 2.037025271 |
| GOTERM_BP_FAT | GO:0048870~cell motility | 35 | 2.48 | 0.001142795 | 1.787169119 | 0.967176979 | 0.074712308 | 2.037025271 |
| GOTERM_BP_FAT | GO:0050801~ion homeostasis | 35 | 2.48 | 0.001944662 | 1.73227314 | 0.997021414 | 0.088188798 | 3.442881529 |
| GOTERM_BP_FAT | GO:0003006~reproductive developmental process | 34 | 2.41 | 0.000637094 | 1.867630413 | 0.851064809 | 0.057771652 | 1.140498257 |
| GOTERM_BP_FAT | GO:0048666~neuron development | 34 | 2.41 | 0.003430729 | 1.688542565 | 0.999965296 | 0.129567826 | 5.998064029 |
| GOTERM_BP_FAT | GO:0009967~positive regulation of signal transduction | 33 | 2.34 | 2.09119E-07 | 2.782283885 | 0.000624651 | 0.000312374 | 0.000376386 |
| GOTERM_BP_FAT | GO:0055082~cellular chemical homeostasis | 33 | 2.34 | 0.001648408 | 1.785644881 | 0.992769937 | 0.08572823 | 2.925715077 |
| GOTERM_BP_FAT | GO:0002684~positive regulation of immune system process | 32 | 2.27 | 3.07549E-05 | 2.252675861 | 0.087800851 | 0.007628831 | 0.055340276 |
| GOTERM_BP_FAT | GO:0051094~positive regulation of developmental process | 32 | 2.27 | 6.46665E-05 | 2.168463679 | 0.175707413 | 0.010677571 | 0.116327303 |
| SP_PIR_KEYWORDS | synapse | 32 | 2.27 | 7.80465E-05 | 2.150995252 | 0.037447099 | 0.00293156 | 0.111980324 |
| GOTERM_BP_FAT | GO:0006954~inflammatory response | 32 | 2.27 | 0.000165712 | 2.062449899 | 0.390544535 | 0.02042149 | 0.29784082 |
| GOTERM_BP_FAT | GO:0048729~tissue morphogenesis | 32 | 2.27 | 0.000452033 | 1.949795073 | 0.741013691 | 0.044033749 | 0.810482177 |
| GOTERM_BP_FAT | GO:0008283~cell proliferation | 32 | 2.27 | 0.000851028 | 1.878749908 | 0.921444872 | 0.066445122 | 1.520710342 |
| GOTERM_MF_FAT | GO:0042802~identical protein binding | 32 | 2.27 | 0.009882965 | 1.598977174 | 0.999821517 | 0.273609338 | 14.28266541 |
| INTERPRO | IPR000742:EGF-like, type 3 | 31 | 2.20 | 3.19508E-05 | 2.290646111 | 0.05017122 | 0.01701149 | 0.053532267 |
| GOTERM_CC_FAT | GO:0044456~synapse part | 31 | 2.20 | 0.000210185 | 2.061347344 | 0.074634388 | 0.007026684 | 0.289334868 |
| GOTERM_BP_FAT | GO:0016477~cell migration | 31 | 2.20 | 0.001092781 | 1.873123444 | 0.961879962 | 0.076591254 | 1.94870129 |
| GOTERM_BP_FAT | GO:0006873~cellular ion homeostasis | 31 | 2.20 | 0.003969337 | 1.722412362 | 0.9999931 | 0.146536985 | 6.908290455 |
| GOTERM_BP_FAT | GO:0035295~tube development | 31 | 2.20 | 0.004726543 | 1.702839494 | 0.999999289 | 0.16218242 | 8.173869518 |
| INTERPRO | IPR003599:Immunoglobulin subtype | 31 | 2.20 | 0.036155719 | 1.456353278 | 1 | 0.716984573 | 46.05215226 |
| KEGG_PATHWAY | mmu05200:Pathways in cancer | 31 | 2.20 | 0.047059008 | 1.412066365 | 0.999593843 | 0.405827023 | 44.19305132 |
| GOTERM_MF_FAT | GO:0030246~carbohydrate binding | 31 | 2.20 | 0.048276922 | 1.417074606 | 1 | 0.562599705 | 53.59629761 |
| GOTERM_BP_FAT | GO:0048584~positive regulation of response to stimulus | 30 | 2.13 | 2.81594E-05 | 2.33896788 | 0.080698945 | 0.007620057 | 0.050671207 |
| GOTERM_MF_FAT | GO:0031420~alkali metal ion binding | 30 | 2.13 | 0.000184609 | 2.110300579 | 0.148231001 | 0.013281012 | 0.286070928 |
| SP_PIR_KEYWORDS | extracellular matrix | 30 | 2.13 | 0.000414869 | 2.016558049 | 0.183650571 | 0.012601971 | 0.593911928 |
| GOTERM_CC_FAT | GO:0043005~neuron projection | 30 | 2.13 | 0.004438581 | 1.726157881 | 0.806307247 | 0.087158897 | 5.947650022 |
| GOTERM_BP_FAT | GO:0007423~sensory organ development | 30 | 2.13 | 0.005920563 | 1.692793874 | 0.99999998 | 0.18260063 | 10.1365697 |
| SP_PIR_KEYWORDS | DNA binding | 30 | 2.13 | 0.00757075 | 1.664832808 | 0.975673317 | 0.124290415 | 10.33542159 |
| GOTERM_BP_FAT | GO:0044271~nitrogen compound biosynthetic process | 30 | 2.13 | 0.043717448 | 1.440556376 | 1 | 0.456597366 | 55.27220378 |
| GOTERM_MF_FAT | GO:0004866~endopeptidase inhibitor activity | 29 | 2.06 | 4.76745E-06 | 2.610131607 | 0.004134357 | 0.000591672 | 0.007397321 |
| GOTERM_MF_FAT | GO:0030414~peptidase inhibitor activity | 29 | 2.06 | 2.67117E-05 | 2.387677208 | 0.022945407 | 0.002318583 | 0.041440009 |
| GOTERM_BP_FAT | GO:0045321~leukocyte activation | 29 | 2.06 | 0.001116347 | 1.920303309 | 0.964474591 | 0.076389151 | 1.990326921 |
| GOTERM_BP_FAT | GO:0019226~transmission of nerve impulse | 29 | 2.06 | 0.001800577 | 1.860824888 | 0.995415041 | 0.087229454 | 3.191680715 |
| KEGG_PATHWAY | mmu04060:Cytokine-cytokine receptor interaction | 29 | 2.06 | 0.003896757 | 1.748654897 | 0.46874215 | 0.118827222 | 4.614614448 |
| GOTERM_BP_FAT | GO:0043085~positive regulation of catalytic activity | 29 | 2.06 | 0.013010381 | 1.611288984 | 1 | 0.261647769 | 20.99875322 |
| GOTERM_BP_FAT | GO:0016337~cell-cell adhesion | 28 | 1.99 | 0.006461023 | 1.720528915 | 0.999999996 | 0.193621412 | 11.0118785 |
| GOTERM_BP_FAT | GO:0045597~positive regulation of cell differentiation | 27 | 1.92 | 0.000161927 | 2.237389846 | 0.383611272 | 0.020818392 | 0.291046955 |
| GOTERM_BP_FAT | GO:0000904~cell morphogenesis involved in differentiation | 27 | 1.92 | 0.002963983 | 1.846901996 | 0.999859392 | 0.11743513 | 5.202490044 |
| GOTERM_BP_FAT | GO:0031175~neuron projection development | 27 | 1.92 | 0.004326214 | 1.796069831 | 0.999997635 | 0.154852196 | 7.506805738 |
| KEGG_PATHWAY | mmu04010:MAPK signaling pathway | 27 | 1.92 | 0.034850743 | 1.49904209 | 0.996806214 | 0.357277466 | 34.89931789 |
| GOTERM_BP_FAT | GO:0006813~potassium ion transport | 26 | 1.85 | 9.49068E-05 | 2.356510139 | 0.246928496 | 0.014079696 | 0.17068221 |
| GOTERM_CC_FAT | GO:0034702~ion channel complex | 26 | 1.85 | 0.000119551 | 2.319752258 | 0.043157961 | 0.00488989 | 0.164666081 |
| GOTERM_BP_FAT | GO:0045596~negative regulation of cell differentiation | 26 | 1.85 | 0.000716914 | 2.071657265 | 0.882686589 | 0.061081552 | 1.282518519 |
| GOTERM_CC_FAT | GO:0009897~external side of plasma membrane | 26 | 1.85 | 0.005760851 | 1.77922746 | 0.881388366 | 0.09653606 | 7.654993537 |
| GOTERM_BP_FAT | GO:0007626~locomotory behavior | 26 | 1.85 | 0.024076767 | 1.577580009 | 1 | 0.340401132 | 35.50951665 |
| GOTERM_BP_FAT | GO:0048568~embryonic organ development | 26 | 1.85 | 0.026341023 | 1.564488059 | 1 | 0.35483786 | 38.15012464 |
| GOTERM_BP_FAT | GO:0043069~negative regulation of programmed cell death | 26 | 1.85 | 0.03004002 | 1.54525255 | 1 | 0.381006158 | 42.24548118 |
| GOTERM_BP_FAT | GO:0060548~negative regulation of cell death | 26 | 1.85 | 0.031356996 | 1.538945397 | 1 | 0.389354753 | 43.6407143 |
| GOTERM_BP_FAT | GO:0010627~regulation of protein kinase cascade | 25 | 1.77 | 0.000150083 | 2.33896788 | 0.361403642 | 0.020179196 | 0.269786143 |
| GOTERM_BP_FAT | GO:0051240~positive regulation of multicellular organismal process | 25 | 1.77 | 0.000326793 | 2.22417191 | 0.623416878 | 0.035524627 | 0.58655356 |
| GOTERM_BP_FAT | GO:0007268~synaptic transmission | 25 | 1.77 | 0.00118084 | 2.036741693 | 0.970707841 | 0.072363798 | 2.104161184 |
| INTERPRO | IPR003598:Immunoglobulin subtype 2 | 25 | 1.77 | 0.00197458 | 1.965838262 | 0.958588326 | 0.180459965 | 3.258173081 |
| INTERPRO | IPR003961:Fibronectin, type III | 25 | 1.77 | 0.002619758 | 1.924668874 | 0.985388828 | 0.199420479 | 4.30093573 |
| GOTERM_CC_FAT | GO:0031225~anchored to membrane | 25 | 1.77 | 0.011608123 | 1.702530922 | 0.986545649 | 0.147491692 | 14.86611796 |
| SMART | SM00408:IGc2 | 25 | 1.77 | 0.013019435 | 1.679122318 | 0.980892782 | 0.35579819 | 16.07938579 |
| SMART | SM00060:FN3 | 25 | 1.77 | 0.016569976 | 1.643957453 | 0.993565337 | 0.396256344 | 20.02900662 |
| GOTERM_BP_FAT | GO:0046903~secretion | 25 | 1.77 | 0.017841667 | 1.640452585 | 1 | 0.298052134 | 27.67685575 |
| GOTERM_BP_FAT | GO:0001568~blood vessel development | 25 | 1.77 | 0.049309465 | 1.48581976 | 1 | 0.480081537 | 59.75298158 |
| GOTERM_BP_FAT | GO:0050778~positive regulation of immune response | 24 | 1.70 | 5.14919E-05 | 2.559106033 | 0.142609505 | 0.009570274 | 0.092638184 |
| KEGG_PATHWAY | mmu04514:Cell adhesion molecules (CAMs) | 24 | 1.70 | 0.000245329 | 2.292907093 | 0.03896864 | 0.01967793 | 0.296456907 |
| GOTERM_BP_FAT | GO:0035239~tube morphogenesis | 24 | 1.70 | 0.001529239 | 2.035312401 | 0.989671661 | 0.085761678 | 2.716946121 |
| GOTERM_BP_FAT | GO:0002009~morphogenesis of an epithelium | 24 | 1.70 | 0.001786225 | 2.011782777 | 0.995213773 | 0.087989403 | 3.166624979 |
| INTERPRO | IPR013151:Immunoglobulin | 24 | 1.70 | 0.002218319 | 1.982625195 | 0.972059583 | 0.189781913 | 3.653362827 |
| GOTERM_BP_FAT | GO:0048858~cell projection morphogenesis | 24 | 1.70 | 0.011979554 | 1.722962478 | 1 | 0.253808257 | 19.50042283 |
| INTERPRO | IPR018247:EF-HAND 1 | 24 | 1.70 | 0.016888083 | 1.672546373 | 1 | 0.564598428 | 24.83176289 |
| GOTERM_BP_FAT | GO:0032990~cell part morphogenesis | 24 | 1.70 | 0.020294857 | 1.641690663 | 1 | 0.316498851 | 30.86012352 |
| INTERPRO | IPR006209:EGF | 23 | 1.63 | 4.83477E-05 | 2.642209489 | 0.074933794 | 0.019284128 | 0.080994111 |
| GOTERM_BP_FAT | GO:0060341~regulation of cellular localization | 23 | 1.63 | 0.001560006 | 2.071657265 | 0.990580158 | 0.084255313 | 2.770886076 |
| UP_SEQ_FEATURE | DNA-binding region:Basic motif | 23 | 1.63 | 0.002258691 | 2.010711557 | 0.998596687 | 0.396676362 | 3.975971655 |
| GOTERM_BP_FAT | GO:0048667~cell morphogenesis involved in neuron differentiation | 23 | 1.63 | 0.00706148 | 1.832619888 | 0.999999999 | 0.205592054 | 11.97490938 |
| GOTERM_BP_FAT | GO:0046649~lymphocyte activation | 23 | 1.63 | 0.012153529 | 1.746266071 | 1 | 0.253453816 | 19.75516681 |
| GOTERM_MF_FAT | GO:0042803~protein homodimerization activity | 23 | 1.63 | 0.013702172 | 1.726874636 | 0.999993791 | 0.31248555 | 19.27197238 |
| GOTERM_MF_FAT | GO:0004867~serine-type endopeptidase inhibitor activity | 22 | 1.56 | 3.39693E-05 | 2.772139775 | 0.029088372 | 0.002680023 | 0.052696598 |
| INTERPRO | IPR000008:C2 calcium-dependent membrane targeting | 22 | 1.56 | 0.000177066 | 2.488448803 | 0.248194837 | 0.046433723 | 0.296327519 |
| SMART | SM00239:C2 | 22 | 1.56 | 0.001333659 | 2.125510528 | 0.331710551 | 0.095848616 | 1.76932827 |
| GOTERM_BP_FAT | GO:0048812~neuron projection morphogenesis | 22 | 1.56 | 0.00964344 | 1.812700107 | 1 | 0.229604115 | 16.00489495 |
| GOTERM_CC_FAT | GO:0005911~cell-cell junction | 22 | 1.56 | 0.010763345 | 1.79267649 | 0.98155945 | 0.147624507 | 13.85762474 |
| GOTERM_MF_FAT | GO:0022832~voltage-gated channel activity | 22 | 1.56 | 0.011652038 | 1.780983654 | 0.999962271 | 0.287875496 | 16.62855438 |
| GOTERM_MF_FAT | GO:0005244~voltage-gated ion channel activity | 22 | 1.56 | 0.011652038 | 1.780983654 | 0.999962271 | 0.287875496 | 16.62855438 |
| INTERPRO | IPR008957:Fibronectin, type III-like fold | 22 | 1.56 | 0.01607225 | 1.72993767 | 1 | 0.557674917 | 23.7795155 |
| GOTERM_BP_FAT | GO:0051338~regulation of transferase activity | 22 | 1.56 | 0.033524222 | 1.603192054 | 1 | 0.40070403 | 45.86765384 |
| GOTERM_MF_FAT | GO:0005267~potassium channel activity | 21 | 1.49 | 0.000513689 | 2.358956151 | 0.360142688 | 0.033763769 | 0.794116762 |
| GOTERM_BP_FAT | GO:0001817~regulation of cytokine production | 21 | 1.49 | 0.001329536 | 2.190889338 | 0.981226284 | 0.079481975 | 2.366141258 |
| GOTERM_BP_FAT | GO:0015674~di-, tri-valent inorganic cation transport | 21 | 1.49 | 0.007392386 | 1.891513155 | 1 | 0.210105867 | 12.50141212 |
| GOTERM_BP_FAT | GO:0055080~cation homeostasis | 21 | 1.49 | 0.02850294 | 1.65507401 | 1 | 0.373150761 | 40.57581757 |
| GOTERM_BP_FAT | GO:0007169~transmembrane receptor protein tyrosine kinase signaling pathway | 21 | 1.49 | 0.041918957 | 1.586112593 | 1 | 0.445480716 | 53.73370666 |
| KEGG_PATHWAY | mmu04510:Focal adhesion | 21 | 1.49 | 0.046036468 | 1.56045066 | 0.999516777 | 0.420366638 | 43.46410705 |
| GOTERM_BP_FAT | GO:0051046~regulation of secretion | 20 | 1.42 | 0.000891842 | 2.320256137 | 0.930471055 | 0.067753687 | 1.593088949 |
| INTERPRO | IPR003591:Leucine-rich repeat, typical subtype | 20 | 1.42 | 0.001133041 | 2.279762822 | 0.839002167 | 0.122303659 | 1.881985101 |
| GOTERM_BP_FAT | GO:0051050~positive regulation of transport | 20 | 1.42 | 0.001726726 | 2.197212251 | 0.994280738 | 0.088088904 | 3.062686594 |
| SMART | SM00369:LRR_TYP | 20 | 1.42 | 0.006310858 | 1.947261231 | 0.852203425 | 0.239007066 | 8.119840939 |
| SP_PIR_KEYWORDS | ATP | 20 | 1.42 | 0.008963746 | 1.896365848 | 0.987759866 | 0.136505573 | 12.12528311 |
| GOTERM_BP_FAT | GO:0060284~regulation of cell development | 20 | 1.42 | 0.013174983 | 1.824100736 | 1 | 0.261037035 | 21.23555335 |
| GOTERM_BP_FAT | GO:0048562~embryonic organ morphogenesis | 20 | 1.42 | 0.014906401 | 1.8014411 | 1 | 0.279319481 | 23.6861338 |
| GOTERM_BP_FAT | GO:0007409~axonogenesis | 20 | 1.42 | 0.016811565 | 1.779337528 | 1 | 0.291514595 | 26.29935076 |
| GOTERM_BP_FAT | GO:0010740~positive regulation of protein kinase cascade | 19 | 1.35 | 2.51532E-05 | 3.131027457 | 0.072403836 | 0.007487707 | 0.045262862 |
| INTERPRO | IPR018029:C2 membrane targeting protein | 19 | 1.35 | 0.000266658 | 2.635706922 | 0.349259331 | 0.052288842 | 0.445950339 |
| UP_SEQ_FEATURE | domain:EGF-like 1 | 19 | 1.35 | 0.000759359 | 2.413183764 | 0.889945223 | 0.217449992 | 1.353729024 |
| UP_SEQ_FEATURE | domain:Leucine-zipper | 19 | 1.35 | 0.00085094 | 2.390630645 | 0.91567135 | 0.219096239 | 1.515818013 |
| GOTERM_BP_FAT | GO:0019932~second-messenger-mediated signaling | 19 | 1.35 | 0.001154964 | 2.335003527 | 0.968350316 | 0.072317564 | 2.058503549 |
| GOTERM_MF_FAT | GO:0030955~potassium ion binding | 19 | 1.35 | 0.001163094 | 2.333253239 | 0.636260245 | 0.061251139 | 1.789596122 |
| SP_PIR_KEYWORDS | potassium | 19 | 1.35 | 0.001355504 | 2.305370177 | 0.484846938 | 0.031091691 | 1.928360853 |
| GOTERM_CC_FAT | GO:0043025~cell soma | 19 | 1.35 | 0.001431424 | 2.28924927 | 0.410554936 | 0.039844011 | 1.955156002 |
| GOTERM_BP_FAT | GO:0006816~calcium ion transport | 19 | 1.35 | 0.001548352 | 2.277110878 | 0.990245841 | 0.085190695 | 2.750458259 |
| INTERPRO | IPR013098:Immunoglobulin I-set | 19 | 1.35 | 0.002339781 | 2.199881368 | 0.977035439 | 0.189136643 | 3.849729561 |
| GOTERM_CC_FAT | GO:0045211~postsynaptic membrane | 19 | 1.35 | 0.003309701 | 2.125731465 | 0.705744055 | 0.069431079 | 4.466897444 |
| GOTERM_BP_FAT | GO:0006575~cellular amino acid derivative metabolic process | 19 | 1.35 | 0.008140336 | 1.954116427 | 1 | 0.214795082 | 13.68053257 |
| GOTERM_BP_FAT | GO:0002694~regulation of leukocyte activation | 19 | 1.35 | 0.019111392 | 1.789158547 | 1 | 0.31063495 | 29.34134545 |
| GOTERM_BP_FAT | GO:0050865~regulation of cell activation | 19 | 1.35 | 0.021510069 | 1.766220617 | 1 | 0.323894455 | 32.38752756 |
| KEGG_PATHWAY | mmu04512:ECM-receptor interaction | 18 | 1.28 | 3.04377E-05 | 3.190732159 | 0.004918841 | 0.004918841 | 0.036824883 |
| GOTERM_MF_FAT | GO:0022834~ligand-gated channel activity | 18 | 1.28 | 0.000891692 | 2.460690109 | 0.539400158 | 0.053868071 | 1.37470334 |
| GOTERM_MF_FAT | GO:0015276~ligand-gated ion channel activity | 18 | 1.28 | 0.000891692 | 2.460690109 | 0.539400158 | 0.053868071 | 1.37470334 |
| SP_PIR_KEYWORDS | potassium transport | 18 | 1.28 | 0.001152686 | 2.408561857 | 0.431064825 | 0.029247388 | 1.642047241 |
| SP_PIR_KEYWORDS | protease inhibitor | 18 | 1.28 | 0.001421192 | 2.364368061 | 0.501153748 | 0.031117271 | 2.020924971 |
| SP_PIR_KEYWORDS | postsynaptic cell membrane | 18 | 1.28 | 0.001574126 | 2.342873806 | 0.537150898 | 0.032938958 | 2.236116418 |
| GOTERM_BP_FAT | GO:0001763~morphogenesis of a branching structure | 18 | 1.28 | 0.005321356 | 2.088230523 | 0.999999881 | 0.174759417 | 9.156614335 |
| GOTERM_BP_FAT | GO:0002252~immune effector process | 18 | 1.28 | 0.005768502 | 2.071657265 | 0.999999969 | 0.180197509 | 9.888836146 |
| GOTERM_BP_FAT | GO:0007548~sex differentiation | 18 | 1.28 | 0.007872356 | 2.007913964 | 1 | 0.212224556 | 13.25980575 |
| SP_PIR_KEYWORDS | voltage-gated channel | 18 | 1.28 | 0.012864333 | 1.909008287 | 0.998220587 | 0.165480521 | 16.96187685 |
| GOTERM_BP_FAT | GO:0016053~organic acid biosynthetic process | 18 | 1.28 | 0.016937492 | 1.851268194 | 1 | 0.290055596 | 26.46906638 |
| GOTERM_BP_FAT | GO:0046394~carboxylic acid biosynthetic process | 18 | 1.28 | 0.016937492 | 1.851268194 | 1 | 0.290055596 | 26.46906638 |
| GOTERM_BP_FAT | GO:0001655~urogenital system development | 18 | 1.28 | 0.0230844 | 1.787868598 | 1 | 0.336680678 | 34.31895706 |
| GOTERM_BP_FAT | GO:0030003~cellular cation homeostasis | 18 | 1.28 | 0.032536179 | 1.717294838 | 1 | 0.39449932 | 44.86289748 |
| SP_PIR_KEYWORDS | Serine protease inhibitor | 17 | 1.21 | 0.000149138 | 2.96827508 | 0.070337538 | 0.005196004 | 0.213879372 |
| SP_PIR_KEYWORDS | collagen | 17 | 1.21 | 0.000200037 | 2.897601864 | 0.093194979 | 0.006500634 | 0.286777055 |
| GOTERM_BP_FAT | GO:0032101~regulation of response to external stimulus | 17 | 1.21 | 0.001750448 | 2.393468102 | 0.994672764 | 0.087749587 | 3.104140134 |
| GOTERM_BP_FAT | GO:0045137~development of primary sexual characteristics | 17 | 1.21 | 0.001939741 | 2.370453986 | 0.996977213 | 0.089329201 | 3.434313594 |
| INTERPRO | IPR005821:Ion transport | 17 | 1.21 | 0.003358176 | 2.252035976 | 0.995568984 | 0.227446203 | 5.48142169 |
| GOTERM_MF_FAT | GO:0019842~vitamin binding | 17 | 1.21 | 0.008842891 | 2.035887776 | 0.99955554 | 0.256860263 | 12.87479181 |
| GOTERM_BP_FAT | GO:0030855~epithelial cell differentiation | 17 | 1.21 | 0.010236968 | 2.004286297 | 1 | 0.234597864 | 16.90632818 |
| SP_PIR_KEYWORDS | lyase | 17 | 1.21 | 0.010753634 | 1.995070136 | 0.99494312 | 0.148037092 | 14.3763288 |
| GOTERM_BP_FAT | GO:0010817~regulation of hormone levels | 17 | 1.21 | 0.01467994 | 1.925993863 | 1 | 0.277413171 | 23.36975399 |
| GOTERM_BP_FAT | GO:0048608~reproductive structure development | 17 | 1.21 | 0.016827616 | 1.896363189 | 1 | 0.290096956 | 26.32100427 |
| GOTERM_BP_FAT | GO:0050767~regulation of neurogenesis | 17 | 1.21 | 0.019209647 | 1.867630413 | 1 | 0.310313778 | 29.46862905 |
| GOTERM_MF_FAT | GO:0015293~symporter activity | 17 | 1.21 | 0.019315666 | 1.866230462 | 0.999999956 | 0.392568541 | 26.11426148 |
| GOTERM_BP_FAT | GO:0051347~positive regulation of transferase activity | 17 | 1.21 | 0.023255125 | 1.826127515 | 1 | 0.337113936 | 34.52524631 |
| UP_SEQ_FEATURE | domain:Ig-like C2-type 1 | 17 | 1.21 | 0.031234799 | 1.760549451 | 1 | 0.933549999 | 43.41125074 |
| GOTERM_BP_FAT | GO:0006006~glucose metabolic process | 17 | 1.21 | 0.031380777 | 1.760908675 | 1 | 0.388031681 | 43.66561309 |
| UP_SEQ_FEATURE | domain:Ig-like C2-type 2 | 17 | 1.21 | 0.033228169 | 1.747110142 | 1 | 0.929573726 | 45.4644072 |
| GOTERM_BP_FAT | GO:0051960~regulation of nervous system development | 17 | 1.21 | 0.048458743 | 1.665724422 | 1 | 0.478459158 | 59.09980693 |
| INTERPRO | IPR000215:Protease inhibitor I4, serpin | 16 | 1.14 | 4.85468E-05 | 3.40973222 | 0.075230597 | 0.01552047 | 0.081327661 |
| SMART | SM00093:SERPIN | 16 | 1.14 | 0.000271372 | 2.912425493 | 0.078696253 | 0.040154311 | 0.362393563 |
| INTERPRO | IPR008160:Collagen triple helix repeat | 16 | 1.14 | 0.000323872 | 2.904586706 | 0.406573604 | 0.056333496 | 0.541388068 |
| GOTERM_BP_FAT | GO:0002526~acute inflammatory response | 16 | 1.14 | 0.000370366 | 2.864513749 | 0.669404272 | 0.038759536 | 0.664516472 |
| INTERPRO | IPR000483:Cysteine-rich flanking region, C-terminal | 16 | 1.14 | 0.000425901 | 2.834596665 | 0.496551169 | 0.066325423 | 0.71137003 |
| KEGG_PATHWAY | mmu04640:Hematopoietic cell lineage | 16 | 1.14 | 0.000439127 | 2.802442002 | 0.068681741 | 0.017631271 | 0.5300725 |
| GOTERM_BP_FAT | GO:0002253~activation of immune response | 16 | 1.14 | 0.000717805 | 2.697972252 | 0.882998925 | 0.059460904 | 1.284103794 |
| INTERPRO | IPR002035:von Willebrand factor, type A | 16 | 1.14 | 0.000808006 | 2.673540036 | 0.728073748 | 0.102837881 | 1.345536113 |
| GOTERM_BP_FAT | GO:0048754~branching morphogenesis of a tube | 16 | 1.14 | 0.001641347 | 2.494899072 | 0.99261552 | 0.086887174 | 2.913357023 |
| GOTERM_BP_FAT | GO:0043408~regulation of MAPKKK cascade | 16 | 1.14 | 0.001641347 | 2.494899072 | 0.99261552 | 0.086887174 | 2.913357023 |
| GOTERM_CC_FAT | GO:0044420~extracellular matrix part | 16 | 1.14 | 0.001932678 | 2.451644527 | 0.510244074 | 0.04971102 | 2.631386053 |
| SMART | SM00082:LRRCT | 16 | 1.14 | 0.002053407 | 2.421173 | 0.462467663 | 0.116755546 | 2.712119058 |
| SMART | SM00327:VWA | 16 | 1.14 | 0.003697071 | 2.283606352 | 0.673258065 | 0.170083983 | 4.833837672 |
| GOTERM_CC_FAT | GO:0016327~apicolateral plasma membrane | 16 | 1.14 | 0.005838092 | 2.189818413 | 0.884740469 | 0.093539367 | 7.753834658 |
| GOTERM_BP_FAT | GO:0040012~regulation of locomotion | 16 | 1.14 | 0.008333567 | 2.109323761 | 1 | 0.21554598 | 13.98270597 |
| SP_PIR_KEYWORDS | Sodium transport | 16 | 1.14 | 0.010195676 | 2.063792742 | 0.993337604 | 0.14926455 | 13.68043774 |
| GOTERM_BP_FAT | GO:0031644~regulation of neurological system process | 16 | 1.14 | 0.010600192 | 2.053324015 | 1 | 0.238265808 | 17.45346824 |
| GOTERM_BP_FAT | GO:0042110~T cell activation | 16 | 1.14 | 0.013325546 | 2.000220807 | 1 | 0.260208198 | 21.45156929 |
| KEGG_PATHWAY | mmu04670:Leukocyte transendothelial migration | 16 | 1.14 | 0.013973322 | 1.978194355 | 0.897679239 | 0.277951697 | 15.65685246 |
| GOTERM_BP_FAT | GO:0045860~positive regulation of protein kinase activity | 16 | 1.14 | 0.023271338 | 1.871174304 | 1 | 0.335719049 | 34.54480517 |
| GOTERM_BP_FAT | GO:0006814~sodium ion transport | 16 | 1.14 | 0.024826781 | 1.856204909 | 1 | 0.345837861 | 36.39576547 |
| SP_PIR_KEYWORDS | gpi-anchor | 16 | 1.14 | 0.025925237 | 1.847427374 | 0.99999736 | 0.239128554 | 31.4135793 |
| GOTERM_MF_FAT | GO:0022843~voltage-gated cation channel activity | 16 | 1.14 | 0.030111977 | 1.81134133 | 1 | 0.453296906 | 37.7755213 |
| SP_PIR_KEYWORDS | growth factor | 16 | 1.14 | 0.031295548 | 1.803787357 | 0.999999823 | 0.267258359 | 36.64644879 |
| GOTERM_BP_FAT | GO:0033674~positive regulation of kinase activity | 16 | 1.14 | 0.033789301 | 1.784812413 | 1 | 0.401625159 | 46.13425916 |
| GOTERM_BP_FAT | GO:0030005~cellular di-, tri-valent inorganic cation homeostasis | 16 | 1.14 | 0.042496656 | 1.73153443 | 1 | 0.448556547 | 54.23325836 |
| GOTERM_BP_FAT | GO:0009309~amine biosynthetic process | 15 | 1.06 | 0.000396437 | 2.979780997 | 0.694189391 | 0.040031496 | 0.711136136 |
| KEGG_PATHWAY | mmu04610:Complement and coagulation cascades | 15 | 1.06 | 0.000423876 | 2.942564103 | 0.066376877 | 0.022634061 | 0.511705826 |
| GOTERM_BP_FAT | GO:0002697~regulation of immune effector process | 15 | 1.06 | 0.002639551 | 2.471863782 | 0.999628294 | 0.109647957 | 4.645751125 |
| GOTERM_CC_FAT | GO:0034703~cation channel complex | 15 | 1.06 | 0.00683804 | 2.225835163 | 0.920492444 | 0.10423999 | 9.024587596 |
| GOTERM_BP_FAT | GO:0046942~carboxylic acid transport | 15 | 1.06 | 0.007746351 | 2.197212251 | 1 | 0.213016942 | 13.06130969 |
| GOTERM_BP_FAT | GO:0006875~cellular metal ion homeostasis | 15 | 1.06 | 0.008454042 | 2.175240128 | 1 | 0.216452562 | 14.1705995 |
| GOTERM_BP_FAT | GO:0015849~organic acid transport | 15 | 1.06 | 0.008454042 | 2.175240128 | 1 | 0.216452562 | 14.1705995 |
| GOTERM_BP_FAT | GO:0045664~regulation of neuron differentiation | 15 | 1.06 | 0.010022204 | 2.132588361 | 1 | 0.2338282 | 16.5812115 |
| GOTERM_CC_FAT | GO:0043296~apical junction complex | 15 | 1.06 | 0.011604668 | 2.093607331 | 0.986528281 | 0.152665808 | 14.86201506 |
| GOTERM_BP_FAT | GO:0055065~metal ion homeostasis | 15 | 1.06 | 0.013836332 | 2.052113328 | 1 | 0.26536577 | 22.18024454 |
| GOTERM_BP_FAT | GO:0001822~kidney development | 15 | 1.06 | 0.014945205 | 2.032934699 | 1 | 0.27822271 | 23.74022142 |
| GOTERM_BP_FAT | GO:0051969~regulation of transmission of nerve impulse | 15 | 1.06 | 0.014945205 | 2.032934699 | 1 | 0.27822271 | 23.74022142 |
| GOTERM_CC_FAT | GO:0030424~axon | 15 | 1.06 | 0.018632117 | 1.976208789 | 0.999031835 | 0.219531589 | 22.8371692 |
| GOTERM_BP_FAT | GO:0060562~epithelial tube morphogenesis | 15 | 1.06 | 0.02007544 | 1.959675791 | 1 | 0.31526488 | 30.58088717 |
| GOTERM_MF_FAT | GO:0005179~hormone activity | 15 | 1.06 | 0.023207891 | 1.923548315 | 0.999999999 | 0.392067775 | 30.53571427 |
| GOTERM_BP_FAT | GO:0008544~epidermis development | 15 | 1.06 | 0.048654195 | 1.740192102 | 1 | 0.478374536 | 59.25075249 |
| UP_SEQ_FEATURE | site:Reactive bond | 14 | 0.99 | 8.02658E-05 | 3.624660633 | 0.207990298 | 0.032762939 | 0.143916712 |
| UP_SEQ_FEATURE | domain:C2 2 | 14 | 0.99 | 0.00021865 | 3.306707946 | 0.470196445 | 0.076335274 | 0.391581231 |
| UP_SEQ_FEATURE | domain:C2 1 | 14 | 0.99 | 0.00021865 | 3.306707946 | 0.470196445 | 0.076335274 | 0.391581231 |
| GOTERM_BP_FAT | GO:0006836~neurotransmitter transport | 14 | 0.99 | 0.003055676 | 2.537780149 | 0.999893177 | 0.119270461 | 5.359282103 |
| GOTERM_CC_FAT | GO:0043235~receptor complex | 14 | 0.99 | 0.005360703 | 2.377799813 | 0.862402232 | 0.094412187 | 7.141372126 |
| GOTERM_MF_FAT | GO:0042165~neurotransmitter binding | 14 | 0.99 | 0.006403169 | 2.331841713 | 0.996235894 | 0.224105257 | 9.486968382 |
| GOTERM_MF_FAT | GO:0030594~neurotransmitter receptor activity | 14 | 0.99 | 0.006403169 | 2.331841713 | 0.996235894 | 0.224105257 | 9.486968382 |
| SP_PIR_KEYWORDS | Proto-oncogene | 14 | 0.99 | 0.006465111 | 2.330765931 | 0.958067866 | 0.110833236 | 8.89070471 |
| GOTERM_BP_FAT | GO:0008406~gonad development | 14 | 0.99 | 0.00701543 | 2.307072863 | 0.999999999 | 0.206391169 | 11.90140278 |
| GOTERM_BP_FAT | GO:0002443~leukocyte mediated immunity | 14 | 0.99 | 0.007712759 | 2.281150696 | 1 | 0.21415066 | 13.00832109 |
| GOTERM_BP_FAT | GO:0032880~regulation of protein localization | 14 | 0.99 | 0.008463653 | 2.255804577 | 1 | 0.214846795 | 14.18557148 |
| GOTERM_BP_FAT | GO:0006874~cellular calcium ion homeostasis | 14 | 0.99 | 0.009270823 | 2.231015516 | 1 | 0.227164545 | 15.43426378 |
| INTERPRO | IPR000372:Leucine-rich repeat, cysteine-rich flanking region, N-terminal | 14 | 0.99 | 0.009996841 | 2.213576159 | 0.999999907 | 0.450902713 | 15.49658796 |
| GOTERM_BP_FAT | GO:0030334~regulation of cell migration | 14 | 0.99 | 0.010137018 | 2.206765347 | 1 | 0.234367065 | 16.75516942 |
| GOTERM_BP_FAT | GO:0030534~adult behavior | 14 | 0.99 | 0.011065016 | 2.183036688 | 1 | 0.240249231 | 18.14868991 |
| GOTERM_BP_FAT | GO:0055074~calcium ion homeostasis | 14 | 0.99 | 0.013117655 | 2.137078021 | 1 | 0.261769542 | 21.15315553 |
| GOTERM_BP_FAT | GO:0048511~rhythmic process | 14 | 0.99 | 0.016730677 | 2.071657265 | 1 | 0.291993926 | 26.19014089 |
| GOTERM_BP_FAT | GO:0007411~axon guidance | 14 | 0.99 | 0.016730677 | 2.071657265 | 1 | 0.291993926 | 26.19014089 |
| GOTERM_BP_FAT | GO:0050804~regulation of synaptic transmission | 14 | 0.99 | 0.019528445 | 2.03022412 | 1 | 0.312943897 | 29.88012268 |
| GOTERM_MF_FAT | GO:0031402~sodium ion binding | 14 | 0.99 | 0.024481956 | 1.969613874 | 1 | 0.394027295 | 31.9283804 |
| GOTERM_BP_FAT | GO:0043583~ear development | 14 | 0.99 | 0.026158203 | 1.952138576 | 1 | 0.355967752 | 37.94076665 |
| SP_PIR_KEYWORDS | Sodium | 14 | 0.99 | 0.026871712 | 1.946076409 | 0.999998359 | 0.242325159 | 32.36408197 |
| SMART | SM00013:LRRNT | 14 | 0.99 | 0.031854815 | 1.89072784 | 0.999943242 | 0.502587973 | 35.14669567 |
| GOTERM_BP_FAT | GO:0051270~regulation of cell motion | 14 | 0.99 | 0.032119978 | 1.897405719 | 1 | 0.392074161 | 44.43440673 |
| GOTERM_BP_FAT | GO:0008015~blood circulation | 14 | 0.99 | 0.041516367 | 1.829030738 | 1 | 0.443769194 | 53.38253524 |
| GOTERM_BP_FAT | GO:0003013~circulatory system process | 14 | 0.99 | 0.041516367 | 1.829030738 | 1 | 0.443769194 | 53.38253524 |
| GOTERM_BP_FAT | GO:0042060~wound healing | 14 | 0.99 | 0.044139018 | 1.812700107 | 1 | 0.458342397 | 55.62577407 |
| INTERPRO | IPR004827:Basic-leucine zipper (bZIP) transcription factor | 13 | 0.92 | 0.000218188 | 3.539965048 | 0.296396051 | 0.048979776 | 0.365029786 |
| PIR_SUPERFAMILY | PIRSF001630:serpin | 13 | 0.92 | 0.000228768 | 3.501092354 | 0.128669454 | 0.128669454 | 0.337494251 |
| GOTERM_BP_FAT | GO:0001656~metanephros development | 13 | 0.92 | 0.000494834 | 3.250358812 | 0.772118416 | 0.046587278 | 0.886900236 |
| SMART | SM00338:BRLZ | 13 | 0.92 | 0.000887094 | 3.023663967 | 0.235108498 | 0.085465812 | 1.180134444 |
| GOTERM_BP_FAT | GO:0016064~immunoglobulin mediated immune response | 13 | 0.92 | 0.001077757 | 2.992393827 | 0.960127771 | 0.077392963 | 1.922154898 |
| GOTERM_BP_FAT | GO:0019724~B cell mediated immunity | 13 | 0.92 | 0.001433095 | 2.900320171 | 0.986228569 | 0.083737355 | 2.548204968 |
| UP_SEQ_FEATURE | domain:EGF-like 3 | 13 | 0.92 | 0.003077297 | 2.651807996 | 0.999870694 | 0.472456349 | 5.379744252 |
| GOTERM_CC_FAT | GO:0005604~basement membrane | 13 | 0.92 | 0.004934976 | 2.510416828 | 0.838865235 | 0.091608381 | 6.592008637 |
| GOTERM_BP_FAT | GO:0002449~lymphocyte mediated immunity | 13 | 0.92 | 0.005511314 | 2.480536988 | 0.999999933 | 0.176568364 | 9.468363757 |
| INTERPRO | IPR013320:Concanavalin A-like lectin/glucanase, subgroup | 13 | 0.92 | 0.005541208 | 2.482572891 | 0.999870485 | 0.311326461 | 8.891796723 |
| GOTERM_BP_FAT | GO:0043523~regulation of neuron apoptosis | 13 | 0.92 | 0.00832478 | 2.356510139 | 1 | 0.217207658 | 13.96898691 |
| GOTERM_BP_FAT | GO:0006576~biogenic amine metabolic process | 13 | 0.92 | 0.00832478 | 2.356510139 | 1 | 0.217207658 | 13.96898691 |
| GOTERM_BP_FAT | GO:0022612~gland morphogenesis | 13 | 0.92 | 0.012152133 | 2.24429537 | 1 | 0.255186166 | 19.7531255 |
| GOTERM_BP_FAT | GO:0002460~adaptive immune response based on somatic recombination of immune receptors built from immunoglobulin superfamily domains | 13 | 0.92 | 0.012152133 | 2.24429537 | 1 | 0.255186166 | 19.7531255 |
| GOTERM_BP_FAT | GO:0002250~adaptive immune response | 13 | 0.92 | 0.012152133 | 2.24429537 | 1 | 0.255186166 | 19.7531255 |
| UP_SEQ_FEATURE | domain:EGF-like 2 | 13 | 0.92 | 0.013225742 | 2.215434528 | 1 | 0.827619442 | 21.24922975 |
| GOTERM_BP_FAT | GO:0006979~response to oxidative stress | 13 | 0.92 | 0.015814382 | 2.166905875 | 1 | 0.28496915 | 24.94229365 |
| GOTERM_BP_FAT | GO:0042493~response to drug | 13 | 0.92 | 0.01720369 | 2.142281944 | 1 | 0.290638725 | 26.82661631 |
| GOTERM_BP_FAT | GO:0050954~sensory perception of mechanical stimulus | 13 | 0.92 | 0.023691416 | 2.049139251 | 1 | 0.337500574 | 35.04964562 |
| INTERPRO | IPR000152:EGF-type aspartate/asparagine hydroxylation conserved site | 13 | 0.92 | 0.025199831 | 2.033596942 | 1 | 0.633170696 | 34.80136734 |
| UP_SEQ_FEATURE | domain:Ig-like C2-type 3 | 13 | 0.92 | 0.026710466 | 2.011716411 | 1 | 0.939728354 | 38.47713376 |
| GOTERM_BP_FAT | GO:0030155~regulation of cell adhesion | 13 | 0.92 | 0.027538243 | 2.005540544 | 1 | 0.366153234 | 39.50473532 |
| GOTERM_BP_FAT | GO:0043434~response to peptide hormone stimulus | 13 | 0.92 | 0.029623148 | 1.984429591 | 1 | 0.379936501 | 41.79708397 |
| GOTERM_BP_FAT | GO:0002696~positive regulation of leukocyte activation | 13 | 0.92 | 0.039105808 | 1.904250617 | 1 | 0.431583935 | 51.22662228 |
| GOTERM_MF_FAT | GO:0005249~voltage-gated potassium channel activity | 13 | 0.92 | 0.039276777 | 1.902823216 | 1 | 0.530906974 | 46.29921926 |
| INTERPRO | IPR008266:Tyrosine protein kinase, active site | 13 | 0.92 | 0.040990316 | 1.89265458 | 1 | 0.726559821 | 50.41219997 |
| GOTERM_BP_FAT | GO:0050867~positive regulation of cell activation | 13 | 0.92 | 0.044569556 | 1.866542684 | 1 | 0.46013604 | 55.98413969 |
| SP_PIR_KEYWORDS | hormone | 13 | 0.92 | 0.045542068 | 1.861283079 | 1 | 0.339276926 | 48.78451554 |
| GOTERM_MF_FAT | GO:0005275~amine transmembrane transporter activity | 12 | 0.85 | 0.003540475 | 2.76013917 | 0.954138636 | 0.165816518 | 5.354744294 |
| GOTERM_MF_FAT | GO:0005230~extracellular ligand-gated ion channel activity | 12 | 0.85 | 0.005117218 | 2.634678299 | 0.988417728 | 0.199816322 | 7.652067532 |
| GOTERM_BP_FAT | GO:0002703~regulation of leukocyte mediated immunity | 12 | 0.85 | 0.007990667 | 2.485988718 | 1 | 0.213151986 | 13.44579103 |
| GOTERM_MF_FAT | GO:0043168~anion binding | 12 | 0.85 | 0.00802902 | 2.484125253 | 0.99909301 | 0.253149907 | 11.75805559 |
| GOTERM_MF_FAT | GO:0008081~phosphoric diester hydrolase activity | 12 | 0.85 | 0.009899611 | 2.415121774 | 0.999824106 | 0.26565211 | 14.30502379 |
| GOTERM_MF_FAT | GO:0015294~solute:cation symporter activity | 12 | 0.85 | 0.010952276 | 2.382037914 | 0.999930211 | 0.281077032 | 15.70790519 |
| UP_SEQ_FEATURE | domain:EGF-like | 12 | 0.85 | 0.011000878 | 2.375827978 | 1 | 0.815719524 | 18.00186374 |
| KEGG_PATHWAY | mmu04662:B cell receptor signaling pathway | 12 | 0.85 | 0.018264698 | 2.206923077 | 0.949522936 | 0.282372054 | 19.99293348 |
| GOTERM_BP_FAT | GO:0050670~regulation of lymphocyte proliferation | 12 | 0.85 | 0.02079132 | 2.175240128 | 1 | 0.318051478 | 31.48802472 |
| GOTERM_BP_FAT | GO:0032944~regulation of mononuclear cell proliferation | 12 | 0.85 | 0.02079132 | 2.175240128 | 1 | 0.318051478 | 31.48802472 |
| UP_SEQ_FEATURE | short sequence motif:Cell attachment site | 12 | 0.85 | 0.024032247 | 2.125740823 | 1 | 0.940789135 | 35.36778401 |
| GOTERM_BP_FAT | GO:0070663~regulation of leukocyte proliferation | 12 | 0.85 | 0.024555525 | 2.122185491 | 1 | 0.344324729 | 36.0765734 |
| GOTERM_BP_FAT | GO:0007605~sensory perception of sound | 12 | 0.85 | 0.02879196 | 2.071657265 | 1 | 0.374571394 | 40.89320725 |
| UP_SEQ_FEATURE | repeat:LRR 12 | 12 | 0.85 | 0.03104252 | 2.045016488 | 1 | 0.93771258 | 43.20939034 |
| INTERPRO | IPR016130:Protein-tyrosine phosphatase, active site | 12 | 0.85 | 0.033261006 | 2.028202786 | 1 | 0.702099888 | 43.27164795 |
| GOTERM_BP_FAT | GO:0001890~placenta development | 12 | 0.85 | 0.036092276 | 2.000220807 | 1 | 0.414796246 | 48.39888134 |
| GOTERM_CC_FAT | GO:0045121~membrane raft | 12 | 0.85 | 0.037052344 | 1.990158499 | 0.99999911 | 0.352978954 | 40.57414367 |
| INTERPRO | IPR011701:Major facilitator superfamily MFS-1 | 12 | 0.85 | 0.038415992 | 1.982625195 | 1 | 0.716959477 | 48.13359834 |
| GOTERM_BP_FAT | GO:0048839~inner ear development | 12 | 0.85 | 0.038790645 | 1.977491026 | 1 | 0.431991559 | 50.93789059 |
| INTERPRO | IPR001881:EGF-like calcium-binding | 12 | 0.85 | 0.044103012 | 1.939051015 | 1 | 0.726807276 | 53.04162322 |
| GOTERM_BP_FAT | GO:0051098~regulation of binding | 12 | 0.85 | 0.044602131 | 1.933546781 | 1 | 0.458883269 | 56.01114272 |
| GOTERM_BP_FAT | GO:0016485~protein processing | 12 | 0.85 | 0.044602131 | 1.933546781 | 1 | 0.458883269 | 56.01114272 |
| GOTERM_BP_FAT | GO:0043410~positive regulation of MAPKKK cascade | 11 | 0.78 | 0.001142635 | 3.393991689 | 0.967161211 | 0.076371394 | 2.036741843 |
| SP_PIR_KEYWORDS | proteoglycan | 11 | 0.78 | 0.002081083 | 3.149863673 | 0.638939565 | 0.039929344 | 2.946308598 |
| GOTERM_BP_FAT | GO:0046546~development of primary male sexual characteristics | 11 | 0.78 | 0.002958352 | 3.009766215 | 0.999856999 | 0.118796371 | 5.192854122 |
| GOTERM_MF_FAT | GO:0004714~transmembrane receptor protein tyrosine kinase activity | 11 | 0.78 | 0.004503464 | 2.846393519 | 0.980205457 | 0.186524459 | 6.764096806 |
| GOTERM_BP_FAT | GO:0046661~male sex differentiation | 11 | 0.78 | 0.005108704 | 2.798554551 | 0.999999774 | 0.170252056 | 8.806418932 |
| GOTERM_BP_FAT | GO:0046545~development of primary female sexual characteristics | 11 | 0.78 | 0.005108704 | 2.798554551 | 0.999999774 | 0.170252056 | 8.806418932 |
| UP_SEQ_FEATURE | domain:Ig-like C2-type 4 | 11 | 0.78 | 0.007545596 | 2.644522809 | 1 | 0.725909942 | 12.7068306 |
| GOTERM_BP_FAT | GO:0001819~positive regulation of cytokine production | 11 | 0.78 | 0.009331425 | 2.572864668 | 1 | 0.226633222 | 15.52731855 |
| GOTERM_BP_FAT | GO:0046660~female sex differentiation | 11 | 0.78 | 0.011618516 | 2.492462647 | 1 | 0.248905946 | 18.9693286 |
| GOTERM_BP_FAT | GO:0008217~regulation of blood pressure | 11 | 0.78 | 0.012909629 | 2.454117068 | 1 | 0.261638151 | 20.85347659 |
| INTERPRO | IPR000198:RhoGAP | 11 | 0.78 | 0.014538073 | 2.414166749 | 1 | 0.532827397 | 21.76314153 |
| GOTERM_MF_FAT | GO:0031404~chloride ion binding | 11 | 0.78 | 0.017506115 | 2.344088781 | 0.999999784 | 0.371913373 | 23.97022934 |
| SP_PIR_KEYWORDS | chloride | 11 | 0.78 | 0.018992017 | 2.31607623 | 0.999915302 | 0.208962957 | 24.06250489 |
| UP_SEQ_FEATURE | repeat:LRR 13 | 11 | 0.78 | 0.020813284 | 2.278358112 | 1 | 0.921594513 | 31.43425546 |
| GOTERM_BP_FAT | GO:0001764~neuron migration | 11 | 0.78 | 0.02103449 | 2.278822991 | 1 | 0.31953491 | 31.79360629 |
| INTERPRO | IPR013111:EGF, extracellular | 11 | 0.78 | 0.021233736 | 2.278157355 | 1 | 0.607211959 | 30.21036666 |
| GOTERM_CC_FAT | GO:0034705~potassium channel complex | 11 | 0.78 | 0.022827009 | 2.247340817 | 0.999800719 | 0.247253249 | 27.26153277 |
| GOTERM_CC_FAT | GO:0008076~voltage-gated potassium channel complex | 11 | 0.78 | 0.022827009 | 2.247340817 | 0.999800719 | 0.247253249 | 27.26153277 |
| SP_PIR_KEYWORDS | potassium channel | 11 | 0.78 | 0.022877358 | 2.249902623 | 0.999987835 | 0.226789588 | 28.26761124 |
| GOTERM_BP_FAT | GO:0006865~amino acid transport | 11 | 0.78 | 0.023026344 | 2.246726893 | 1 | 0.337594304 | 34.24866747 |
| KEGG_PATHWAY | mmu04070:Phosphatidylinositol signaling system | 11 | 0.78 | 0.028907194 | 2.157880342 | 0.991365457 | 0.350789711 | 29.87892493 |
| GOTERM_BP_FAT | GO:0051101~regulation of DNA binding | 11 | 0.78 | 0.029816183 | 2.15564337 | 1 | 0.380318668 | 42.00512458 |
| KEGG_PATHWAY | mmu04520:Adherens junction | 11 | 0.78 | 0.031360756 | 2.129487179 | 0.994268692 | 0.349589095 | 31.99293451 |
| KEGG_PATHWAY | mmu04370:VEGF signaling pathway | 11 | 0.78 | 0.031360756 | 2.129487179 | 0.994268692 | 0.349589095 | 31.99293451 |
| GOTERM_BP_FAT | GO:0042471~ear morphogenesis | 11 | 0.78 | 0.035062227 | 2.098915913 | 1 | 0.408653515 | 47.39733441 |
| SMART | SM00324:RhoGAP | 11 | 0.78 | 0.037843467 | 2.062062453 | 0.999991286 | 0.517204499 | 40.31220552 |
| GOTERM_MF_FAT | GO:0032403~protein complex binding | 11 | 0.78 | 0.041079166 | 2.043564578 | 1 | 0.53205808 | 47.84137971 |
| GOTERM_CC_FAT | GO:0070160~occluding junction | 11 | 0.78 | 0.041263434 | 2.040348899 | 0.999999823 | 0.367029473 | 44.05791006 |
| GOTERM_CC_FAT | GO:0005923~tight junction | 11 | 0.78 | 0.041263434 | 2.040348899 | 0.999999823 | 0.367029473 | 44.05791006 |
| GOTERM_MF_FAT | GO:0017124~SH3 domain binding | 11 | 0.78 | 0.044255466 | 2.017696672 | 1 | 0.5375763 | 50.45869916 |
| SP_PIR_KEYWORDS | allosteric enzyme | 10 | 0.71 | 0.000642214 | 3.977100597 | 0.269585743 | 0.018309335 | 0.917978337 |
| GOTERM_BP_FAT | GO:0001657~ureteric bud development | 10 | 0.71 | 0.001896653 | 3.452762108 | 0.996561024 | 0.08880025 | 3.359251042 |
| GOTERM_BP_FAT | GO:0043388~positive regulation of DNA binding | 10 | 0.71 | 0.001896653 | 3.452762108 | 0.996561024 | 0.08880025 | 3.359251042 |
| GOTERM_BP_FAT | GO:0045785~positive regulation of cell adhesion | 10 | 0.71 | 0.002254802 | 3.372465315 | 0.998823198 | 0.098566075 | 3.981500718 |
| INTERPRO | IPR001791:Laminin G | 10 | 0.71 | 0.002868391 | 3.267660044 | 0.990221977 | 0.206562812 | 4.699956427 |
| GOTERM_BP_FAT | GO:0051099~positive regulation of binding | 10 | 0.71 | 0.003131395 | 3.222577968 | 0.999914866 | 0.120475457 | 5.488574214 |
| GOTERM_MF_FAT | GO:0015171~amino acid transmembrane transporter activity | 10 | 0.71 | 0.006535102 | 2.898146129 | 0.996646132 | 0.219424272 | 9.673278963 |
| SMART | SM00282:LamG | 10 | 0.71 | 0.007954514 | 2.791074431 | 0.910352367 | 0.260280013 | 10.13211045 |
| UP_SEQ_FEATURE | domain:Ig-like C2-type 5 | 10 | 0.71 | 0.007978955 | 2.804796919 | 1 | 0.725520733 | 13.38820788 |
| GOTERM_BP_FAT | GO:0030278~regulation of ossification | 10 | 0.71 | 0.009575042 | 2.736151104 | 1 | 0.229985678 | 15.90042241 |
| GOTERM_BP_FAT | GO:0007219~Notch signaling pathway | 10 | 0.71 | 0.010807746 | 2.68548164 | 1 | 0.238794139 | 17.76458587 |
| GOTERM_BP_FAT | GO:0002819~regulation of adaptive immune response | 10 | 0.71 | 0.013625076 | 2.589571581 | 1 | 0.263545353 | 21.87964866 |
| GOTERM_BP_FAT | GO:0002822~regulation of adaptive immune response based on somatic recombination of immune receptors built from immunoglobulin superfamily domains | 10 | 0.71 | 0.013625076 | 2.589571581 | 1 | 0.263545353 | 21.87964866 |
| GOTERM_BP_FAT | GO:0031589~cell-substrate adhesion | 10 | 0.71 | 0.015221895 | 2.544140501 | 1 | 0.277512338 | 24.12484312 |
| GOTERM_BP_FAT | GO:0050727~regulation of inflammatory response | 10 | 0.71 | 0.015221895 | 2.544140501 | 1 | 0.277512338 | 24.12484312 |
| GOTERM_BP_FAT | GO:0042129~regulation of T cell proliferation | 10 | 0.71 | 0.018821757 | 2.45789845 | 1 | 0.308347403 | 28.96487683 |
| UP_SEQ_FEATURE | repeat:LRR 14 | 10 | 0.71 | 0.019045133 | 2.447822765 | 1 | 0.911847284 | 29.17849547 |
| GOTERM_MF_FAT | GO:0043176~amine binding | 10 | 0.71 | 0.023091883 | 2.375529614 | 0.999999998 | 0.398033918 | 30.40759221 |
| SP_PIR_KEYWORDS | Tight junction | 10 | 0.71 | 0.024855465 | 2.347141336 | 0.999995484 | 0.239294827 | 30.32430015 |
| GOTERM_BP_FAT | GO:0002706~regulation of lymphocyte mediated immunity | 10 | 0.71 | 0.033274273 | 2.231015516 | 1 | 0.399914576 | 45.61512371 |
| GOTERM_BP_FAT | GO:0050870~positive regulation of T cell activation | 10 | 0.71 | 0.036269324 | 2.197212251 | 1 | 0.414833411 | 48.56920607 |
| GOTERM_BP_FAT | GO:0042472~inner ear morphogenesis | 10 | 0.71 | 0.039443838 | 2.164418038 | 1 | 0.43288664 | 51.53451933 |
| INTERPRO | IPR011616:bZIP transcription factor, bZIP-1 | 9 | 0.64 | 0.000674824 | 4.41134106 | 0.662944956 | 0.094134517 | 1.124932407 |
| INTERPRO | IPR005829:Sugar transporter, conserved site | 9 | 0.64 | 0.000855959 | 4.269039735 | 0.748305924 | 0.100681956 | 1.424852389 |
| UP_SEQ_FEATURE | domain:Collagen-like | 9 | 0.64 | 0.001893256 | 3.78647584 | 0.99593411 | 0.367933213 | 3.342983155 |
| GOTERM_BP_FAT | GO:0051222~positive regulation of protein transport | 9 | 0.64 | 0.002632652 | 3.625400213 | 0.999620531 | 0.110915732 | 4.633878561 |
| INTERPRO | IPR012680:Laminin G, subdomain 2 | 9 | 0.64 | 0.00411615 | 3.393339277 | 0.998699235 | 0.260688917 | 6.678920676 |
| INTERPRO | IPR008983:Tumour necrosis factor-like | 9 | 0.64 | 0.005668306 | 3.227810531 | 0.999894586 | 0.306708516 | 9.086742712 |
| GOTERM_BP_FAT | GO:0002699~positive regulation of immune effector process | 9 | 0.64 | 0.012361068 | 2.837269732 | 1 | 0.255439142 | 20.05806251 |
| GOTERM_BP_FAT | GO:0010001~glial cell differentiation | 9 | 0.64 | 0.015843123 | 2.71905016 | 1 | 0.283727165 | 24.98173494 |
| GOTERM_BP_FAT | GO:0032946~positive regulation of mononuclear cell proliferation | 9 | 0.64 | 0.019983586 | 2.610288154 | 1 | 0.3173306 | 30.46367546 |
| GOTERM_BP_FAT | GO:0001942~hair follicle development | 9 | 0.64 | 0.019983586 | 2.610288154 | 1 | 0.3173306 | 30.46367546 |
| GOTERM_BP_FAT | GO:0022405~hair cycle process | 9 | 0.64 | 0.019983586 | 2.610288154 | 1 | 0.3173306 | 30.46367546 |
| GOTERM_BP_FAT | GO:0022404~molting cycle process | 9 | 0.64 | 0.019983586 | 2.610288154 | 1 | 0.3173306 | 30.46367546 |
| GOTERM_BP_FAT | GO:0050671~positive regulation of lymphocyte proliferation | 9 | 0.64 | 0.019983586 | 2.610288154 | 1 | 0.3173306 | 30.46367546 |
| GOTERM_BP_FAT | GO:0007631~feeding behavior | 9 | 0.64 | 0.022318983 | 2.559106033 | 1 | 0.330655194 | 33.38652613 |
| GOTERM_BP_FAT | GO:0070665~positive regulation of leukocyte proliferation | 9 | 0.64 | 0.024840352 | 2.509892455 | 1 | 0.344429467 | 36.41169496 |
| GOTERM_BP_FAT | GO:0042063~gliogenesis | 9 | 0.64 | 0.024840352 | 2.509892455 | 1 | 0.344429467 | 36.41169496 |
| GOTERM_BP_FAT | GO:0042303~molting cycle | 9 | 0.64 | 0.024840352 | 2.509892455 | 1 | 0.344429467 | 36.41169496 |
| GOTERM_BP_FAT | GO:0042633~hair cycle | 9 | 0.64 | 0.024840352 | 2.509892455 | 1 | 0.344429467 | 36.41169496 |
| GOTERM_CC_FAT | GO:0014069~postsynaptic density | 9 | 0.64 | 0.025907504 | 2.487698123 | 0.999937845 | 0.268346294 | 30.35941451 |
| GOTERM_BP_FAT | GO:0008585~female gonad development | 9 | 0.64 | 0.027554184 | 2.462535994 | 1 | 0.364749756 | 39.52258161 |
| GOTERM_BP_FAT | GO:0051047~positive regulation of secretion | 9 | 0.64 | 0.027554184 | 2.462535994 | 1 | 0.364749756 | 39.52258161 |
| GOTERM_BP_FAT | GO:0001508~regulation of action potential | 9 | 0.64 | 0.030466609 | 2.416933476 | 1 | 0.383705528 | 42.70095167 |
| GOTERM_BP_FAT | GO:0035282~segmentation | 9 | 0.64 | 0.030466609 | 2.416933476 | 1 | 0.383705528 | 42.70095167 |
| GOTERM_BP_FAT | GO:0006959~humoral immune response | 9 | 0.64 | 0.030466609 | 2.416933476 | 1 | 0.383705528 | 42.70095167 |
| GOTERM_BP_FAT | GO:0035148~tube lumen formation | 9 | 0.64 | 0.048192886 | 2.212108605 | 1 | 0.478036808 | 58.89363991 |
| GOTERM_BP_FAT | GO:0051090~regulation of transcription factor activity | 9 | 0.64 | 0.048192886 | 2.212108605 | 1 | 0.478036808 | 58.89363991 |
| GOTERM_BP_FAT | GO:0051952~regulation of amine transport | 8 | 0.57 | 0.001151866 | 4.640512273 | 0.968055658 | 0.073673027 | 2.053036226 |
| GOTERM_BP_FAT | GO:0043123~positive regulation of I-kappaB kinase/NF-kappaB cascade | 8 | 0.57 | 0.006321494 | 3.515539601 | 0.999999994 | 0.191767392 | 10.78667662 |
| GOTERM_BP_FAT | GO:0002824~positive regulation of adaptive immune response based on somatic recombination of immune receptors built from immunoglobulin superfamily domains | 8 | 0.57 | 0.007497563 | 3.412141377 | 1 | 0.210777162 | 12.66813495 |
| GOTERM_BP_FAT | GO:0051091~positive regulation of transcription factor activity | 8 | 0.57 | 0.007497563 | 3.412141377 | 1 | 0.210777162 | 12.66813495 |
| GOTERM_BP_FAT | GO:0002821~positive regulation of adaptive immune response | 8 | 0.57 | 0.007497563 | 3.412141377 | 1 | 0.210777162 | 12.66813495 |
| INTERPRO | IPR016160:Aldehyde dehydrogenase, conserved site | 8 | 0.57 | 0.008232417 | 3.36102176 | 0.999998354 | 0.400826732 | 12.93686211 |
| GOTERM_BP_FAT | GO:0042102~positive regulation of T cell proliferation | 8 | 0.57 | 0.008827765 | 3.314651624 | 1 | 0.221158656 | 14.75099407 |
| KEGG_PATHWAY | mmu00500:Starch and sucrose metabolism | 8 | 0.57 | 0.009360237 | 3.26951567 | 0.782052197 | 0.224243513 | 10.75608489 |
| GOTERM_BP_FAT | GO:0002541~activation of plasma proteins involved in acute inflammatory response | 8 | 0.57 | 0.010323138 | 3.222577968 | 1 | 0.234550331 | 17.03643872 |
| GOTERM_BP_FAT | GO:0006956~complement activation | 8 | 0.57 | 0.010323138 | 3.222577968 | 1 | 0.234550331 | 17.03643872 |
| UP_SEQ_FEATURE | domain:PDZ 1 | 8 | 0.57 | 0.011127482 | 3.167770638 | 1 | 0.803152599 | 18.18999433 |
| SP_PIR_KEYWORDS | tyrosine-specific protein kinase | 8 | 0.57 | 0.012857343 | 3.095689113 | 0.998214415 | 0.169824297 | 16.95343493 |
| SP_PIR_KEYWORDS | neurotransmitter transport | 8 | 0.57 | 0.012857343 | 3.095689113 | 0.998214415 | 0.169824297 | 16.95343493 |
| GOTERM_BP_FAT | GO:0008584~male gonad development | 8 | 0.57 | 0.015908046 | 2.974687355 | 1 | 0.283047498 | 25.07075669 |
| GOTERM_BP_FAT | GO:0043122~regulation of I-kappaB kinase/NF-kappaB cascade | 8 | 0.57 | 0.018170488 | 2.900320171 | 1 | 0.301012561 | 28.11142575 |
| INTERPRO | IPR018000:Neurotransmitter-gated ion-channel, conserved site | 8 | 0.57 | 0.019341437 | 2.869164917 | 1 | 0.582724722 | 27.9143585 |
| SP_PIR_KEYWORDS | amidation | 8 | 0.57 | 0.019428401 | 2.86351243 | 0.999931863 | 0.208638007 | 24.54598396 |
| GOTERM_BP_FAT | GO:0050769~positive regulation of neurogenesis | 8 | 0.57 | 0.020649669 | 2.829580654 | 1 | 0.31784474 | 31.30942303 |
| KEGG_PATHWAY | mmu04960:Aldosterone-regulated sodium reabsorption | 8 | 0.57 | 0.021346512 | 2.802442002 | 0.9696688 | 0.295000255 | 22.97962951 |
| INTERPRO | IPR006201:Neurotransmitter-gated ion-channel | 8 | 0.57 | 0.021890896 | 2.800851466 | 1 | 0.608733944 | 30.99150855 |
| INTERPRO | IPR006202:Neurotransmitter-gated ion-channel ligand-binding | 8 | 0.57 | 0.021890896 | 2.800851466 | 1 | 0.608733944 | 30.99150855 |
| INTERPRO | IPR006029:Neurotransmitter-gated ion-channel transmembrane region | 8 | 0.57 | 0.021890896 | 2.800851466 | 1 | 0.608733944 | 30.99150855 |
| GOTERM_BP_FAT | GO:0046651~lymphocyte proliferation | 8 | 0.57 | 0.023354695 | 2.762209686 | 1 | 0.335127327 | 34.64527534 |
| GOTERM_MF_FAT | GO:0016836~hydro-lyase activity | 8 | 0.57 | 0.02343314 | 2.76013917 | 0.999999999 | 0.387749549 | 30.78385461 |
| GOTERM_BP_FAT | GO:0070661~leukocyte proliferation | 8 | 0.57 | 0.026294126 | 2.697972252 | 1 | 0.355886159 | 38.0964842 |
| GOTERM_BP_FAT | GO:0032943~mononuclear cell proliferation | 8 | 0.57 | 0.026294126 | 2.697972252 | 1 | 0.355886159 | 38.0964842 |
| GOTERM_BP_FAT | GO:0008652~cellular amino acid biosynthetic process | 8 | 0.57 | 0.029475925 | 2.636654701 | 1 | 0.380018186 | 41.6379433 |
| COG_ONTOLOGY | Amino acid transport and metabolism | 8 | 0.57 | 0.036060424 | 2.497704316 | 0.600749676 | 0.600749676 | 25.76776022 |
| GOTERM_BP_FAT | GO:0045088~regulation of innate immune response | 8 | 0.57 | 0.036595215 | 2.52201754 | 1 | 0.416173859 | 48.88133437 |
| GOTERM_BP_FAT | GO:0001649~osteoblast differentiation | 8 | 0.57 | 0.040545253 | 2.468357592 | 1 | 0.438932747 | 52.52506557 |
| GOTERM_BP_FAT | GO:0010720~positive regulation of cell development | 8 | 0.57 | 0.040545253 | 2.468357592 | 1 | 0.438932747 | 52.52506557 |
| INTERPRO | IPR001723:Steroid hormone receptor | 8 | 0.57 | 0.042137478 | 2.450745033 | 1 | 0.723171014 | 51.39696266 |
| GOTERM_BP_FAT | GO:0042398~cellular amino acid derivative biosynthetic process | 8 | 0.57 | 0.04476269 | 2.416933476 | 1 | 0.457126504 | 56.14400902 |
| GOTERM_BP_FAT | GO:0042698~ovulation cycle | 8 | 0.57 | 0.04476269 | 2.416933476 | 1 | 0.457126504 | 56.14400902 |
| INTERPRO | IPR008946:Nuclear hormone receptor, ligand-binding | 8 | 0.57 | 0.046396222 | 2.400729828 | 1 | 0.738859955 | 54.89429834 |
| INTERPRO | IPR000536:Nuclear hormone receptor, ligand-binding, core | 8 | 0.57 | 0.046396222 | 2.400729828 | 1 | 0.738859955 | 54.89429834 |
| GOTERM_MF_FAT | GO:0003707~steroid hormone receptor activity | 8 | 0.57 | 0.049405016 | 2.365833574 | 1 | 0.557522857 | 54.44246765 |
| GOTERM_MF_FAT | GO:0051183~vitamin transporter activity | 7 | 0.50 | 0.000953989 | 5.635284139 | 0.563694464 | 0.053793236 | 1.470082957 |
| SP_PIR_KEYWORDS | complement pathway | 7 | 0.50 | 0.007831468 | 3.854728271 | 0.978606376 | 0.124162374 | 10.67297779 |
| GOTERM_BP_FAT | GO:0032680~regulation of tumor necrosis factor production | 7 | 0.50 | 0.008902365 | 3.759674295 | 1 | 0.220976284 | 14.86640247 |
| GOTERM_BP_FAT | GO:0001658~branching involved in ureteric bud morphogenesis | 7 | 0.50 | 0.010684823 | 3.625400213 | 1 | 0.238158896 | 17.58046151 |
| GOTERM_BP_FAT | GO:0060675~ureteric bud morphogenesis | 7 | 0.50 | 0.010684823 | 3.625400213 | 1 | 0.238158896 | 17.58046151 |
| GOTERM_BP_FAT | GO:0042098~T cell proliferation | 7 | 0.50 | 0.010684823 | 3.625400213 | 1 | 0.238158896 | 17.58046151 |
| GOTERM_BP_FAT | GO:0050873~brown fat cell differentiation | 7 | 0.50 | 0.012705948 | 3.500386413 | 1 | 0.259815152 | 20.55901518 |
| GOTERM_BP_FAT | GO:0042401~biogenic amine biosynthetic process | 7 | 0.50 | 0.012705948 | 3.500386413 | 1 | 0.259815152 | 20.55901518 |
| GOTERM_BP_FAT | GO:0006584~catecholamine metabolic process | 7 | 0.50 | 0.014980632 | 3.383706866 | 1 | 0.27708684 | 23.78957067 |
| GOTERM_BP_FAT | GO:0034311~diol metabolic process | 7 | 0.50 | 0.014980632 | 3.383706866 | 1 | 0.27708684 | 23.78957067 |
| GOTERM_BP_FAT | GO:0006958~complement activation, classical pathway | 7 | 0.50 | 0.014980632 | 3.383706866 | 1 | 0.27708684 | 23.78957067 |
| GOTERM_BP_FAT | GO:0009712~catechol metabolic process | 7 | 0.50 | 0.014980632 | 3.383706866 | 1 | 0.27708684 | 23.78957067 |
| GOTERM_BP_FAT | GO:0018958~phenol metabolic process | 7 | 0.50 | 0.014980632 | 3.383706866 | 1 | 0.27708684 | 23.78957067 |
| GOTERM_BP_FAT | GO:0007189~activation of adenylate cyclase activity by G-protein signaling pathway | 7 | 0.50 | 0.020346378 | 3.172225187 | 1 | 0.315555695 | 30.92553702 |
| GOTERM_BP_FAT | GO:0034097~response to cytokine stimulus | 7 | 0.50 | 0.020346378 | 3.172225187 | 1 | 0.315555695 | 30.92553702 |
| GOTERM_BP_FAT | GO:0010579~positive regulation of adenylate cyclase activity by G-protein signaling pathway | 7 | 0.50 | 0.020346378 | 3.172225187 | 1 | 0.315555695 | 30.92553702 |
| GOTERM_BP_FAT | GO:0010578~regulation of adenylate cyclase activity involved in G-protein signaling | 7 | 0.50 | 0.020346378 | 3.172225187 | 1 | 0.315555695 | 30.92553702 |
| SP_PIR_KEYWORDS | amino-acid transport | 7 | 0.50 | 0.024879733 | 3.037058638 | 0.999995539 | 0.234960728 | 30.34918731 |
| UP_SEQ_FEATURE | domain:EGF-like 4; calcium-binding | 7 | 0.50 | 0.028240676 | 2.945036765 | 1 | 0.937587863 | 40.18969853 |
| GOTERM_BP_FAT | GO:0002455~humoral immune response mediated by circulating immunoglobulin | 7 | 0.50 | 0.03062 | 2.900320171 | 1 | 0.383669395 | 42.86389738 |
| UP_SEQ_FEATURE | domain:PDZ 2 | 7 | 0.50 | 0.032421724 | 2.855793226 | 1 | 0.935144467 | 44.64239559 |
| INTERPRO | IPR004031:PMP-22/EMP/MP20/Claudin | 7 | 0.50 | 0.032778709 | 2.859202539 | 1 | 0.704846014 | 42.7954839 |
| GOTERM_BP_FAT | GO:0051899~membrane depolarization | 7 | 0.50 | 0.034679373 | 2.819755722 | 1 | 0.408257397 | 47.02041478 |
| SP_PIR_KEYWORDS | sugar transport | 7 | 0.50 | 0.036685032 | 2.783970418 | 0.999999988 | 0.301177755 | 41.52259573 |
| INTERPRO | IPR003091:Voltage-dependent potassium channel | 7 | 0.50 | 0.036954837 | 2.781926794 | 1 | 0.710037361 | 46.79686106 |
| INTERPRO | IPR001811:Small chemokine, interleukin-8-like | 7 | 0.50 | 0.036954837 | 2.781926794 | 1 | 0.710037361 | 46.79686106 |
| GOTERM_BP_FAT | GO:0030335~positive regulation of cell migration | 7 | 0.50 | 0.039069979 | 2.743546107 | 1 | 0.432810092 | 51.1938792 |
| GOTERM_BP_FAT | GO:0033555~multicellular organismal response to stress | 7 | 0.50 | 0.039069979 | 2.743546107 | 1 | 0.432810092 | 51.1938792 |
| SP_PIR_KEYWORDS | blood coagulation | 7 | 0.50 | 0.041296843 | 2.708727974 | 0.999999999 | 0.327394158 | 45.4155004 |
| INTERPRO | IPR011042:Six-bladed beta-propeller, TolB-like | 7 | 0.50 | 0.041456326 | 2.708718194 | 1 | 0.723896883 | 50.81448007 |
| GOTERM_MF_FAT | GO:0008009~chemokine activity | 7 | 0.50 | 0.043923766 | 2.669345119 | 1 | 0.541900258 | 50.19123337 |
| GOTERM_BP_FAT | GO:0032103~positive regulation of response to external stimulus | 7 | 0.50 | 0.048869149 | 2.602851435 | 1 | 0.47842987 | 59.41615151 |
| GOTERM_MF_FAT | GO:0042379~chemokine receptor binding | 7 | 0.50 | 0.049007505 | 2.600900372 | 1 | 0.561280819 | 54.14596003 |
| INTERPRO | IPR005828:General substrate transporter | 6 | 0.43 | 0.00171286 | 6.301915799 | 0.936820985 | 0.168163084 | 2.83213322 |
| UP_SEQ_FEATURE | binding site:AMP | 6 | 0.43 | 0.001734737 | 6.213703943 | 0.993550717 | 0.367785177 | 3.067179892 |
| GOTERM_BP_FAT | GO:0032652~regulation of interleukin-1 production | 6 | 0.43 | 0.001817529 | 6.214971794 | 0.995641899 | 0.086612729 | 3.221267479 |
| GOTERM_BP_FAT | GO:0051180~vitamin transport | 6 | 0.43 | 0.004724259 | 5.118212066 | 0.999999284 | 0.163984416 | 8.170076644 |
| UP_SEQ_FEATURE | domain:VWFA 2 | 6 | 0.43 | 0.006498906 | 4.751655957 | 0.999999994 | 0.717119044 | 11.04016684 |
| BIOCARTA | m_Ccr5Pathway:Pertussis toxin-insensitive CCR5 Signaling in Macrophage | 6 | 0.43 | 0.009915194 | 4.182142857 | 0.816216176 | 0.816216176 | 11.44686303 |
| INTERPRO | IPR003129:Laminin G, thrombospondin-type, N-terminal | 6 | 0.43 | 0.011699721 | 4.2012772 | 0.999999994 | 0.491922171 | 17.89978277 |
| SP_PIR_KEYWORDS | amino-acid biosynthesis | 6 | 0.43 | 0.013040062 | 4.090732043 | 0.998368949 | 0.163302362 | 17.1738306 |
| GOTERM_BP_FAT | GO:0051971~positive regulation of transmission of nerve impulse | 6 | 0.43 | 0.015098146 | 3.954982051 | 1 | 0.27725219 | 23.95304816 |
| KEGG_PATHWAY | mmu00910:Nitrogen metabolism | 6 | 0.43 | 0.016981747 | 3.83812709 | 0.937629919 | 0.29307712 | 18.71855088 |
| INTERPRO | IPR000233:Cadherin cytoplasmic region | 6 | 0.43 | 0.01728773 | 3.835948747 | 1 | 0.562332812 | 25.34222304 |
| GOTERM_BP_FAT | GO:0031646~positive regulation of neurological system process | 6 | 0.43 | 0.021749788 | 3.625400213 | 1 | 0.325272426 | 32.68504327 |
| GOTERM_MF_FAT | GO:0005544~calcium-dependent phospholipid binding | 6 | 0.43 | 0.021808944 | 3.622682661 | 0.999999995 | 0.404219803 | 28.97586019 |
| GOTERM_MF_FAT | GO:0051119~sugar transmembrane transporter activity | 6 | 0.43 | 0.021808944 | 3.622682661 | 0.999999995 | 0.404219803 | 28.97586019 |
| SMART | SM00210:TSPN | 6 | 0.43 | 0.021849246 | 3.588524268 | 0.998733662 | 0.426483637 | 25.58465168 |
| INTERPRO | IPR017946:PLC-like phosphodiesterase, TIM beta/alpha-barrel domain | 6 | 0.43 | 0.024403376 | 3.529072848 | 1 | 0.639603639 | 33.90285138 |
| GOTERM_BP_FAT | GO:0002064~epithelial cell development | 6 | 0.43 | 0.025689512 | 3.480384205 | 1 | 0.352368017 | 37.40097955 |
| GOTERM_BP_FAT | GO:0060078~regulation of postsynaptic membrane potential | 6 | 0.43 | 0.025689512 | 3.480384205 | 1 | 0.352368017 | 37.40097955 |
| INTERPRO | IPR001315:Caspase Recruitment | 6 | 0.43 | 0.028573056 | 3.393339277 | 1 | 0.662464365 | 38.48104976 |
| UP_SEQ_FEATURE | lipid moiety-binding region:GPI-anchor amidated glycine | 6 | 0.43 | 0.02900162 | 3.365756303 | 1 | 0.93657649 | 41.02446943 |
| UP_SEQ_FEATURE | metal ion-binding site:Divalent metal cation 1 | 6 | 0.43 | 0.034106039 | 3.23112605 | 1 | 0.92954754 | 46.34611502 |
| UP_SEQ_FEATURE | metal ion-binding site:Divalent metal cation 2 | 6 | 0.43 | 0.034106039 | 3.23112605 | 1 | 0.92954754 | 46.34611502 |
| GOTERM_BP_FAT | GO:0007435~salivary gland morphogenesis | 6 | 0.43 | 0.034865751 | 3.222577968 | 1 | 0.40841052 | 47.20422135 |
| GOTERM_BP_FAT | GO:0010811~positive regulation of cell-substrate adhesion | 6 | 0.43 | 0.034865751 | 3.222577968 | 1 | 0.40841052 | 47.20422135 |
| GOTERM_BP_FAT | GO:0046456~icosanoid biosynthetic process | 6 | 0.43 | 0.034865751 | 3.222577968 | 1 | 0.40841052 | 47.20422135 |
| GOTERM_CC_FAT | GO:0043197~dendritic spine | 6 | 0.43 | 0.038702458 | 3.132656896 | 0.999999527 | 0.356839461 | 41.96255588 |
| UP_SEQ_FEATURE | domain:EGF-like 8 | 6 | 0.43 | 0.039732942 | 3.106851972 | 1 | 0.951198628 | 51.68585757 |
| UP_SEQ_FEATURE | repeat:LRR 18 | 6 | 0.43 | 0.039732942 | 3.106851972 | 1 | 0.951198628 | 51.68585757 |
| GOTERM_BP_FAT | GO:0006636~unsaturated fatty acid biosynthetic process | 6 | 0.43 | 0.040122475 | 3.107485897 | 1 | 0.436984226 | 52.1471268 |
| GOTERM_MF_FAT | GO:0005272~sodium channel activity | 6 | 0.43 | 0.040225858 | 3.105156566 | 1 | 0.531923298 | 47.11651119 |
| SP_PIR_KEYWORDS | sodium channel | 6 | 0.43 | 0.042126855 | 3.068049032 | 0.999999999 | 0.327736042 | 46.08998894 |
| GOTERM_CC_FAT | GO:0005901~caveola | 6 | 0.43 | 0.044468279 | 3.020776292 | 0.999999949 | 0.38094818 | 46.58122975 |
| GOTERM_BP_FAT | GO:0048489~synaptic vesicle transport | 6 | 0.43 | 0.045834251 | 3.000331211 | 1 | 0.462223656 | 57.02109019 |
| SP_PIR_KEYWORDS | vitamin a | 5 | 0.35 | 0.001315711 | 8.948476343 | 0.474710787 | 0.031677721 | 1.872246759 |
| INTERPRO | IPR003663:Sugar/inositol transporter | 5 | 0.35 | 0.0047548 | 6.68385009 | 0.999537217 | 0.283829513 | 7.676814096 |
| GOTERM_BP_FAT | GO:0032651~regulation of interleukin-1 beta production | 5 | 0.35 | 0.009677134 | 5.57753879 | 1 | 0.228508344 | 16.05631539 |
| INTERPRO | IPR003585:Neurexin/syndecan/glycophorin C | 5 | 0.35 | 0.012243936 | 5.2515965 | 0.999999998 | 0.495592111 | 18.65415507 |
| GOTERM_BP_FAT | GO:0051057~positive regulation of small GTPase mediated signal transduction | 5 | 0.35 | 0.016547501 | 4.833866951 | 1 | 0.290961498 | 25.94226248 |
| GOTERM_BP_FAT | GO:0007405~neuroblast proliferation | 5 | 0.35 | 0.016547501 | 4.833866951 | 1 | 0.290961498 | 25.94226248 |
| GOTERM_BP_FAT | GO:0032760~positive regulation of tumor necrosis factor production | 5 | 0.35 | 0.016547501 | 4.833866951 | 1 | 0.290961498 | 25.94226248 |
| BIOCARTA | m_cblPathway:CBL mediated ligand-induced downregulation of EGF receptors | 5 | 0.35 | 0.016629801 | 4.646825397 | 0.942204064 | 0.759592146 | 18.50158938 |
| SP_PIR_KEYWORDS | Growth factor binding | 5 | 0.35 | 0.0173074 | 4.772520716 | 0.999804003 | 0.196604406 | 22.16891462 |
| SMART | SM00294:4.1m | 5 | 0.35 | 0.020826479 | 4.485655335 | 0.998263729 | 0.438879492 | 24.53706422 |
| SP_PIR_KEYWORDS | leucine zipper | 5 | 0.35 | 0.021828284 | 4.474238172 | 0.999979442 | 0.221964099 | 27.15407805 |
| INTERPRO | IPR006212:Furin-like repeat | 5 | 0.35 | 0.024746657 | 4.324844176 | 1 | 0.635493561 | 34.29154049 |
| UP_SEQ_FEATURE | domain:VWFA 1 | 5 | 0.35 | 0.026723567 | 4.207195378 | 1 | 0.933687939 | 38.49199053 |
| GOTERM_BP_FAT | GO:0002673~regulation of acute inflammatory response | 5 | 0.35 | 0.031482272 | 4.028222459 | 1 | 0.387472914 | 43.77176284 |
| INTERPRO | IPR001148:Carbonic anhydrase, alpha-class, catalytic domain | 5 | 0.35 | 0.036193142 | 3.869597421 | 1 | 0.709821796 | 46.08724443 |
| INTERPRO | IPR015590:Aldehyde dehydrogenase | 5 | 0.35 | 0.036193142 | 3.869597421 | 1 | 0.709821796 | 46.08724443 |
| INTERPRO | IPR000867:Insulin-like growth factor-binding protein, IGFBP | 5 | 0.35 | 0.036193142 | 3.869597421 | 1 | 0.709821796 | 46.08724443 |
| INTERPRO | IPR016162:Aldehyde dehydrogenase, N-terminal | 5 | 0.35 | 0.036193142 | 3.869597421 | 1 | 0.709821796 | 46.08724443 |
| GOTERM_BP_FAT | GO:0042417~dopamine metabolic process | 5 | 0.35 | 0.037767209 | 3.816210751 | 1 | 0.424807834 | 49.98911269 |
| GOTERM_BP_FAT | GO:0048265~response to pain | 5 | 0.35 | 0.037767209 | 3.816210751 | 1 | 0.424807834 | 49.98911269 |
| GOTERM_BP_FAT | GO:0060444~branching involved in mammary gland duct morphogenesis | 5 | 0.35 | 0.037767209 | 3.816210751 | 1 | 0.424807834 | 49.98911269 |
| PIR_SUPERFAMILY | PIRSF002504:cadherin | 5 | 0.35 | 0.039541928 | 3.756232687 | 1 | 0.999994679 | 44.90635307 |
| UP_SEQ_FEATURE | domain:IGFBP N-terminal | 5 | 0.35 | 0.039943495 | 3.739729225 | 1 | 0.948202987 | 51.87557736 |
| SMART | SM00261:FU | 5 | 0.35 | 0.040965797 | 3.694069099 | 0.999996735 | 0.524349389 | 42.85178352 |
| GOTERM_BP_FAT | GO:0042558~pteridine and derivative metabolic process | 5 | 0.35 | 0.044717944 | 3.625400213 | 1 | 0.458271695 | 56.1070186 |
| GOTERM_BP_FAT | GO:0060079~regulation of excitatory postsynaptic membrane potential | 5 | 0.35 | 0.044717944 | 3.625400213 | 1 | 0.458271695 | 56.1070186 |
| GOTERM_BP_FAT | GO:0048145~regulation of fibroblast proliferation | 5 | 0.35 | 0.044717944 | 3.625400213 | 1 | 0.458271695 | 56.1070186 |
| UP_SEQ_FEATURE | domain:TSP N-terminal | 5 | 0.35 | 0.047718104 | 3.542901371 | 1 | 0.966015384 | 58.40828416 |
| UP_SEQ_FEATURE | domain:CARD | 5 | 0.35 | 0.047718104 | 3.542901371 | 1 | 0.966015384 | 58.40828416 |
| GOTERM_BP_FAT | GO:0060662~salivary gland cavitation | 4 | 0.28 | 0.002932338 | 11.60128068 | 0.999845404 | 0.119415627 | 5.148321504 |
| GOTERM_BP_FAT | GO:0060605~tube lumen cavitation | 4 | 0.28 | 0.002932338 | 11.60128068 | 0.999845404 | 0.119415627 | 5.148321504 |
| GOTERM_BP_FAT | GO:0035095~behavioral response to nicotine | 4 | 0.28 | 0.005564758 | 9.667733903 | 0.999999943 | 0.176245675 | 9.555890462 |
| UP_SEQ_FEATURE | repeat:BNR 5 | 4 | 0.28 | 0.006876255 | 8.97535014 | 0.999999998 | 0.714291212 | 11.64445981 |
| UP_SEQ_FEATURE | repeat:BNR 4 | 4 | 0.28 | 0.011373074 | 7.693157263 | 1 | 0.794496081 | 18.55377841 |
| INTERPRO | IPR003608:MIR | 4 | 0.28 | 0.019280538 | 6.535320088 | 1 | 0.591850805 | 27.83929952 |
| INTERPRO | IPR007421:ATPase associated with various cellular activities, AAA-4 | 4 | 0.28 | 0.019280538 | 6.535320088 | 1 | 0.591850805 | 27.83929952 |
| INTERPRO | IPR016093:MIR motif | 4 | 0.28 | 0.019280538 | 6.535320088 | 1 | 0.591850805 | 27.83929952 |
| GOTERM_BP_FAT | GO:0035094~response to nicotine | 4 | 0.28 | 0.019990445 | 6.445155935 | 1 | 0.31577961 | 30.47243522 |
| GOTERM_MF_FAT | GO:0016918~retinal binding | 4 | 0.28 | 0.020028506 | 6.44032473 | 0.999999977 | 0.394878848 | 26.94322765 |
| GOTERM_MF_FAT | GO:0005355~glucose transmembrane transporter activity | 4 | 0.28 | 0.020028506 | 6.44032473 | 0.999999977 | 0.394878848 | 26.94322765 |
| SP_PIR_KEYWORDS | hydroxyproline | 4 | 0.28 | 0.020711488 | 6.363360955 | 0.999964082 | 0.216256216 | 25.95100448 |
| UP_SEQ_FEATURE | repeat:BNR 3 | 4 | 0.28 | 0.024399107 | 5.98356676 | 1 | 0.936704415 | 35.80230166 |
| SMART | SM00472:MIR | 4 | 0.28 | 0.029243151 | 5.582148861 | 0.999871956 | 0.498158992 | 32.76702508 |
| UP_SEQ_FEATURE | repeat:BNR 2 | 4 | 0.28 | 0.032966693 | 5.385210084 | 1 | 0.933134131 | 45.19915464 |
| UP_SEQ_FEATURE | repeat:BNR 1 | 4 | 0.28 | 0.032966693 | 5.385210084 | 1 | 0.933134131 | 45.19915464 |
| INTERPRO | IPR019742:Alpha-2-macroglobulin, conserved site | 4 | 0.28 | 0.034205784 | 5.347080072 | 1 | 0.704449021 | 44.1936317 |
| GOTERM_BP_FAT | GO:0046325~negative regulation of glucose import | 4 | 0.28 | 0.035417825 | 5.273309401 | 1 | 0.410320801 | 47.74515005 |
| GOTERM_BP_FAT | GO:0040036~regulation of fibroblast growth factor receptor signaling pathway | 4 | 0.28 | 0.035417825 | 5.273309401 | 1 | 0.410320801 | 47.74515005 |
| GOTERM_BP_FAT | GO:0051181~cofactor transport | 4 | 0.28 | 0.035417825 | 5.273309401 | 1 | 0.410320801 | 47.74515005 |
| GOTERM_MF_FAT | GO:0051184~cofactor transporter activity | 4 | 0.28 | 0.03548281 | 5.269356598 | 1 | 0.502253602 | 42.91256921 |
| INTERPRO | IPR004170:WWE domain | 4 | 0.28 | 0.043356958 | 4.901490066 | 1 | 0.727009475 | 52.42362327 |
| GOTERM_BP_FAT | GO:0010829~negative regulation of glucose transport | 4 | 0.28 | 0.044863593 | 4.833866951 | 1 | 0.456413699 | 56.22731424 |
| GOTERM_BP_FAT | GO:0042423~catecholamine biosynthetic process | 4 | 0.28 | 0.044863593 | 4.833866951 | 1 | 0.456413699 | 56.22731424 |
| GOTERM_BP_FAT | GO:0060135~maternal process involved in female pregnancy | 4 | 0.28 | 0.044863593 | 4.833866951 | 1 | 0.456413699 | 56.22731424 |
| GOTERM_BP_FAT | GO:0050433~regulation of catecholamine secretion | 4 | 0.28 | 0.044863593 | 4.833866951 | 1 | 0.456413699 | 56.22731424 |
| INTERPRO | IPR015395:C-myb, C-terminal | 3 | 0.21 | 0.013214975 | 14.7044702 | 1 | 0.51050196 | 19.9840117 |
| GOTERM_MF_FAT | GO:0050543~icosatetraenoic acid binding | 3 | 0.21 | 0.013588205 | 14.49073064 | 0.999993135 | 0.318541335 | 19.12710732 |
| GOTERM_MF_FAT | GO:0050542~icosanoid binding | 3 | 0.21 | 0.013588205 | 14.49073064 | 0.999993135 | 0.318541335 | 19.12710732 |
| GOTERM_MF_FAT | GO:0050544~arachidonic acid binding | 3 | 0.21 | 0.013588205 | 14.49073064 | 0.999993135 | 0.318541335 | 19.12710732 |
| SP_PIR_KEYWORDS | kinase-related transforming protein | 3 | 0.21 | 0.013922032 | 14.31756215 | 0.998946574 | 0.169136205 | 18.2300319 |
| INTERPRO | IPR018123:WWE domain, subgroup | 3 | 0.21 | 0.025241547 | 11.02835265 | 1 | 0.62492249 | 34.84811126 |
| UP_SEQ_FEATURE | domain:HTH myb-type 3 | 3 | 0.21 | 0.029849625 | 10.09726891 | 1 | 0.936139395 | 41.94178326 |
| UP_SEQ_FEATURE | domain:WWE 2 | 3 | 0.21 | 0.029849625 | 10.09726891 | 1 | 0.936139395 | 41.94178326 |
| UP_SEQ_FEATURE | domain:WWE 1 | 3 | 0.21 | 0.029849625 | 10.09726891 | 1 | 0.936139395 | 41.94178326 |
| UP_SEQ_FEATURE | site:Essential for catalytic activity | 3 | 0.21 | 0.029849625 | 10.09726891 | 1 | 0.936139395 | 41.94178326 |
| SMART | SM00678:WWE | 3 | 0.21 | 0.033995505 | 9.419876204 | 0.999970913 | 0.501597552 | 37.03885002 |
| INTERPRO | IPR006581:VPS10 | 3 | 0.21 | 0.040188927 | 8.822682119 | 1 | 0.726297054 | 49.71316199 |
| INTERPRO | IPR000699:Intracellular calcium-release channel | 3 | 0.21 | 0.040188927 | 8.822682119 | 1 | 0.726297054 | 49.71316199 |
| INTERPRO | IPR013662:RyR and IP3R Homology associated | 3 | 0.21 | 0.040188927 | 8.822682119 | 1 | 0.726297054 | 49.71316199 |
| GOTERM_BP_FAT | GO:0040037~negative regulation of fibroblast growth factor receptor signaling pathway | 3 | 0.21 | 0.041215164 | 8.700960512 | 1 | 0.442857115 | 53.11815777 |
| GOTERM_BP_FAT | GO:0070391~response to lipoteichoic acid | 3 | 0.21 | 0.041215164 | 8.700960512 | 1 | 0.442857115 | 53.11815777 |
| SP_PIR_KEYWORDS | neurotransmitter | 3 | 0.21 | 0.042232606 | 8.590537289 | 0.999999999 | 0.323450895 | 46.17536593 |
| PIR_SUPERFAMILY | PIRSF005322:glucose transport protein | 3 | 0.21 | 0.042371639 | 8.564210526 | 1 | 0.999831397 | 47.25668446 |
| UP_SEQ_FEATURE | region of interest:Nonhelical region 1 (NC1) | 3 | 0.21 | 0.047323636 | 8.077815126 | 1 | 0.967774186 | 58.09807598 |
| UP_SEQ_FEATURE | region of interest:Nonhelical region 4 (NC4) | 3 | 0.21 | 0.047323636 | 8.077815126 | 1 | 0.967774186 | 58.09807598 |
| UP_SEQ_FEATURE | domain:HTH myb-type 2 | 3 | 0.21 | 0.047323636 | 8.077815126 | 1 | 0.967774186 | 58.09807598 |
| UP_SEQ_FEATURE | region of interest:Nonhelical region 2 (NC2) | 3 | 0.21 | 0.047323636 | 8.077815126 | 1 | 0.967774186 | 58.09807598 |
| UP_SEQ_FEATURE | region of interest:Nonhelical region 3 (NC3) | 3 | 0.21 | 0.047323636 | 8.077815126 | 1 | 0.967774186 | 58.09807598 |
| UP_SEQ_FEATURE | domain:HTH myb-type 1 | 3 | 0.21 | 0.047323636 | 8.077815126 | 1 | 0.967774186 | 58.09807598 |
Cite This Work
To export a reference to this article please select a referencing stye below:
Related Services
View all


Related Content
All TagsContent relating to: "Diabetes"
Diabetes is a metabolic disorder that results in an abnormally high blood glucose level. Blood glucose levels are controlled by insulin produced by the pancreas. In diabetics, the pancreas either doesn’t produce enough (or any) insulin, or the body does not respond sufficiently to the insulin that the pancreas produces.
Related Articles

DMCA / Removal Request
If you are the original writer of this dissertation and no longer wish to have your work published on the UKDiss.com website then please: