Impact of Mobile Number Portability on Pricing in the Indian Telecom Industry
Info: 9192 words (37 pages) Dissertation
Published: 16th Dec 2019
Tagged: Technology
Analysing the impact of intra-circle and inter-circle MNP policies on the Indian telecom Industry
| The paper analyses the impact of Mobile Number Portability (MNP) on prices in the Indian telecom industry. MNP allows consumers to retain their mobile numbers when switching mobile operators, and thereby, should improve competition and reduce prices in the market. The Indian telecom industry is divided into 22 markets or segments. MNP was introduced by the Indian regulator in two phases: intra-circle MNP which allowed consumers the facility only within the same circle, while inter-circle MNP allowed consumers the facility between circles. Using quarterly data from 22 circles across 28 quarters, I find that intra-circle MNP reduced prices by 8.9%. On the other hand, the results for inter-circle MNP are inconclusive due to a variety of issues like omitted variable bias. Finally, the study shows that there is a difference in results between prepaid and post-paid customers which are on account of the difference in switching costs. |
- Introduction
“Switching costs arise when transactions, learning, or pecuniary costs are incurred by a user who changes suppliers (including for “follow-on” or “aftermarket” products such as refills and repairs). The ex-post market power that switching costs give suppliers need not create inefficiencies, and early “bargain” prices can compensate consumers for later “rip-off” pricing. More often, however, switching costs make new entry hard; distort firms’ product ranges, raise firms’ profits and lower consumer and social welfare” (Kemper, 2005).
When a consumer wants to switch his service provider, he usually incurs substantial costs. These switching costs could be explicit, like a fee to change operators; or it could be an implicit cost. Implicit costs can be the trouble of informing one’s acquaintances about the number change, or delinking the old mobile number and link the new one to many different services (like bank accounts). Thus, institutions and regulators attempt to reduce these costs of switching to improve the welfare of buyers and reduce monopoly power of firms (Cho et al., 2016).
Mobile number portability (MNP) allows subscribers to change their mobile operator while retaining their old mobile number, thus, helping to reduce consumers’ switching costs. India’s telecom regulator, the Telecom Regulatory Authority of India (2005), henceforth TRAI, argued that MNP would increase the level of competition among mobile operators, and thereby, improve consumer welfare; also rewarding the best operators for their superior service.
The Indian telecom industry is broken into 22 circles, which each circle roughly corresponding to an Indian state. Each of these circles is a different market and has different dominant operators. Even spectrum is auctioned separately for each of the circles.
MNP was introduced on a pilot basis in one circle, Haryana, in November 2010, and was subsequently introduced on a pan-India level in January 2011 (TRAI, 2011). The policy introduced only allowed for intra-circle portability, which meant that a consumer could only switch operators without changing numbers within the same circle. Inter-circle MNP, which allowed consumers to switch mobile operators across circles and retain their numbers, was introduced later in July 2015.
In this paper, I examine the impact of this policy on the Indian telecom industry; analysing how it has impacted price. While studies on other countries, like the US (Park, 2011), the European Union (Cho et al., 2016), Turkey (Kutlu, 2013) and Hong Kong (Shi et al., 2006) have been done, there are no such studies that have been done in India yet.
The analysis can give significant insight into the impact of TRAI’s policy intervention and give lessons for any future interventions that it may want to undertake.
2.1 Brief Overview of India Telecom Industry
Graph 1 – Telecom Subscriber Base
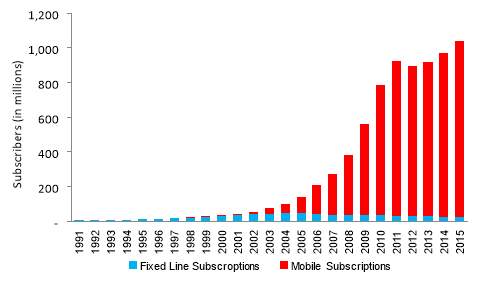
Source: World Development Indicators. Available at: http://data.worldbank.org/data-catalog/world-development-indicators.
The Indian Telecom Industry has been characterised by a huge growth in subscriber base, which has been mainly driven by growth in mobile subscribers (Graph 1). Mobile phones, which used to be seen as a luxury, are now seen as a necessity. Total teledensity rose from a meagre 2.81 in 2000 to 78.1 in February 2012 (TRAI, 2012). Mobile phone growth has been the major contributor to this increased teledensity because fixed-line teledensity has actually fallen over the last decade from 3.11 to 2.71 in February 2012 (TRAI, 2012). It has been stated (Waverman et al., 2005, cited in Vodafone, 2005) that this is because mobile phones are looked as substitutes to landline phones in emerging economies, unlike advanced economies where they are considered complements.
Graph 2 – Urban and Rural Tele-density
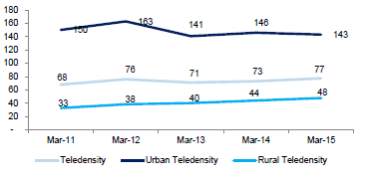
Source: Telecom Authority of India Performance Indicator Reports (2009 – 2015). Available at: http://www.trai.gov.in/release-publication/reports/performance-indicators-reports
This growth was brought about by several reforms in the telecommunications sector, like the New Telecom Policy of 1999, which transformed India’s telecommunications market from a state monopoly into a competitive market open to private operators (TRAI, 2012).
As a result, there has been a very large decrease in prices which contributed to the increased mobile penetration. The price to a customer for making a phone call has reduced immensely over a period of ten years from Rs 15.30 in 1998 to Rs 0.68 (Vodafone, 2009). The handset industry has also innovated, and one finds a series of cheap handsets that are available to the Indian consumer, including several in the sub $ 100 segment.
Despite the increase in density, there is still room for growth, especially in rural areas. As Graph 2 shows, rural teledensity is much lower than urban teledensity at only 48 (TRAI, 2015).
There has been significant growth in the data services in recent years (Graph 3). Although voice revenues constitute the majority of revenues, internet revenues have become a significant component of the operator’s revenues and a lot of the growth in the sector today is being driven by growth in data adoption and the entry of a new player in the market (Raj, 2017).
Graph 3 – Sources of Revenue for Mobile Operators
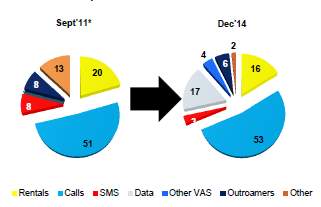
Source: Telecom Authority of India Performance Indicator Reports (2011 – 2014). Available at: http://www.trai.gov.in/release-publication/reports/performance-indicators-reports
2.2 Related Literature
Significant switching costs, like changing numbers, come in the way of consumers switching mobile operators. Cho et al (2016) argue that this is the reason telecom regulators all over the world have introduced MNP; before India introduced MNP in November 2011, about 64 countries had introduced MNP (Cho et al., 2016).
As one would expect, several studies have empirically shows that the introduction of MNP has to lead to lower prices in some countries. Park (2011) studied that the introduction of MNP had the result of lowering carrier prices in the United States. Investigations have also shown that MNP resulted in decreased prices and higher consumer surplus across 15 countries in the EU (Cho et al., 2016).
However, the mere introduction of the policy is no guarantee for improvement in consumer welfare. For instance, in Nigeria MNP has not been very successful in improving network quality, increasing mobile penetration, or reducing market power (Chidim et al., 2016). Researchers have hypothesised several reasons for instances where MNP hasn’t been very successful, which include the high costs for consumers to port their numbers, and administrative hindrances (Khan, 2010 cited in Kutlu, 2013). In fact, the French telecom regulator had to reduce the whole process of changing operators to 3 days in an effort to increase the adoption of this policy among consumers (ARCEP, 2011).
Sometimes the policy can even produce counterproductive results. In fact, Shi et al (2006) showed that MNP led to higher market concentration in Hong Kong in the long run due to because big mobile operators were able to deal with the higher degree of price competition, while smaller operators were not.
Therefore, the question of MNP’s impact in India does become a matter of interest. Being an emerging market, the Indian experience need not have been like the successful outcomes of some developed countries highlighted above.
TRAI has been diligent in ensuring the proper implementation of MNP; monitoring operators and ensuring that porting is done within laid down timelines. It has even given show cause notices to operators for rejecting consumers porting requests for frivolous reasons (TRAI, 2012). A survey conducted a few years into the introduction of intra-circle portability found the consumers had a good knowledge of MNP, and that many people had used the facility to change operators and some were considering using it due to low satisfaction with their present mobile operator (Naik, 2010).
3.1 Data
The main source of data for his paper has been from TRAI’s quarterly reports on the state of the industry (TRAI, 2009-2016). The dataset is a panel across 22 circles, for 28 quarters. The data is available from the fourth quarter of 2009, well before intra-circle MNP was introduced on a nationwide basis in the first quarter of 2011. Data is used until the second quarter of 2016.
Data for a quarter beyond the second quarter of 2016 would not be useful for the purposes of estimating the impact of the policy. This is because a new player, Reliance Jio Infocomm Limited, has entered the market after this period and offered data prices at much lower levels from the existing prices. This exogenous shock would make it difficult to estimate the impact of the MNP policy in isolation.
The main variables for estimation are average revenue per user per month (ARPU), and average minutes of usage per user per month (MOU). All the variables are industry averages in a circle. Firm-level quarterly data on a circle basis wasn’t available. The only data from individual operators that have been used is market shares that have been used to calculate the Herfindahl-Hirschman Index (HHI). Graph 4 shows how ARPU and MOU have changed on a pan-India basis for a period of time being analysed.
Graph 4 – India ARPU & MOU
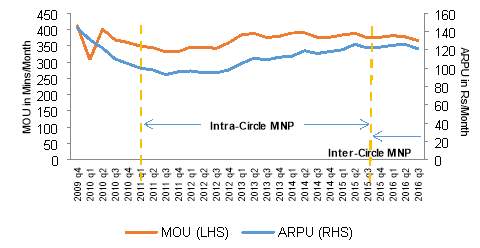
Source: Telecom Authority of India Performance Indicator Reports (2009 – 2016). Available at: http://www.trai.gov.in/release-publication/reports/performance-indicators-reports
Summary statistics for the main variables across circles are shown in the table below.
Table 1 – Summary Statistics
| Variable | Mean | Std Dev | Min Value | Max Value | Obs | |
| Before Policy Period | ||||||
| ARPU | Overall | 123.8 | 26.1 | 78.0 | 213.0 | 109 |
| Between | 21.9 | 92.0 | 183.6 | 22 | ||
| Within | 14.8 | 96.2 | 156.6 | 5 | ||
| MOU | Overall | 408.2 | 67.2 | 304.0 | 695.0 | 109 |
| Between | 55.9 | 338.4 | 527.4 | 22 | ||
| Within | 38.6 | 266.8 | 575.8 | 5 | ||
| HHI | Overall | 1828.6 | 290.6 | 1332.0 | 2755.0 | 616 |
| Between | 230.1 | 1452.8 | 2676.2 | 22 | ||
| Within | 89.1 | 1605.4 | 2132.4 | 28 | ||
| First Policy – Intra-circle MNP | ||||||
| ARPU | Overall | 110.3 | 27.9 | 63.0 | 210.0 | 397 |
| Between | 25.0 | 74.0 | 162.9 | 22 | ||
| Within | 13.5 | 66.5 | 195.3 | 18 | ||
| MOU | Overall | 382.3 | 67.0 | 270.0 | 673.0 | 397 |
| Between | 61.5 | 299.9 | 603.7 | 22 | ||
| Within | 29.7 | 283.7 | 451.7 | 18 | ||
| HHI | Overall | 1768.7 | 249.3 | 1270.0 | 2456.0 | 397 |
| Between | 225.0 | 1491.2 | 2310.5 | 22 | ||
| Within | 117.2 | 1384.4 | 2078.5 | 18 | ||
| Second Policy – Inter-circle MNP | ||||||
| ARPU | Overall | 127.7 | 33.2 | 77.0 | 212.0 | 110 |
| Between | 33.4 | 82.8 | 199.8 | 22 | ||
| Within | 5.3 | 91.7 | 139.9 | 5 | ||
| MOU | Overall | 383.1 | 48.0 | 282.0 | 534.0 | 110 |
| Between | 46.2 | 291.8 | 492.6 | 22 | ||
| Within | 15.7 | 271.5 | 424.5 | 5 | ||
| HHI | Overall | 1927.9 | 259.9 | 1509.0 | 2532.0 | 110 |
| Between | 259.0 | 1519.8 | 2459.2 | 22 | ||
| Within | 54.0 | 1671.1 | 2111.9 | 5 | ||
Source: Telecom Authority of India Performance Indicator Reports (2009 – 2016). Available at: http://www.trai.gov.in/release-publication/reports/performance-indicators-reports
3.2 Model Specification
For the purposes of estimating the impact of MNP on price, several specifications are used. The first one is the following reduced form model:
Ln(Priceit)= α+ δ1MNPitj+δ2MNPitj×Ln(Minutesit)+ βLn(Minutesit)+ γi+ ωt+ θXit+ εit
(Equation 1)
The dependent variable
Priceitis the ARPU per month in circle i at time t. ARPU was also used by Shy (2002) to conduct the analysis, while Cho et al (2016) used average revenue per minute. The reason for using ARPU is that it captures the impact of prices of all the revenue streams of the operators, unlike ARPM which only concentrates on voice revenues. This is especially important as data revenues have become more important to operators in the latter periods of the sample. This would lead to measurement errors in the response variable (Cho et al., 2016). The way average revenue is calculated is fairly straightforward.
Revenues=PriceQuantity*Quantity
Therefore,
RevenuesQuantity=Price
Where
Quantityrefers to the number of subscribers.
MNPtj
is the dummy variable which indicates whether circle i had the MNP policy introduced at time t. J indicates whether the policy was intra-circle MNP or inter-circle MNP.
MNPtjis equal to one is the policy was on at the time, and zero if the policy was not. In this setup, the paper only analyses the impact of one of the policies at a given time.
Minutesit
is the average monthly minutes of usage per consumer (MOU) in circle i at time t. A vector of all other controls that could affect the price are included in
Xit, which include the level of market concentration, the number of subscribers, and a measure of customer loyalty. The estimation has been done both for controlling
δ2to be zero, as well as freeing it up. Park (2011) used an interaction term and conducted estimations for two scenarios – controlling it for zero and freeing it up. The interaction term allows us to determine the sensitivity of price to minutes, after the introduction of MNP on the equilibrium path. Estimation has been done for both equal time periods before and after the policy, as well as for unequal time periods, to the extent of the length of data availability.
The analysis is controlled for circle fixed effects that are time invariant in
γiand time specific circle invariant fixed effects in
ωt. Circle fixed effects are controlled by using fixed effects estimation techniques, while time fixed effect are controlled by the introduction of time specific dummy variables.
When
MNPtj= 0, the model effectively estimates:
Ln(Priceit)= α+ βLn(Minutesit)+ γi+ ωt+ θXit+ εit
Here,
∂Ln(Price)it∂Ln(Minutes)it= β, which measures the impact of a change in minutes to the change in prices before policy implementation.
When
MNPtj= 1, the model becomes:
Ln(Priceit)=α+ δ1+(δ2+β)×Ln(Minutesit)+ γi+ ωt+ θXit+ εit
Here,
∂Ln(Price)it∂Ln(Minutes)it= β+δ2, which measures the impact of a change in minutes to the change in prices after policy implementation on the equilibrium path. Therefore,
δ2measures the incremental change to this relationship. On the other hand,
δ1measures the impact of the policy, without considering the impact of
Minutesit(when it is 0).
In the paper, I go on to analyse the impact of both the inter-circle and intra-circle MNP policies at the same time with the usage of this model:
Ln(Priceit)= α+ δ1MNPit1+δ2MNPit2×LnMinutesit+δ3MNPit2+δ4MNPit2×LnMinutesit+ βLnMinutesit+ γi+ ωt+ θXit+ εit
(Equation 2)
In this model
MNPt1is the dummy variable which indicates whether market i had intra-circle MNP policy introduced at time t, while
MNPt2is the dummy variable which indicates whether market i had inter-circle MNP policy introduced at time t.
In order to deal with the long-run trend of prices, the estimations for the above-mentioned models have been conducted with and without taking price trends into consideration.
4. Results
Estimations have been carried clustering standard errors at the circle level. Moulton (1990) found that assuming groups have no correlation can be unjustified, and went on to show that this leads to biased estimates. Specifications have been run considering differential effects like Park (2011), as well as not considering them (Cho et al., 2016).
4.1 Intra-Circle MNP
The paper starts with estimating the impact of MNP in the first period, intra-circle MNP. This specification is the same as equation (1); incorporates 506 observations from 22 circles across 23 quarters from the fourth quarter of 2009, to the second quarter of 2015.
The effect of MNP has been found to be negative and significant for all the specifications of intra-circle MNP.
Without allowing for differential effects (
δ2=0), the results indicate that prices fell by approximately 9.3%. Allowing for differential effects (freeing up
δ2), the model shows that the MNP intercept has a negative and significant coefficient, while the interaction term has a positive and significant coefficient.
Park (2011) argues that these coefficients show the difference in effects between plans of different minutes. However, in this paper that interpretation is different as the data being tested is not plan level data from different firms. As a result, what these coefficients show is that price sensitivity on the equilibrium path with respect to minutes rose during the policy due to the positive coefficient of the interaction term. Overall, the trend in minutes across the policy period is flat to slightly increasing over the policy period, which can be observed from Graph 4 on a nationwide basis. The trend for most circles is the same.
On the other hand, the negative intercept term shows that the impact of the policy without considering minutes was negative and significant.
The analysis also evaluates the model incorporating a time trend. After allowing for the time trend, the effect of the policy remains the same in all these specifications. This is because the effect of price trends would have cancelled out over such a long period of time.
Interestingly, competition does not seem to have had an impact on prices in this specification as the coefficient is not statistically significant. Additionally, the coefficient on government share in the market is positive and significant for all specifications which go along with the trend that India’s liberalisation and gradual change from a state monopoly have led to lower prices.
Table 1 – Results for Intra-circle MNP
| No Differential Effects | Differential Effects | |
| δ1
– MNP Intercept |
-0.094 (0.014) *** | -1.090 (0.311) ** |
| δ2
– MNP Interaction Term |
0 | 0.167 (0.052) ** |
| β
– Minutes |
0.591 (0.070) *** | 0.499 (0.074) *** |
| No. Of Obs | 506 | 506 |
| R- Squared | 0.826 | 0.831 |
*** Significant at 1% level ** Significant at 5% level
Robust standard errors clustered by circle are reported in the brackets
4.2 Inter-Circle MNP
The paper goes on to estimate the impact of inter-circle MNP, which was introduced on a nationwide basis by TRAI in the third quarter of 2015. This specification is the same as equation (1) but with a different dummy variable; has 507[1] observations across 24 quarters,. The estimation incorporates data until the third quarter of 2016. Inter-circle MNP was introduced in the third quarter of 2015.
These specifications put up some surprising results. Without allowing for differential effects (
δ2=0), the results indicate that prices actually rose, with a positive and significant coefficient for MNP. The rise is to the tune of 27.9%. Again, the coefficient on market concentration is not significant.
However, on incorporating time trends, the coefficient for MNP becomes negative and significant. It indicates that MNP led to a fall in prices of 2.2%. The positive and significant coefficient on time trend indicates that there is a persistent time trend in this specification.
Allowing for differential effects (freeing up
δ2), the model produces positive coefficients for the MNP intercept term. However, the term without incorporating time trends is not significant, while the one incorporating time trends is significant. Both the coefficients for the interaction term are negative but not significant. The high levels of standard errors are possibly because of the high correlation of 0.9997 between the policy dummy and the interaction term (Tu et al., 2005).
The coefficients for government share in the market is negative and significant for all specifications, which go along with the previous specification showing that lower government market share has led lower prices for consumers.
Table 2 – Results for Inter-circle MNP
| Without time trend | With time trend | |
| No differential Effects (
δ2=0) |
||
| δ1
– MNP Intercept |
0.279 (0.026) *** | -0.022 (0.010) ** |
| β
– Minutes |
0.479 (0.119) *** | 0.497 (0.119) *** |
| No. Of Obs | 507 | 507 |
| R- Squared | 0.814 | 0.815 |
| Differential Effects (
δ2freed up) |
||
| δ1
– MNP Intercept |
0.483 (0.513) | 1.258 (0.647) * |
| δ2
– MNP Interaction Term |
-0.343 (0.086) | -0.034 (0.086) |
| β
– Minutes |
0.500 (0.123) *** | 0.500 (0.123) *** |
| No. Of Obs | 507 | 507 |
| R- Squared | 0.951 | 0.813 |
*** Significant at 1% level ** Significant at 5% level *Significant at 1% level
Robust standard errors clustered by circle are reported in the brackets
4.3 Both Policies at Once
The paper goes on to estimate the impact of both the policies at the same time. It estimates the specification in equation (3), incorporating 616 observations across 22 circles and 28 quarters. The time period ranges from the third quarter of 2009 to the third quarter of 2016. There have been two different dummies and interaction terms introduced to estimate the impact of inter-circle and intra-circle MNP.
Without allowing for differential effects (
δ2=0), the results indicate that intra-circle MNP had a negative impact on prices, while inter-circle MNP had a positive impact on prices. Both of the coefficients are significant. Estimation results show that intra-circle MNP reduced prices by 7.5%, while inter-circle MNP led to an increase in prices by 8%. Level of market concentration doesn’t have a significant coefficient.
Allowing for differential effects (freeing up
δ2), the coefficient for intra-circle MNP becomes slightly more negative and indicates a price drop of 7.9%. The coefficient for inter-circle MNP is negative, but not significant. The interaction term for the first policy is positive and significant, while the interaction term for the second policy is not significant.
In this analysis, I do not consider time trends as the impact of any such trend would have become nullified over such a long period of time. The coefficient on government share in the market is negative and significant for all specifications, which goes along with the trend in the previous models.
Table 3 – Results of Both Policies at Once
| No Differential Effects | Differential Effects | |
| δ1
– Intra-circle MNP Intercept |
-0.075 (0.051) *** | -0.788 (0.284) * |
| δ2
– Intra-circle MNP Interaction |
0 | 0.120 (0.047) * |
| δ3
– Inter-circle MNP Intercept |
0.081 (0.333) ** | -0.616 (0.535) |
| δ4
– Intra-circle MNP Interaction |
0 | 0.116 (0.091) |
| β
– Minutes |
0.587 (0.092) *** | 0.501 (0.084) *** |
| No. Of Obs | 616 | 616 |
| R- Squared | 0.822 | 0.823 |
*** Significant at 1% level ** Significant at 5% level *Significant at 10% level
Robust standard errors clustered by circle are reported in the brackets
Mixed Results for Inter-Circle MNP: At this point, it is clear that the results for inter-circle MNP are varied and mixed across different specifications. This could be on account of several reasons.
Data revenues have become a crucial part of revenues for the mobile operators during the imposition of inter-circle MNP. This can be demonstrated by the fact that the share of data in total revenues increased from 10.2% in third quarter of 2013 to 22.2% in the third quarter of 2016 on an all India basis (TRAI, 2013- 2016). Unfortunately, circle wise data statistics are not available; which means that the lack of inclusion of this variable could lead to a case of the omitted variable bias. Cho et al (2016) state that this only leads to a measurement error which creates an attenuation bias in the estimates, but that is because that specification uses average revenue per minute and not ARPU.
It could also be possible that the inter-circle MNP policy took some time to gain traction, which meant that prices would start to change only much after the policy was introduced.
4.4 Only continuation of a prior trend?
In this section, I analyse as to whether or not the decline in prices after the imposition of intra-circle MNP was merely the result of a pre-existing trend of falling prices. This approach is similar to the approach taken by Park (2011) who introduced a fake dummy variable, in a paper to check the impact of MNP on prices in the US market.
For the purposes, the paper uses the following specification:
Ln(Priceit)= α+ δ1TrendCheckit+δ2TrendCheckit×Ln(Minutesit)+ βLn(Minutesit)+ γi+ ωt+ θXit+ εit
Here,
TrendCheckitis a dummy variable which mimics how the
MNPit1dummy works for intra-circle MNP. The pre-policy time period has been divided into two phases, where the latter one has
TrendCheckitequal to one, and the first period has it equal to zero. Other than that, the specification is identical to the specification used to determine the impact of intra-circle MNP.
The estimation uses 109 observations across 22 circles and 5 quarters. The last two-quarters have the dummy variable equalling one, while the first three have the dummy equalling zero.
Interestingly, the intercept for
TrendCheckis negative and significant. Despite the negative coefficient on the fake dummy, the analysis finds that the prior trend is not relevant. Firstly, on incorporating time trends, the negative coefficient for
TrendCheckcoefficient significantly reduces, while the
MNPit1coefficient does not. Secondly, the coefficient for time trends is negative (although not significant) for this test; while slightly positive and significant 0.006 when estimating the coefficient on intra-circle MNP. Finally, allowing for differential effects, the intercept on the MNP term actually becomes zero and significant.
Therefore, with a combination of these factors, the analysis finds that that the estimation techniques used to measure the impact of intra-circle MNP have been correctly specified.
Table 4 – Results for Pre-existing Trend
| No differential effects, no time trend | No differential effects, with time trend | Differential effects, no time trend | Differential effects, with time trend | |
| δ1
– Trend Check |
-0.195 (0.060) ** | -0.131(0.040) ** | 0 * | 0 ** |
| δ2
– Trend Check Interaction |
0 | 0 | 0 | 0 |
| β
– Minutes |
0.433 (0.069) *** | 0.432 (0.078) *** | 0.451 (0.123) *** | -0512 (0.154) *** |
| Timetrend | 0 | -0.016 (0.024) | 0 | -0.014 (0.021) |
| No. Of Observations | 109 | 109 | 109 | 109 |
| R Squared | 0.931 | 0.971 | 0.931 | 0.970 |
*** Significant at 1% level ** Significant at 5% level *Significant at 10% level
Robust standard errors clustered by circle are reported in the brackets
4.5 Difference in Impact between Prepaid and Post-paid[2] Prices
Over here, I analyse whether there has been a different impact of the policy on prepaid and post-paid markets. India is a predominantly prepaid market with over 90% prepaid subscribers in most circles. These subscribers tend to have lower brand loyalty and lower switching costs than post-paid subscribers. Prepaid ARPUs are also much lower than post-paid ARPUs. For example, the average prepaid ARPU in the dataset is Rs. 96, while the average post-paid ARPU is Rs. 494.6 (TRAI, 2016).
The model used for estimating this is as follows:
Ln(Price)ita= α+ δ1MNPit1+δ2MNPit2+βLnMinutesit+ γi+ ωt+ θXit+ εit
Here,
Ln(Price)itarefers to the log ARPU of either prepaid or post-paid. Similarly,
LnMinutesitarefers to the MOU of the same variable. The controls include the log of the price of the one not selected, as prepaid and post-paid can be considered substitutes.
Due to lack of data availability, this specification doesn’t use individual circle level data. Instead, TRAI divides the circles into four market segments based on their characteristics – Circle A, Circle B, Circle C, and Metro. The specification estimates the parameters based on aggregate values in these segments. The paper doesn’t analyse the interaction term due to the lower number of observations. As a result, the estimation doesn’t cluster errors at the circle level.
There are interesting results here which point to the nature of the Indian telecom industry. For post-paid prices, the coefficients for both the policies were negative and significant. Intra-circle MNP reduced prices by 16.1%, while inter-circle MNP reduced prices by 37.1%.
On the other hand, the intra-circle MNP coefficient for prepaid prices was not significant and the coefficient for inter-circle MNP was lower than the one for post-paid, indicating a price decrease of 11.7%.
Table 5 – Prepaid and Post-paid Results
| Prepaid | Post-paid | |
| δ1
– Intra-circle MNP Intercept |
-0.048 (0.066) | -0.161 (0.077) ** |
| δ2
– Inter-circle MNP Intercept |
-0.117 (0.064) * | -0.245 (0.082) *** |
| β
– Minutes |
-0.057 (0.087) | 0.082 (0.096) |
| No. Of Obs | 112 | 112 |
| R- Squared | 0.952 | 0.76 |
*** Significant at 1% level ** Significant at 5% level *Significant at 10% level
S
It can be inferred that prepaid and post-paid consumers have different characteristics owing to the vast differences in their average MOUs, and ARPUs. The prepaid average MOU in the dataset is 353 minutes, while the post-paid one is 943 minutes. As a result, the paper infers that post-paid customers would tend to be wealthier that prepaid customers. Therefore, post-paid consumers would tend to have higher costs of switching mobile numbers, as their mobile numbers would be linked their professions, bank accounts, and other services. As a result, the benefits of MNP to post-paid consumers should be much higher. On the other hand, since switching costs are lower, they would be able to switch operators by simply switching operators, without opting for MNP. This has important implications for policymakers, as the vast majority of the Indian market is composed of prepaid consumers.
5. Robustness Tests
In this section, I perform some robustness tests to check the validity of the findings.
To start with, I look at the impact of changing some of the controls. Das (2014) point out that the Indian telecom industry experienced a price war from the latter part of 2009. This has been also mentioned in many articles like The Economist (2011), and Thoppil (2012). Therefore, in order for the findings of intra-circle MNP to be valid, it is necessary to control for the effects of the price war. The paper uses the third quarter of 2012 as the quarter when the price war ended, as this is the quarter when the churn rates[3] of the big players in the industry starting falling after three years of a continuous increase (Idea Cellular Ltd, 2009-2012; Bharti Airtel Ltd, 2009-2012; Reliance Communications Ltd, 2009-2012).
I add another binary variable,
Price Waritwhich takes a value 1 when the price war was on (fourth quarter of 2009 to third quarter of 2012), and 0 when the price war was not on (fourth quarter of 2012 onwards).
On incorporating this extra control, the coefficient on the MNP intercept variable for intra-circle MNP continues to be negative and significant at roughly the same level as the first estimation. The coefficient for
Price Waritis also negative and significant, indicating a fall of 33.9% on incorporating the time trend and 13.14% without incorporating a time trend. These are results without allowing for differential effects.
Allowing for differential effects, the coefficients on the MNP intercept is negative and significant at the same level again. Additionally, a similar analysis of measuring both the policies at once, equation (2), reveals that the coefficients on intra-circle MNP are negative and significant at the same levels as the estimations done without including the new control.
Table 6 – Results of Incorporating Price War
| No differential effects, no time trend | No differential effects, with time trend | Differential effects, no time trend | Differential effects, with time trend | |
| δ1
– MNP Intercept |
-0.093 (0.014)* ** | -0.093 (0.014)* ** | -1.089 (0.312)* * | -1.089 (0.312)* * |
| δ2
– MNP Interaction |
0 | 0 | 0.167 (0.052) ** | 0.167 (0.052) ** |
| Price Warit | -0.131 (0.029) *** | -0.339 (0.035) *** | -0.096 (0.028) ** | 0 ** |
| β
– Minutes |
0.591 (0.069) *** | 0.591 (0.069) *** | 0.489 (0.075) *** | 0.489 (0.075) *** |
| No. Of Observations | 506 | 506 | 506 | 109 |
| R Squared | 0.826 | 0.826 | 0.831 | 0.831 |
*** Significant at 1% level ** Significant at 5% level *Significant at 10% level
Robust standard errors clustered by circle are reported in the brackets
A similar analysis of including
Price Waritas a control while gauging the impact of MNP on prepaid and post-paid prices also throws the same results as previously analysed without including the additional dummy variable.
Now, I investigate as to whether the important findings are being driven by only certain areas. In order to do so, I conduct various estimations by dropping several market segments from the regression and seeing if the findings still hold. The specification used is the same as Equation (1) for intra-circle MNP. The results indicate that the main findings are valid and are not driven by any particular market segment, both with and without differential effects. In Table 8 I illustrate the results for eight such tests, where differential effects are not accounted for.
Table 8 – Results on Dropping Market Segments
| Excluding Circle A (5 circles) | Excluding Circle C (6 circles) | Excluding Circle B (8 circles) | Excluding Metro (3 circles) | |
| δ1
– MNP Intercept |
-0.089 (0.018) *** | -0.099 (0.015) *** | -0.182 (0.040) *** | -0.083 (0.015) *** |
| No. Of Observations | 391 | 368 | 322 | 437 |
| R Squared | 0.819 | 0.852 | 0.889 | 0.805 |
| Excluding Circle A & Metro (7 circles) | Excluding Circle C & B (14 circles) | Excluding Circle B & Circle A (8 circles) | Excluding Metro, Circle A, Circle C (14 circles) | |
| δ1
– MNP Intercept |
-0.0719 (0.019) *** | -0.183 (0.031) *** | -0.201 (0.037) ** | -0.040 (0.016) ** |
| No. Of Observations | 322 | 184 | 207 | 184 |
| R Squared | 0.801 | 0.954 | 0.875 | 0.831 |
*** Significant at 1% level ** Significant at 5% level
Robust standard errors clustered by circle are reported in the brackets
All the estimations conducted until now have used the entire amount of data available. “A concern may arise that over such a long period of time confounding (endogenous) effects may have risen leading to biased estimates of the effect of MNP on price” (Cho et al., 2016). Therefore, I measure the impact of intra-circle MNP on prices by only taking into account the period of 10 quarters – an equal period before and after the policy. Table 9 shows the results obtained. The coefficient for MNP is still negative and significant, providing more indications that intra-circle MNP had a negative impact on prices. As with the previous analysis, the inclusion of a time trend doesn’t statistically alter the coefficients; and the coefficients on government share in the market is positive and significant.
Table 9 – Results for Intra-Circle MNP in the Short-Term
| No Differential Effects | Differential Effects | |
| δ1
– MNP Intercept |
-0.051 (0.013) ** | -1.134 (0.332) ** |
| δ2
– MNP Interaction Term |
0 | 0.183 (0.057) ** |
| β
– Minutes |
0.591 (0.060) *** | 0.555 (0.068) *** |
| No. Of Obs | 220 | 220 |
| R- Squared | 0.954 | 0.954 |
*** Significant at 1% level ** Significant at 5% level
Robust standard errors clustered by circle are reported in the brackets
Finally, there may be concerns that the policy would take some time to have an impact on prices. Therefore, I analyse the specifications in Equation 1 but using lagged explanatory variables, to check if the main findings of the paper are still robust. Having conducted an analysis for lags until four periods (one year), I find that the coefficients on MNP continue to be negative and significant for both differential and no differential effects. Table 10 illustrates the results for a lag of one quarter, and a lag of four quarters; without accounting for differential effects.
Table 9 – Results for Intra-Circle MNP in the Short-Term
| One Quarter Lag (
t= 1) |
Four Quarters Lag (
t= 4) |
|
| δ-t
– Lagged MNP Intercept |
-0.073 (0.013) *** | -0.042 (0.011) ** |
| No. Of Obs | 484 | 484 |
| R- Squared | 0.780 | 0.796 |
*** Significant at 1% level ** Significant at 5% level
Robust standard errors clustered by circle are reported in the brackets
6.1 Conclusions
Through this analysis, I have analysed the impact of MNP on the prices in the Indian telecom industry. MNP refers to the policy where mobile consumers can switch their networks without changing their mobile numbers; thereby reducing switching costs in theory.
The important find of this analysis has been that intra-circle MNP has led to a reduction in prices for mobile customers in the India telecom industry. These findings are robust and have been checked for a variety of controls and scenarios; which include the presence of a price war, the fact that the findings may have been led by a particular circle, the findings are only a result of a pre-existing trend, the policy has a lag effect on prices, and that the findings don’t hold in the short run.
The analysis has also found a different impact of intra-circle MNP between prepaid and post-paid prices, which point to the different nature of the two services. The higher impact of MNP on post-paid prices can be explained by the fact that post-paid customers have higher switching costs, and therefore, have more benefits from the policy.
As for inter-circle MNP, the study has been unable to conclusively conclude the nature of the impact of this policy on prices. This can be explained by a variety of reasons like the fact that there is an omitted variable bias because data revenues streams are not taken into account or the fact that there is a lag in the policy’s impact on prices.
6.2 Limitations of the Study
The study does come with some limitations. The data doesn’t take into account the heterogeneity between the plans of different telecom operators. Different operators would have reacted to the policy in different ways, but the paper has been unable to analyse this due to the lack of data availability.
There is a possibility that firms might have anticipated TRAI’s MNP policy and started changing prices before the policy would have been implemented, leading to endogeneity concerns (Cho et al, 2016).
Finally, the analysis of different impacts between prepaid and post-paid prices should be investigated in greater detail with a more granular dataset.
7. References
ARCEP (2011), A simpler and faster mobile number portability system comes into effect in metropolitan France today. Press Release [Online]. Available at:
http://www.arcep.fr/index.php?id=8571&L=1&tx_gsactualite_pi1%5Buid%5D=1444&tx_gsactualite_pi1%5BbackID%5D=1&cHash=d656331c4d
(Accessed 13 April 2017)
Bharti Airtel Ltd (2009-2014), Quarterly Report [Online].
Available at: http://www.airtel.in/about-bharti/equity/results/
(Accessed 13 April 2017)
Cho D, and Ferreira P, and Telang, R (2016), The Impact of Mobile Number Portability on Price, Competition and Consumer Welfare. Available at SSRN: https://ssrn.com/abstract=2265104 or http://dx.doi.org/10.2139/ssrn.2265104
(Accessed 5 April 2017)
Chidim O, and Juliet O, and Virginia E (2016), The Analysis of the Impact of Mobile Number Portability in Nigeria. International Journal for Research in Computer Science. Vol 2, Issue 2, Paper 5, Pg: 30-40.
Clerehugh V, and Gilthorpe M, and Kellet M, and Tu Y (2005), Problems of correlations between explanatory variables in multiple regression analyses in the dental literature. British Dental Journal. Vol 199, No. 7, Pg: 457-461.
Idea Cellular Ltd (2009-2014), Quarterly Report [Online].
Available at: http://www.ideacellular.com/investor-relations/results
(Accessed 12 April 2017)
Klemperer P (2006), Network Effects and Switching Costs: Two Short Essays for the New Palgrave. Available at SSRN: https://ssrn.com/abstract=907502 or http://dx.doi.org/10.2139/ssrn.907502
(Accessed 8 April 2017)
Kutlu B (2013), Effect of Mobile Number Portability: Case of Turkey. International Journal of Business and Social Science. Vol 4, No. 14, Pg: 120-124.
Moulton B (1990), An Illustration of a Pitfall in Estimating the Effects of Aggregate Variables on Micro Units. The Review of Economics and Statistics. Vol 72, No. 2, Pg: 334-338.
Naik R (2014), Impact of MNP on Consumer Behaviour with reference to Tirupati City of Andhra Pradesh. IOSR Journal of Business and Management. Vol 16, Issue 11, Pg: 33-39.
Park M (2011), The Economic Impact of Wireless Number Portability. The Journal of Industrial Economics. Vol 59, Issue 4, Pg: 714-745.
Raj A (2017), ‘Reliance Jio to withdraw summer surprise after TRAI order’. Livemint, 7 April [Online]. Available at: http://www.livemint.com/Industry/VlpqzwZgQGmIQWhrLEcWJP/Reliance-Jio-to-withdraw-Summer-Surprise-offer-after-Trai-or.html
(Accessed 8 April 2017)
Reliance Communications Ltd (2000-2014), Quarterly Report [Online].
Available at: http://www.bseindia.com/stock-share-price/reliance-communications-ltd/rcom/532712/
(Accessed 13 April 2017)
Shi M, and Chiang J, and Rhee B (2006), Price Competition with Reduced Consumer Switching Costs: The Case of “Wireless Number Portability” in the Cellular Phone Industry. Management Science. Vol 52, Issue 1, Pg: 27-38.
Shy O (2002), A Quick-and-Easy Method for Estimating Switching Costs. International Journal of Industrial Organisation. Vol 20, Issue 1. Pg: 71-87.
Telecom Regulatory Authority of India (2009), Country-wide MNP requests cross 38 lakh by the end of February. Available at: http://www.trai.gov.in/sites/default/files/PressRelease09.pdf
(Accessed 31 March 2017)
Telecom Regulatory Authority of India (2012), Draft Telecommunication Mobile Number Portability (Fourth Amendment) Regulations. Available at: http://www.trai.gov.in/sites/default/files/4TH_AMNDT2Aug12-final%20draft.pdf
(Accessed 31 March 2017)
Telecom Regulatory Authority of India (2009-2016), The Indian Telecom Services Performance Indicator Report Telecommunication Mobile Number Portability (Fourth Amendment) Regulations. Available at: http://www.trai.gov.in/release-publication/reports/performance-indicators-reports
(Accessed 10 April 2017)
Telecom Regulatory Authority of India (2012), Telecom Sector in India: A Decadal Profile.
Available at: http://www.trai.gov.in/sites/default/files/NCAER–Report08june12.pdf
(Accessed 13 April 2017)
The Economist (2011), Happy Customers, No Profits [Online]. Available at: http://www.economist.com/node/18836120
(Accessed 6 April 2017)
Thoppil A (2012), Price Wars Continue in India Telecom Sector. The Wall Street Journal [Online]. Available at:
https://blogs.wsj.com/indiarealtime/2012/04/30/price-wars-continue-in-india-telecom-sector/
(Accessed 4 April 2017)
Vodafone (2005), Africa: The Impact of Mobile Phones, Vodafone Policy Paper Series, Number 2.
Available at: https://www.vodafone.com/content/dam/vodafone/about/public_policy/policy_papers/public_policy_series_2.pdf
Vodafone (2009), India: The Impact of Mobile, Vodafone Policy Paper Series, Number 9.
Available at: http://www.vodafone.com/content/dam/vodafone-images/sustainability/downloads/public_policy_series_9.pdf
World Bank Development Indicators (2017), The World Bank.
Available at: http://data.worldbank.org/data-catalog/world-development-indicators
(Accessed 13 April 2017)
[1] Includes one observation in the fourth quarter of 2009 where intra-circle MNP was introduced only in one circle on a pilot basis
[2] Prepaid refers to pay-as-you-go services which are much more popular in India. On the other hand, post-paid refers to contract services which are only used by less than 10% of consumers in most circles.
[3] The churn rate is calculated by dividing the total number of disconnected consumers by the number of average consumers in a given period, and dividing that by the number of months.
Cite This Work
To export a reference to this article please select a referencing stye below:
Related Services
View all


Related Content
All TagsContent relating to: "Technology"
Technology can be described as the use of scientific and advanced knowledge to meet the requirements of humans. Technology is continuously developing, and is used in almost all aspects of life.
Related Articles

DMCA / Removal Request
If you are the original writer of this dissertation and no longer wish to have your work published on the UKDiss.com website then please: