Study of Photovoltaic and Thermal (PV-T) Panels
Info: 9296 words (37 pages) Dissertation
Published: 12th Dec 2019
Tagged: ElectronicsEnvironmental Science
Chapter 1 Introduction
A simulation based study of photovoltaic and thermal (PV-T) panels is presented and examined within this report. Over the last two decades, numerous studies and experiments were conducted on PVT systems that have been working towards a common goal of achieving and maximising collected solar energy. The efficiency of PV (photovoltaic) systems on their own tends to suffer at higher ambient temperatures [more ref]. However, with the appropriate usage of a heat removal technology, the PV cells can perform at their full potential and the waste low grade heat collected can be utilised for other domestic uses [Dupreyat 3ref]. Therefore PV-Ts offer additional efficiency benefits over the conventional PV panels and with most of the heating systems in the built-environment being hydronic (water-based), the integration of PV-T panels with domestic and commercial building stock can bring about substantial carbon reduction for developing and developed economies worldwide. One of the easier and most direct applications of solar energy is the conversion of excess solar radiation into heat. Solar heating systems have been the topic of many studies over the years as well as a heat removal system for PV cells to regain the designed efficiency. (Duffie and Goswami-Principles of solar engineering). Thus a combined dynamic simulation and verification of such systems will provide us with a vast amounts of data and information required to optimise and control the parameters that affect the final performance of the system in real time while inevitably reducing the carbon footprint by tenfold when compared to a coal plant producing the same amount of energy [from below]
1.1 Background
According to the Renewables Global status report 2016, the solar PV market growth rate has increased over 25% by 2014 reaching a global total capacity of 227GW. It was also reported that over 22 countries was able to achieve more than 1% of their energy demand through solar PV and solar collectors contribute about 357 TWh of global heat capacity. It has been estimated that the carbon emissions can be reduced from 1000gCO2/kWh to 90gCO2/kWh while using Solar PV panels instead of traditional fossil fuels like coal. (Evans et al., 2009; Varun et al., 2009a,b). However, like every technology, PV has it disadvantages, of which the cost constitutes the one of major parts, where the electricity production costs 3 times more than wind and geothermal energy and 6 times more than coal and other fossil fuels and the other part being the dependency of efficiency on ambient temperature (Evans et al., 2009). Hence, there needs to be an effective action to increase the efficiency of the PV cells as the cost of these cells is predicted to drop by 57% by 2025 according to IRENA (International Renewable Energy Agency). In order to increase the efficiency of the PV panels, various methods have been proposed, one of which is PV cooling. These cooling methods can either be active or passive, where active method needs an external energy to drive the system (For example: A circulating pump with a fluid to remove the heat generated at the PV) or passive cooling (For example: PCM (Phase-change material) system) which works simply on the principle of endothermic and exothermic reactions without the need for an external driver.
One of the most popular means of utilising and collecting solar thermal energy is by solar water heaters as they are a very feasible technological solution and are economically attractive when compared with the other kinds of solar energy (which is Electrical). Thermal energy can also be used for space heating, produce hot water or air, for heating pools, dry agricultural products etc. Today more than 30 million square metres of solar collectors have been installed around the globe, and the commercial markets of solar collectors have already become an established industry. Thus, a PVT system uses the familiar design of collectors and PV cells and combines the two systems to its advantage. Four case studies using passive PCM system added as an external heat sink for the PV cells was studied by Peter et al. He concluded that the PV cells perform at their maximum efficiency when the PCM and aluminium heat sink acts as a thermal regulator.(Atkin peter)Infused Graphite PCM). Therefore, a PVT system should be able to increase the efficiency of the PV cells while removing the excess heat and utilise this heat for other domestic purposes. These systems also save two times the area needed for installation when compared with the installation of a separate PV and conventional collector system.
Over the years there have been many research methods proposed to model and optimize the PVT system which can effectively deliver both electricity and thermal outputs. However, most of these analyses have been done mostly only under steady state or quasi state conditions. The purpose is to fully model the PVT system dynamically under real time conditions and analyse the results in different locations for the entire annual year while validating with real working plants and PVT systems in different locations. A commercial PVT system was simulated and coded in MATLAB at three different locations (Portugal, UK and India) and has been modelled mathematically to be solved in fourth order Runge-Kutta method. A case study needs to be also evolved and developed with the obtained results for a domestic house and its performance can be monitored along with an appropriate electric (Lithium ion) and thermal storage system (PCM) in order to usefully implement a practical and optimum system, depending on its location variables. The main affecting factors in each location are the temperature, irradiation, incidence angle, and wind speed. Experimental tests will be carried out to validate the simulated model, while regulating values such as the flow rate and inlet temperature.
1.2 Aim
The main aim of this PhD thesis is to successfully simulate the model of PVT while studying its dynamic behaviour at different weather conditions and examine the changes at every dynamic circumstance which also includes investigation of the battery integration with the help of actual, practical and lab systems that are going to be installed in order to validate and discover the variables that need to regulated while improving the dynamic system. It also investigates into recognising the optimum working condition for a given PVT and the effect of different configurations on the desired output.
1.3. Objectives:
- Investigate the long term dynamic operation and develop a sustainable and general PVT system data with storage under real climatic conditions from data acquired to predict the performance.
- Experimentally track actual dynamic data for the PVT to validate the dynamically simulated model from the data sheet and realise various factors needed to optimise the system while depending on certain limiting factors as well as analyse the behaviour of the system.
- Acquiring an appropriate data acquisition system for the case studies considered and this needs to be validated against practical systems.
- Simulation and testing to control and regulate a multi carrier energy storage model along with the said optimised PVT system to deal with power surges, low generation of energy etc. and integrating the practical requirements for implementing the same.
- Predicting the performance and performance factors at any conditions for any type of PVT system installed and obtaining data on performance issues at each layer of the PVT system.
1.4. Summary of the report(change after completing all the chapters in more detail)
There are five chapters in this dissertation focusing on modelling and optimising a solar PVT system at different locations with different storage systems. Chapter 1 reviews a brief summary of the findings and modelling methods used to simulate the system wherein background, the aims and specific short term and long term objectives of the dissertation are discussed. Chapter 2 gives insight into the latest available literature review and new findings of present research base of renewable energy technologies that emphasize on optimising the modelling of PVT (photovoltaic thermal systems) with different types of storage for both electrical and thermal outputs. It also discusses the types of methods and optimisation techniques preferred and used in the research field. The main chapter which is Chapter 3 of the report includes the methodology followed and why such a system has been selected and designed to predict the performance of the system and the evaluation is done by comparison of the practically run solar plants. The model is then simulated using different techniques and all dynamic results are evaluated and scrutinised from the newly obtained data of PVT in Chapter 4. And Chapter 5 provides an account of future works including the future practical data for comparison from the new USB (Urban Science Building of Newcastle University) PVT installation system.
Chapter 2 Literature Review
2.1 Introduction:
Solar energy is the most generic form of renewable energy and it can be channelled by PV cells and solar collectors. PVT cells have an overall efficiency of 70-80%, while PV cells and solar collectors have an efficiency of about 15% and 60% respectively. The design of the PVT can be controlled to obtain either more heat energy or electric energy according to the requirement of the system by adding a glazed layer on the PV cells (glass layer) for capturing more heat, thus obtaining more heat energy and this can be removed if higher electrical energy is desired.
Investigating Solar energy using Passive systems
General solar collectrors:
Why have we decided to go for PVT:in detail
PV technology is able to convert solar radiation in elec-tricity with an efficiency ranging from 5% to 25%, meaningthat a significant part of the incident solar energy isreflected or converted in thermal energy. This leads to anincrease in the PV cells working temperature and, conse-quently, a drop of electricity conversion efficiency. For thatreason, over the years, many research efforts have beenspent on the development of hybrid photovoltaic–thermal(PVT) technology (water or air heat-transfer fluid) whichis able to produce electricity and thermal energy at thesame time (Aste et al., 2008; Chow, 2010 with better over-all performances of the two separated systems (i.e. thermaland photovoltaic) (Van Helden et al., 2004).
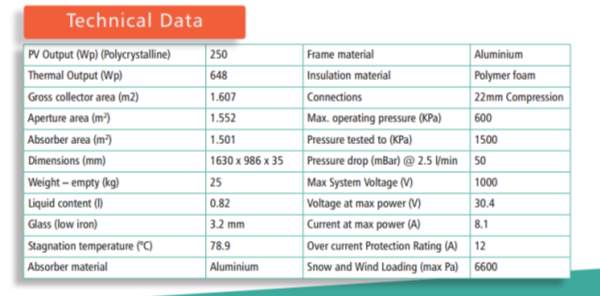
There are various types of PVT where the most common type is the flat plate PVT which uses either air or liquid as the fluid are of different types wherein the most commonly used ones for domestic purposes are flat plate PVT cells (FPPC). The liquid type has higher efficiency and better economic feasibility and fewer leakages as the heat transfer of liquids is more than air. Also there are glazed and unglazed layers as to increase the heat energy obtained over the electric energy obtained or vice versa. This is controlled by the presence of a glazed or unglazed layer. The glazed layer has an additional layer of glass and unglazed has no glass layer but might encounter overheating issues. Glazed PVT provide higher heat energy and unglazed provide better electric energy. The PVT panel considered for this project is from the company product solar angel DG-01 with electrical and thermal output of 250Wp and 648Wp respectively. As FPPC are the common contenders for domestic and space heating purposes, we consider this type of PVT as they are economically affordable for a household domestic purpose. A typical PVT consists of an absorber, PV and a transparent glazed or unglazed layer depending on the requirement which is insulated completely. A typicalflat-plate collector consists of an absorber in an insulated boxtogether with the tubes carrying the final outlet fluid of The absorber is generally made from either aluminium or copper as they form the highest heat transfer with the thermal conductivity being very high which is needed for the design of the system. The surface can be coated with an anti-reflective material or selective coating is done to prevent any loss of emissive radiation and increase absorptive radiation which can used for heat transfer of the system. The insulated part covers any losses from the back of the PV and prevents the heat generated to be lost to the atmosphere.As the performance analysis is done to predict the performance of the FPPC, it should be noted that the FPPC heat flow is governed by the fundamentals of fluid mechanics. The Due to changing environmental (ambientair temperature, wind speed, and solar radiation) and operatingconditions, the performance of the solar collector varies withtime. Models of the solar collector have accounted for the transient behavior using a variety of approaches. Klein et al. [3] investigated the thermal capacitance effects of asolar collector using a multinode model that represents individualcollector components with a temperature and capacitance. They concluded that the time constant for the nodes is on the order of severalminutes. Kamminga [4] derived analytic approximations of the temperatures within a flat-plate solar collector under transient conditions. Based on the fact that some of the heat resistances of aconventional flat-plate solar collector are smaller than others, Kamminga derived a 4-node mathematical model (cover, absorber, fluid,and insulation). The model approximates the temperatures of thecollector at any time using the measured ambient, insulation, andfluid outlet temperatures. However, the method used to solve themodel is not suitable for variable flow rates. Hilmer et al. [5] alsouse a distributed-node mathematical model (up to three nodes), butthey use a solution procedure that can handle variable flow rates.They consider a number of special cases including lumped capacitance and steady-state and compare their results to an experiment.Zueva and Magiera [6] derived a lumped parameter model for acollector and obtained analytical expressions for the time-varyingfluid outlet temperature. Cristofari et al. [7] derived a system ofcoupled differential equations for isothermal nodes of the collector.They solved the system of equations using a Runge–Kutta method. Cadafalch [8] presented a detailed numerical model for flat-plate solar collector. The model was verified by an experimental study ofsingle and double glazed collectors under steady-state conditions.Zima and Dziewa [9,10] presented a one-dimensional, distributed parameter mathematical model for simulating the transientprocesses which occur in liquid flat-plate solar collectors. Theproperties of the working fluid, air gap, and absorber, as well as the heat transfer coefficients, were dependent on time-varying temperatures. Their model allows for time-dependent boundary conditions. The assumptions made for the proposed model were:all elements of the analyzed control volume have dimensions identical to the elements of the real collector, the operating fluidflows uniformly through all tubes, the properties of the glass coverand insulation are constants, and all heat transfer coefficients computed in real time. The experimental verification showed a satisfactory agreement between the measured and calculated fluidtemperatures at the collector outlet. Other recent studies [11,12]have also made use of a thermal resistance–capacitance model. Inthese studies, empirical correlations for the resistances wereobtained via measurement and used in the model.The model developed in the present study relies heavily on themodels developed in Ref. [10]. In this study, five nodes perpendicular to the flow are used to represent the flat-plate solar collector’slayers (glass cover, air-gap, absorber, fluid, and insulation). In thedirection of the flow, the collector is divided into N nodes, and thus, the model is referred to a 5 N-node model. However, the model described in this study also includes a storage tank which is not considered in Ref. [10]. The storage tank is taken to be a lumped parameter, i.e., represented by a single temperature. In the model, the liquid flow rate, incident solar radiation, and the ambient temperature are time-dependent inputs. Other inputs include the tank volume and the initial temperature of the system. All the thermos-physical properties of the liquid and air gap are computed as a function of temperature. The method is based on solving the energy conservation equations for the glass cover, air gap,
2.2 Photovoltaic thermal systems:
Types of PVT collectors –experiments and their results-what needs to be noted for improvement.
A PVT system is of different configurations where the fluid is air/water or the cross-section of the module has different layers. The glazed has a layer of glass which protects the underlying layer from dust and external conditions, however this reduces the irradiation reaching the PV layer and hence lower electrical output, but a higher thermal output is obtained. The unglazed configurations have no glass layer and are considered when higher electrical output is needed and lower thermal output. The different types of cross-sections of module also affect the output response and efficiency of the system [58]. Some of the configurations are shown below
Standard testing conditions for a Solar cell and solar collectors have already been defined under American Society of Heating, Refrigerating and Air-Conditioning Engineers, Inc.(ASHRAE). Numerous research methods have been proposed to model a PVT unit since then; however a standardized method has not been summarized as of yet, because of its unfamiliar concept.(TSNADRD METHODS) There is no standard testing method for testing PVT as a whole module. However the methods used are a combination of EN 12975 and IEC 61215 (collector and PV standard testing methods resp)
It was decided that Solar Keymark certification of PV/T collectors as a solar thermal product is possible provided the measurements of the thermal performance are performed with electrical production under MPP conditions. In addition an optional thermal performance determination without electrical production (open circuit for PV-Module) is possible. For the electrical load applied for the electrical production an appropriate solution for the MPP(maximum power point) tracking shall be used
The system is tested to Simulate solar irradiance, Temperature control, Mass flow rate control and Performance monitoring with IAM(Incidence angle modifier) as a correction factor.
The performance monitoring of the system mainly include finding out the thermal and electrical efficiencies of the system when working together and then compared with thermal and electrical efficiencies of conventional PV and collector system.
Thermal efficiency curve measurements:
One in OC mode pure collector, One in MPP mode(collector in hybrid mode),
Electrical testing:
To find temp coefficient under lower irradiances and flasher tests working as a whole unit.(the whole PVT ) under IEC61215
There are two different methods under which the tests can be done to obtain the solar keymark certificate The Steady State method (“SS”) and the Quasi Dynamic Test method
IAM is a correction factor depending on the product requirement
According to the new updated list, the thermal part of PVT is tested according to SKN decision list D7.M10 added in the EN 12975
The equations proposed by Duffie and Beckmann(2006) are the most expended methods. Some of the dynamic methods and contributions of collectors and PVT are discussed below
Over the course of the decade, the most commonly used configuration for the liquid PVT model was (say type a), where the fluid tubes are insulated under the absorber plate. The solar angel configuration considered here has the fluid tubes between the PV plate and the absorber (say type b). Analysis has also been carried out for finned type configuration (Type c), double walled(type d)etc. A comparison analysis for two different configurations (type a and type b with mesh fluid channel.) was done for tropical climate by S.Dubey etal. It was found out that both the configurations of had similar gains and efficiencies with slightly variable quantities in the heat transfer coefficients between the fluid plus absorber and the back sheet plus PV module. In 2007 Fan et al . solved a collector system numerically, the flow and heat transfer in the collector panel were studied by the means of CFD calculations. Experimentally, the flow distribution through the absorber was evaluated by means of temperature measurements on the backside of the absorber tubes, flow and temperature distribution in a solar collector panel with an absorber configured of Type c model. The CFD experimental showed that at small flow rates, large differences appeared between the computed and measured temperatures due to oversimplification of the model. Even though the 2D and 3D connections are made, heat transfer remains one dimensional. In 2011 Zima and Dziewa, calculated a 1D mathematical model for simulating the transient processes and distributed parameters of the solar collector. The properties of the working fluid, air gap and absorber were computed in real time, the heat transfer coefficients were also computed in the on line mode.. All elements of the analysed control volume have dimensions identical to the elements of the real collector. The theoretical and experimental results showed good compatibility.
In this context of recent research in the field of combined Solar PV and Collectors have played an important role in renewable energy.
The PVT system is inherently dynamic as its input is not steady and steady state analysis will not be sufficient for a rigorous study of thermal behaviour and for controlling the system according to the parameters. Hence we consider a dynamic modelling using explicit analysis/implicit analysis of the entire system with the corresponding energy and exergy analysis. Explicit analysis of the system maybe unstable if the stability condition is not met. Implicit analysis gives a more accurate representation the system, but is slightly complex than explicit analysis.
2.3 Energy storage systems:
Since PVT cells have an electrical output and thermal output, there is a need to consider both storage types.
Electrical Storage:
This project considers design for small-scale or domestic plan, hence a Li-ion battery/supercapacitor that has a high specific energy and efficiency is considered. A nickel metal hydride can also be scrutinised for storage which is common for PV storage however it has overheating issues if ambient temperature rises.
Thermal storage:
Different types of thermal storage.
Sensible heat is the most generic form of thermal storage however its low energy density is overcompensated by its size. Latent heat uses PCM technology including a heat enhancing technique on account of its defective heat transfers although it has a higher storage capacity. The less developed thermo-chemical sorption storage has a very high energy density and storage capacity. The commercially developed products are the sensible and PCM whereas sorption technology is under development. Latent and sorption uses lesser volume to store heat and has higher energy density, hence energy research should be driven in this direction.
[Yu N .et. al]
However the materials needed are expensive, but it is predicted that since the fossil fuel prices increase because of shortage, this system will be viable replacement and hence will remunerate its initial cost in the future. Calcium chloride hexahydrate is the common form of material considered for PCM and zeolites/silica gel for thermo-physical sorption storage or Ammonia/MnCl2 salts for Chemi-sorption.
The thermal and electrical efficiency and heat transfer coefficients of PVT with storage systems can then be analysed and studied under the parameters considered, in depth, to find out the irregularities according to varying solar radiations, temperatures, storage capacity and time in terms with experimental and simulated models. This can be utilised to find out the effective variables that can be regulated to attain the optimised model of the system.
The thermal storage system has been the pivotal topic for the last two decades because it provides a secure match during delay of supply or demand and a continuous supply can be achieved while having thermal protection and inertia.
2.3 Battery:
The Lithium-ion battery is a very efficient system in terms of cost and efficiency as it is cheap and has a high energy density. It is difficult to simulate the precise behaviour of the battery due to its internal reactions. However it has been simplified to equivalent circuits where its output is determined by equations describing its state of charge, current output and time for charging and recharging. The equivalent circuit for the battery can be described by a simple resistance circuit with a voltage source, however this does not include the state of charge (SOC) and the energy of the battery is assumed to be unlimited. This does not gratify the need if the voltage variations are assessed according to the level of charge in the battery. Hence the following circuit is considered, as the changes in SOC is taken into account with the help of a variable resistor
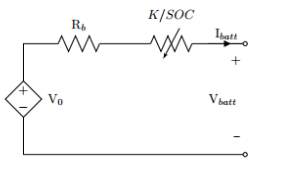 Figure 1: Simplified circuit of battery
The equations that describe the above system are as follows:
E=V0-(Rb+KSOC)Ibatt
Where E-Terminal Voltage,
V0-Open circuit Voltage,
Rb-Terminal resistance independent of SOC,K-Polarization constant,
Ibatt-Battery current
The K/SOC factor shows a sharp reduction if the value of charge voltage is low. However as the SOC approaches 1(fully charged), the rise in voltage is absent; this presents the model The benefit of using this model is that it provides a detailed representation of the discharge curve and SOC is closely affiliated with the manufacturer’s data curves.
2.3 PCM storage system:
Thermal energy can be stored sensibly, through a change in temperature, or it can be stored latently, as a change in phase of a material – for instance, from a solid phase to a liquid phase. Phase change processes are characterized by large changes in enthalpy at constant or near-constant temperatures. Phase change latent energy storage systems store energy at greater density and over a smaller temperature range than sensible energy storage systems, such as conventional chilled water tanks [7]. For example, the energy required to melt ice at 0 C is roughly equal to the energy required to heat the same amount of water to almost 80 C (334kJ/kg at a nearly constant 0 C, vs. 4.2kJ(/kg K) [8]).
Advantages of PCM(Phase change Material)
- Store thermal energy at the temperature of process application
- Store thermal energy as latent heat which allows higher thermal energy storage capacity per unit weight or material without any change in temperature
- Store thermal energy from thermal energy source or electrical energy source when available and use when needed
- This technology would lead to sizing HVAC equipment for average load rather than peak load.
- Store natural thermal energy for facility heating and cooling needs. Reduced energy demand reduces facilities carbon footprint
- Store thermal energy during off demand hours and use during peak demand to save on energy cost and help stabilize grid load
- Shift of heating and cooling load also reduces peak time stress of heating and cooling equipment that can lead to reduced operating & maintenance cost.
This technology would lead to sizing HVAC equipment for average load rather than peak load [Sharma etal.] PCM depends on latent heat storage. Compared to the storage of sensible heat, there is no temperature change in the storage. In a sense every material is a phase change material, because at certain combinations of pressure and temperature every material can change its aggregate state (solid, liquid, gaseous). In a change of aggregate state, a large amount of energy, the so-called latent heat can be stored or released at an almost constant temperature. Thus a small difference in temperature can be used for storing energy and releasing the stored energy. The heat storage capacity of PCM is not correlated with size of storage.
In PCM capsule storage systems, a heat transfer fluid is used to transfer the thermal energy from the solar collector to the PCM capsules (charging) and from the PCM capsules to an application system (discharging). During discharging of thermal energy from liquid PCMs a layer of solid PCM develops on the capsule wall. Thermal resistance of this layer increases with increasing thickness, thus diminishing heat transfer rate. Similarly during charging a layer of liquid PCM develops on the capsule wall, which has slower thermal conductivity than that of the solid PCM. This liquid layer would thus have higher resistance to heat transfer by conduction. But in actual case this increase in thermal resistance is prevented by onset of convective fluid motion. It is observed that there is substantially more melting of areas adjacent to the upper part of heater than those adjacent to the lower part. Studies concluded that this is due to the presence of natural convection flows in the melted PCM. The experimental investigations of the PCMs around the heated single cylinder (finned and unfinned) or arrays of cylinders were performed by Yao et al. and Abdel-Wahed et al. They have reported that in concentric liquid region around the heated cylinder which is obtained in the initial stages, the heat transfer is primarily by dominant role of conduction. After some time the natural convection intensifies and it affects the melting front position and consequently results in unsymmetrical melting about the axis of the cylinders. The results also show that melting takes place primarily above the heated cylinder with very little melting occurring below.
The characteristics required for effective and predictable thermal energy storage excludes a large number of materials. The following figure shows that paraffin and salt hydrates are useful PCMs for households. Salts and sugar alcohols are used for higher temperature ranges. An example of a high temperature energy storage use is in a Concentrated Solar Power (CSP) plant, which uses salt to store energy for later use. This alleviates part of the intermittency problem of solar power.
2.3 PV-T controls and integration
In most instances PV-T panels will need to be integrated into existing heating, ventilation and air conditioning (HVAC) systems in the building stock. This requires the system controls to be set up properly to optimise the operation of the thermos-electrical sides of the PV-T correctly. In the following section a review is undertaken of the existing and proposed technologies that are utilised for an optimised PV-T system control.
2.4 Problem Definition:
There is a need or gap in the knowledge of PVT systems, as these have been recently introduced to the commercial market. It has however not seen a significant rise as the general PV or a general FPC system. These needs to be investigated and an optimum design and predictive control factors that determine the performance of a PVT system needs to be determined.
2.5 Problem Solution:
In order to numerically model for a particular system, procurement of data like building/house energy demand pattern, annual solar radiations, temperatures and weather conditions needs to be listed and completed. Since the two different weather conditions are considered (UK and India), different physical data has been obtained. The models are simulated using the weather conditions should show a pattern of differences and these differences can be identified to find common parameters to obtain information on the optimisable parameters, while predicting the most efficient novel model for a given system as well the factors such as flow rate and temperature inlet or outlet that needs to controlled for a better performance of the system.
Chapter 3 Modelling, methodology and design of PVT:
In the solar cell industry, mono-crystalline silicon based PV cells make up approximately 80% of PV cell production. Their efficiency can be as high as 28% (Green et al.,2012), but for the majority of commercial mono-crystallinecells, efficiency tends to lie between 15% and 17% (Tyagiet al., 2013). Major factors that affect the efficiency of PVcells include the intensity of solar radiation, the qualityof the semiconductor in use and the operating temperatureof the PV cell (Biwole et al., 2010). Of these factors, controlling the temperature of the PV cell is the most practicalmethod of increasing cell efficiency. The widely acceptedrelationship between mono-crystalline silicon PV cell tem-perature and efficiency indicates that electricity productiondecreases by approximately 0.4–0.5%/K (Biwole et al.,2010; Cuce and Cuce, 2013; Krauter and Wenham, 1994)
3.1 Case Studies and Results:
PVT is modelled in three different locations for comparison of parameters. The three locations considered are Portugal, Kochi and Newcastle. Kochi and Newcastle have extreme opposite weather conditions, while Portugal has a consistent weather. The case study in Portugal considers the already installed PV and Solar thermal collectors for comparison with monthly data that is available online which is 2016 data. The epw weather data for the three locations are acquired from white box weather and this data can be used for any simulation purposes as they are real data from weather stations. An hourly data of the temperature, wind and Irradiation values are used for these simulations for the entire year of 2013. However, since UK experiences extremely low temperatures, the collector liquid needs to be mixed with 40% ethanol glycol to avoid freezing of the liquid in the tubes.
3.2 PVT modelling and design:
In order to study the PVT model (DG-01), we need to find out technical performance which can be studied over a range of analysis like energy analysis and exergy analysis. The energy analysis is based on energy balance equations and does not give the complete data needed to examine the PVT model. The exergy analysis gives the user the grade of the quality of the electricity and thermal energy produced.
Large quantity of research works have been carried out to study the performance of various types of PV/T configurations, optimize their geometrical sizes and suggest the favourite operational parameters related to the PV/T. As the result, many useful results and conclusive remarks have been obtained and these are selectively indicated as follows:
Hendrie developed a theoretical model for the flat plate PV/T solar collectors and by using the model, he carried out study into the thermal and electrical performance of an air and a liquid based PV/T solar collector. He concluded that when the PV modules were not in operation, the air and liquid based collectors could achieve the peak thermal efficiencies of 42.5% and 40% respectively. However, when the PV modules were in function, the air and liquid based units obtained slightly lower thermal efficiencies which are 40.4% and 32.9% respectively. The measured peak electrical efficiency of these units was 6.8%.
Florschuetz used the well know Hottel–Whillier thermal model for the flat plate solar collectors to analyse the performance of the combined PV/T collector. By slightly modifying the parameters existing in the original computer program, the model became available for analysing the dynamic performance of the PV/T collector. Assuming that the solar PVs’ electrical efficiency is linearly reduced when the cells’ temperature increases, the thermal and electrical efficiencies of the combined PV/T collector were obtained and the results are further analysed to established the correlations between the efficiencies and various operational parameters of the collectors.
Raghuraman et al developed two one-dimensional analytical models to predict the thermal and electrical performance of both liquid- and air-based flat-plate PV/T collectors. The analyses took into account the difference of temperature of the primary absorber (the PV cells) and secondary absorber (a thermal absorber flat plate) and a number of design notes were recommended to enable maximized energy utilization of the collectors.
Bergene and Lovvik et al developed a dedicated PV/T mathematical model and the associated algorithms enabling quantitative predictions of the performance of the system. The model was established on analysis of energy transfers including conduction, convection and radiation initiated by Duffie and Beckman, and the results of model operation suggested that the overall efficiency of PV/T collectors are in the range 60–80%.
Sopian et al. developed the steady-state models to analyse the performance of both single and double-pass PV/T air collectors. The models yielded the temperature profiles of the glass cover, plates, and air stream while the mean plate temperature could be applied to evaluate the efficiency of the photovoltaic cells. Performance analysis showed that the double-pass photovoltaic thermal solar collector produces better performance than the single-pass module at a normal operational mass flow rate range. In addition, the thermal and combined thermal and electrical efficiencies increased when the packing factor (defined as the ratio of the PV cell area to absorber area) decreased; whereas the electrical efficiency of the PVs decreased slightly.
Sandnes and Rekstad et al constructed a PV/T unit by using a polymer solar heat collector combined with single-crystal silicon PV cell. An analytical model derived from the Hottel–Whillier equations was used to simulate the temperature distribution and the performance of both the thermal and photovoltaic parts. The simulation results were in agreement with the experimental data. They found that pasting solar cells onto the absorbing surface would reduce the solar energy absorbed by the panel (about 10% of incident energy) due to lower optical absorption in the solar cells compared to the black absorber plate. Further, there is an increased heat transfer resistance at the surface of absorber and within the fluid which reduces the collector’s heat removal factor, FR. Moreover, they concluded that the solar cells’ temperature is strongly related to the system (inlet fluid)’s temperature and also to the collectors’ heat transport characteristics. The combined PV/T concept should therefore be associated with applications of sufficiently low temperature to give the desired cooling effect.
Among numerous methods which uses energy balance equations at each selected node, Chow was able to successfully implement an explicit dynamic FPPVT model using finite control volume approach which uses a seven node analysis while Niccolo Aste et.al. completed a 5-node analysis using various parameters of the desired system. The energy balance equations obtained for energy analysis can be solved in a numerical matrix/equation form and radiative coefficient equations by iterative method. Exergy analysis for PVT (based on first and second laws of thermodynamics) by Chow was based on net exergy output rate and by Tiwari et al. was based on exergy losses which have errors at low solar radiation. The model considered here is done by explicit finite element method by a 7 node analysis. Some of the Assumptions considered for the DG-01 model:
- All materials have isotropic properties
- For a single glass cover of low iron, ambient temperature is considered approximately equal to the sky temperature.
- Uniform flow distribution rate is assumed due to higher performance.
- All elements of the analysed control volume have dimensions identical to the elements of the real collector.
- The thermos-physical properties of the materials are constants.
- All heat transfer coefficients computed in real time
- The PV layer is opaque.
- Dust and Shading effects are neglected.
- Ambient temperature is considered equal to environment temperature due to the fact that thermal and electricity gains increase only by less than 1% for every 15 ̊C.
- Fluid tube has a metallic bond for higher heat transfer to the fluid.
- Temperature distribution in X-direction will not affect the temperature distribution in Y-direction.
3.2.1Energy analysis:
The modelling is done by the implicit finite difference method, five node analysis for a cross section of the PVT panel of DG-01. At normal incidence of the solar radiation we calculate transmittance and absorptance for the PV and glass cover layer.
Equivalent thermal network:An equivalent thermal network is drawn using ray-tracing technique by (Duffie and Beckman 1991)
This section presents a mathematical model describing the flat-plate solar collector system considering the transient properties of its different zones. In the proposed model, the analysed control volume of the flat-plate solar collector contains one tube that is divided into five nodes. We consider five nodes of the cross section and obtain energy balance equations at each node. The energy balance caused by the mass transfer during the circulating of the fluid within the solar collector is included by the definition that the collector’s temperature depends on the coordinate in the direction of the fluid flow. Taking N nodes in the flow direction means that the model describes (5 x N) nodes. The governing equations were derived by applying the general energy balance for each zone in the analysed control volume of the solar collector. For one-dimensional heat transfer, the general energy balance is given by the change in internal energy is equivalent to the heat generated and the difference of heat transfer rates in the system,
(Picture of the 3D model PVT system)
losses as well as absorptance losses. Qp generated is calculated by Qp=G(τα)p-Ep, E=electric gain at the PV plate.
At PV plate (opaque) the heat transfer with the absorber plate is given
hbp= NuaKa/δga+σ(Tp^2+Tb)(Tg+Tb)/(1/εb+1/εp-1)
The Nusslet number is calculated from the Hollands formula for Nu between two parallel plates
Where Ra is the rayleigh number.
and Abp is 1.502 from the area data sheet of DG-01
At the absorber node:
We find hbi=2Ki/δi—based on conduction
At external surface of the tube with absorber, the heat transfer coefficient occurs due to convection is given as hbf=Nua*Ka/ δ and the Nusslet number is calculated as
At insulation node:
Heat transfer takes places at the back side of the module through air and air temperature is assumed to be the temperature at the rear.
1/Hai=1/hbi+1/hag
At fluid node
The internal surface of the fluid tubes has a heat transfer rate of hf=Nu*kf/Di, where the Nusslet number is given as follows assuming fully developed laminar flow due to the harp design of the collector.
The area associated with each node is also calculated.(Calculated values:Ex.xls)
dy/dt=(Δy(n+1)j-Δy(n)j)/Δt Where j is the number of nodes. Hence future time steps are calculated with present time steps. Since rounding is done by taylers expansion, truncation errors are prone to be carried on iteratively leaving a large error if time step is too large.
3.2.2Exergy analysis:
Exergy analysis is based on the second law of thermodynamics, its output equations are given as and calculated in excel. The exergy analysis is done in order to obtain the quality of the output obtained calculated from energy analysis.
Where Tf0 is the outlet temperature.
3.3 MATLAB analysis:
The equations are fed into a mat lab code to simulate the PVT model for a set temperature. The input parameters are entered into the code for the UK weather conditions and an hourly analysis can be carried out to obtain the results. Some of the calculations have been done in excel, which is the heat transfer coefficients. The stability of the system needs to checked and if the condition is not met, the time step needs to be adjusted. And the entire process is repeated.to find out the temperatures at each node of each of the five element nodes.
Chapter 4 Evaluation by simulation
4.1 PVT modelling:
In order to study the PVT model ,we consider the boundaries of DG-01model from the company Solar angel and we need to find out technical performance which can be studied over a range of analysis like energy analysis and exergy analysis. In order to analyse the model in MATLAB, we consider three different locations Lisbon,Portugal (at 38.7223° N, 9.1393° W),Newcastle UK (at 54.9783° N, 1.6178° W) and Kochin,Kerala (at 9.9312° N, 76.2673° E). The regularly real changing conditions like temperature, wind and the solar irradiation (from white box weather data) at hourly intervals are subjected onto the model over the course of a year (2013). The cross section of the model is clearly presented below including the dimensions.
The technical data of the module is extracted to be used in the code for analysis of the system. The code of the system can be summarized as a flowchart. As the preferred method for solving the system of ODEs and PDEs is chosen as the fourth order runge-kutta method. The PDE is constructed into Odes by the method of separation of variables. Runge-Kutta method has the highest form of accuracy and an error tolerance of 10^-4.
For validation of one of the simulations, we have a practical run output from a solar power plant in Lisbon, Portugal. The solar power plant has separately run PV panels and solar collectors. The specifications of the solar panel used here are given below.
We can obtain higher heat gain output from the panel if we increase the mass flow rate, The above output can be matched with the maximum thermal output of 648Wp.
On implementing all the equations for one node(j=1), we can obtain a relation between thermal and electrical gains in Newcastle,UK in the year of 2013.
The thermal efficiency and electrical efficiency is calculated from the excel data obtained for one node and is repeated for the entire year.
Comparison with other practical models
The above experiment was conducted by Chow on type a PVT. The method followed is explicit method of 7 node analysis where the inlet and outlet water conditions are calculated from explicit equations. The water flow rate was 0.004 kg/s. The air temperature was 17C. When the irradiation reduced by 25%, Ep dropped immediately to a level only slightly higher than 25% of the original (since Tp has dropped). Heat gain dropped gradually, like Tp.The instantaneous efficincy momentarily jetted up to more than 90% within the first minute. This amplification was owing to the remaining high level of Tp at a time of lowirradiation level. Tw2 showed a mild change, decreasing at the same pace as Tt. At the 660 s, Tw2 dropped to a level only 2 Centigrade from Tw0.
Our model has seen a increase in heat gain during the summer months, while the efficiency is not very high.The electric gain during that period has obviously dropped.However the thermal gain while remaining high did not show a steeper increase.
The figure obtained from MATLAB equations is shown as below:
Without bond node.
With bond node.
An analysis was done with and without a bond node at the absorber and fluid node. The simulations with a bond node showed that the bond and the fluid shared the increased heat transfer rate,However without a bond node and lesser contact,the absorber and the fluid has higher temprature rates with time.As seen , the fluid jetted to a higher temperature in a short anount of time.(The equation shown above are without a bond node)
4.2 PV and thermal Collector Simulation for different locations with TRNSYS
For comparing a PVT models with MATLAB and PV and separate collector models, we can simulate through TRNSYS for all locations in the year 2013. Using the EPW files available and using an online plotter in TRNSYS, a model for PV and Flat plate Collector has been simulated for as follows. The TRNSYS parameters for the PV dimensions and solar collector dimensions have been edited for the simulation. The PV and collector dimensions are taken from the PVT dimensions, assuming that the one layer pf either PV or the Collector is absent. Through this it estimated to find the differences in the efficiency if a PV and Thermal collector are combined and if so, to find if there are any improvements, and to find what parameters needs to be controlled for the upgraded working of a PVT system. This output can be used as future references for understanding differences in modelling through different methods, configurations and their benefits.
PV output at Newcastle (Irradiation, Current output VS Time)
Solar Collector output at Newcastle(Ambient Temperature ,Outlet Temperature Vs Time)
PV output at Kochi(Irradiation, Current output VS Time)
Solar Collector output at Kochi(Ambient Temperature ,Outlet Temperature Vs Time)
PV output at Portugal(Irradiation, Current output VS Time)
Solar Collector output at Newcastle(Ambient Temperature ,Outlet Temperature Vs Time)
4.3 PV modelled with battery in TRNSYS:
The PV in the PVT system has the electical output in the system it reduces its output according to the ambient temperature according to the weather conditions. Hence this can be observed in the ouput of the flat plate PV. Hence by coupling a 160A-h battery to the output of the PV, we obtain the following graph for weather conditions in UK
This analysis is carried out for a week(168hr).It is observed that the SOC triggers the charging cycle when the PV has valid irradtion values, and the charging cycle during the 1st week of january,has lower temperatures and hence the SOC is triggered very often. The maximum amount of charge that the battery is charged to without a minimum of 20% is 12 % If a charge controller can be placed to stop the battery from discharging below 20%,then we can assume that about 32% of charge has been attained in a span of a week, without any load applied to the PV.This indicates a very low effcincy for the battery,hence a better system or lower capacity battery should be used.
The above graph is obtained by solved sheperd equations in TRNSYS and simulated for the year of 2013 in Kochi.Hence applying similar concepts, with a minimum of 20% charge, we obtain about 69% charge (49+20) can be achieved with a charge controller.This output is obtained without applying any load. Therfore about 69% of charging can happen by the end of the week.
4.4 PVT system design:
From the above observations, a model for the PVT system can be designed as follows including its storage system. The thermal storage is either PCM or Adsorption depending on the model required for a location.
The PVT collector for the electrical output needs a charge controller to prevent the battery from draining to 0%.Hence the charge maintains an output of 20% minimum in its reserve. A DC/DC converter is needed for a higher output from the solar collector, as the output from a single module is not very high and it is required to run on a higher load in a household for domestic scale at events of no supply or lower supply from the storage.An A/C load can also be connected with DC/AC converter to obatin a AC load.
The thermal section of the PVT system obviously needs a thermal storage system that has a heat pump for the collector liquid that needs to be maintained at 20/25 degrees Celsius so that the temperature in the tank is not dropped lower than that.As this decreases output and a auxillary heat supply for the PCM or Adsorption for its evaporator might be needed for higher input, which in turn decreases the efficiency of the system. This is a major drawback for a thermal system at lower temperature weather conditons.
Chapter 5 Fututre works
This report outlined the continuation of work on the first-principle based model development of PV-T systems using a proprietary product. The case-study units will be deployed in (a) laboratory conditions using an integrated energy conversion and storage system within Newcastle University’s school of mechanical engineering and (b) real world field condition on the rooftop of a new building (Urban Science Building) which will be inaugurated in September 2017. The product design details have been obtained from the manufacturer and two sets of models have been developed to simulate the thermos-electrical output of the system. Extensive instrumentation was specified for the deployed PV-T sets in order to measure thermal fluid flow volume, temperatures at flow and return connections and electrical output. A local weather files was also commissioned to capture solar irradiance, air temperature and wind speed in order to allow the population of the model with real world data. These actual field and laboratory data will ultimately be used to calibrate the first-principle based model outlined in this work. The first attempt was outlined in the first year submission, while the current second year submission has focused on reporting the modelling development. Areas of modelling work that require further developments are as follows:
Simulations of all weather conditions for the PVT system for comparisons with the TRNSYS output.
Experimental setup to validate the theoretical model on three different weather conditions. The PVT model needs to attained and experimented according to the parameters considered in the theoretical analysis and thereby drawing comparisons and conclusions of the validity of the theoretical model. These input parameters should be used to simulate the PVT output for storage. Also a detailed practical and theoretical analysis for the battery storage and design using a PVT.
Cite This Work
To export a reference to this article please select a referencing stye below:
Related Services
View all


Related Content
All TagsContent relating to: "Environmental Science"
Environmental science is an interdisciplinary field focused on the study of the physical, chemical, and biological conditions of the environment and environmental effects on organisms, and solutions to environmental issues.
Related Articles

DMCA / Removal Request
If you are the original writer of this dissertation and no longer wish to have your work published on the UKDiss.com website then please: