The Impact of Perceived Risk on Perceived Value and Purchase Intention in E-commerce
Info: 28986 words (116 pages) Dissertation
Published: 22nd Feb 2022
Tagged: E-commerce
ABSTRACT
In recent years, with the development of the Internet and high-tech services, E-commerce is a potential and fast-growing market in Vietnam, according to reports of eMarketer (2016), Vietnam E-commerce Association (2015), and the E-commerce and Information Technology (2014). In order to maximize the potential E-commerce market of Vietnam, as well as understand the importance of studying the impact of Perceived Risk on Perceived Value and Purchase Intention, the researchers decided to conduct the research. The objectives of this study are to identify the components of Perceived Risk, analyze the relationship Perceived Risk has with Perceived Value and Purchase Intention in E-commerce context, determine whether there is difference in Perceived Risk in terms of gender, and propose some managerial implications to corporations. The research method includes both qualitative research (in-depth interview and focus group) and quantitative research (survey). The sample size of the survey is 400, with respondents are who live in Ho Chi Minh City and have purchased online. The key findings of this paper include that Perceived Risk in E-commerce consists of Perceived Risk associated with Product/Service, Perceived Risk happening during Transaction and Psychosocial Risk. In addition, Perceived Risk has a strong negative effect on both Perceived Value and Purchase Intention. Finally, Male are more aware of Psychosocial Risks than Female. Managerial implications for companies are suggested in Chapter 5 of the paper.
Keyword: Perceived Risk, Perceived Value, Purchase Intention, E-commerce, Ho Chi Minh City.
TABLE OF CONTENTS
Click to expand Table of Contents
LIST OF ABBREVIATIONS
Chapter 01: INTRODUCTION
1.1. Rationale
1.1.1. Background of E-commerce market in Vietnam
1.1.2. Practical Problems
1.2. Research Objectives
1.2.1. General objective
1.2.2. Specific objectives
1.3. Objects
1.4. Research Scope
1.5. Research Questions
1.6. Methodology and Data Overview
1.7. Research Meaning
1.7.1. Academic meaning
1.7.2. Practical meaning
1.8. Research Outline
Chapter 02: LITERATURE REVIEW
2.1. Theoretical Background
2.1.1. Internet and E-commerce
2.1.2. Consumer Behavior
2.1.3. Marketing
2.2. Related Researches
2.2.1. The relationships among perceived quality, Perceived Risk and perceived product value (Snoj, Korda and Mumel, 2004)
2.2.2. A trust-based consumer decision-making model in electronic commerce: The role of trust, Perceived Risk, and their antecedents (Kim, Ferrin and Rao, 2008)
2.2.3. Hotel restaurant co-branding: The relationship of perceived brand fit with intention to purchase (Ashton and Scott, 2011)
2.2.4. Development of a scale to measure the perceived benefits and risks of online shopping (Forsythe et al., 2006)
2.2.5. On the Explanation of Factors Affecting E-Commerce Adoption (Lee, Park and Ahn, 2001).
2.2.6. Predicting E-Services adoption: a Perceived Risk facets perspective (Featherman and Pavlou, 2003)
2.3. Proposed Research Model
2.4. Definitions and Hypotheses
2.4.1. Purchase Intention
2.4.2. Perceived Value
2.4.3. Perceived Risk
2.4.4. Hypotheses
Chapter 3: RESEARCH METHOD
3.1. Research Process
3.2. Research Method
3.1.1. Qualitative Research
3.1.2. Quantitative Research
3.3. Data Collection Methods
3.3.1. Primary Data
3.3.2. Secondary Data
3.4. Sampling Design
3.5.1. Sampling Techniques
3.5.2. Sample Size
3.5. Questionnaire Design
3.4.1. Measurement Scale
3.4.2. Pilot Test
3.6. Data Analysis Methods
3.6.1. Descriptive Statistical Analysis
3.6.2. Exploratory Factor Analysis (EFA)
3.6.3. The Reliability of Scale
3.6.4. Confirmatory Factor Analysis (CFA)
3.6.5. Verification of the research model by Structural Equation Modeling (SEM)
3.6.6. Independent-Samples T-Test
3.7. Ethical Consideration
Chapter 4: DATA ANALYSIS
4.1. Sample Demographics
4.2. Scales’ reliability
4.2.1. Cronbach’s Alpha: Perceived Risk scales
4.2.2. Cronbach’s Alpha: Perceived Value scales
4.3.3. Cronbach’s Alpha: Purchase Intention scales
4.3. Descriptive statistics
4.4. Principal components and factor analysis
4.4.1. EFA: Perceived Risk scales
4.4.2. EFA: Perceived Value and Purchase Intention
4.5. Measurement development
4.5.1. CFA results of the Perceived Risk
4.5.2. CFA results of the Perceived Value and Purchase Intention
4.6. Verification of research model
4.6.1. Analysis of Perceived Risk theoretical model
4.6.2. Analysis of research model
4.6.3. Hypotheses testing
4.6.4. Verification of research model via bootstrap
4.7. Other Test related to gender
4.7.1. The Perceived Risk associated with Product/Service between male and female
4.7.2. The Perceived Risk happening during Transaction between male and female
4.7.3. The Psychosocial Risk between male and female
Chapter 5: FINDINGS AND IMPLICATIONS
5.1. Key Findings
5.2. Discussion
5.3. Managerial Implications
5.4. Limitations and Future Research
REFERENCES
APPENDICES
Appendix 1: Questions for in-depth interview
Appendix 2: Questions for focus group interview
Appendix 3: Official Questionnaires
Appendix 4: Pilot Test’s Analysis Results
i. Cronbach’s Alpha test of the scales
ii. EFA of Perceived Risk scales
iii. EFA of Perceived Value and Purchase Intention
Appendix 5: Official Analysis Results
i. Frequency table of sample
ii. Sample distribution by age group and income
iii. Sample distribution by gender and career
iv. Cronbach’s Alpha of the research factors
v. Means of the scales
vi. EFA test of the Perceived Risk’s scales
vii. EFA test of the Perceived Risk, Perceived Value and Purchase Intention scales
viii. T-Test of Perceived Risk related to Gender
ix. Hypothesis results
x. Bootstrap results
LISTS OF TABLES
Table 2.1. Dimensions of Perceived Risk based on Featherman and Pavlou (2003)
Table 2.2. Perceived Risk Dimensions and Their Concepts Proposed in Marketing and Information System Literature
Table 3.1. The relationship between Quantity and Quality of Sample Sizes
Table 3.2. Measurement Scale
Table 3.3. Cronbach’s Alpha pilot test
Table 3.4. The table summarizes EFA results of Perceived Risk
Table 3.5. Rotated Component Matrix of Perceived Risk
Table 3.6. The table summarizes EFA results of Perceived Value and Purchase Intention
Table 3.7. Rotated Component Matrix of Perceived Value and Purchase Intention
Table 4.1. Respondents’ profile
Table 4.2. Cronbach’s Alpha of the scales
Table 4.3. Descriptive statistics
Table 4.4. KMO result of Perceived Risk’s scales
Table 4.5. Principal components of Perceived Risk’s scales
Table 4.6. KMO result of the concept in the research model
Table 4.7. Principle components of research model
Table 4.8. Summary table of test results
Table 4.9. Result for Hypothesized Path Relationships
Table 4.10. Bootstrap’s Result with N = 1000
Table 4.11. Bootstrap’s Result of Perceived Risk theoretical model with N = 1000
Table 4.12. Independent statistics of Perceived Risk between genders
Table 4.13. Means of Psychosocial Risk between male and female
LISTS OF FIGURES
Figure 1.1. Obstacles of online shopping
Figure 1.2. Reasons for no online shopping
Figure 2.1. Conceptual model of relationships among perceived quality, Perceived Risk and perceived product value of the mobile phone (Snoj, Korda and Mumel, 2004)
Figure 2.2. Model of trust-based consumer decision-making in electronic commerce: The role of trust, Perceived Risk, and their antecedents (Kim, Ferrin and Rao, 2008)
Figure 2.3. Research Model of Hotel restaurant co-branding: The relationship of perceived brand fit with intention to purchase (Ashton and Scott, 2011)
Figure 2.4. Conceptual Model to Explain the Role of Perceived Benefits/Risks on Consumers’ Online Perceptions and Shopping Behaviors (Forsythe et al., 2006)
Figure 2.5. Research Model of Factors Affecting E-Commerce Adoption (Lee, Park and Ahn, 2001)
Figure 2.6. Research model of Predicting e-services adoption: a Perceived Risk facets perspective (Featherman and Pavlou, 2003)
Figure 2.7. Proposed Research Model
Figure 2.8. Value hierarchy model (Woodruff, 1997)
Figure 4.1. CFA results of Perceived Risk (standardize)
Figure 4.2. CFA results of Perceived Value and Purchase Intention (standardize)
Figure 4.3. Estimated results of the Perceived Risk theoretical model
Figure 4.4. Estimated results of the research model
LIST OF ABBREVIATIONS
| B2C | Business to Consumer |
| C2C | Consumer to Consumer |
| CFA | Confirmatory Factor Analysis |
| e-CAM | e-Commerce Adoption Model |
| EFA | Exploratory Factor Analysis |
| IP | Internet Protocol |
| KMO | Kaiser-Meyer-Olkin |
| MOIT | Ministry of Industry and Trade of the Socialist Republic of Vietnam |
| SEM | Structural Equation Modeling |
| SPSS | Statistical Package for the Social Science |
| TCP/IP | Transmission Control Protocol/Internet Protocol |
| VECITA | Vietnam E-Commerce and Information Technology Agency |
| VECOM | Vietnam E-Commerce Association |
Chapter 01: INTRODUCTION
This chapter will demonstrate the background of E-commerce market worldwide and in Vietnam. Practical problems of Vietnam E-commerce are also mentioned, which are the rationale for the authors’ choosing the thesis topic. Additionally, the research objectives, research objects, research scope, research questions, methodology and data overview, research meaning and research outline are included in this chapter. These parts will provide a clear guideline for this paper.
1.1. Rationale
1.1.1. Background of E-commerce market in Vietnam
The information technology is developing day by day and its representative is the Internet (Ulrike Schultze, 2002). Because of the global attributes, Internet has profoundly transformed all aspects of human society, especially economy (Bughin et al., 2011). This means that the process of buying, selling or exchanging products, services or information can take place without borders. E-commerce opened up the possibility of reducing transaction costs, and penetrating the potential market. Thereby, the structure of the national economy and the globalization are changed (McMillan, Rodrik and Verduzco-Gallo, 2014).
Moreover, eMarketer (2016) has collected the information that the total worldwide C2C E-commerce retail is about $1,548 billion, more 6.0% than the previous year. While Ecommerce Foundation (2016) also had the data that the global B2C E-commerce turnover was about $2,273 billion, up 19.9% from the 2014. For more details, Asia-Pacific was considered the world largest retail market with nearly $875 billion (increased 35.2%) in C2C market and $1,057 billion (increased 28%) in B2C market.
According to Internet World Stats (2016), in 2016 there are about 49 million Vietnamese using Internet, this number accounts for 51.5 percentage of total Vietnamese. The report of Vietnam E-commerce Association (VECOM) (2015) also forecasted Vietnam E-commerce would reach about $ 20 billion sales in 2020 and growth rate in the period 2016-2020 is expected to reach about 20% per year.
In the Vietnam, E-commerce is also considered new exchange market with many benefits for the enterprises. E-commerce industry includes the prominent brands such as Vatgia.com, Lazada.vn, Adayroi.com, Tiki.vn, Sendo.vn, so the consumers are gradually accustomed to shopping on the website instead of traditional shopping. According to Ministry of Industry and Trade of the Socialist Republic of Vietnam (MOIT) (2014), E-commerce has a rapidly growing step through telecommunications systems booming to about 1/3 of the population of Vietnam Internet access. The percentage of websites that feature online ordering 58%, while the proportion website featuring online payment is 15%.
However, E-commerce does not explode so rapidly because of some barriers. According to Bizweb.vn (2015), wanting to touch the items is considered to be the most common barriers for E-commerce while the potential consumers is worried about the counterfeit and want to receive the products as quickly as possible. Furthermore, Vietnamese consumers still prefer to pay in cash than the other types, which means that they just decided to pay the bill when receiving the goods in hand.
Moreover, based on the survey about people living in Vietnam who has the ability to use the Internet, Google (2015) as cited by Bizweb.vn (2015) declared that 44% of online people who have never online shopped desire to shopping online in the next 12 months.
1.1.2. Practical Problems
Vietnamese E-commerce market is full of potential, yet maximized (Talk Vietnam, 2016). According to Vietnam E-commerce Report conducted in 2015 by VECITA, the result shows that up to 62% of Vietnamese Internet users purchased online, 4% higher than that of 2014 (Figure 1.3). However, the number of online purchasers is just nearly 24.2% of the total Vietnam population. Therefore, there is a big gap in Vietnamese E-commerce market for companies to expand and develop (vietnamnews.vn, 2015).
One of the most noticeable reasons that prevent potential online consumers from joining E-commerce activities is their Perceived Risks (Liebermann and Stashevsky, 2002; Snoj, Korda and Mumel, 2004; Mitchell, 1999). Since E-commerce is a new market and there is not enough reliable information and trust towards the market, consumers are often reluctant when deciding whether to make an online purchase or not (VECITA, 2015; Pallab, 1996; Ko et al., 2004). In the study of Snoj, Korda and Mumel (2004), belief about the potential uncertain negative outcomes from the online transaction is the major barrier for trading online.
In comparison with traditional retail formats, consumers perceive a higher level of risk when purchasing online (Lee and Tan, 2003; Tan, 1999). Various studies have consistently revealed that consumers have higher Perceived Risks in non-store shopping formats, such as telephone shopping (Akaah and Korgaonkar, 1988), mail order (Van den Poel and Leunis, 1999), catalog (Eastlick and Feinberg, 1999), and direct sales (Peterson, Albaum, and Ridgway, 1989).
VECITA (2015) has also found out those major obstacles that prevent potential consumers from online shopping was the worse quality than promoted of products or services (73%), the following was price concern (61%) and unprofessional logistics service (45%).
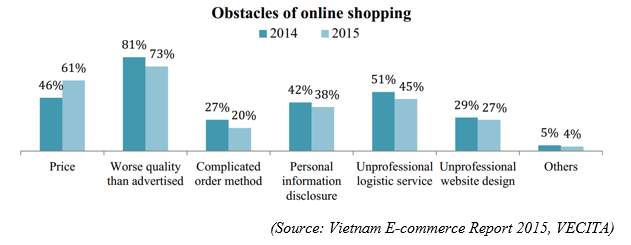
Figure 1.1. Obstacles of online shopping
Furthermore, among the 38% of respondents who have never tried online purchases before, half has chosen “no trust in sellers” as their explanations. Following are Finding it faster and easier to buy in stores, Not having credit cards or payable cards, and Having concerns about personal information disclosure to be picked by 37%, 26% and 25% of the respondents respectively.
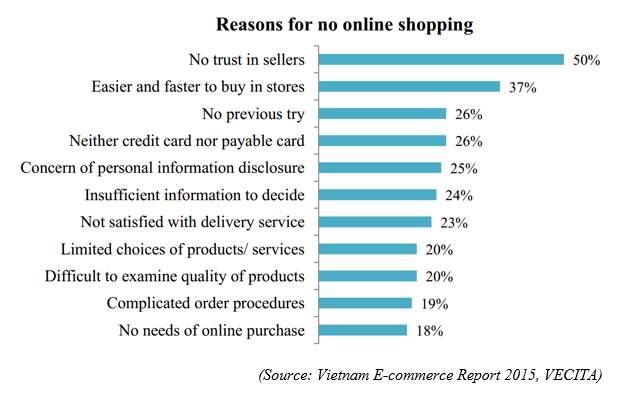
Figure 1.2. Reasons for no online shopping
According to different authors, consumers’ Perceived Value is considered as a multidimensional concept, which presents a trade-off between benefits and sacrifices perceived by consumers in a supplier’s offering (e.g. Woodruff et al., 1993; Zeithaml et al., 1996; Snoj and Gabrijan, 2000; Slater and Narver, 2000; Ulaga and Chacour, 2001). As Levy, Valenciano and Michal (2009) once stated, retail consumers are “value-driven”, managers should have a deep understanding of what consumer’s value and where they should draw attention to attain this needed market place advantage (Woodruff, 1997).
According to Fishbein and Ajzen (1975), to fully understand purchase behaviors, it is essential to analyze Purchase Intention. The intention is the best tool to predict behaviors since one’s action is measured by their intentions in doing that action. Purchase Intention is the most concerned issue among companies and retailers who have the idea of joining E-commerce market because Purchase Intention can support them in comprehend consumers’ behaviors and their acknowledgment about the products (Magistris and Gracia, 2008).
Understanding consumers’ Perceived Risk is of great concern to managers (Kalakota and Whinston, 1996). However, according to Macintosh (2002), Perceived Risk is the least studied concept of sacrifices. In Vietnam, there are few types of research focusing on Perceived Risk and its impact on Perceived Value and Purchase Intention of consumers, especially in E-commerce, which is a new trend in recent years. Additionally, despite value’s importance, relatively little empirical research has been conducted to develop an in-depth understanding of the factors influencing Perceived Value and Purchase Intention of consumers. There is a need to have a research studying the influences of Perceived Risk on Perceived Value and Purchase Intention of Vietnamese consumers.
Therefore, researchers have decided to conduct this research to study “The impact of Perceived Risk on Perceived Value and Purchase Intention in E-commerce: Case study on Ho Chi Minh City”.
1.2. Research Objectives
1.2.1. General objective
The main purpose of this research is to understand how Perceived Risk affects Perceived Value and Purchase Intention in E-commerce of consumers in Ho Chi Minh City. By doing quality and quantity research, the research will point out the components of Perceived Risk, which can be used to measure Perceived Risk’s effect on Perceived Value and Purchase Intention of consumers. Based on the collected and measured data, the relationship between Perceived Risk, Perceived Value and Purchase Intention will be analyzed. It will help enterprises understand more about their consumers to optimize their business process, and capture more value from consumers in the E-commerce market.
1.2.2. Specific objectives
- Identify components of Consumers’ Perceived Risk in E-commerce, case in Ho Chi Minh City.
- Identify the influences of Perceived Risk on Perceived Value and Purchase Intention in E-commerce context.
- Identify whether there is any difference in Perceived Risk based on gender.
- Propose solutions to increase Perceived Value, Purchase Intention, and decrease Perceived Risk of consumers in E-commerce in Ho Chi Minh City.
1.3. Objects
The three objects of this paper are Perceived Risk, Perceived Value and Purchase Intention of Consumers in E-commerce context in Ho Chi Minh City.
1.4. Research Scope
This study focuses on Consumers who live in Ho Chi Minh City and have experiences in purchasing online. The research subjects are students, workers, and officers, aged between 18 and 35. The survey is conducted in two weeks with the results of 400 valid samples in the end.
- Research place: Ho Chi Minh City (District 1, 3, 12, Tan Binh).
- Research time: 01/01/2017 – 15/04/2107.
- Official survey time: 01/03/2017 – 14/03/2107.
1.5. Research Questions
Our research questions to gain the research objectives are:
- What are components of Consumers’ Perceived Risk in E-commerce?
- How does Perceived Risks affect Perceived Value and Purchase Intention in E-commerce?
- Is there any difference between male and female in Perceived Risk?
- How should corporations improve Perceived Value, Purchase Intention, and reduce Perceived Risk of consumers in E-commerce?
1.6. Methodology and Data Overview
To get answers for research questions mentioned above, qualitative methods (in-depth interview and focus group) and quantitative method (survey) are applied. All of the research results are based on analyzing collected data, including primary and secondary data.
Primary data were collected through in-depth interview, focus group interview and survey conducted in Ho Chi Minh City. In-depth interview is carried out with an expert of Vat Gia Corporation. After that, the authors conducted a focus group interview with eight participants in FPT University Campus Ho Chi Minh City who had purchased online. After carrying out and analyzing the pilot test of 60 samples, the researchers collected 400 valid samples of official questionnaire from consumers who already purchased online in District 1, 3, 12, and Tan Binh.
Secondary data were collected through journal articles, newspapers, books, conference proceedings, televisions and reports from governments or reliable organizations.
The software of IBM SPSS 20 and IBM AMOS 22 are used to analyze and process the data. Data analysis methods include descriptive statistical analysis, Exploratory Factor Analysis (EFA), testing the Reliability of Scale by using Cronbach’s Alpha, Confirmatory Factor Analysis (CFA), Verification of the research model by using Structural Equation Modeling (SEM), and Independent-Samples T-Test. Finally, the authors will give out some appropriate managerial implications based on the study’s findings, which are expected to be valid and reliable through proper methods above.
1.7. Research Meaning
1.7.1. Academic meaning
The thesis reinforces the relationship between Perceived Risk versus Perceived Value and Purchase Intention. In addition, the authors also implement factors critical to the research model. Moreover, a new model of E-commerce is introduced in Ho Chi Minh City.
1.7.2. Practical meaning
Based on the basis of the model and the hypothesis built into the framework of this study, the research will help companies better understand the impact of Perceived Risk on Perceived Value and Purchase Intention. Besides that, the group of authors also analysis and evaluates the influence of the elements in the model in Ho Chi Minh City. Since then, the solutions have been proposed to create the basis for E-commerce companies to understand the market.
1.8. Research Outline
This paper includes five Chapter with main content as follows:
Chapter 1: Introduction
This chapter provides general information about Global and Vietnam E-commerce market, which leads to the topic rationale, research objectives, scope, research question, research meaning and thesis outline.
Chapter 2: Literature Review
This chapter describes key concepts and related researches, which are the basis for the proposed model. The hypotheses development is also provided in this chapter.
Chapter 3: Methodology
The methods to conduct this study, which includes Research Process, Research Approach, Data Collection Methods, Questionnaire Design, Sampling Design, Data Analysis Methods, and Ethical Consideration, is presented in this chapter.
Chapter 4: Data Analysis
Research results and data analysis are demonstrated in this chapter. Collected data is analyzed and discussed by using Descriptive Statistical Analysis, Exploratory Factor Analysis (EFA), testing the Reliability of Scale by using Cronbach’s Alpha, Confirmatory Factor Analysis (CFA), Verification of the research model by using Structural Equation Modeling (SEM), and Independent-Samples T-Test.
Chapter 5: Findings and Implications
This section discusses the key findings, which clarify the research questions, and gives out implications for managers. The limitations of the paper and suggestions for future research are also mentioned.
Chapter 02: LITERATURE REVIEW
In this chapter, the theoretical background including definitions of Internet and E-commerce, Consumer Behavior, and Marketing is displayed. In addition, researches related to Perceived Risk and its relationship with Perceived Value and Purchase Intention are selected and played as the basis for the proposed research model. The definitions and appropriate modifications of research objects are then discussed. Finally, hypothesized relationships between Perceived Risk and Perceived Value and Purchase Intention in E-commerce context are introduced.
2.1. Theoretical Background
2.1.1. Internet and E-commerce
Internet
In the Oxford Dictionary (2015), Internet is defined as a worldwide computer network, which comprises interconnected networks using standardized communication protocols to supply a diversity of information and communication readiness.
For further details, since 1995, Resolution of the U.S. Federal Networking Council has propounded the definition of the Internet, which is accepted by many researchers and organizations (Kahn and Cerf, 1999). The Federal Networking Council announced that Internet was the global information system with three factors. Firstly, the Internet is logically connected together by a globally sole address space based on the Internet Protocol (IP) or its subsequent extensions/follow-ons. Secondly, it can support communications by using the Transmission Control Protocol/Internet Protocol (TCP/IP) suite or its subsequent extensions/follow-ons, and/or other IP-compatible protocols. Finally, this global information system also provides, uses or makes accessible, either publicly or privately, high-level services layered on the communications and related infrastructure described.
E-commerce
According to World Wide Web Foundation (2017), since Tim Berners-Lee invented the World Wide Web in 1990, organizations and individuals have actively exploit, develop it. Businesses find World Wide Web helped them a lot in the display, providing and sharing information, contact partners quickly, conveniently and economically. Since then, businesses and individuals across the world have actively exploit the strengths of the Internet, World Wide Web to do the business, which forms the definition of e-commerce. Internet and Web is the main tool of the E-Commerce and help E-Commerce developing and operating effectively. For example, the company Netsscape launched the software application to extract information on the Internet in May 1995. Moreover, the company Amazon.com was launched in May 1997. Furthermore, the company IBM also launched an ad campaign for the business model electronic sales in 1997.
According to Clarke (2000), the principle of Australian National University E-commerce is defined as the conduct of commerce in goods and services, with the assistance of telecommunications and telecommunications-based tools. Following the E-commerce and Development Report 2001 (2001), E-commerce was considered as the sale or purchase of goods or services, whether between businesses, households, individuals, Governments and other public or private organizations, conducted over the Internet. The goods and services were ordered over the Internet, but the payment and the ultimate delivery of the good or service may be conducted on- or offline.
Moreover, academic definitions are narrowed and focused on applications and business supports. For example, Zwass (1996) defines E-commerce as using many means of telecommunication networks to share the business information, converse business relationships and conduct business transactions. Others (Applegate, 1999, Fellenstein and Wood, 2000) also support this view and consider E-commerce to include various processes within and outside the organization in addition to buying and selling activities.
2.1.2. Consumer Behavior
Consumer behavior is the study of individuals, groups, or organizations and the processes they use to select, secure, use, and dispose of products, services, experiences, or ideas to satisfy their needs and wants. It is also concerned with the social and economic impacts of purchasing and consumption behavior on both the consumer and wider society (Kuester and Sabine, 2012).
It is worth noting that consumer buying behavior is studied as a part of marketing and its main objective is to learn the way how the individuals, groups or organizations choose, buy, use and dispose the goods and the factors such as their previous experience, taste, price and branding on which the consumers base their purchasing decisions on (Kotler, 2014).
Factors Affecting Consumer Behavior
There is a wide range of factors that can affect consumer behavior in different ways. These factors are divided by Hoyer, Pieters and MacInnis (2013) into four broad categories: situational, personal, social and cultural factors.
Situational factors influencing consumer behavior may include location, environment, timing and even weather conditions (Hoyer, Pieters and MacInnis, 2013).
Personal factors, on the other hand, include taste preferences, personal financial circumstances and related factors. The impact of personal factors on consumer decision-making is usually addressed by businesses during market segmentation, targeting and positioning practices by grouping individuals based on their personal circumstances along with other criteria, and developing products and services that accommodate these circumstances in the most effective manner (Hoyer, Pieters and MacInnis, 2013).
Social factors affecting consumer behavior arise as a result of interactions of perspective consumers with others in various levels and circumstances. Targeting members of society perceived as opinion leaders usually proves effective strategy when marketing products and services due to the potential of opinion leaders to influence behavior of other members of society (Hoyer, Pieters and MacInnis, 2013).
Hoyer, Pieters and MacInnis (2013) also stated that cultural factors affecting consumer behavior are those related to cross-cultural differences amongst consumers on local and global scales. Culture can be defined as “the ideas, customs, and social behavior of a particular people or society” (Oxford Dictionaries | English, 2017) and the tendency of globalization has made it compulsory for cross-cultural differences amongst consumers to be taken into account when formulating and communicating marketing messages.
2.1.3. Marketing
There are many different concepts of marketing, depending on the actual situation and perception; many researchers have dissimilar ways to define marketing (Arndt, Angelmar and Hunt, 1983; Burnett, 2008). The disparity is not only in the level of details but also in the contents. Over time, the term marketing is adverted in many fields. Today, in the light of science and technology, management level and advanced level of modern industry, there is the appearance of modern marketing (American Management Association, 2017). According to this new view, marketing activities have gradually. It develops in both quantity and quality, explaining more properly the meaning it contains (Burnett, 2008).
According to Kotler and Armstrong (2012), marketing is considered as the process by which consumers receive the value created by the companies while these companies try to build strong relationships with their consumers to get the return. In addition, Aaker (2004) and his colleagues also define the “marketing” term as the activity, set of institution and process for creating, communicating, delivering and exchanging offering that create value for consumers, clients, partners and society at larger. On the other hand, basing on the viewpoint of organization Perreault et al. (2010) said that marketing is the process of carrying out activities to achieve the goals of the organization by anticipating the needs of consumers or consumers to control the flow of goods and services that meet the needs of the producer to consumers or consumers
In other words, marketing can be also understood as the economic and social mechanism that organizations and individuals use to satisfy their needs and wants through the process of exchanging products on the market (Thai, 2017).
2.2. Related Researches
2.2.1. The relationships among perceived quality, Perceived Risk and perceived product value (Snoj, Korda and Mumel, 2004)
Snoj, Korda and Mumel did a research on the relationships among perceived quality, Perceived Risk and perceived product value in 2004 in Slovenia. Perceived Value is a critical concept in marketing and many researchers have studied about it of late, however, not in Slovenia. Therefore, Snoj, Korda and Mumel decided to research the influences of individual factors on Perceived Value of a product, which happened to be mobile phones. The inquired target group was students – the quickest developing segment among the users of cell phones in Slovenia.
In their research, the researchers concentrated on two of the Perceived Value impact factors: perceived product quality and Perceived Risk. Based on literature and research findings, their fundamental researched objective was to design the model of connections among Perceived Value, perceived quality and Perceived Risk. After the model had been examined with the method of LISREL 8.0, the researchers found that, among the concepts researched, statistically significant relationships do exist.
In particular, the perceived quality of a cell phone positively affects the Perceived Value. Meanwhile, the Perceived Risks of a cell phone affect adversely on the Perceived Value. In addition, the perceived quality of a cell phone negatively affects the Perceived Risks. The authors’ findings emphasize the close relationship between Perceived Risks and Perceived Value and how risks can be utilized theoretically and practically in creating perceptions of Perceived Value.
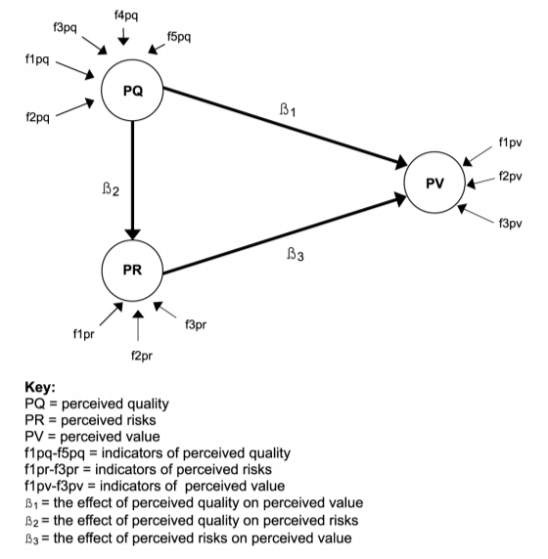
Figure 2.1. Conceptual model of relationships among perceived quality, Perceived Risk and perceived product value of the mobile phone (Snoj, Korda and Mumel, 2004)
2.2.2. A trust-based consumer decision-making model in electronic commerce: The role of trust, Perceived Risk, and their antecedents (Kim, Ferrin and Rao, 2008)
According to Kim, Ferrin and Rao (2008), trust and risk play a vital part in consumers’ E-commerce purchasing decisions. To examine the antecedents of trust and risk in E-commerce, as well as to understand how an Internet consumer’s buying decision can be affected by trust and risk, these authors have developed a hypothetical framework describing the trust-based decision-making process a buyer applies when making a purchase from a website. In order to testify the proposed model in the paper, authors made use of Structural Equation Modeling procedure on Internet consumer purchasing behavior data that are gathered by means of a Web survey.
The outcomes of the study demonstrate that Internet consumers’ trust and Perceived Risk have profound influences on their purchasing decisions. Internet consumers’ trust in the Website is deeply affected by consumer disposition to trust, reputation, privacy concerns, security concerns, the information quality of the Website, and the company’s reputation. Fascinatingly, the presence of an outsider seal did not strongly affect consumers’ trust.
The empirical consequences recommend that a consumer’s trust directly and indirectly influence his or her buying intention. A consumer’s trust has a solid constructive impact on the purchasing intention as well as a solid destructive impact on a consumer’s Perceived Risk. Moreover, the paper provides confirmation that a buyer’s Perceived Risk diminishes the consumer’s purchasing intention, while a consumer’s perceived benefit rises the consumer’s intention of purchase. In addition, the effects of trust, Perceived Risk, and perceived benefit on Purchase Intentions eventually had a “downstream” influence on consumers’ actual buying decisions. Hence, the discoveries confirm the contention that a consumer’s trust is a vital element in electronic, “cyber” transaction decision, and thus the extended version of the valence framework is supported. Lastly, the outcomes show that there are two ways to address the risk issues in E-commerce, resulted from trust to a large degree: by decreasing Perceived Risk and by expanding Purchase Intentions specifically (trust was the strongest indicator of the online shopper’s Purchase Intention, followed by perceived benefit and Perceived Risk respectively).
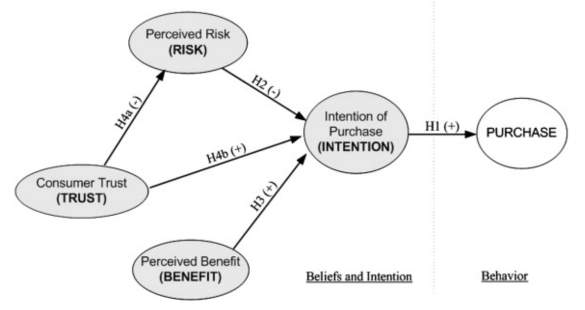
Figure 2.2. Model of trust-based consumer decision-making in electronic commerce: The role of trust, Perceived Risk, and their antecedents (Kim, Ferrin and Rao, 2008)
2.2.3. Hotel restaurant co-branding: The relationship of perceived brand fit with intention to purchase (Ashton and Scott, 2011)
A research on the influence of perceived brand fit on intention to purchase in the context of Hotel restaurant co-branding was conducted in 2011 by Ann Suwaree Ashton and Noel Scott. The drive of the applied paper is to build up an understanding the part of consumer assessment of hotel restaurant co-branding and study how this influences Purchase Intention. Advanced from the current co-branding literature, a theoretical model of hotel restaurant co-branding is delivered. The model portrays the relationship between consumer Perceived Risk and Perceived Value and their impact on consumer intention to buy.
The conclusions of the consumer valuation of hotel restaurant co-branding are impacted by both consumer characteristics and the nature of the brand cooperation. From the consumer standpoint, an essentially influential feature is the connection with the brands (consumer collected brand information) which is developed from past involvement. The nature of the brand cooperation and the consistency of brand extension traits are also elements that affect the consumer assessment result.
The theoretical model displays two groups of features that impact Purchase Intention, first, influences from the consumer viewpoint and second, impacts from a brand coalition view. Both groups of features are antecedents to Perceived Risk and Perceived Value. The purchaser perspective includes both the level of involvement with brand and the shopper personality. Consumers will intent to (re)purchase the item relying on high or low connection with the brands comprising sense of self-contribution, purchase involvement, and item connection (Dowling and Staelin, 1994). Briefly, the evaluation consequence from consumers towards the hotel restaurant co-branding is Perceived Risk, Perceived Value and Purchase Intention, and the elements affecting this conclusion are resulting from consumer personality and the perception of the brand.
Perceived brand fit between two brands is a result of consumers assessing a brand on Perceived Value, Perceived Risk, satisfaction, and intention to purchase, loyalty and image transfer. The relationships between partner qualities, inspiration, and consumer attributes are crucial in the procedure of achieving a constructive perception of brand cooperation. Subsequently, the consumer assessment of hotel restaurant co-branding influences buying intention.
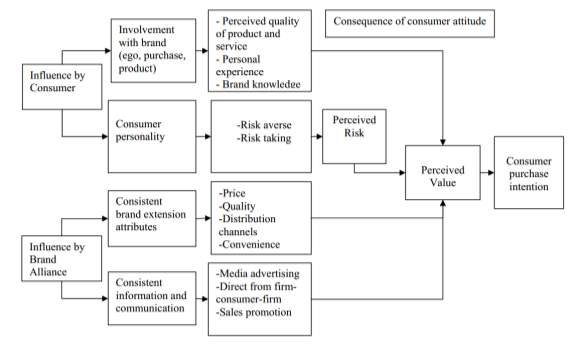
Figure 2.3. Research Model of Hotel restaurant co-branding: The relationship of perceived brand fit with intention to purchase (Ashton and Scott, 2011)
2.2.4. Development of a scale to measure the perceived benefits and risks of online shopping (Forsythe et al., 2006)
In 2006, Sandra Forsythe, Chuanlan Liu, David Shannon, and Liu Chun Gardner carried out a study on the developing a scale which measures the perceived benefits and Perceived Risks related with online shopping. By applying exploratory qualitative inquiry and quantitative assessment, a four-factor scale of perceived benefits (Shopping Convenience, Product Selection, Ease/ Comfort of Shopping, and Hedonic/ Enjoyment) and a three-factor scale of Perceived Risks (Financial Risk, Product Risk, and Time/ Convenience Risk) of online shopping were created. Results from two national samples endorse the proposed measures of perceived benefits and risks that are related with online shopping.
The findings uncovered that those consumers who shopped more regularly and spent more money online perceived greater benefits and less risk to be related with online shopping. Additionally, perceived benefits were a positive predictor of future intentions to visit and purchase on the Internet, whereas Perceived Risks related adversely to future online Purchase Intentions. Finally, a practical evaluation of these scales revealed that people purchasing (as opposed to just visiting) online perceived considerably greater benefit and less risk, and that heavy online consumers (comparing with light ones) perceived considerably greater benefits in terms of shopping convenience and product selection.
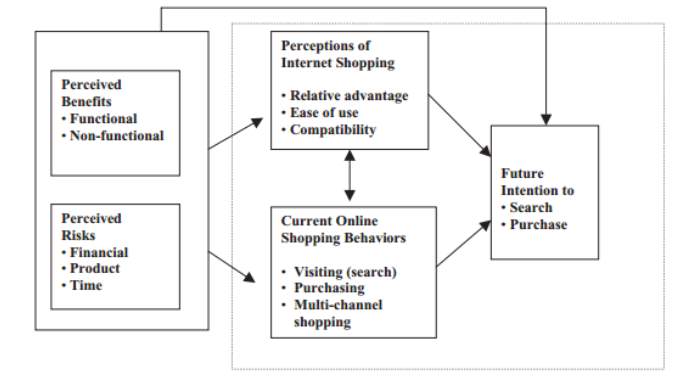
Figure 2.4. Conceptual Model to Explain the Role of Perceived Benefits/Risks on Consumers’ Online Perceptions and Shopping Behaviors (Forsythe et al., 2006)
2.2.5. On the Explanation of Factors Affecting E-Commerce Adoption (Lee, Park and Ahn, 2001).
In 2001, Dongwon Lee, Jinsoo Park (University of Minnesota) and Joong-Ho Ahn (Seoul National University) conducted “On the Explanation of Factors Affecting E-Commerce Adoption” article. They integrated the technology acceptance model with the theories of Perceived Risk to explain the e-Commerce Adoption Model (e-CAM). In details, they examined the influence of perceived ease of use, perceived usefulness, Perceived Risk with products/services, and Perceived Risk in the context of online transaction on the consumer’s purchasing behavior. Subjects for the study were the undergraduate and MBA students at two major universities in the United States. The survey lasted about a month and collected 183 responses, among which there were only 176 valid responses.
The results revealed that perceived usefulness, Perceived Risk with products/services and Perceived Risk in the context of online transaction have strong direct effect on the adoption of E-Commerce.
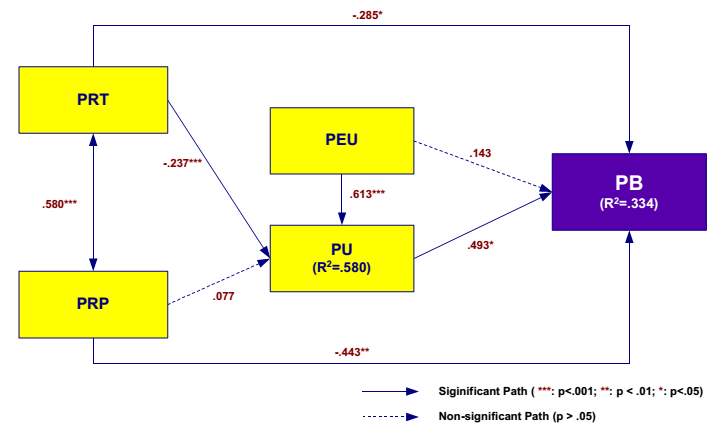
Figure 2.5. Research Model of Factors Affecting E-Commerce Adoption (Lee, Park and Ahn, 2001)
2.2.6. Predicting E-Services adoption: a Perceived Risk facets perspective (Featherman and Pavlou, 2003)
To understand the negative utility (potential losses) attribute to e-service adoption, Featherman and Pavlou did a research predicting E-Service adoption based on Perceived Risk Theory in 2003. The research gave out a proposed E-Services adoption model by operationalizing, integrating, and empirically testing specific risk facets within the Technology Acceptance Model. Also in the research, due to the low number of items when measuring the psychological and social risk facets, the authors combined these facets of Perceived Risk into one psychosocial facet as defined by Cunningham (1967).
Research findings indicated that performance-based risk facets (time risk, privacy risk, financial risk) adversely influenced e-services adoption, and perceived ease of use decreased these risk concerns. Performance-related risks proved to be the most salient concerns for the sample and context, with the fact that they appears to be the basis for all other risk facets. Meanwhile, the social risk concerns—the chance of losing status by using the e-service, were not noticeable.
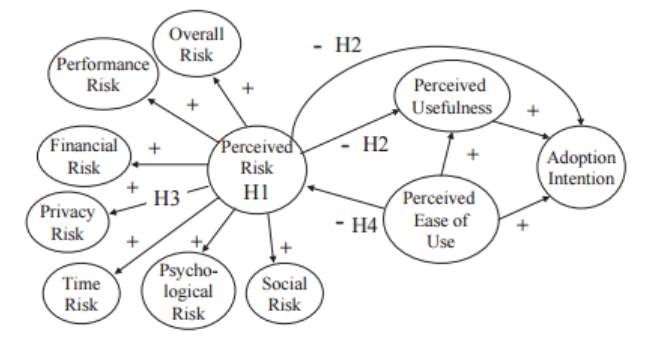
Figure 2.6. Research model of Predicting e-services adoption: a Perceived Risk facets perspective (Featherman and Pavlou, 2003)
2.3. Proposed Research Model
In regard of the relationship between Perceived Risk and Perceived Value, there are many researches (Sweeney et al., 1999; Teas and Agarwal, 2000; Korda and Mumel, 2004; Ashton, et al., 2008) that all reach the same conclusion of Perceived Risk has a negative impact on Perceived Value. Besides, there is an adverse relationship between Perceived Risk and Purchase Intention, which is proved and tested in the studies of Bauer (1960), Mitchell (1999), Kim, Ferrin and Rao (2008), and Chiu et al. (2012). Therefore, the researchers also hypothesize that Perceived Risk affects negatively on both Perceived Value and Purchase Intention of E-commerce Consumers in the context of this study.
Additionally, by applying the two theories of Lee, Park and Ahn (2001) and Featherman and Pavlou (2003), and conducting qualitative research, Perceived Risk in this study is made of three main components: Perceived Risks associated with Product/service, Perceived Risks happening during the process of online Transactions, and Psychosocial Risk.
In conclusion, from all related researches and qualitative research, the authors propose the model of Studying the Impact of Perceived Risk on Perceived Value and Purchase Intention as follows:
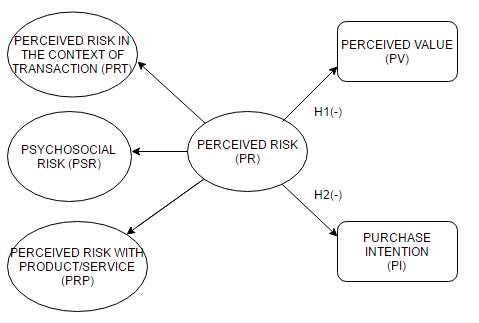
Figure 2.7. Proposed Research Model
2.4. Definitions and Hypotheses
2.4.1. Purchase Intention
The theory of reasoned action is considered as an influential explanation of the process that determines people’s intentional behavior (Boster et al., 2014). People generally consider the results that their actions will lead to before they decide to perform a certain action (Ajzen and Fishbein, 1980). The theory of reasoned action is used in order to predict a person’s intention to behave in a certain way; this is done by evaluating a person’s attitude towards a specific behavior as well as the subjective norms of influential people and groups that could affect the person’s attitude (Ajzen and Fishbein, 1980). Subjective norms are persuaded by one’s perception of the beliefs of the people around us, for example, parents, friends or colleagues (Ajzen and Fishbein, 1980). Subjective norms influence us since we have certain beliefs of how people will react to our behavior, and whether they will accept it or not (Ajzen and Fishbein, 1980). The subjective norms influence consumers’ online Purchase Intention through the attitude consumers have towards online shopping (Hansen et al., 2004).
Attitudes influence consumers’ online intention to purchase (Korzaan, 2003). Lim and Dubinsky (2005) stated that consumer attitudes towards online shopping affects if consumers have intentions to purchase online. Hansen et al. (2004) concluded that consumers attitude toward online shopping is a predictor of online shopping. Consumers’ attitude toward the behavior of shopping online is a determinant of behavioral intention (Hansen et al., 2004). In order for online Purchase Intention to exist, consumers must perceive the benefits of shopping online instead of in physical stores (So et al., 2005).
Purchase Intention is the plan to buy a specific product or service within a designated time (Hair, Wolfinbarger, and Money, 2011). Moreover, online Purchase Intention is affected by the consumers’ determination to purchase from an E-commerce business (Salisbury et al., 2001; Choon et al., 2010). When consumers are familiar with E-commerce businesses, they are more likely to visit an online site with the intention to purchase (Forsythe and Shi, 2003; Gefen and Straub, 2004; Yu-Hui and Barnes, 2007). The familiarity in E-commerce means that the consumers have an understanding for what is happening in that context, and what is going to happen next (Gefen, 2000; Gefen and Straub, 2004).
Companies need to meet the demands of consumers in terms of their needs and wants in order for Purchase Intention to increase (Fortsythe and Shi, 2003). Online Purchase Intention is a significant predictor to actual purchase (Pavlou, 2003; Kim et al., 2008). Online Purchase Intention is used to reach the goal of actual purchase (Lee and Lee, 2013). However, consumers’ actual buying behavior can be different from their buying intention (Lee and Lee, 2013).
2.4.2. Perceived Value
The general concept that can be understood is that Perceived Value involves the relationship between consumer and the product (Holbrook, 1996). Integrating various definitions of value into a single definition, Zeithaml (1988) proposed “Perceived Value is the consumer’s overall assessment of the utility of a product based on the perceptions of what is received and what is given”. The “received” components can be referred to the benefits get from using the product while the “given” components can be referred to the consumer sacrifice in acquiring the product including monetary and non-monetary aspect. In this regard, Zeithaml (1988) described value in four different ways: (1) value as low price, (2) value as whatever the consumer wants in a product, (3) value as the quality get from the price the consumer pay, and (4) value as what is get for what is given.
Woodruff (1997) defined Perceived Value as consumer’s perceived preference for an evaluation of those product attributes, attribute performances, and consequences arising from use that facilitate (or block) achieving the consumer’s goals and purpose in use situations. He suggested the value hierarchy model conceptualize into three hierarchy levels, which are desired attributes, desired consequences, and desired end-states or goal and purposes.
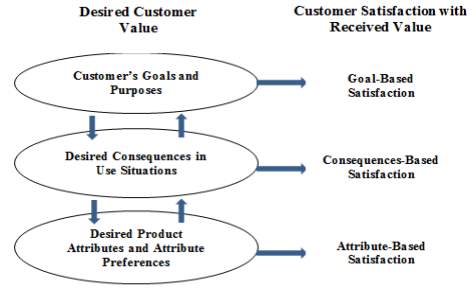
Figure 2.8. Value hierarchy model (Woodruff, 1997)
Woodruff (1997) suggests that consumers may either use their goal to attach and evaluate the attribute preferences and attribute performance, or think the product as a bundle of attributes then form the certain attributes based on their ability to facilitate the desired consequences, which eventually help them to achieve their goals and purposes. Woodruff (1997) argues that this hierarchy model helps manager to specify exactly what managers should learn about their consumers. He argues that this model looks beyond the attribute-based key buying criteria, in which it involves the consequences in use situation that the seller should learn and the goals to which those consequences lead. The dynamic concept of Perceived Value proposed by Woodruff (1997) is explaining the complexity of Perceived Value as well as has successfully helped to explain why consumer attach different weights to various benefits in evaluating alternative product/ service.
Zeithaml’s (1988) and Woodruff’s (1997) definitions and concept of consumer Perceived Value are the most used and implemented in the literature.
2.4.3. Perceived Risk
In 1996, Pallab said that consumers were worried about their credit cards and disclosing personal information when purchasing on the Internet. Meanwhile, Ko et al. (2004) assumed that consumers were also concerned about purchasing a product from the sellers without physically examining the products. Therefore, E-commerce consumers perceive the risk at high level when purchasing online compared with traditional one. Negative aspects belonging to this shopping mode are also becoming critical (Ko et al., 2004). On the other hand, Mitchell (1999) suggested that Perceived Risk is a powerful factor at explaining consumers’ purchase behavior since consumers are more often motivated to avoid the potential loss than to achieve purchasing success. Consequently, Perceived Risk has been a topic of study for many researchers and marketing managers (Kalakota and Whinston, 1996).
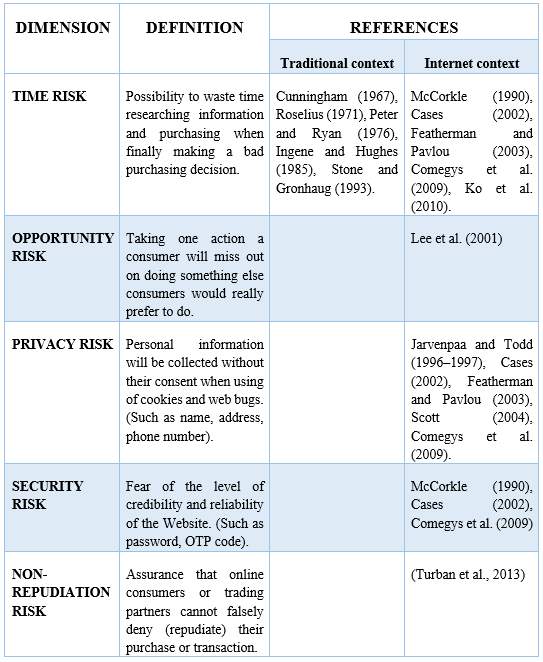
In 1960, Bauer pioneered the application of Perceived Risk theory to consumer behavior and indicated that Perceived Risk is developed on the basis that all consumer behavior involves risk and that, in uncertain circumstances, actions conducted by consumers may produce consequences that are beyond their expectations and unpleasant. Therefore, consumer behavior can be regarded as bearing a burden of risk. Cox (1967) further indicated that, when negative effects are produced because consumers are uncertain of how purchases should be executed to satisfy their target level the most or are worried that their purchases cannot achieve expected goals, Perceived Risk is produced. In addition, Cox (1967) indicated that Perceived Risk incorporated two concepts: the importance and degree of risk from the consequences of decision-making by consumers, and consumers’ subjective expectation that negative consequences may possibly occur. Moreover, if consumers perceived the probability of the mismatches between their expectations and incentives offered by the situation, after that, they perceived a risk of not fulfilling their motives at that time (Atkinson 1964). Cunningham (1967) proposed that consumer Perceived Risk is comprised of the severity of loss and unexpected results that may possibly occur. On the other hand, Freatherman and Pavlou (2003) defined Perceived Risk as consumers’ feeling unclearly about possible negative consequences when using product or service. They also identified seven dimensions of Perceived Risk: performance risk, financial risk, time risk, psychological risk, social risk, privacy risk, overall risk.
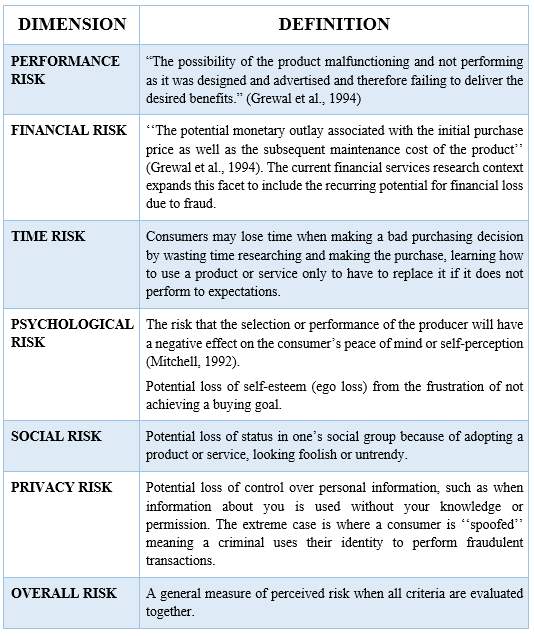
Table 2.1. Dimensions of Perceived Risk based on Featherman and Pavlou (2003)
In their research in predicting E-Service adoption based on Perceived Risk Theory (2003), Featherman and Pavlou combined the psychological and social risk facets of Perceived Risk into one Psychosocial facet as defined by Cunningham (1967).
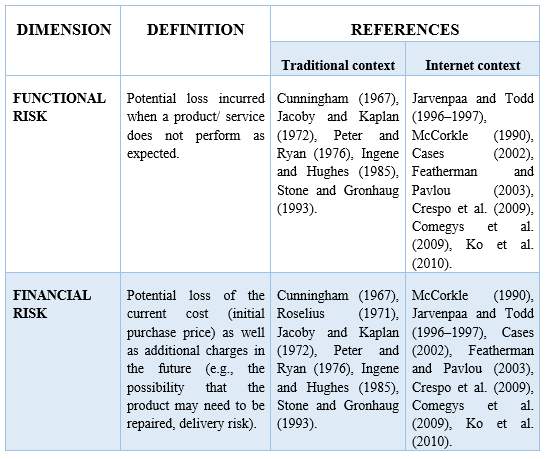
In addition, as mentioned by Lee and colleagues (2001), there are two main sections of Perceived Risk in the process of online shopping. The first one is the Perceived Risks associated with Product/service, which means that the risks when the consumers have to face to functional loss, financial loss, time loss and opportunity loss. The second is the Perceived Risks happening during the process of online transactions and including risk of privacy, security (authentication), and non-repudiation. Among them, the influence of financial risk, product risk, and concern for privacy and security is momentous (Senecal, 2000; Borchers, 2001; Bhatnagar et al., 2000). For more specific, Table 2.2 below shows the Perceived Risk dimensions which are cited from the previous researches.
Table 2.2. Perceived Risk Dimensions and Their Concepts Proposed in Marketing and Information System Literature
2.4.4. Hypotheses
The negative influence of Perceived Risk on the Perceived Value of different types of products (e.g. household appliances, calculators) has been found in researches of Sweeney et al. (1999), and Teas and Agarwal (2000). In addition, according to the study conducted by Snoj, Pisnik Korda and Mumel (2004), there is a significant relationship between Perceived Risk and Perceived Value. The research has found out that Perceived Risk has a negative influence on Perceived Value of mobile phones in Slovenia.
Furthermore, in a paper studying The impact of consumer evaluation on Perceived Risk, Perceived Value and intention to purchase in the field of Hotel restaurant co-branding, Ashton, et al. (2008) has led to the conclusion that low Perceived Value may be resulted from the high Perceived Risk and conversely, the low Perceived Risk may result in high Perceived Value. This also means that there is a negative relationship between these two mentioned factors.
Hence, the proposed first hypothesis is stated as follows:
Hypothesis 1. Perceived Risk has a negative effect on Perceived Value.
A consumer’s online decision has been found to be affected by Perceived Risk. It is common for a consumer who is about to make an online transaction to be unwilling to purchase online due to the overwhelming sense of risk when compared to the brick-and-mortal shopping (Bauer, 1960; Mitchell, 1999). Additionally, according to Kim, Ferrin and Rao (2008), a consumer’s Perceived Risk has a solid destructive impact on the Purchasing Intention, which has the meaning that the higher the level of Perceived Risk is, the less the intention to purchase of consumers is. Moreover, Chiu et al. (2012) provided confirmation that consumers’ Perceived Risk decreases Purchasing Intention in B2C E-commerce. In other words, Perceived Risk remains a negative factor of Purchase Intention.
Therefore, this research’s second hypothesis is formulated as follows:
Hypothesis 2. Perceived Risk has a negative effect on Purchase Intention.
Chapter 3: METHODOLOGY
Chapter 3 will discuss research process, research methods (qualitative and quantitative research), data collection methods, sampling design, questionnaire design, and data analysis methods. The details of qualitative research (in-depth interview and focus group) and quantitative research (survey) applied in this study are also described. Furthermore, the ethical aspect while conducting this paper is fully committed.
3.1. Research Process
In this study, the research process is modified based on the business research process that is developed by William et al. (2012). The details of research stages are illustrated in the figure below, which was already adjusted to fit the research.
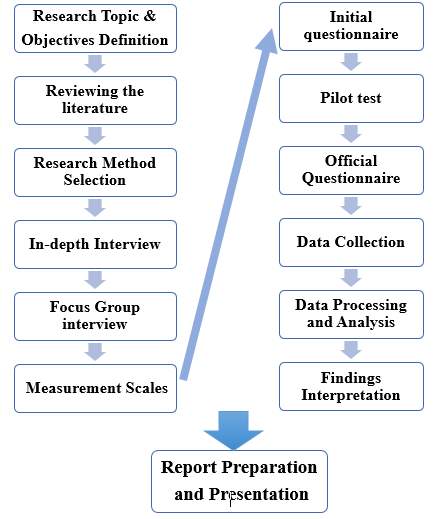
Figure 3.1. Research process (Adapted from William et al., 2012)
3.2. Research Methods
3.1.1. Qualitative Research
Hair, Wolfinbarger, and Money (2011) argued that qualitative research is a collection of data in the form of the text or image by using open-ended questions, observation and finding data. The researchers took data from respondents by using questions and observation of the behavior, gestures and their attitude. The aim is to find out deeply thoughts of the respondents. According to Bogdan and Biklen (1982), qualitative research has five features. The first is natural features. The researchers will directly interview respondents. In addition, they will use a number of tools such as paper, pens and recording equipment to support. It will help the researchers carefully observe behavior and attitudes of the respondents in the interview. The second feature is described data. This data is mainly in the form of words or images. It may be gestures, words, body language, the small details, which expressed through videos, recordings. Third, the researchers are interested in everything related to the process. In other words, they interested in how things happen. Fourth is data analysis by using inductive reasoning. Researchers will rely on open-ended questions to analyze the data. Final feature is meaningful features. The data collected will be displayed in the transcript and the material recorded. It will provide information for the report.
The advantage of qualitative approach is providing preliminary insight, which is useful in developing ideas about how variables are related. Normally, it can help to define constructs or variables, and even help to suggest items that can be used to measure those constructs (Hair, Wolfinbarger, and Money, 2011). Therefore, using this method, the research can successfully explore the impact of Perceived Risk on Perceived Value and Purchase Intention in E-Commerce. The main method for collecting qualitative data is in-depth interviews and focus group. In this research, researchers conducted both Focus Group and In-depth interviews with consumers who are using products and services in E-Commerce platform.
In-depth Interview
In-depth interview is method in which participant was asked by an interviewer face-to-face. The advantage of this method can provide good detail because researchers focus on individually at a time (Hair et al., 2012), which would be useful for this research to analyze as much factors as possible for the research. Furthermore, researchers can concentrate more about the insight of consumers’ decision, to clarify whether there is different view of factor on consumers’ perspective. The interviewers ask interviewees semi-structured or probing questions basing on prepared model and attributes (Hair et al., 2012). The authors decide to interview an expert who is working for Vat Gia Corporation.
In the interview, the expert introduced E-Commerce market in Vietnam was in the explosive period. She thanked to some reports, in which many evidences were showed to realize that this market was potential. However, she also mentioned that there were too many risk for consumers when they bought products or service via E-Commerce website. For more specifics, the consumers were facing various types of risk such as product risk, time risk, financial risk, security risk, privacy risk, and non-repudiation risk. Moreover, she emphasized that especially in Vietnam market, there were the appearance of opportunity risk, relationship risk and social risk, since buying via E-Commerce website was not popular, while the traditional trade played an important role in the everyday trading. When asked, the expert stated that these risks had the negative impact on the perception of consumers about not only what additional values consumers could gain from E-commerce compared to that from traditional trading, but also whether buying products or services via E-Commerce websites or not.
Focus Group Interview
Focus Group interview is one where the interviewer exercises greater control over the interview while permitting the interviewee’s opinions to come out as he or she answers to the questions of the researcher (Easterby-Smith et al., 2008; Ghauri and Gronhaug, 2010; Robson, 2011). A focus group is a group interview that focuses on a particular issue, product, service or topic by encouraging discussion amongst participants and the sharing of perceptions in an open and tolerant environment (Krueger and Casey, 2009). This means that, in comparison with other forms of group interview, individual group members’ interactions and responses are both encouraged and more closely controlled to maintain the focus. Participants are selected because they have certain characteristics in common that relate to the topic being discussed and they are encouraged to discuss and share their points of view without any pressure to reach a consensus (Krueger and Casey, 2009).
In this research, there are eight participants who had purchased through E-Commerce website. They include four students, two professors and two employees in FPT University Campus Ho Chi Minh City. Questionnaire content for qualitative research methods at Appendix 2: Questions for focus group interview.
In the interview, the participants said that they bought many kinds of products via E-Commerce websites, such as cosmetics, fashion items, household devices and electronic devices. Moreover, Tiki.vn, Lazada.vn, Amazon.com, Taobao.com were the popular websites that they often visited to look for the information of electronic devices and make orders. Most of them knew these websites by their friends and the advertisement banners in other websites. When asked about their Perceived Risk when buy electronic devices in E-Commerce websites, they realized that there were many types of risk including time risk, financial risk, performance risk, privacy risk, security risk, non-repudiation risk, social risk and psychological risk. The interviewees also mentioned that if they felt the risk in some E-Commerce websites, they would not buy products or service via these websites, never introduced these websites for their friends.
On the other hands, six over eight participants agree with the interviewer about the opportunity risk when make the electronic devices in E-Commerce websites. Most of the reasons why they perceived the opportunity risk were that they found other websites sell the same products with low prices, that buying this products means they waived buying other products.
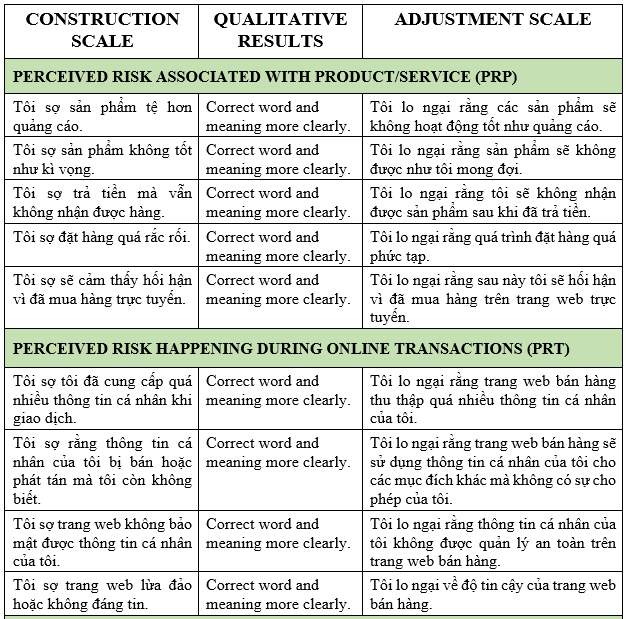
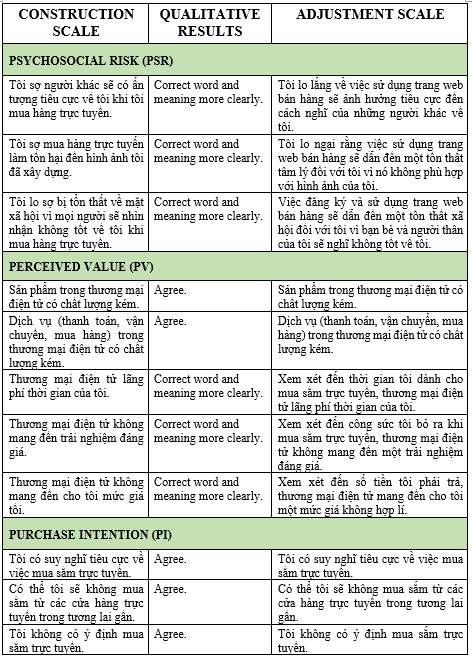
Participants in the interview also assisted the author in developing and adjusting variables that fit the scale, adding, subtracting or changing the wording for comprehension and relevance to all participants who attempt the official survey. Qualitative research results help the authors get the corrected scale as the following:
Table 3.1. Adjusted Measurement Scale
3.1.2. Quantitative Research
Quantitative research methods is common methods and mainly that the researchers used (Goulding, 2002; Singh, 2007). According to Creswell (2009), data were collected by using quantitative methods are more valuable and more reliable than qualitative research method. Besides, quantitative research method uses predetermined response options and questions in form of questionnaire to reach a huge number of respondents (Hair et al., 2012). In addition, Woodside and Wilson (2003) suggested quantitative research method help researchers understand the problem better. It will help identify relationships between data sets. Moreover, the researchers can have conclusion based on the analysis of statistical data.
As mentioned above, qualitative method is useful in explore the factors of service quality and combine with secondary data, it can create the literature framework, which have both factors and relationships of these factors. On the other hand, quantitative method is better use for in obtaining information to predict relationship between factors, get meaningful insight of the relationship, validate relationship and test hypotheses (Hair et al. 2012). Therefore, in this research, quantitative research method is conducted after qualitative research to analyze the relationship of factors achieved from qualitative research. In particularly, survey was used.
Survey method
Survey research method is usually used to collect quantitative data for descriptive research design from large group by using question/ answer process. There are three major type of Survey research methods: Person-Administered, Telephone-Administered and Self-Administered (Hair et al., 2012). Self-Administered survey, which completed by the survey subject, comprise Mail survey; online survey; Mail panel survey; Drop-off survey; Paper and pencil survey (Hair et al., 2012).
Paper and pencil survey method in Self-Administered are used in this research.
3.3. Data Collection Methods
Data collection methods play an important role in impact evaluation by providing information useful to understand the processes behind observed results and assess in people’s perceptions (Fhssrsc.byu.edu, 2017). Researchers need to deepen the understanding of data collection methods as well as develop a data plan in a scientific manner. This helps not only achieve the highest efficiency but also avoid wasting money and time-consuming. The researcher should use as many data sources as possible (e.g. using primary and secondary data) as this will make a research more powerful (Myers, 2008). Secondary data refers to information that previously collected for some other problem or issue, and it includes data from reliable sources such as journal or newspaper articles or published books (Myers, 2008). In other way, primary data is the data collected by the researchers for a current research problem or opportunity (Hair et al., 2010). Therefore, the data can be collected through primary or secondary sources.
3.3.1. Primary Data
The primary data is collected from both qualitative research (in-depth interview and focus group) and quantitative research (survey). The in-depth interview was conducted on January 25, 2017 with an expert from Vat Gia Corporation, with the total time of interview approximately 20 minutes. The focus group interview was conducted on January 30, 2017 with eight participants from FPT University Campus Ho Chi Minh City (four students, two professors and two employees) at the self-study corner on second floor. After that, the pilot study with 60 respondents was carried out online in there days time starting from February 15, 2017. The link of the online survey was delivered through social network’s accounts of the researchers.
Finally, the official survey was conducted in two weeks time, from March 01 to March 14, 2017, in four districts (District 1, 3, 12, and Tan Binh) of Ho Chi Minh City. The official questionnaire has four pages, including three sections with 28 questions. The researchers collected 400 valid samples at the end of the survey.
3.3.2. Secondary Data
Secondary data is not directly collected by researchers but it is collected from available sources. Many different sources, such as reports of government, ministries, agencies, newspapers, specialized scientific and academic journals, and books, help researchers explore research problem and use related information effectively. There are three kinds of secondary data: Multiple Sources, Survey and Documentary (Mark Saunders, Philip Lewis and Adrian Thornhill, 1997). In this study, secondary data are used to support clarifying the impact of Perceived Risk on Perceived Value and Purchase Intention in E-Commerce.
3.4. Sampling Design
3.5.1. Sampling Techniques
Sampling techniques consist of a list of methods that minimize the overload-collected information by gathering data from a sub-group instead of all possible cases (Saunders et al., 2003).
Hair (2011) separated sampling methods into two categories, including Non-probability and Probability. According to Dissertation.laerd.com (2017), Non-probability Sampling is the technique that the subjective judgement of the researcher is the basis for samples to be collected, while Probability Sampling Technique has random selection as its cornerstone. Within the scope of this research, there is not a comprehensive population list available or online shopper database. Therefore, non-probability sampling method is chosen and applied in this paper.
There are many types of Non-probability sampling technique, but Judgmental Sampling Technique is selected to be used in this research. Judgmental Sampling is a technique in which the researchers choose a sample from a population based on their own experience and assessment of the condition, rather than using statistical sampling techniques (Neuman, 2005; Oxfordreference.com, 2017). In addition, Judgmental Sampling has the advantage of making generalizations easier because all participants have characteristics the paper focus on, compared to a random sample (Statistics How To, 2017).
3.5.2. Sample Size
According to Hair, Black and Babin (1998), to ensure the accuracy of the research, the sample size (n) is defined on the ratio of 5:1, which means the minimum number of samples should be at least 5 times the total number of variables in Exploratory Factor Analysis (EFA), and the amount of samples should not be less than 100.
In this study, with 20 items, the minimum sample size to be ensured should be n= 5*20 =100. In addition, Comrey and Lee (1992), Tabacknick and Fidell (1996) stated that the number of respondents would reflect the reliability of the corresponding results as shown in Table 3.
Table 3.2. The relationship between Quantity and Quality of Sample Sizes
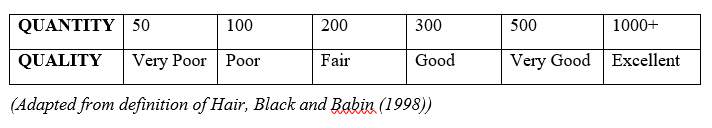 Consequently, the authors decided the sample size in this paper would be 400.
3.5. Questionnaire Design
Questionnaire is a tool including many associated questions to reach the final goal of collecting data from respondents (Malholtra and Briks, 1999). The questionnaire structure consists of three parts: screening questions, survey questions, and personal information. Part 1 employs Nominal Scale to develop Screening Questions, whereas Part 2 applies the 5-point Likert Scale to determine consumers’ Agreement level in 3 factors.
Nominal Scale requires respondents answer to gather raw responses (Hair, Wolfinbarger, and Money, 2011).
Likert Scale asks respondents the agreement level with statements based on their behaviors (Likert, 1931). According to Likert (1931), the Likert Scale had five scale descriptors, which include ‘Strongly Disagree’, ‘Disagree’, ‘Neither Agree or Disagree/ Neutral’, ‘Agree’, and ‘Strongly Agree’.
3.4.1. Measurement Scale
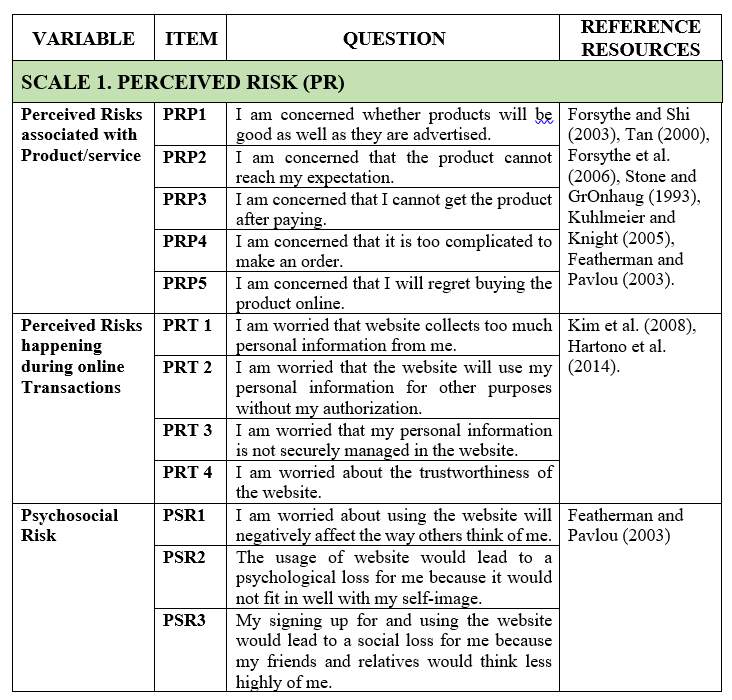
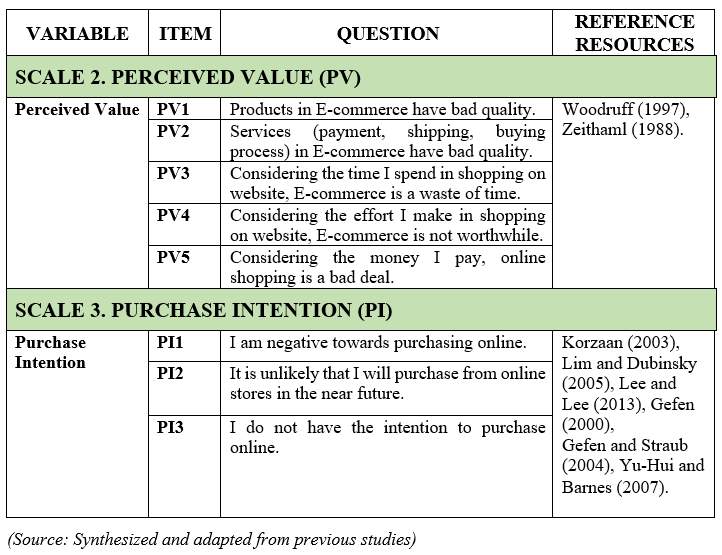
Measurement scale is the combination of selectively earlier studies in the field such as the research of Forsythe et al. (2006). Stone and GrOnhaug (1993), Kim et al. (2008), Hartono et al. (2014), Woodruff (1997).
In details, the measurement scales of Perceived Risk, Perceived Value, and Purchase Intention are demonstrated as follows.
Table 3.3. Measurement Scale
3.4.2. Pilot Test
A pilot test is carried out on a small scale of 60 respondents, who are guided by researchers and worked independently. The objective of this pilot test is to test the logic of the questions, grammatical and spelling errors before the official survey.
Scale verification and preliminary analysis
Cronbach’s Alpha analysis
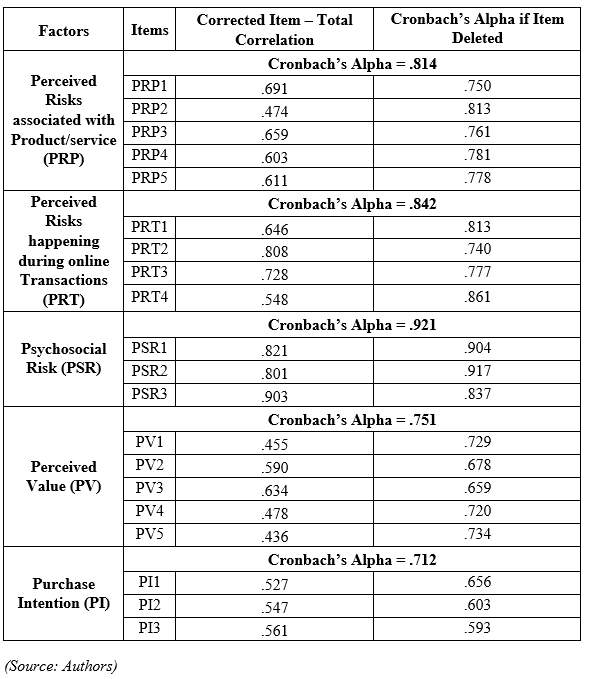
For the Perceived Risk associated with product and service scale, both the Corrected Item – Total Correction coefficient of all items are greater than 0.3. The Cronbach’s Alpha coefficient of the group is 0.814 and greater than 0.6 while the Cronbach’s Alpha coefficient of each variable when eliminating itself is smaller than Cronbach’s Alpha coefficient of the group. Therefore, scale met the standard for conducting official survey.
For the Perceived Risk happening while the process of online transaction scale, both the Corrected Item – Total Correction coefficient of all items are greater than 0.3. The Cronbach’s Alpha coefficient of the group is 0.842 and greater than 0.6 while the Cronbach’s Alpha coefficient of each variable when eliminating itself is smaller than Cronbach’s Alpha coefficient of the group. Therefore, scale met the standard for conducting official survey.
For the Psychosocial Risk scale, both the Corrected Item – Total Correction coefficient of all items are greater than 0.3. The Cronbach’s Alpha coefficient of the group is 0.921 and greater than 0.6 while the Cronbach’s Alpha coefficient of each variable when eliminating itself is smaller than Cronbach’s Alpha coefficient of the group. Therefore, scale met the standard for conducting official survey.
For the Perceived Value scale, both the Corrected Item – Total Correction coefficient of all items are greater than 0.3. The Cronbach’s Alpha coefficient of the group is 0.751 and greater than 0.6 while the Cronbach’s Alpha coefficient of each variable when eliminating itself is smaller than Cronbach’s Alpha coefficient of the group. Therefore, scale met the standard for conducting official survey.
For the Purchase Intention scale, both the Corrected Item – Total Correction coefficient of all items are greater than 0.3. The Cronbach’s Alpha coefficient of the group is 0.712 and greater than 0.6 while the Cronbach’s Alpha coefficient of each variable when eliminating itself is smaller than Cronbach’s Alpha coefficient of the group. Therefore, scale met the standard for conducting official survey.
Table 3.4. Cronbach’s Alpha pilot test
Exploratory Factor Analysis (EFA)
Perceived Risk
Based on the test results, the KMO of the three Perceived Risk scales is 0.691 and greater than 0.6. Sig value (Bartlett’s test) is 0.000 and is less than 0.05 so the Exploratory Factor Analysis is reasonable and analytical coefficients meet the requirement to conduct the official survey.
Eigenvalue equals to 1.684 and greater than 1, which represents that the variance is explained by each factor, and the derived factors have the best summary information.
The variance extracted is 70.777% and greater than 50% so the scale has the statistical significance.
Table 3.5. The table summarizes EFA results of Perceived Risk
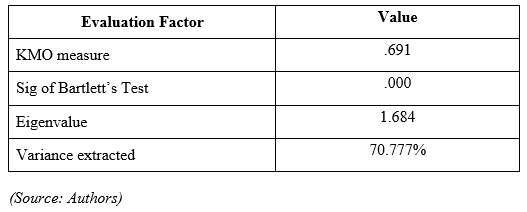
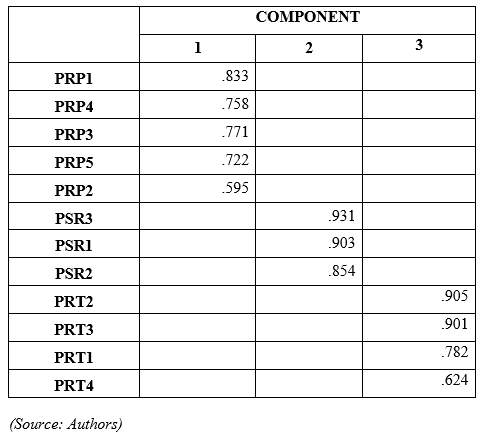
Table 3.6 shows that 12 observation variables are grouped into 3 groups, all variables have the Factor Loading coefficient about 0.5. Therefore, conditions are met to conduct the formal survey.
Table 3.6. Rotated Component Matrix of Perceived Risk
Perceived Value and Purchase Intention
Based on the test results, the KMO of the three Perceived Risk scales is 0.637 and greater than 0.6. Sig value (Bartlett’s test) is 0.000 and is less than 0.05 so the Exploratory Factor Analysis is reasonable and analytical coefficients meet the requirement to conduct the official survey.
Eigen value equals to 1.523 and greater than 1, which represents that the variance is explained by each factor, and the derived factors have the best summary information.
The variance extracted is 61.005% and greater than 50% so the scale has the statistical significance.
Table 3.7. The table summarizes EFA results of Perceived Value and Purchase Intention
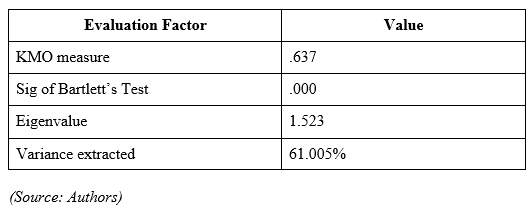
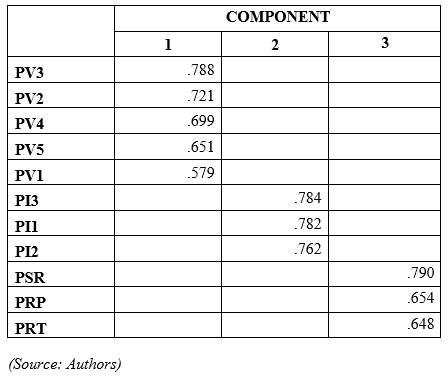
Table 3.8 shows that eight observation variables are divided into two groups; all variables have the Factor Loading coefficient about 0.5. Therefore, conditions are met to conduct the formal survey.
Table 3.8. Rotated Component Matrix of Perceived Value and Purchase Intention
3.6. Data Analysis Methods
In this report, the authors used IBM SPSS 20 and IBM AMOS 22 as the tools to analyze and process the data.
3.6.1. Descriptive Statistical Analysis
Descriptive statistics is applied to not only describe the basic characteristics of the data but also provide an elementary summary of sample and measures. This provides the basis for all quantitative data analysis.
When summarizing a quantity of consumer characteristics such as gender, age, income, the statistical parameters usually mentioned are frequency, percentage, variance, standard deviation. These data are represented by diagrams or descriptive tables that make it easy to analyze and compare information together. To approximate the relevance of descriptive statistics, consider whether there is a relationship between pairs of related variables, the Independent-Sample, T-Test, One-Way ANOVA test are generally considered to use.
3.6.2. Exploratory Factor Analysis (EFA)
Exploratory Factor Analysis (EFA) is a technique to reduce a set of observational variables to a smaller number of factors but these still demonstrate most of the information content and statistical significance of the initial set of variables (Hair, Black and Babin, 1998). Each observation variable will be weighted as a factor called Factor Loading, which tells the researchers which factor that each variable will belong to.
The EFA model is considered appropriate when the following criteria are met:
Factor Loadings are the single correlation coefficients between variables and factor systems. The selected observational variable is the factor whose Factor Loading is greater than or equal to 0.5 (Hair, Rolph and Tatham, 1987) and KMO coefficient (Kaiser Meyer Oklin) is from 0.6 to 1 (Kaiser, 1974).
Cumulative of variance is the percentage of total variance cited by the factors. Total variance accounted for with the addition of each successive factor. According to Kaiser (1974), the criterion for accepting factorial analysis is cumulative of variance greater than 50%.
After the new factorial variables from a set of observations are reduced, these variables are included in further analyses such as Independent-Sample T-Test, One-Way ANOVA Test.
3.6.3. The Reliability of Scale
The reliability of scale is evaluated by using the Cronbach’s Alpha coefficient. This is the reliability confidence used to measure the correlation between observed pair variable.
According to Hoang Trong and Chu Nguyen Mong Ngoc (2005), the Cronbach’s Alpha coefficient from 0.8 to 1 is a good scale, 0.7 to 0.8 is usable and less than 0.6 is applied to the new research concept.
Scale reliability testing can be determined by Corrected Item – Total Correction correlation to eliminate unnecessary variables from the scale. Corrected Item – Total Correction Ratio is the correlation coefficient of a variable with the average of other variables in the same scale, so the higher the ratio is, the higher correlates this variable to the other variables in the group. According to Nunnally and Bernstein (2010), variables with Corrected Item – Total Correction correlation less than 0.3 are considered variables that need to be rejected.
3.6.4. Confirmatory Factor Analysis (CFA)
Confirmatory Factor Analysis helps to clarify the indicators: the reliability of the scale, the convergence value and discriminative value.
Measurement of uniqueness (Steenkamp and van Trijp, 1991 and Hair et al., 1998), the suitability of the model with data, is a necessary and sufficient condition for the observed variable to become unidirectional unless the proposed error of the observed variables are correlated. The Chi-Square (CMIN), Chi-Square (CMIN/df), Good of Fitness Index (CMIN/df), Chi-Square GFI, Comparative Fit Index (CFI), Tucker and Lewis Index (TLI), Root Mean Square Err Approximation (RMSEA) are used to measure the relevance of the research model to the data. A study model is considered appropriate for market data if the Chi-Square test has P-Value more than 5%, CMIN/df less than or equal 2, in some cases CMIN/df may be smaller or equal 3 (McIver and Carmines, 1981), both GFI, TLI and CFI are equal to or greater than 0.9. However, in the recent views of the researchers, GFI is still acceptable if it is less than 0.9 (Hair, Black and Babin, 1998), RMSEA is less than or equal to 0.08, but it is better if RMSEA is less than or equal to 0.05 (Steiger, 1990).
The reliability of the scale is assessed by the composite reliability and cumulative of variance. The scale is valid if the cumulative of variance of each concept is greater than 0.5 (Hair, Black and Babin, 1998), unless, it means that the variance has a greater variance than the variance explained by the concept and this scale is not worth. In Confirmative Factor Analysis, composite reliability is a better indicator than Cronbach’s Alpha because it does not make a mistake when assuming the reliability of variables is equal together (Anderson and Gerbing, 1988). As stated by Hair, Black and Babin (1998), the scale ensures reliability when composite reliability is greater than 0.6. The scales achieve convergence values when standard weight of the scale is greater than 0.5 and has statistically significant (p
Discriminant value verification of concepts in the model includes within-construct discriminant validity and across-construct discriminant validity. If these concepts are different, the scales achieving distinction (Bagozzi and Foxall, 1996). The discriminant value will be satisfactory if it satisfies the following criteria: the correlation between the two components of a concept or between two concepts is less than one and the pattern satisfies the suitability of the data.
3.6.5. Verification of the research model by Structural Equation Modeling (SEM)
The CFA results show that the scale in the research model is consistent with the data through convergence values, discriminant values, composite reliability and cumulative variance. Therefore, the hypotheses in the research model are not changed. Using SEM allows researchers to explore measurement errors and incorporate abstract concepts that are difficult to distinguish. Hypotheses testing and modeling with this tool not only have more advantages than traditional methods such as multivariate regression due to the calculation of the proposed error, but also allow incorporating the hidden concepts into theoretical models at the same time (Hulland, Chow and Lam, 1996). Maximum Likelihood is used to estimate the parameters in the research model if the data has a standard distribution.
3.6.6. Independent-Samples T-Test
The Independent-Samples T-Test assesses whether the means of two independent groups (Meyers et al, 2013). In the Independent-Samples T-Test, the variances between two independent groups need to be tested. This helps authors know the degree of dispersion of the observed data (Welch, 1937). The Levene test will be applied to evaluate this test and a statistically significant result indicates unequal variance across groups (Meyers et al, 2013). If the result of Levene test has the significance less than 0.05, the hypothesis whether the variance of two independent groups is equal is rejected. This result has an effect on testing the hypothesis about the equality between the mean of two independent groups by significance in equal variances assumed or not (Hoang Trong and Chu Nguyen Mong Ngoc, 2005).
3.7. Ethical Consideration
Ethical Consideration can be specified as one of the most critical part of the research, since human involvement is required for sampling. The main purpose of this section is to display some ethical principles for participants and group’s members to follow while conducting the research.
Firstly, all contents and regulations of other previous research paper is made sure to be respected. Figures and statistics that are gathered from other information sources are cited in the References Section. Other suggestions, comments, and perspectives from famous authors, researchers and organizations are also put in References, which all are cited following Harvard style.
Secondly, the authors ensure that no “easy-to-access” groups of people, especially children, are taken advantage of while the survey is conducted. Any actions that involve children asking may lead to overall negative results. Hence, by choosing the appropriate subjects, the outcome would be accurate and the research’s trustworthiness would be enhanced.
Thirdly, the choices and privacy of all participants are protected. All answers in the questionnaire is based on voluntary basis. In addition, the identity of any individuals or organizations that participate in the research must be kept anonymously, and any personal information in terms of demographics provided is ensured to be only used for study purpose.
Finally, the researchers make a commitment that there will be no negative impact on any individuals or organizations involved in this study. Furthermore, the authors would take full responsibility for this paper’s results or any information related to this research.
Chapter 4: DATA ANALYSIS
In chapter 3, the research methodology and research design are discussed in detail. Then, the authors need to describe the respondents’ profiles along with sample characteristics, measurement model assessment and structure model fit. The goal of this chapter are to describe the sample demographics and characteristics of respondents, examine the reliability of scales, identify the principal components, analyze the factors, discuss the development of the measurement of constructs, analyze overall measurement model fit, and test the proposed model to identify the theoretically plausible model. Furthermore, the Independent Samples T-test is applied to test whether there is any difference between male and female in terms of Perceived Risks.
4.1. Sample Demographics
In terms of sample demographics, respondents’ characteristics are varied widely (Morgan and Hunt, 1994), and are considered in this section. The respondents’ gender, income, age and their career are the relevant personal data. While demographics information has no impact on the level of analysis of this study, this reporting may provide a generalized view in terms of male and female buying electronic devices via E-Commerce website. Table 4.1 shows that the sample was made up by 217 female respondents (54.2 %) and 183 male respondents (45.8).
Table 4.1 also shows that that majority of the importers in this sample have income less than 5 million per month (60%) followed by income group from 5 to 10 million per month (22.7%) and from 10 to 15 million per month (17.3%). It is revealed that most of respondents are from 18 to 25 year old (91.5%). Moreover, it is also reported that the respondents are varied widely in terms of their career. The highest representatives of the respondents (65.7%) are the students, next are officers (15.0%) and ITs (11.0%), finally, businessman (4.3%) and teachers (4.0%) are the low representatives of the respondents.
Table 4.1. Respondents’ profile
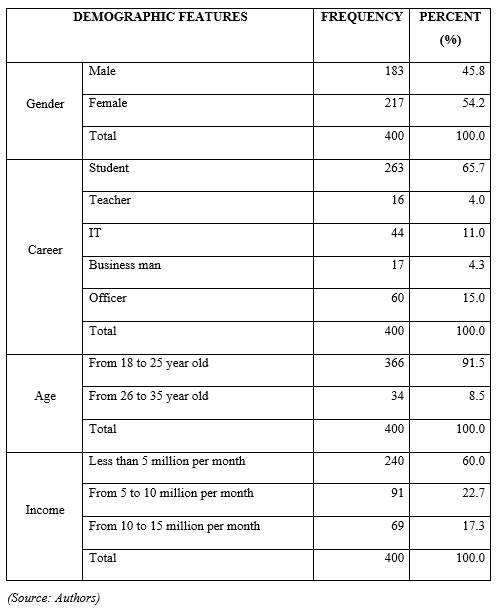
4.2. Scales’ reliability
According to Spearman (1904), the observed results of the measurement operations contain mixture of both true value and measurement error. Furthermore, Cronbach (1951) developed a generalized reliability test as coefficient alpha applicable to most item-scoring system. This has become the most widely used reliability index (Meyers, Gamst and Guarino, 2013).
4.2.1. Cronbach’s Alpha: Perceived Risk scales
Cronbach’s Alpha of items in Perceived Risk scales are displayed in Table 4.2.
Both the components of Perceived Risk scales have the high Cronbach’s Alpha coefficient. For more specific, the Cronbach’s Alpha of Perceived Risk scales associated with Product/service (PRP) is high (0.882) and greater than 0.6. Both Correlated Item – Total Correction coefficient of all PRP are greater than 0.3. Besides that, about the Perceived Risk scales happening during online Transaction (PRT), both correlated Item – Total Correction coefficient are greater than 0.3 and Cronbach’s Alpha of this scales is also higher than 0.6 (0.870). As well as the previous scales, the Psychosocial Risk (PSR) scales also has Cronbach’s Alpha is 0.786 and higher than 0.6, all items in this scales’ Correlated Item – Total Correction coefficient are higher than 0.3. Therefore, both observed variables of the Perceived Risk scales are kept stably for Exploratory Factor Analysis (EFA).
Table 4.2. Cronbach’s Alpha of the scales
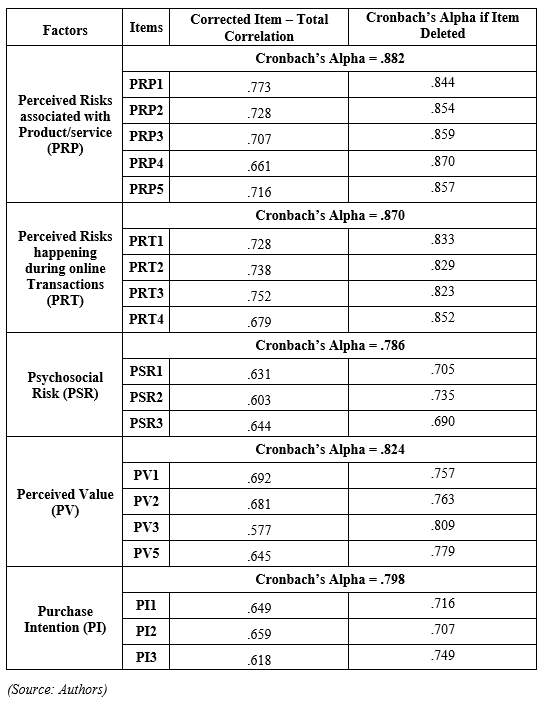
4.2.2. Cronbach’s Alpha: Perceived Value scales
The initial result of Cronbach’s Alpha analysis of Perceived Value (PV) scales is small (0.620). However, according to Hoang Trong and Chu Nguyen Mong Ngoc (2005), Cronbach’s Alpha less than 0.7 is just suitable for new research concept only. On the other hand, PV4 item of this scales has Correlated Item – Total Correction coefficient lower than 0.3 (0.173). This means that PV4 has low correlation with other items in the PV factor and nearly does not contribute any to the concept of the factor. Moreover, Cronbach’s Alpha of this scales if deleting PV4 would be 0.824 and higher than 0.7. For that reason, the authors decide to eliminate PV4 item. After the Cronbach’s Alpha test are conducted again, this index of PV scale is 0.824 and higher than 0.7, all Correlated Item – Total Correction coefficients are also higher than 0.3 (Table 4.2). Hence, all items of PV scales without PV4 are kept for EFA.
4.3.3. Cronbach’s Alpha: Purchase Intention scales
The Purchase Intention scales has high Cronbach’s Alpha index (0.798) and higher than 0.6. In addition, all Correlated Item – Total Correction coefficient are higher than 0.3. Therefore, all observed variables of Purchase Intention scales are accepted and analyzed in EFA.
4.3. Descriptive statistics
According to Table 4.4, the answer “Totally agreed” and “Totally Disagreed” are chosen in all question. The Mean indexes of the observed variables are from 2.14 to 3.21. The item PSR1 (“I am worried about using the website will negatively affect the way others think of me”) has the highest rate of agreeableness while the lowest rate is belonging to item PI3 (“I do not have the intention to purchase electronic devices online”).
For more specifics, in the Perceived Risk associated with Product/Service scale, the Mean indexes are from 3.11 to 3.20. The item PRP4 (“I am concerned about that it is too complicated to make an order”) has the highest rate of agreeableness. The item PRP2 (“I am concerned that the product cannot reach my expectation”) has the lowest rate of agreeableness.
In the Perceived Risk happening during Transaction scale, the Mean indexes are from 2.95 to 3.01. The item PRT2 (“I am concerned that the website will use my personal information for other purposes without my authorization.”) and PRT4 (“I am concerned about the trustworthiness of the website”) have the highest rate of agreeableness. The item PRT3 (“I am worried that my personal information is not securely managed in the website”) has the lowest rate of agreeableness.
In the Psychosocial Risk scale, the Mean indexes are from 3.11 to 3.21. The item PSR1 (“I am concerned about using the website will negatively affect the way others think of me”) has the highest rate of agreeableness. The item PSR3 (“My signing up for and using the website would lead to a social loss for me because my friends and relatives would think less highly of me”) has the lowest rate of agreeableness.
In the Perceived Value scale, the Mean indexes are from 2.48 to 2.84. The item PV2 (“Service (payment, shipping, buying process) in E-commerce have bad quality”) has the highest rate of agreeableness. The item PV3 (“Considering the time I make in shopping on website, E-commerce is a waste of time”) has the lowest rate of agreeableness.
In the Purchase Intention scale, the Mean indexes are from 2.14 to 2.51. The item PI1 (“I am negative towards purchasing online”) has the highest rate of agreeableness. The item PI3 (“I do not have the intention to purchase electronic devices online”) has the lowest rate of agreeableness.
Table 4.3. Descriptive statistics
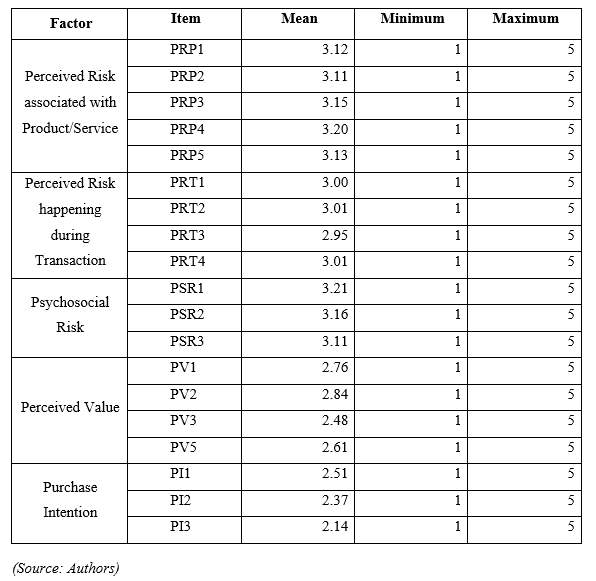
4.4. Principal components and factor analysis
Principal components and factor analysis comprise a family of exploratory data analysis procedures that are used to consolidate a relatively larger set of variables into a small number sets already-developed measures (Meyers, Gamst and Guarino, 2013).
4.4.1. EFA: Perceived Risk scales
Thanks the Cronbach’s Alpha results, all the scales of Perceived Risk satisfy the requirement of reliability. Therefore, all the observed variables of these scales are continuously analyzed by EFA test. The result of EFA is showed in Table 4.4 and Table 4.5.
Based on the test results, the KMO of the Perceived Risk scales is 0.893 and greater than 0.6 and Sig value (Bartlett’s test) is 0.000 and less than 0.05, so the factors analysis is applicable and the derived factors have the best meaningful summary information. Eigenvalue equals to 1.342, greater than 1, and the variance extracted is 70.105%, greater than 50%, so it is approved that all observed variable has correlation with others. Moreover, all Factor Loadings the items are higher than 0.5, which means that the factor analysis has the practical significance.
Thus, the Perceived Risk scales include three principal components and twelve observed variables. In details, the Perceived Risk scale associated with the Product/service is measured by five observed variables (PRP1, PRP2, PRP3, PRP4 and PRP5). Then, the Perceived Risk scale happening while the process of Transaction is measured by four observed variables (PRT1, PRT2 PRT3 and PRT4). Finally, the Psychosocial Risk scale is measured by three observed variables (PSR1, PSR2 and PSR3).
Table 4.4. KMO result of Perceived Risk’s scales
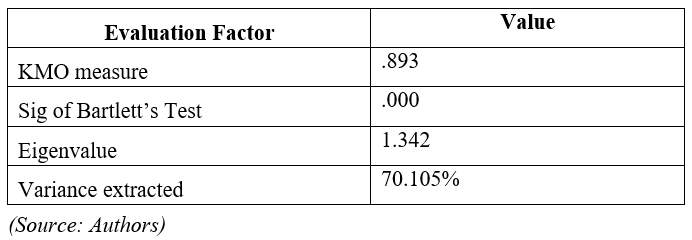
Table 4.5. Principal components of Perceived Risk’s scales
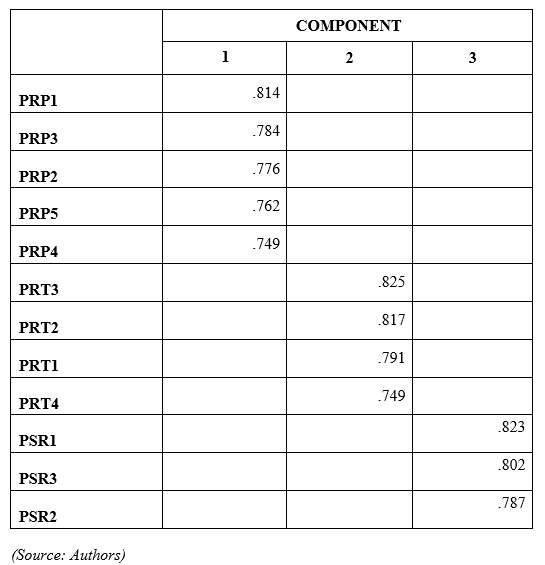
4.4.2. EFA: Perceived Value and Purchase Intention
EFA result reduces seven observed variables which are accepted in the Cronbach’s Alpha test and three components of Perceived Risk into three principal components. The results are showed in Table 4.6 and Table 4.7.
Based on the test results, the KMO of all concepts scales is 0.872 and greater than 0.6 and Sig value (Bartlett’s test) is 0.000 and less than 0.05, so the factors analysis is applicable and the derived factors have the best meaningful summary information. Eigenvalue equals to 1.159, greater than 1, and the variance extracted is 69.514%, greater than 50%, so it is approved that all observed variable has correlation with others. Moreover, all Factor Loadings the items are higher than 0.5, which means that the factor analysis has the practical significance.
Moreover, Table 4.7 also shows the scales of research model include three principal components, seven observed variables and three main factors of the Perceived Risk. In details, the Perceived Value scale is measured by four observed variables (PV1, PV2, PV3 and PV5). Then, the Purchase Intention scale is measured by three observed variables (PI1, PI2 and PI3). Finally, the Perceived Risk component is measured by three factors (PRP, PRT and PSR).
Table 4.6. KMO result of the concept in the research model
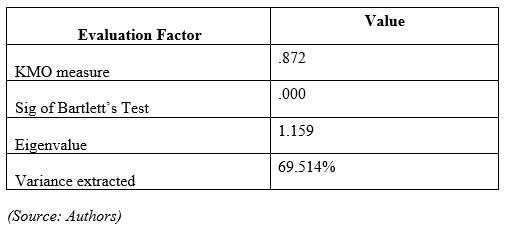
Table 4.7. Principle components of research model
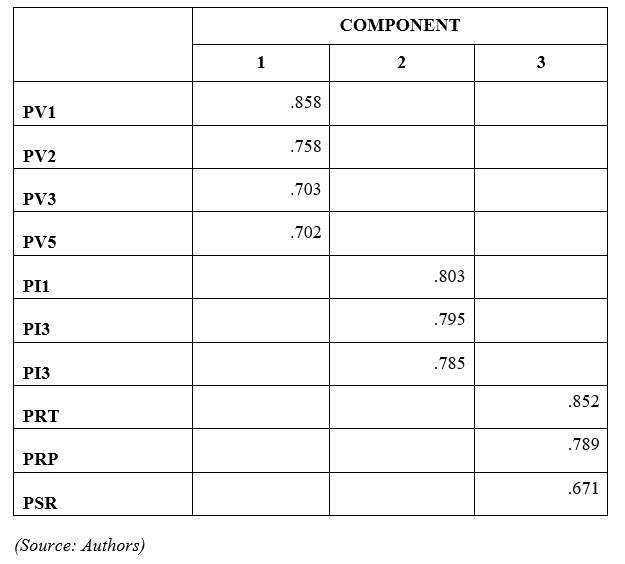
4.5. Measurement development
To proceed with measuring the fit, there are some interrelated statistical techniques usually used to analyze the data as a supportive stream. Therefore, this section explores the reliability of scores for the construct measures followed by Confirmative Factor Analysis (CFA). The reliability tests examine the internal consistency of the item in a measure to determine whether each observed variable should be retained or any exclusion should be done.
4.5.1. CFA results of the Perceived Risk
The CFA result of Perceived Risk scales is present in the Figure 4.1. This model has degrees of freedom at 51 and Chi-square at 107.630 with P at 0.000. Moreover, the model is suitable for market significance since both GFI (0.957), TLI (0.969) and CFI (0.976) are larger than 0.9. Besides that, RMSEA is 0.053 and smaller than 0.08. Besides that, all standardize regression weights are over 0.5, so the scales meet the convergence value. Moreover, the composite reliability and average variance extracted of all components in Perceived Risk are over 0.5 (Table 4.8). This results indicate that all Perceived Risk scales meet the requirement about the value and reliability. Overall, the fit statistics indicated a moderate fit between the data and the theoretical model. Based on these results and in accordance with literature on Perceived Risk, the three factor model is used for further analysis.
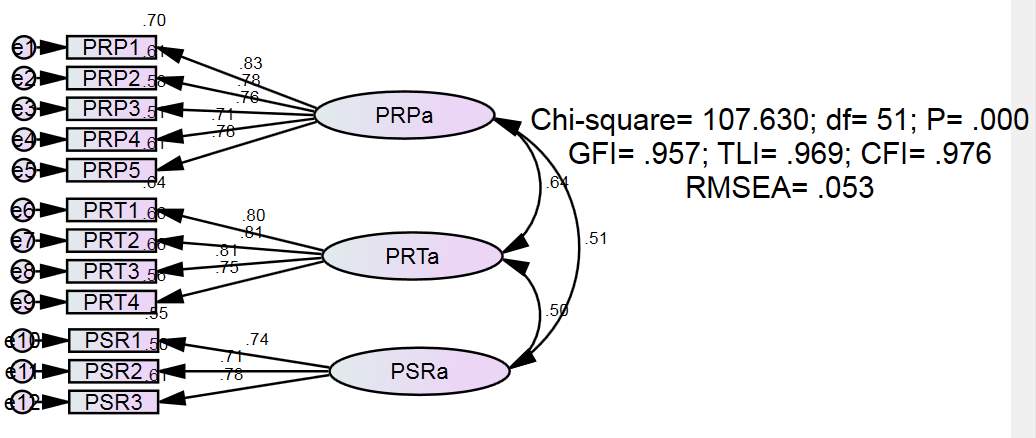
Figure 4.1. CFA results of Perceived Risk (standardize) (Source: Authors)
4.5.2. CFA results of the Perceived Value and Purchase Intention
The CFA result of Perceived Value and Purchase Intention scales is present in the Figure 4.2. This model has degrees of freedom at 30 and Chi-square at 72.466 with P at 0.000. Moreover, the model is suitable for market significance since both GFI (0.965), TLI (0.960) and CFI (0.973) are larger than 0.9. Besides that, RMSEA is 0.060 and smaller than 0.08. Besides that, all standardize regression weights are over 0.5, so the scales meet the convergence value. Moreover, the composite reliability and average variance extracted of the Perceived Value and Purchase Intention are over 0.5 (Table 4.8). This result indicates that all Perceived Value and Purchase Intention scales meet the requirement about the value and reliability. Overall, the fit statistics indicated a moderate fit between the data and the theoretical model. This indicates that the four items of Perceived Value and three items of Purchase Intention are considered reliable as well as valid for this construct measure.
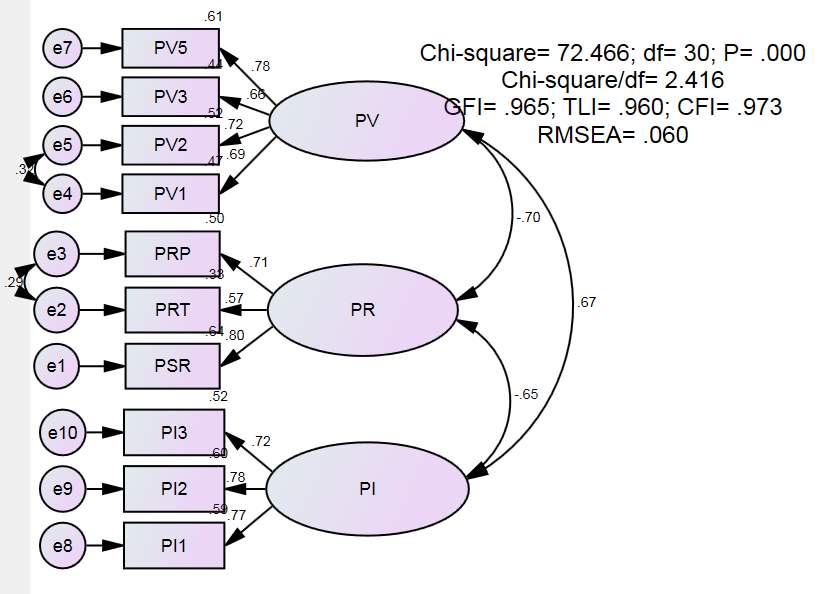
Figure 4.2. CFA results of Perceived Value and Purchase Intention (standardize)
(Source: Authors)
Table 4.8. Summary table of test results
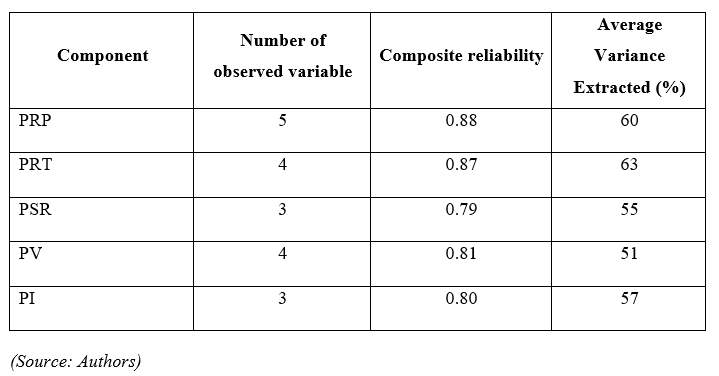
4.6. Verification of research model
After establishing and confirming the measurement model, the next step is to test the structural model by using IBM SPSS AMOS 22 program.
4.6.1. Analysis of Perceived Risk theoretical model
The estimated results of the Perceived Risk theoretical model is show in Figure 4.3. This indicates that the Chi-square of 107.630 with 51 degrees of freedom is statistically significant at P equaling 0.000 and being less than 0.05, indicating an appropriate fit. Other fit statistics are within the acceptable values with GFI, CFI, TLI, which are over the commonly acceptable values of 0.9 (GFI = 0.957, CFI = 0.976, TLI = 0969), RMSEA is 0.053 and less than 0.08. Overall, the fit statistics indicated a moderate fit between data and theoretical model.
The results demonstrate that the Perceived Risk includes three main components, Perceived Risk associated with Product/Service, Perceived Risk happening during Transaction and Psychosocial Risk. Moreover, according to these results, Perceived Risk is measured by 12 observed variables or can be considered as 12 criteria. In specific, Perceived Risk associated with Product/Service is measured by five observed variables, Perceived Risk happening during Transaction is measured by four observed variables and Psychosocial Risk is measured by three observed variables.
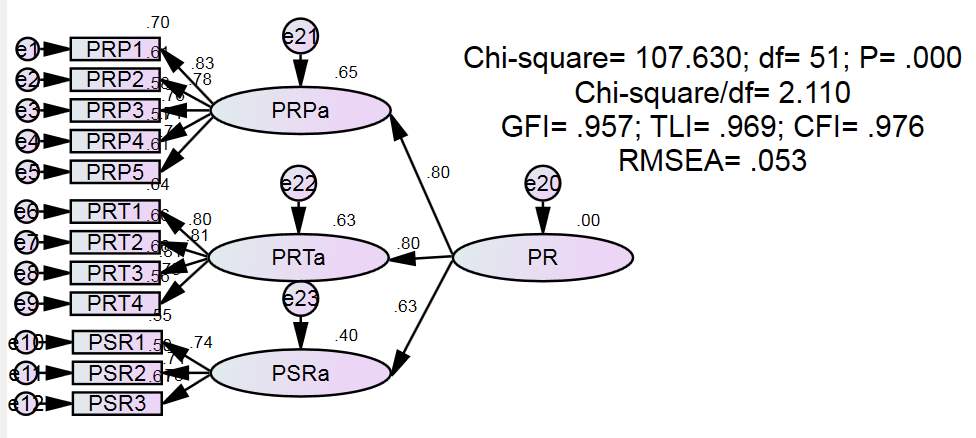
Figure 4.3. Estimated results of the Perceived Risk theoretical model (Source: Authors)
4.6.2. Analysis of research model
The estimated results of the research model are show in Figure 4.4. This indicates that the Chi-square of 90.607 with 31 degrees of freedom is statistically significant at P equaling 0.000 and being less than 0.05, indicating an appropriate fit. Other fit statistics are within the acceptable values with GFI, CFI, TLI, which are over the commonly acceptable values of 0.9 (GFI = 0.956, CFI = 0.963, TLI = 0.946), RMSEA is 0.069 and less than 0.08. Overall, the fit statistics indicated a moderate fit between data and theoretical model.
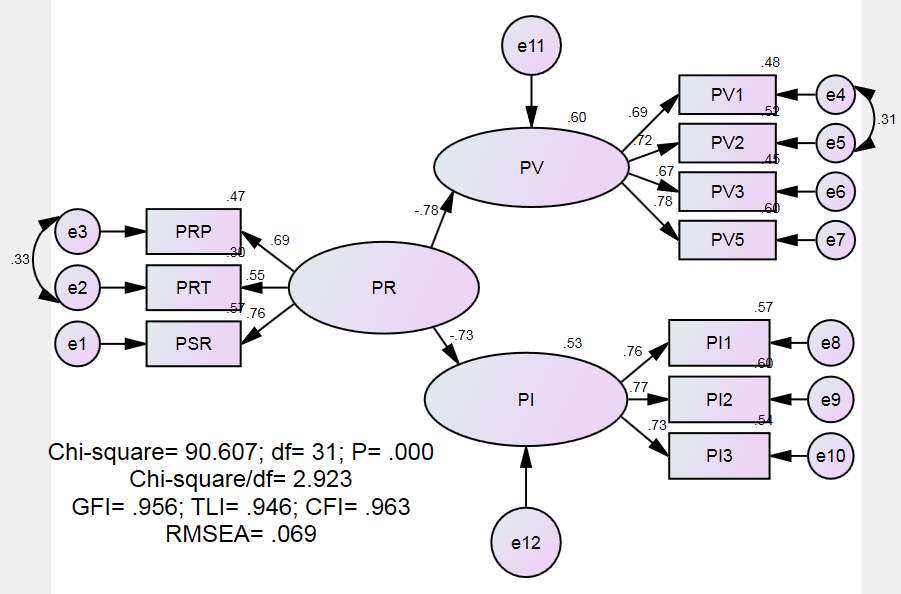
Figure 4.4. Estimated results of the research model (Source: Authors)
4.6.3. Hypotheses testing
To answer the research question mentioned in Chapter 1 (section 1.5), a proposed framework and a set of hypothesis are developed in Chapter 2 (section 2.4.4) and now are being tested in this section by using output of Structural Equation Model. The standardized estimated results of the main parameters are presented in Table 4.9. These results show that these relationships have the statistics significance (p
Table 4.9. Result for Hypothesized Path Relationships
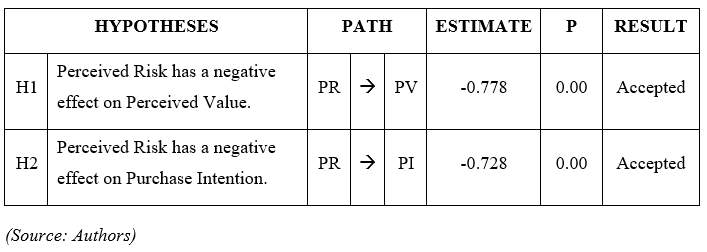
In specific, hypothesis H1 which is about the negative impact of Perceived Risk on Perceived Value is supported with P-value at 0.00 (Estimated standardized regression weight = -0.778). This means that the higher Perceived Risk the consumers feel, the lower Perceived Value the consumers have. Furthermore, the absolute value of the standardized regression weight is quite high, which indicates that Perceived Risk has an extremely effect on Perceived Value.
Moreover, hypothesis H2 which is about the negative impact of Perceived Risk on Purchase Intention is supported with P-value at 0.00 (Estimated standardized regression weight = -0.728). Therefore, Perceived Risk has the negative impact on not only Perceived Value but also Purchase Intention. In other words, when the consumers have high Perceived Risk, their Purchase Intention tendency is low.
4.6.4. Verification of research model via bootstrap
In quantitative research methods by sampling, the sample is divided into two sub-samples. One sub-sample is used to estimate the parameter in the model and left one is used to reevaluate. Another way is to repeat the study with another sample. The above two methods are often unrealistic because Structural Equation Model analysis usually requires large sample sizes, so this cost a lot of time and expense (Anderson & Gerbing, 1988). In such cases, bootstrap is a suitable alternative method (Schumacker & Lomax, 1996). Bootstrapping is any test or metric that relies on random sampling with replacement.
This study uses a bootstrap method with a replicate of 1000 samples (N = 1000). The estimated results from 1000 samples are averaged and the difference is shown in Table 4.10. According to the bootstrap’s result, the difference is very small. When consider Critical Ratio of all parameter, all the absolute value of them is not more than 2. This means p-value of hypotheses H1 and H2 less than 0.05 (5%) and hypotheses H1 and H2 are supported. So, the research concluded that the estimates in the model is reliable.
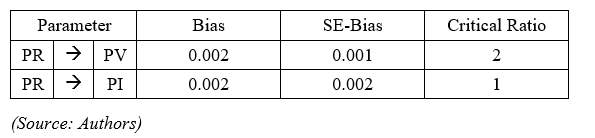
Table 4.10. Bootstrap’s Result with N = 1000
Moreover, when applying the bootstrap method for Perceived Risk theoretical model with 1000 samples (N = 1000). The difference between data the authors collected and bootstrap method is small (Table 4.11). This means that the difference is not statistically significant. Hence, the estimates in the Perceived Risk theoretical model are reliable.
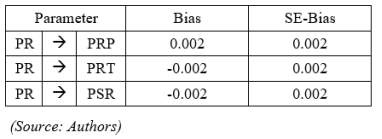
Table 4.11. Bootstrap’s Result of Perceived Risk theoretical model with N = 1000
4.7. Other Test related to gender
To assess the Perceived Risk components between the gender in E-Commerce in Ho Chi Minh City, the authors decide to use the Independent Sample T-Test with gender as independent variable and three components of Perceived Risk as the dependent variables.
4.7.1. The Perceived Risk associated with Product/Service between male and female
The null hypothesis (H03): There is no different significant of Perceived Risk associated with Product/Service between male and female.
According to Table 4.12, the statistics show that the sig of Levene’s Test is 0.810, more than 0.05 so sig of T-Test in Equal variances assumed is used to test the hypothesis. In addition, sig value of T-Test is 0.053 and more than 0.05. This means that the null hypothesis (H03) is accepted and the alternative hypothesis is rejected. In other words, there is no different the significant of Perceived Risk associated with Product/Service between male and female.
4.7.2. The Perceived Risk happening during Transaction between male and female
The null hypothesis (H04): There is no different significant of Perceived Risk happening during Transaction between male and female.
For the Perceived Risk associated with Product/Service between male and female, Table 4.12 shows that the sig of Levene’s Test is 0.626, more than 0.05 so sig of T-Test in Equal variances assumed is used to test the hypothesis. In addition, sig value of T-Test is 0.064 and more than 0.05. This means that the null hypothesis H04 is accepted and the alternative hypothesis is rejected. In other words, there is no different the significant of Perceived Risk happening during Transaction between male and female.
4.7.3. The Psychosocial Risk between male and female
The null hypothesis (H05): There is no different significant of Psychosocial Risk between male and female.
Table 4.13 shows that the sig of Levene’s Test is 0.667 and more than 0.05 so sig of T-Test in Equal variances assumed is used to test the hypothesis. In addition, sig value of T-Test is 0.047 and less than 0.05. This means that the null hypothesis H05 is rejected and the alternative hypothesis is accepted. In other words, there is the different significant of Psychosocial Risk between male and female. For more specifics, male have Psychosocial Risk higher than female (table 4.13).
Table 4.12. Independent statistics of Perceived Risk between genders
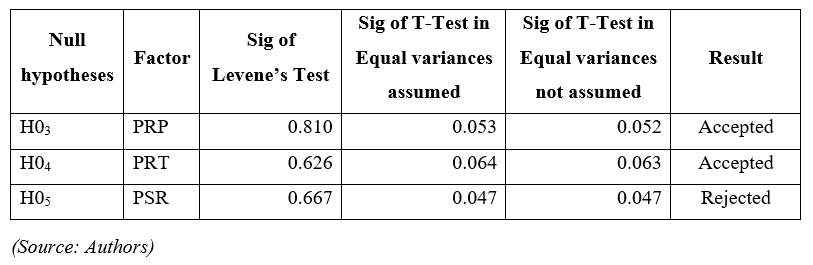
Table 4.13. Means of Psychosocial Risk between male and female
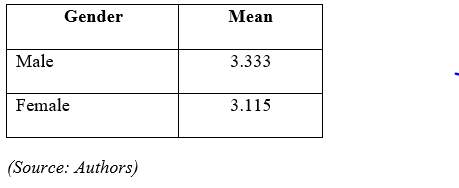
Chapter 5: FINDINGS AND IMPLICATIONS
In this chapter, key findings of the study, which are the answers for the research questions mentioned in Chapter 1, are displayed. Discussions, managerial implications, limitations of the research and suggestions for future research are also included.
5.1. Key Findings
Consumers’ Perceived Risk in E-commerce consists of Perceived Risk associated with Product/Service, Perceived Risk happening during Transaction and Psychosocial Risk. Among these three components, the most influential are Perceived Risk associated with Product/Service (PRP) and Perceived Risk happening during Transaction (PRT), with Estimated Standardized Regression Weight of 0.8. Meanwhile, the Psychosocial Risk (PSR) has the least impact on Consumers’ Perceived Risk (Estimated Standardized Regression Weight equals 0.63).
According to data analysis results of the research, Perceived Risk has a strong negative effect on Perceived Value (Estimated Standardized Regression Weight equals -0.778). Besides, Consumers’ Perceived Risk has a significant negative relationship with Purchase Intention as well, with Estimated Standardized Regression Weight of -0.728.
In addition, Male are more aware of Psychosocial Risks than Female.
5.2. Discussions
The results of this research show that there are three main components contributing to the Perceived Risk. This is proved by many previous researches. Besides that, there are many E-Commerce cases in Ho Chi Minh City when the consumers have to face a lot of risk related to product/service, happening while transaction and belonging to psychosocial (An Ninh The Gioi Online, 2016; Nhan Dan Dien Tu, 2016; Cong Thuong, 2015).
In the research, the authors found that Psychosocial Risk contributes less than other components to the Perceived Risk. This one is also similar with the research of Featherman and Pavlou (2003) mentioned in chapter 2. Moreover, based on the knowledge of the authors, there are fewer researches studying the Psychosocial Risk than other factors of Perceived Risk associated with Product/Service and Perceived Risk happening while the Transaction.
Moreover, the research consolidates again the negative impact of Perceived Risk on Perceived Value and Purchase Intention, which are figured out by many researchers. This is also accurate by the respondents in the qualitative research. Further, according to the VECOM (2017), although the number of visit time accessing the E-Commerce website is high, number of successful transaction is too low and the visitors stay in the E-Commerce website for 10 minutes in averages. The reason for this unreasonableness is that the visitors perceive a lot of risk when buying via E-Commerce website and they look for information in these website and go to physical stores for transaction.
Furthermore, the research also suggests that there is the different significant of Psychosocial Risk between male and female. This was recommended in the Sex and Gender Differences in Risk, Pathophysiology and Complications of Type 2 Diabetes Mellitus article (Kautzky-Willer et al, 2016).
5.3. Managerial Implications
From the results of our study, Perceived Risk associated with Product/Service (PRP) and Perceived Risk happening during Transaction (PRT) contributes the most to how consumers perceive risks involved in E-commerce. Therefore, in order to reduce consumers’ Perceived Risks, companies have to pay attention to these two types of Risks.
Firstly, in terms of Perceived Risk associated with Product/Service (PRP), the item PRP4 (“I am concerned about that it is too complicated to make an order”) has the highest rate of agreeableness, which means that consumers are most concerned about the complexity in making an online purchase. Hence, companies should make the online buying process easy to understand and carry out. One of the options may include making a video or e-book guiding consumers how to buy products online. Providing many payment methods is another way to make the ordering process easier. The quickly order tool, with which consumers do not have to register an account or login to make an order, is another option as well.
The item PRP2 (“I am concerned that the product cannot reach my expectation.”) has the lowest rate of agreeableness. It can be implied that in consumers’ mind, the quality of online product is reliable and they have the tendency to trust product’s quality and description as displayed on the website. Companies should keep on guaranteeing the product’s quality will be the same as described and posted on the website. The images of the product should be real images of real products. The services and warranty policies should be clear and consumer-oriented as much as possible. The reviews of consumers should be trustworthy and based on actual experiences.
Secondly, among the five items of Perceived Risk happening during Transaction scale, the item PRT2 (“I am concerned that the website will use my personal information for other purposes without my authorization.”) and PRT4 (“I am concerned about the trustworthiness of the website”) have the highest rate of agreeableness. This implies that consumers have higher awareness of information assurance issues when purchasing online. Companies should publicly state the policies of not using consumers’ personal information for other purposes without any authorization. Even if companies wish to collect basic personal information of consumers in order to improve consumers’ buying experiences, they always have to ask for permission.
The trustworthiness of the website can be confirmed with the official information and business license of companies, and the authorization and origin of the website. In addition, to increase consumers’ trust, the website can provide the contact methods (telephone number, address) on the website.
Besides, the item PRT3 (“I am worried that my personal information is not securely managed in the website”) has the lowest rate of agreeableness. This means that consumers trust the information management of the website. Therefore, companies should keep on maintaining this trust by providing consumers with certifications or tools that can prove the effectiveness and reliability of information assurance and management process of the website. Another option is to make an infographic describing the information management process of the website.
In the Psychosocial Risk scale, the highest rate of agreeableness is the item PSR1 (“I am concerned about using the website will negatively affect the way others think of me”). This can be interpreted that consumers concern about the negative reputation and the negative thoughts others have of them. Therefore, companies should invest more in emphasizing the good impacts and benefits of E-commerce. In addition, if there is any fraud in E-commerce, companies should quickly support the clarification of the news, as well as confirm with consumers that they are ethical and reliable business. Building companies’ positive profile and brand name is a long-term investment that any companies should put more effort in. Companies can also develop a new premium service or premium products that can only be obtained through online order, as a way to promote that online purchase is as fabulous as traditional trade.
The item PSR3 (“My signing up for and using the website would lead to a social loss for me because my friends and relatives would think less highly of me”) has the lowest rate of agreeableness. This can be implied that consumers are confident and have little concern about social loss related to friends and relatives. Hence, companies should promote more about how the benefits of E-commerce can strengthen social relationships, such as birthday gift, surprise messages or services booked from a friend or relative in different countries. Some promotions or discount programs to enhance the family relationships should be conducted as well.
Furthermore, the results of the paper show that there is difference in the way male and female perceive Psychosocial Risk. Male have higher awareness of Psychosocial Risk compared to female. Therefore, companies can use this finding as a way to push E-commerce sales up. For example, companies can release a TVC or a campaign in which implies that a man can easily show social status and his care and for loved ones, by ordering flowers, chocolate, or other romantic activities, with just one click.
In the Perceived Value scale, the item PV2 (“Service (payment, shipping, buying process) in E-commerce have bad quality”) has the highest rate of agreeableness. This refers that consumers care most about services provided in terms of Perceived Value of online purchase. Therefore, companies should pay more attention in improving their consumer-oriented services. Companies should place themselves in consumers’ positions to satisfy consumers’ needs and wants in the fullest and quickest way. Companies can make use of cookies and Consumer Relationship Management (CRM) system to have appropriate and suitable strategies.
The item PV3 (“Considering the time I make in shopping on website, E-commerce is a waste of time”) has the lowest rate of agreeableness. This means that in consumers’ mind, buying online is considered as quick and time-saving. As a result, companies should invest more in making consumers’ buying process more simple and effective. The user-friendly online ordering process or comparing tools of similar products are good options to consider.
In the Purchase Intention scale, the item PI1 (“I am negative towards purchasing online.”) has the highest rate of agreeableness. This means that consumers still have negative opinions about online purchase. Therefore, there is a need for companies to increase consumers’ awareness of the safety and advantages of E-commerce. Companies can organize workshops about the benefits of E-commerce, or even develop strategies that encourage potential consumers to purchase online.
The item PI3 (“I do not have the intention to purchase online.”) has the lowest rate of agreeableness. This can be implied that consumers have the intention to purchase online in mind, which is a good sign for companies to create more promotion activities and give consumers incentives to actually order products online.
5.4. Limitations
Despite the fact that this research has achieved its objectives, it is necessary to acknowledge its limitations. The recognition of these drawbacks is vital to give suggestions for future research.
Firstly, the sample size is small, of just 400 valid respondents. This is the consequence of the limited resources (time, money, human), and the research scope of only four districts in Ho Chi Minh City (District 1,3, 12, and Tan Binh). Such small sample size, along with the nonprobability sampling method, makes the research results not totally reflecting the actual E-commerce market of Ho Chi Minh City.
Secondly, there is limited secondary data and limited researches about E-commerce in Vietnam. Therefore, there are not enough reliable resources about the research objects in Vietnam’s E-commerce context as useful references. This is the reason why the study used secondary data mostly from resources studying foreign markets. Moreover, there are only few researches in the filed of Consumers’ Perceived Risks that have been dealt with properly so far.
Thirdly, since the study is not focused on any specific target groups of consumers or one specific product, the research’ findings are general. Therefore, the use of the research’s findings should be taken with caution.
Fourthly, the research only studies the impacts of Perceived Risk on Perceived Value and Purchase Intention in E-commerce with limited number of indicators. Besides, the authors do not consider the possible relationship between Perceived Value and Purchase Intention, due to the lack of time and resources.
Finally, due to the language limitations, the report could have some grammar or vocabulary mistakes in terms of English academic writing. In addition, owing to the limited research knowledge and qualifications, the authors have difficulties in interpreting and understanding fully the theoretical definitions of research objects as well as study’s results. Besides, this also leads to the only three components of Perceived Risks of the paper, with the possibility that if the authors had more research knowledge, there would be more components that create Perceived Risk.
5.5. Future Research
From the limitations of the study, the authors have some suggestions for future researches to achieve better results.
Firstly, to assure higher reliability for research models, the study should be conducted on a broader scale, for instance, nationally. In addition, more time, money, and human resources should be invested to conduct the research. On the other hand, survey respondents should include from other locations in Vietnam, not only in Ho Chi Minh City, so that the authors could get the more accurate insight of the consumers. The sample size and the sampling method should be probability, so that the results can better reflect the actual E-commerce market.
Secondly, future researches should use more researches studying E-commerce in Vietnam. The authors suggest that in the future, theoretical and empirical research within the field of risks should be focused more.
Thirdly, the future research should be directly relevant to one target group or one specific product, if the research objectives are to have more specific understanding or insights of smaller business in E-commerce.
Fourthly, researchers should expand the model with more indicators on Perceived Risks, Perceived Value, and Purchase Intention, and perhaps study the relationship between Perceived Value and Purchase Intention of consumers in Vietnamese E-commerce context.
the authors should invest more in English academic writing, to better interpret the research’s results.
Finally, the authors should improve research knowledge and qualifications, so that the research objects can be thoroughly understood and analyzed.
REFERENCES
Aaker, D. (2004). Marketing research. 1st ed. Hoboken, NJ: John Wiley and Sons, Inc.
Ajzen, I. and Fishbein, M. (1980). Understanding attitudes and predicting social behavior. 1st ed. Englewood Cliffs: Prentice-Hall.
Akaah, J.P., and Korgaonkar, P.K. (1988). A Conjoint Investigation of the Relative Importance of Risk Relievers in Direct Marketing. Journal of Advertising Research (August/September), pp.38–44.
American Management Association. (2017). [online] Available at: https://www.ama.org/ [Accessed 9 Mar. 2017].
Anderson, J. and Gerbing, D. (1988). Structural equation modeling in practice: A review and recommended two-step approach. Psychological Bulletin, 103(3), pp.411-423.
Applegate, L. M. (1999) Electronic commerce. In Richard, C. Dorf (Ed), the Technology Management Handbook. USA: CRC Press LLC, pp.22-30.
Arndt, J., Angelmar, R. and Hunt, S. (1983). Marketing Theory: The Philosophy of Marketing Science. Journal of Marketing, 47(4), p.145.
Ashton, A. and Scott, N. (2011). Hotel restaurant co-branding: The relationship of perceived brand fit with intention to purchase. Journal of Vacation Marketing, 17(4), pp.275-285.
Atkinson. J, (1964). Achievement Motivation Theory.
Bakos, J. (1991). A Strategic Analysis of Electronic Marketplaces. MIS Quarterly, 15(3), p.295.
Bizweb.vn. (2017). Những thông tin quan trọng về hành vi mua sắm trực tuyến của người tiêu dùng Việt Nam. [online] Available at: https://blog.bizweb.vn/nhung-thong-tin-quan-trong-ve-hanh-vi-mua-sam-truc-tuyen-cua-nguoi-tieu-dung-viet-nam/ [Accessed 14 Apr. 2017].
Bauer, R. A. (1960). Consumer behavior as risk taking. Chicago: American marketing association.
Bhatnagar, A., Misra, S. and Rao, H. (2000). On risk, convenience, and Internet shopping behavior. Communications of the ACM, 43(11), pp.98-105.
Bogdan, R. and Biklen, S. (1982). Qualitative research in education: An introduction to theory and methods.1st ed. Boston, MA: Allyn and Bacon.
Bonsón Ponte, E., Carvajal-Trujillo, E. and Escobar-Rodríguez, T. (2015). Influence of trust and Perceived Value on the intention to purchase travel online: Integrating the effects of assurance on trust antecedents. Tourism Management, 47, pp.286-302.
Borchers, A. (2001). Trust in Internet shopping: A test of a measurement instrument. In: The 7th Americas Conference on Information Systems.
Brooker, G., 1984. An Assessment of an Expanded Measure of Perceived Risk. Association for Consumer Research, Volume 11, pp.439-441.
Bughin, J., Corb, L., Manyika, J., Nottebohm, O., Chui, M., Barbat, B. and Said, R. (2011). The impact of Internet technologies: Search. McKinseyandCompany.
Burnett, J. (2008). Core Concepts of Marketing. 1st ed. Zurich: Jacobs Foundation.
Cases, A. (2002). Perceived Risk and risk-reduction strategies in Internet shopping. The International Review of Retail, Distribution and Consumer Research, 12(4), pp.375-394.
Celuch, K., Goodwin, S. and Taylor, S. (2007). Understanding small scale industrial user Internet purchase and information management intentions: A test of two attitude models. Industrial Marketing Management, 36(1), pp.109-120.
Chen, Y. and Barnes, S. (2007). Initial trust and online buyer behaviour. Industrial Management & Data Systems, 107(1), pp.21-36.
Chiu, C., Wang, E., Fang, Y. and Huang, H. (2012). Understanding consumers’ repeat Purchase Intentions in B2C E-commerce: the roles of utilitarian value, hedonic value and Perceived Risk. Information Systems Journal, 24(1), pp.85-114.
Comegys, C., Hannula, M., and Väisänen, J. (2009). Effects of consumer trust and risk on online purchase decision-making: A comparison of Finnish and United States students. International Journal of Management.
Cox, D. (1967). Risk handling in consumer behavior-an intensive study of two cases. 1st ed. Boston: Harvard University Press, pp.34-81.
Crespo, Á., del Bosque, I. and de los Salmones Sánchez, M. (2009). The influence of Perceived Risk on Internet shopping behavior: a multidimensional perspective. Journal of Risk Research, 12(2), pp.259-277.
Cunningham, S. M. (1967). The major dimension of Perceived Risk, Risk taking and information handling in consumer behavior. Boston: Harvard University Press, pp. 82-108.
de Magistris, T. and Gracia, A. (2008). The decision to buy organic food products in Southern Italy. British Food Journal, 110(9), pp.929-947.
Dissertation.laerd.com. (2017). Non-probability sampling | Lærd Dissertation. [online] Available at: http://dissertation.laerd.com/non-probability-sampling.php [Accessed 16 Mar. 2017].
Dowling, G. and Staelin, R. (1994). A Model of Perceived Risk and Intended Risk-Handling Activity. Journal of Consumer Research, 21(1), p.119.
Eastlick, M.A., and Feinberg, R.A. (1999). Shopping Motives for Mail Catalog Shopping. Journal of Business Research, 45(3), pp.281–290.
Ecommerce Foundation, 2016. Global B2C E-commerce Report 2016.
Emarketer, 2016. Worldwide Retail Ecommerce Sales Will Reach $1.915 Trillion This Year. Emarketer [online]. Available from: https://www.emarketer.com/Article/Worldwide-Retail-Ecommerce-Sales-Will-Reach-1915-Trillion-This-Year/1014369 [Accessed 27 February 2017].
Featherman, M. and Pavlou, P. (2003). Predicting e-services adoption: a Perceived Risk facets perspective. International Journal of Human-Computer Studies, 59(4), pp.451-474.
Feeny, D. (2001). Making Business Sense of the E-Opportunity. MIT Sloan Management Review, 42(2), pp.41-51.
Fellenstein, C. and Wood, R. (2000). Exploring E-commerce, global E-business, and E-societies. 1st ed. Upper Saddle River, N.J.: Prentice-Hall.
Fhssrsc.byu.edu. (2017). Data Types and Sources. [online] Available at: https://fhssrsc.byu.edu/Pages/Data.aspx [Accessed 15 Mar. 2017].
Fishbein, M., Ajzen, I., 1975. Belief, Attitude, Intention and Behavior: An Introduction to Theory and Research. Addison-Wesley, Reading, MA.
Forsythe, S. and Shi, B. (2003). Consumer patronage and risk perceptions in Internet shopping. Journal of Business Research, 56(11), pp.867-875.
Forsythe, S., Liu, C., Shannon, D. and Gardner, L. (2006). Development of a scale to measure the perceived benefits and risks of online shopping. Journal of Interactive Marketing, 20(2), pp.55-75.
Gefen, D. (2000). E-commerce: the role of familiarity and trust. Omega, 28(6), pp.725-737.
Gefen, D. and Straub, D. (2004). Consumer trust in B2C e-Commerce and the importance of social presence: experiments in e-Products and e-Services. Omega, 32(6), pp.407-424.
Goulding, C. (2002). Grounded theory. 1st ed. London: SAGE.
Grewal, D., Monroe, K. B., and Krishnan, R. (1998). The effects of price-comparison advertising on buyers’ perceptions of acquisition value, transaction value, and behavioral intentions. The Journal of Marketing, 62(2), pp.46-59.
Hair J., Black W. C., Babin B.J. (1998). Multivariate data analysis.
Hair, J., Celsi, M., Ortinau, D. and Bush, R. (2012). Essentials of marketing research. 3rd ed. New York, NY: McGraw-Hill Education.
Hair, J., Rolph, A. and Tatham, R. (1987). Multivariate data analysis. 2nd ed. New York: Macmillan.
Hair, J., Wolfinbarger, M. and Money, A. (2011). The Essentials of Business Research Methods. 2nd ed. New York: M.E. Sharpe, pp.34-56.
Hancock, R. (1981). Dynamic marketing for a changing world. 1st ed. Osaka: World Scholar Co.
Hansen, T., Møller Jensen, J. and Stubbe Solgaard, H. (2004). Predicting online grocery buying intention: a comparison of the theory of reasoned action and the theory of planned behavior. International Journal of Information Management, 24(6), pp.539-550.
Hartono, E., Holsapple, C., Kim, K., Na, K. and Simpson, J. (2014). Measuring perceived security in B2C electronic commerce website usage: A respecification and validation. Decision Support Systems, 62, pp.11-21.
Hoàng T. and Chu N.M.N. (2005). Phân tích dữ liệu nghiên cứu với SPSS. Nhà xuất bản thống kê.
Holbrook, M.B. (1996). Consumer value – a framework for analysis and research. Advances in Consumer Research, 23(1), pp.138–142.
Hornby, A., Deuter, M., Bradbery, J., Turnbull, J., Hey, L., Holloway, S., Hancock, M. and Ashby, M. (2015). Oxford advanced learner’s dictionary of current English. 1st ed. Oxford: Oxford University Press.
Hoyer, W., Pieters, R. and MacInnis, D. (2013). Consumer behavior. 6th ed. Mason, OH: South-Western Cengage Learning.
Hsu, C. and Lin, J. (2016). Effect of Perceived Value and social influences on mobile app stickiness and in-app Purchase Intention. Technological Forecasting and Social Change, 108, pp.42-53.
Hulland, J., Chow, Y. and Lam, S. (1996). Use of causal models in marketing research: A review. International Journal of Research in Marketing, 13(2), pp.181-197.
Ingene, C. A., and Hughes, M. A. (1985). Risk management by consumers. In Research in consumer behavior. ed. J. Sheth. Greenwich: JAI Press Inc.
Internetworldstats.com. (2017). Asia Internet Stats by Country and 2017 Population Statistics. [Online] Available at: http://www.internetworldstats.com/asia.htm#vn [Accessed 7 Mar. 2017].
Jacoby, J. and B. Kaplan, L. (1972). The Components of Perceived Risk. In: Proceedings of the Third Annual Conference of the Association for Consumer Research. [Online] Chicago: Association for Consumer Research, pp.382-393. Available at: http://www.acrwebsite.org/volumes/12016/volumes/sv02/SV-02 [Accessed 9 Mar. 2017].
Jalil, N., Fikry, A. and Zainuddin, A. (2016). The Impact of Store Atmospherics, Perceived Value, and Consumer Satisfaction on Behavioural Intention. Procedia Economics and Finance, 37, pp.538-544.
Jarvenpaa, S. and Todd, P. (1996). Consumer Reactions to Electronic Shopping on the World Wide Web. International Journal of Electronic Commerce, 1(2), pp.59-88.
Kaiser, H. (1974). An index of factorial simplicity. Psychometrika, 39(1), pp.31-36.
Kalakota, R. and Whinston, A. (1996). Frontiers of Electronic Commerce [Book Reviews]. IEEE Transactions on Components, Packaging, and Manufacturing Technology: Part C, 19(2), p.144.
Kim, D., Ferrin, D. and Rao, H. (2008). A trust-based consumer decision-making model in electronic commerce: The role of trust, Perceived Risk, and their antecedents. Decision Support Systems, 44(2), pp.544-564.
Ko, H., Jung, J., Kim, J. and Shim, S. (2004). Cross-Cultural Differences in Perceived Risk of Online Shopping. Journal of Interactive Advertising, 4(2), pp.20-29.
Korzaan, M. L. (2003). GOING WITH THE FLOW: PREDICTING ONLINE PURCHASE INTENTIONS. Journal Of Computer Information Systems, 43(4), p. 25.
Kotler, P. (2014). Kotler on marketing. 1st ed. Free Press.
Kotler, P. and Armstrong, G. (2004). Principles of marketing. 1st ed. Upper Saddle River: Pearson Education.
Kuester and Sabine (2012). MKT 301: Strategic Marketing & Marketing in Specific Industry Contexts. University of Mannheim, p.110.
Lee, D., Park, J., and Ahn, J. (2001). On the explanation of factors affecting E-commerce adoption. In: 22nd International Conference on Information Systems (ICIS 2001).
Lee, J. and Lee, J. (2013). How Purchase Intention consummates purchase behavior: the stochastic nature of product valuation in electronic commerce. Behavior & Information Technology, 34(1), pp.57-68.
Lee, K.S., and Tan, S.J. (2003). E-retailing Versus Physical Retailing: A Theoretical Model and Empirical Test of Consumer Choice. Journal of Business Research, 56(11), pp.877–885.
Leiner B. M., Cerf V. G., Clark D. D., Kahn R. E., Kleinrock L., Lynch D. C., Postel J., Roberts L. G., and Wolff S. (2009). Brief History of the Internet.
Levy, J. P., Valenciano, J., and Michal, T. (2009). Modeling distribution channel dynamics of North American cars in the Spanish automovile industry. International Advances in Economic Research, 15, pp.186-206.
Liebermann, Y. and Stashevsky, S. (2002). Perceived Risks as barriers to Internet and e‐commerce usage. Qualitative Market Research: An International Journal, 5(4), pp.291-300.
Lim, H. and Dubinsky, A. (2005). The theory of planned behavior in e-commerce: Making a case for interdependencies between salient beliefs. Psychology and Marketing, 22(10), pp.833-855.
Ling, K., Chai, L. and Piew, T. (2010). Investigating the Shopping Orientations on Online Purchase Intention in the e-Commerce Environment: A Malaysian Study. Journal Of Internet Banking and Commerce, 15(2), pp.1-22.
Ling, K., Chai, L. and Piew, T. (2010). The Effects of Shopping Orientations, Online Trust and Prior Online Purchase Experience toward Consumers’ Online Purchase Intention. International Business Research, 3(3), p.63.
Macintosh, G. (2002). Perceived Risk and outcome differences in multi-level service relationships. Journal of ServicesMarketing, Vol. 16 No. 2, pp. 143-57.
MBA Skool-Study.Learn.Share. (2017). Purchase Intention Definition | Marketing Dictionary | MBA Skool-Study.Learn.Share. [Online] Available at: http://www.mbaskool.com/business-concepts/marketing-and-strategy-terms/10976-purchase-intention.html [Accessed 9 Mar. 2017].
McCorkle, D. (1990). The role of Perceived Risk in mail order catalog shopping. Journal of Direct Marketing, 4(4), pp.26-35.
McIver, J. and Carmines, E. (1981). Unidimensional scaling. 1st ed. Newbury Park, Calif.: Sage Publications, p.24.
McMillan, M., Rodrik, D. and Verduzco-Gallo, Í. (2014). Globalization, Structural Change, and Productivity Growth, with an Update on Africa. World Development, 63, pp.11-32.
Mitchell, V. (1999). Consumer Perceived Risk: conceptualizations and models. European Journal of Marketing, 33(1/2), pp.163-195.
Moit.gov.vn. (2016). Thương mại điện tử thúc đẩy ngành dịch vụ bán lẻ. [Online] Available at: http://www.moit.gov.vn/vn/tin-tuc/8693/thuong-mai-dien-tu-thuc-day-nganh-dich-vu-ban-le.aspx [Accessed 13 Mar. 2017].
Newberry, C., Klemz, B. and Boshoff, C. (2003). Managerial implications of predicting purchase behavior from Purchase Intentions: a retail patronage case study. Journal of Services Marketing, 17(6), pp.609-620.
Nunnally, J. and Bernstein, I. (2010). Psychometric theory. 1st ed. New Delhi: Tata McGraw-Hill Ed.
Oxford Dictionaries | English. (2017). culture – definition of culture in English | Oxford Dictionaries. [online] Available at: http://www.oxforddictionaries.com/definition/english/culture [Accessed 16 Mar. 2017].
Oxfordreference.com. (2017). Judgmental sampling – Oxford Reference. [online] Available at: http://www.oxfordreference.com/view/10.1093/oi/authority.20110803100026339 [Accessed 16 Mar. 2017].
Pallab, P. (1996). Marketing on the Internet. Journal of Consumer Marketing.
Perreault, W., McCarthy, E., Cannon, J. and Perreault, W. (2010). Learning aid for Essentials of marketing. 1st ed. New York, NY.: McGraw-Hill.
Peter, J. and Ryan, M. (1976). An Investigation of Perceived Risk at the Brand Level. Journal of Marketing Research, 13(2), p.184.
Peter, J. and Tarpey, Sr., L. (1975). A Comparative Analysis of Three Consumer Decision Strategies. Journal of Consumer Research, 2(1), p.29.
Peterson, R.A., Albaum, G., and Ridgway, N.M. (1989). Consumers Who Buy from Direct Sales Companies. Journal of Retailing, 65(2), pp.273–288.
Piccoli, G., Brohman, M. K., Watson, R. T., and Parasuraman, A. (2004). Net‐Based Consumer Service Systems: Evolution and Revolution in Web Site Functionalities. Decision Sciences, 35(3), pp.423-455.
Quintal, V. and Phau, I. (2014). Examining Consumer Risk Perceptions of Prototypical Brands versus Me-Too Brands. Journal of Promotion Management, 20(2), pp.115-135.
Ray, S., Ow, T., and Kim, S. S. (2011). Security assurance: how online service providers can influence security control perceptions and gain trust. Decision Sciences, 42(2), pp.391-412.
Robert E. Kahn and Vinton G. Cerf. (1999). What Is The Internet (And What Makes It Work).
Rodgers, W. (1969). Consumer behavior as risk taking; a new model and new hypotheses. 1st Ed.
Roger Clarke (2000). Electronic Commerce Definitions.
Roselius, T. (1971). Consumer Rankings of Risk Reduction Methods. Journal of Marketing, 35(1), p.56. Scott, J. (2004). Measuring dimensions of perceived e-business risks. Information Systems and e-Business Management, 2(1).
Salisbury, W., Pearson, R., Pearson, A. and Miller, D. (2001). Perceived security and World Wide Web Purchase Intention. Industrial Management & Data Systems, 101(4), pp.165-177.
Senecal, S. (2000). Stopping variables in online buying processes: An innovation diffusion approach. In: The 6th Americas Conference on Information Systems (AMCIS 2000).
Slater, S. and Narver, J. (2000). Intelligence Generation and Superior Consumer Value. Journal of the Academy of Marketing Science, 28(1), pp.120-127.
Snoj, B. and Gabrijan, V. (2000). Osnove marketinga, zbrano gradivo. Maribor: University of Maribor.
Snoj, B., Korda, A. P. and Mumel, D. (2004). The relationships among perceived quality, Perceived Risk and perceived product value. Journal of Product and Brand Management, 13(3), pp.156-167.
Statistics How To. (2017). Purposive Sampling (Deliberate Sampling). [online] Available at: http://www.statisticshowto.com/purposive-sampling/ [Accessed 16 Mar. 2017].
Steenkamp, J. and van Trijp, H. (1991). The use of LISREL in validating marketing constructs. International Journal of Research in Marketing, 8(4), pp.283-299.
Steiger, J. (1990). Structural Model Evaluation and Modification: An Interval Estimation Approach. Multivariate Behavioral Research, 25(2), pp.173-180.
Stone, R. and Gronhaug, K. (1993). Perceived Risk: Further Considerations for the Marketing Discipline. European Journal of Marketing, 27(3), pp.39-50.
Talk Vietnam. (2016). Potential of e-commerce market remains untapped. [online] Available at: https://www.talkvietnam.com/2016/02/potential-of-e-commerce-market-remains-untapped/ [Accessed 8 Mar. 2017].
Tan, S.J. (1999). Strategies for Reducing Consumers’ Risk Aversion in Internet shopping. The Journal of Consumer Marketing, 16(2), pp.163–178.
Teo, T. S. (2001). Demographic and motivation variables associated with Internet usage activities. Internet Research, 11(2), pp.125-137.
Thai, N. (2017). Các khái niệm trong Marketing | Quantri.vn. [online] Quantri.vn. Available at: http://quantri.vn/dict/details/9493-cac-khai-niem-trong-marketing [Accessed 9 Mar. 2017].
Turban, E., King, D., Lee, J., Liang, T., Turban, D. and Lang, J. (2013). Electronic commerce 2012. 1st ed. Boston: Pearson.
Ulaga, W. (2001). Consumer Value in Business Markets. Industrial Marketing Management, 30(4), pp.315-319.
Ulaga, W. and Chacour, S. (2001). Measuring consumer Perceived Value in business markets. Industrial Marketing Management, Vol. 30, pp. 525-40.
Ulrike Schultze, 2002. Self-Serve Internet Technology And Social Embeddedness: Balancing Rationalization And Relationships. Cox School of Business, Southern Methodist University.
UNCTAD, (2001). E-commerce And Development Report 2001. [Online] Available at: http://unctad.org/en/Docs/ecdr2001overview_en.pdf [Accessed 9 Mar. 2017].
Van den Poel, D., and Leunis, J. (1999). Consumer Acceptance of the Internet as a Channel of Distribution. Journal of Business Research, 45(3), pp.249–256.
VECITA (2013). 18 triệu người Việt đang mua sắm Online. Doanh Nhân Sài Gòn [Online]. Available from: http://www.doanhnhansaigon.vn/thuong-mai-dien-tu/infographic-18-trieu-nguoi-viet-dang-mua-sam-online/1077678/ [Access 22 November 2016].
VECITA (2014). Báo cáo Thương mại Điện tử Việt Nam [online]. Available from: http://www.moit.gov.vn/Images/editor/files/Yenngth/Bao%20cao%20TM%C4%90T%20Viet%20Nam%202013_final.pdf [Accessed 22 November 2016].
VECOM. (2015). Báo cáo chỉ số Thương mại Điện tử Việt Nam [online]. Available from: http://www.vecita.gov.vn/anpham/229/Bao-cao-Chi-so-thuong-mai-dien-tu–2014 [Accessed 22 November 2016].
VECOM. (2017). Chỉ số thương mại điện tử Việt Nam 2017. Vietnam E-Commerce Association.
vietnamnews.vn. (2015). Firms should invest in e-commerce. [online] Available at: http://vietnamnews.vn/economy/268923/firms-should-invest-in-e-commerce.html#16pEmBaF0h4MxhWG.97 [Accessed 8 Mar. 2017].
Vladimir, Z. (1996). Electronic Commerce: Structures and Issues. International Journal of Electronic Commerce, 1(1), pp.3-23.
Whitlar, D.B., Geurts, M.D., Swenson, M.J. (1993). New product forecasting with a Purchase Intention survey. The Journal of Business Forecasting Methods Systems and Systems, 12 (3), pp.1-18.
Woodruff, R. B. (1997). Consumer Value: The Next Source for Competitive Advantage. Journal of the Academy of Marketing Science, 25(2), pp.139-53.
Woodruff, R. B., and Gardial, S. F. (1996). Know Your Consumer: New Approaches To Understanding Consumer Value And Satisfaction. Cambridge, MA: Blackwell.
Woodruff, R.B., Schumann, D.W. and Gardial, S.F. (1993). Understanding value and satisfaction from the consumer’s point of view. Survey of Business, Vol. 29 No. 1, pp. 33-41.
Woodside, A. and Wilson, E. (2003). Case study research methods for theory building. Journal of Business & Industrial Marketing, 18(6/7), pp.493-508.
World Wide Web Foundation. (2017). History of the Web. [Online] Available at: http://webfoundation.org/about/vision/history-of-the-web/ [Accessed 8 Mar. 2017].
Zeithaml, V. (1988). Consumer Perceptions of Price, Quality, and Value: A Means-End Model and Synthesis of Evidence. Journal of Marketing, 52(3), p.2.
Zeithaml, V., Berry, L. and Parasuraman, A. (1996). The Behavioral Consequences of Service Quality. Journal of Marketing, 60(2), p.31.
Zeithaml, V.A., Berry, L.L. and Parasuraman, A. (1990). Delivering Quality Service. New York: The Free Press.
Zwass, V. (1996). Editorial Introduction. Journal of Management Information Systems, 12(4), pp.3-4.
Hair, J., Wolfinbarger, M., Ortinau, D. and Bush, R. (2010). Essentials of marketing research. 2nd ed. New York, NY: Mcgraw-Hill/ Irwin.
Materials Science & Engineering. (2017). Electronic Materials and Devices. [online] Available at: https://www.iitk.ac.in/mse/electronic-materials-and-devices [Accessed 6 Apr. 2017].
Rotenberg, M., Tian, B., Menciassi, A., Bradley, D., Guénault, A., Gunnarsson, D., Haley, R., Holt, S., Jones, A., Pashkin, Y., Penttilä, J., Prance, J., Prunnila, M., Roschier, L., Dufouleur, J., Veyrat, L., Dassonneville, B., Xypakis, E., Bardarson, J., Nowka, C., Hampel, S., Schumann, J., Eichler, B., Schmidt, O., Büchner, B., Giraud, R., Boyn, S., Grollier, J., Lecerf, G., Xu, B., Locatelli, N., Fusil, S., Girod, S., Carrétéro, C., Garcia, K., Xavier, S., Tomas, J., Bellaiche, L., Bibes, M., Barthélémy, A., Saïghi, S., Garcia, V., Yabuta, H., Tanaka, H., Furuta, T., Watanabe, T., Kubota, M., Matsuda, T., Ifuku, T., Yoneda, Y., Shin, S., Ji, S., Choi, S., Pyo, K., An, B., Park, J., Kim, J., Kim, J., Lee, K., Kwon, S., Heo, J., Park, B., Park, J., Liu, Z., Zhang, Y., Liu, G., Ding, B., Liu, E., Jafri, H., Hou, Z., Wang, W., Ma, X., Wu, G., Pacchioni, G., Rotenberg, M., Tian, B., Kim, J., Ghaffari, R., Kim, D., Menciassi, A. and Prando, G. (2017). Electronic devices – Latest research and news | Nature. [online] Nature.com. Available at: http://www.nature.com/subjects/electronic-devices [Accessed 6 Apr. 2017].
Reference. (2017). What is a list of electronic devices?. [online] Available at: https://www.reference.com/technology/list-electronic-devices-cf7abed0209780c9 [Accessed 6 Apr. 2017].
Easterby-Smith, M., Thorpe, R. and Jackson, P. (2008) Management Research: An Introduction (3rd edn). London: Sage.
Ghauri, P. and Gronhaug, K. (2010) Research Methods in Business Studies: A Practical Guide (4th edn). Harlow: FT Prentice Hall.
Krueger, R.A. and Casey, M.A. (2009) Focus Group: A Practical Guide for Applied Research (4th edn). Thousand Oaks, CA: Sage.
Robson, C. (2011) Real World Research: A Resource for Users of Social Research Methods in Applied Settings (3rd edn). Chichester: John Wiley.
Neuman, W.L. (2005) Social Research Methods (6th edn). London: Pearson.
Hair, J., Rolph, A. and Tatham, R. (1987), Multivariate Data Analysis, 2nd ed., Macmillan, New York, NY.
JF Hair, WC Black, BJ Babin (1998), Multivariate data analysis .
Kaiser, H. F. (1974). An index of factorial simplicity. Psychometrika
Hoàng T. and Chu N.M.N., 2005, Phân tích dữ liệu nghiên cứu với SPSS, Nhà xuất bản thống kê.
Nunnally, J. C., & Bernstein, I. H. (1994). Psychometric theory (3rd ed.). New York: McGraw Hill
Steiger, James H. 1990 “Structural model evaluation and modification: An interval estimation approach.” Multivariate behavioral research
Steenkamp, Jan-Benedict EM, and Hans CM Van Trijp. 1991 “The use of LISREL in validating marketing constructs.” International Journal of Research in marketing
McIver, John, and Edward G. Carmines. 1981 Unidimensional scaling. No. 24. Sage, 1981.
Anderson, James C., and David W. Gerbing. 1988 “Structural equation modeling in practice: A review and recommended two-step approach.” Psychological bulletin
Hulland, John, Yiu Ho Chow, and Shunyin Lam. 1996 “Use of causal models in marketing research: A review.” International Journal of Research in Marketing
Burnett, J. (2008). Core Concepts of Marketing. 1st ed. Zurich
Thai, N. (2017). Các khái niệm trong Marketing | Quantri.vn. [online] Quantri.vn. Available at: http://quantri.vn/dict/details/9493-cac-khai-niem-trong-marketing [Accessed 9 Mar. 2017].
Edmund Jerome McCarthy. Learning Aid for Essentials of Marketing. McGraw-Hill, 2010.
Morgan, R.M. and Hunt, S.D., 1994. The commitment-trust theory of relationship marketing. The journal of marketing, pp.20-38.
Spearman, C., 1904. ” General Intelligence,” Objectively Determined and Measured. The American Journal of Psychology, 15(2), pp.201-292.
Cronbach, L.J., 1951. Coefficient alpha and the internal structure of tests. psychometrika, 16(3), pp.297-334.
Meyers, L., Gamst, G. and Guarino, A. (2013). Performing data analysis using IBM SPSS®. 1st ed. New Jersey: John Wiley & Sons, Inc.
Anderson, J.C. and Gerbing, D.W., 1988. Structural equation modeling in practice: A review and recommended two-step approach. Psychological bulletin, 103(3), p.411.
Schumacher, R.E. and Lomax, R.G., 1996. A beginner’s guide to SEM. Mahwah, NJ: Lawrence.
Lowengart, O. & Tractinskky, N. (2001). Differential effects of product category on shoppers. selection of web-based stores: a probabilistic modeling approach. Journal of Electronic Commerce Research 2(4), 12-26.
Statista. (2016). e-Commerce – Vietnam | Statista Market Forecast. [online] Available at: https://www.statista.com/outlook/243/127/e-commerce/vietnam [Accessed 6 Apr. 2017].
Hair, J., Rolph, A. and Tatham, R. (1987), Multivariate Data Analysis, 2nd ed., Macmillan, New York, NY.
JF Hair, WC Black, BJ Babin (1998), Multivariate data analysis .
Kaiser, H. F. (1974). An index of factorial simplicity. Psychometrika
Hoàng T. and Chu N.M.N., 2005, Phân tích dữ liệu nghiên cứu với SPSS, Nhà xuất bản thống kê.
Nunnally, J. C., & Bernstein, I. H. (1994). Psychometric theory (3rd ed.). New York: McGraw Hill
Steiger, James H. 1990 “Structural model evaluation and modification: An interval estimation approach.” Multivariate behavioral research
Steenkamp, Jan-Benedict EM, and Hans CM Van Trijp. 1991 “The use of LISREL in validating marketing constructs.” International Journal of Research in marketing
McIver, John, and Edward G. Carmines. 1981 Unidimensional scaling. No. 24. Sage, 1981.
Anderson, James C., and David W. Gerbing. 1988 “Structural equation modeling in practice: A review and recommended two-step approach.” Psychological bulletin
Hulland, John, Yiu Ho Chow, and Shunyin Lam. 1996 “Use of causal models in marketing research: A review.” International Journal of Research in Marketing
Burnett, J. (2008). Core Concepts of Marketing. 1st ed. Zurich
Thai, N. (2017). Các khái niệm trong Marketing | Quantri.vn. [online] Quantri.vn. Available at: http://quantri.vn/dict/details/9493-cac-khai-niem-trong-marketing [Accessed 9 Mar. 2017].
Edmund Jerome McCarthy. Learning Aid for Essentials of Marketing. McGraw-Hill, 2010.
Morgan, R.M. and Hunt, S.D., 1994. The commitment-trust theory of relationship marketing. The journal of marketing, pp.20-38.
Spearman, C., 1904. ” General Intelligence,” Objectively Determined and Measured. The American Journal of Psychology, 15(2), pp.201-292.
Cronbach, L.J., 1951. Coefficient alpha and the internal structure of tests. psychometrika, 16(3), pp.297-334.
Meyers, L., Gamst, G. and Guarino, A. (2013). Performing data analysis using IBM SPSS®. 1st ed. New Jersey: John Wiley & Sons, Inc.
Anderson, J.C. and Gerbing, D.W., 1988. Structural equation modeling in practice: A review and recommended two-step approach. Psychological bulletin, 103(3), p.411.
Schumacher, R.E. and Lomax, R.G., 1996. A beginner’s guide to SEM. Mahwah, NJ: Lawrence.
Meyers, L., Gamst, G. and Guarino, A. (2013). Performing data analysis using IBM SPSS(R). 1st ed. New Jersey: John Wiley & Sons.
Welch, B. Li. “On the z-test in randomized blocks and Latin squares.” Biometrika 29.1/2 (1937): 21-52.
Nguyễn, M. (2017). Thương mại điện tử Việt Nam: Tiềm năng và thách thức. [online] Congly.vn. Available at: http://congly.vn/kinh-doanh/doanh-nghiep/thuong-mai-dien-tu-viet-nam-tiem-nang-va-thach-thuc-199096.html [Accessed 14 Apr. 2017].
Hair, J., Rolph, A. and Tatham, R. (1987), Multivariate Data Analysis, 2nd ed., Macmillan, New York, NY.
JF Hair, WC Black, BJ Babin (1998), Multivariate data analysis .
Kaiser, H. F. (1974). An index of factorial simplicity. Psychometrika
Hoàng T. and Chu N.M.N., 2005, Phân tích dữ liệu nghiên cứu với SPSS, Nhà xuất bản thống kê.
Nunnally, J. C., & Bernstein, I. H. (1994). Psychometric theory (3rd ed.). New York: McGraw Hill
Steiger, James H. 1990 “Structural model evaluation and modification: An interval estimation approach.” Multivariate behavioral research
Steenkamp, Jan-Benedict EM, and Hans CM Van Trijp. 1991 “The use of LISREL in validating marketing constructs.” International Journal of Research in marketing
McIver, John, and Edward G. Carmines. 1981 Unidimensional scaling. No. 24. Sage, 1981.
Anderson, James C., and David W. Gerbing. 1988 “Structural equation modeling in practice: A review and recommended two-step approach.” Psychological bulletin
Hulland, John, Yiu Ho Chow, and Shunyin Lam. 1996 “Use of causal models in marketing research: A review.” International Journal of Research in Marketing
Burnett, J. (2008). Core Concepts of Marketing. 1st ed. Zurich
Thai, N. (2017). Các khái niệm trong Marketing | Quantri.vn. [online] Quantri.vn. Available at: http://quantri.vn/dict/details/9493-cac-khai-niem-trong-marketing [Accessed 9 Mar. 2017].
Edmund Jerome McCarthy. Learning Aid for Essentials of Marketing. McGraw-Hill, 2010.
Morgan, R.M. and Hunt, S.D., 1994. The commitment-trust theory of relationship marketing. The journal of marketing, pp.20-38.
Spearman, C., 1904. ” General Intelligence,” Objectively Determined and Measured. The American Journal of Psychology, 15(2), pp.201-292.
Cronbach, L.J., 1951. Coefficient alpha and the internal structure of tests. psychometrika, 16(3), pp.297-334.
Meyers, L., Gamst, G. and Guarino, A. (2013). Performing data analysis using IBM SPSS®. 1st ed. New Jersey: John Wiley & Sons, Inc.
Anderson, J.C. and Gerbing, D.W., 1988. Structural equation modeling in practice: A review and recommended two-step approach. Psychological bulletin, 103(3), p.411.
Schumacher, R.E. and Lomax, R.G., 1996. A beginner’s guide to SEM. Mahwah, NJ: Lawrence.
Meyers, L., Gamst, G. and Guarino, A. (2013). Performing data analysis using IBM SPSS(R). 1st ed. New Jersey: John Wiley & Sons.
Welch, B. Li. “On the z-test in randomized blocks and Latin squares.” Biometrika 29.1/2 (1937): 21-52.
Nguyen, M. (2017). Thương mại điện tử Việt Nam: Tiềm năng và thách thức. [online] Congly.vn. Available at: http://congly.vn/kinh-doanh/doanh-nghiep/thuong-mai-dien-tu-viet-nam-tiem-nang-va-thach-thuc-199096.html [Accessed 13 Apr. 2017].
Kautzky-Willer, A., Harreiter, J., & Pacini, G. (2016). Sex and Gender Differences in Risk, Pathophysiology and Complications of Type 2 Diabetes Mellitus. Endocrine Reviews, 37(3), 278–316. http://doi.org/10.1210/er.2015-1137
Báo Công an nhân dân điện tử. (2016). Trò lừa núp danh “thương mại điện tử”. [online] Available at: http://antg.cand.com.vn/Ho-so-Interpol/Tro-lua-nup-danh-thuong-mai-dien-tu-396611/ [Accessed 14 Apr. 2017].
Nhandan.com.vn. (2016). Cảnh giác với tội phạm thương mại điện tử. [online] Available at: http://www.nhandan.com.vn/phapluat/thoi-su-phap-luat/item/29996802-canh-giac-voi-toi-pham-thuong-mai-dien-tu.html [Accessed 14 Apr. 2017].
Baocongthuong. (2015). Tràn lan thương mại điện tử lừa đảo | Chính sách – Pháp luật. [online] Available at: http://baocongthuong.com.vn/tran-lan-thuong-mai-dien-tu-lua-dao.html [Accessed 14 Apr. 2017].
VECOM, (2017). Chi So Thuong Mai Dien Tu Viet Nam 2017. 1st ed. Ha Noi City: VECOM.
APPENDICES
Appendix 4: Pilot Test’s Analysis Results
i. Cronbach’s Alpha test of the scales
PRP

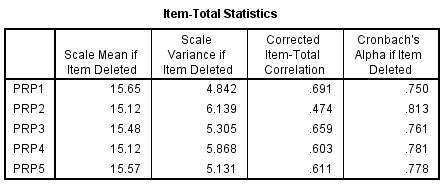
PRT

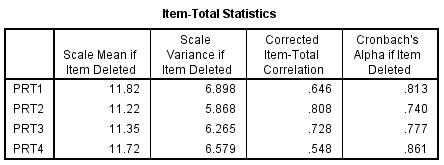
PSR

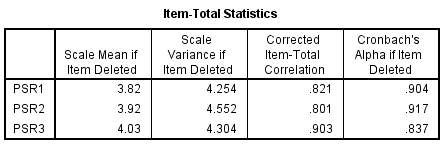
PV

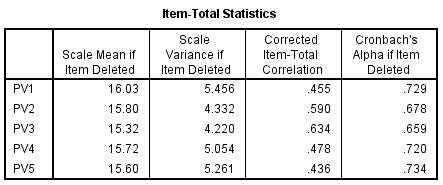

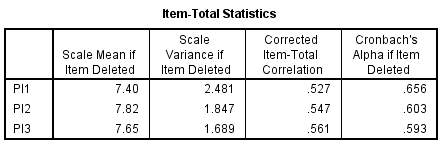
ii. EFA of Perceived Risk scales

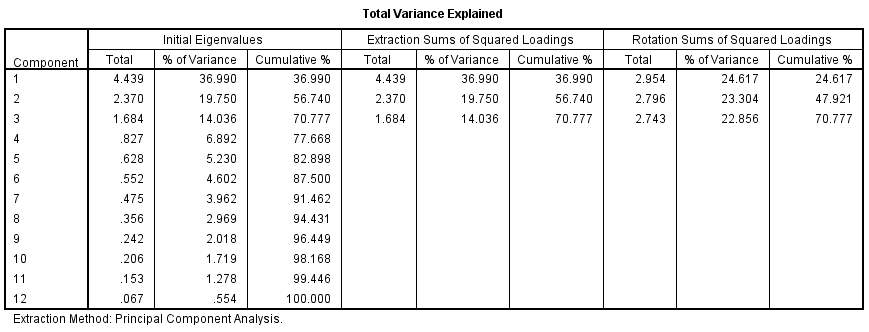
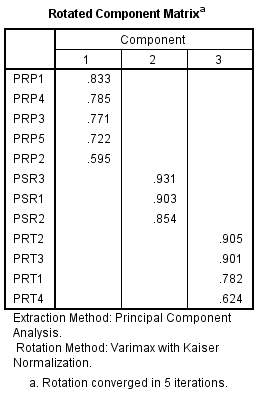
iii. EFA of Perceived Value and Purchase Intention
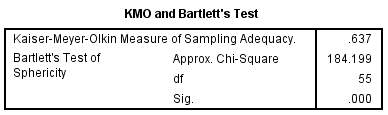
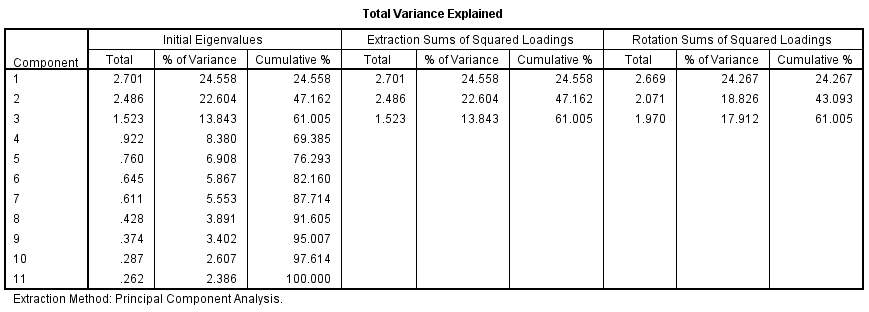
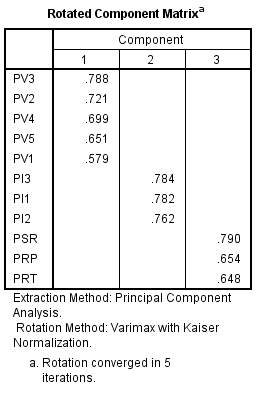
Appendix 5: Official Analysis Results
i. Frequency table of sample
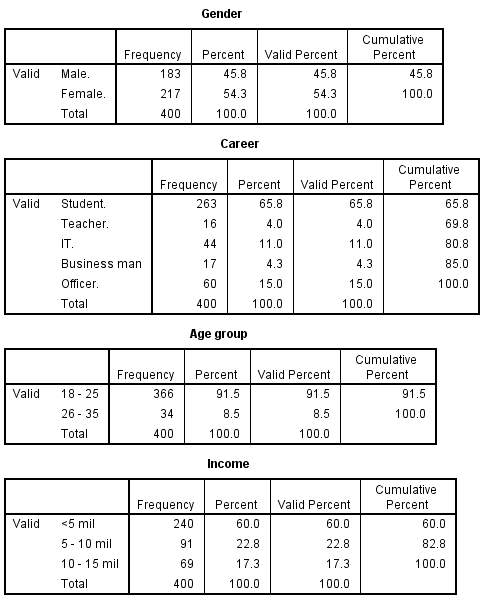
ii. Sample distribution by age group and income
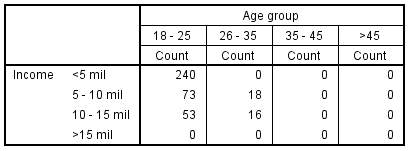
iii. Sample distribution by gender and career
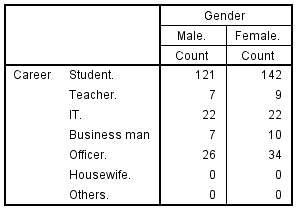
iv. Cronbach’s Alpha of the research factors
PRP
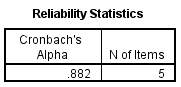
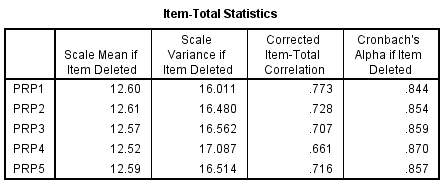
PRT

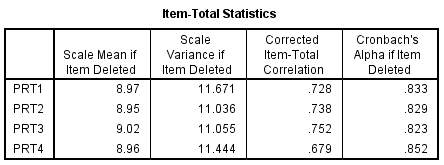
PSR


PV first time

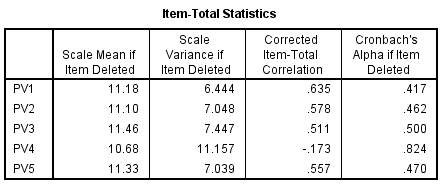
PV without PV4

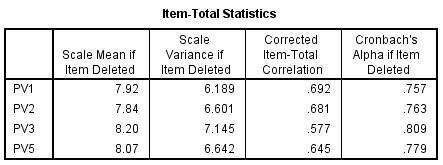
PI
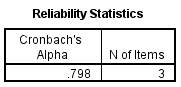
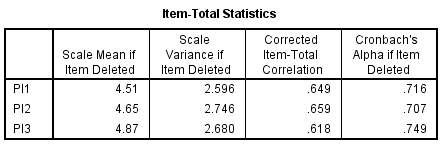
v. Means of the scales
PRP
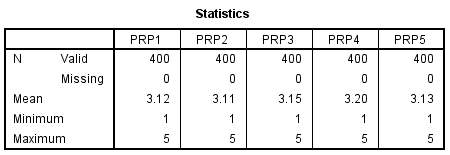
PRT
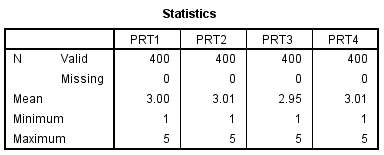
PSR
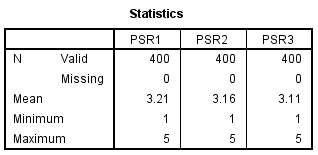
PV
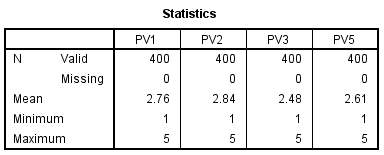
PI
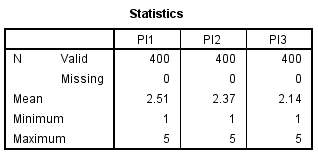
vi. EFA test of the Perceived Risk’s scales
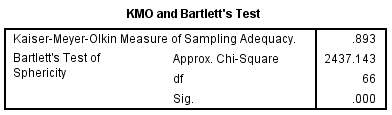
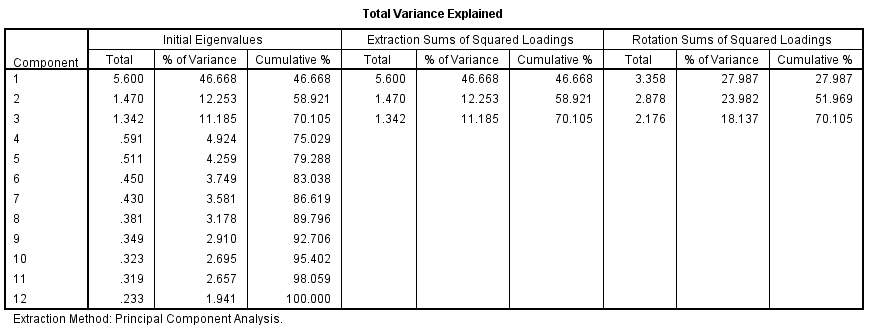
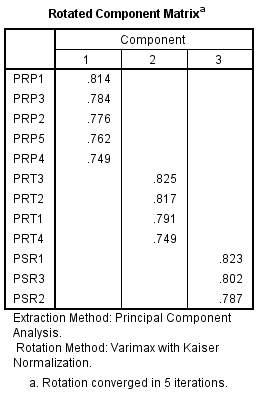
vii. EFA test of the Perceived Risk, Perceived Value and Purchase Intention scales
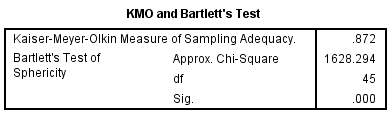
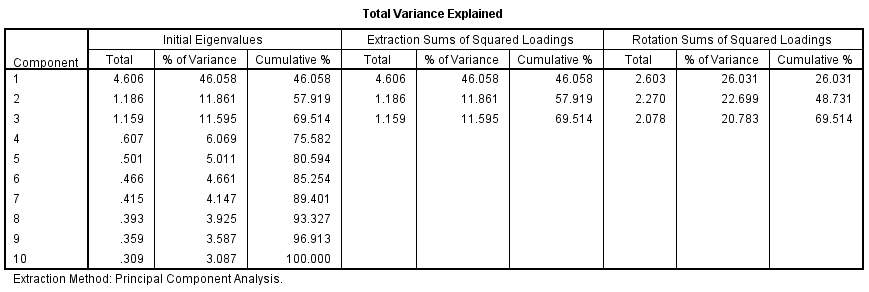
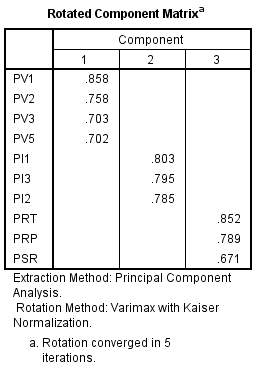
viii. T-Test of Perceived Risk related to Gender
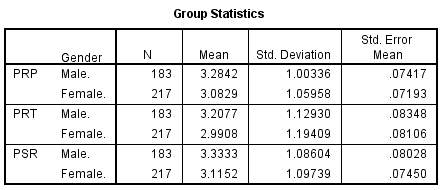
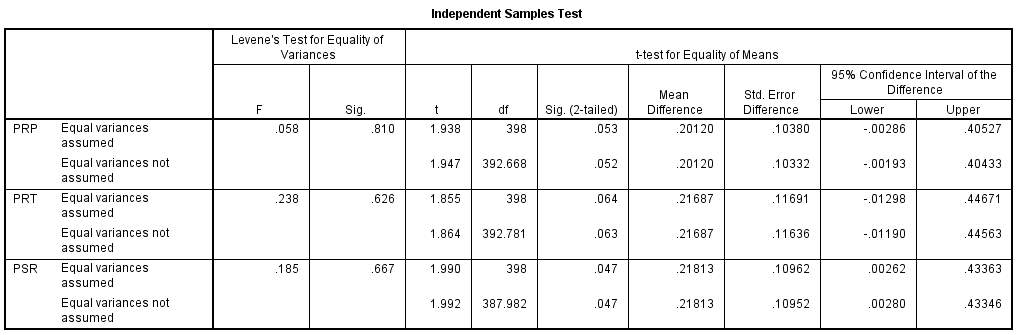
ix. Hypothesis results
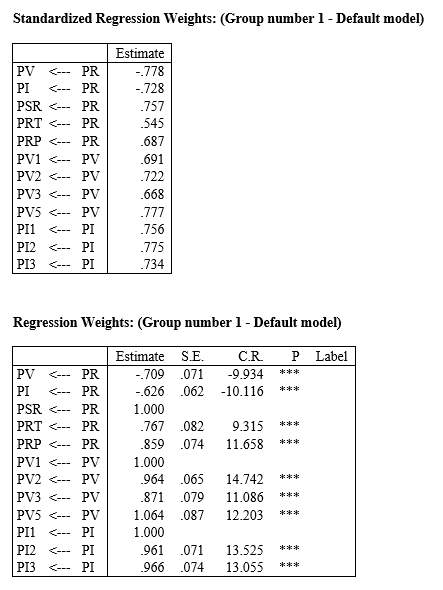
x. Bootstrap results
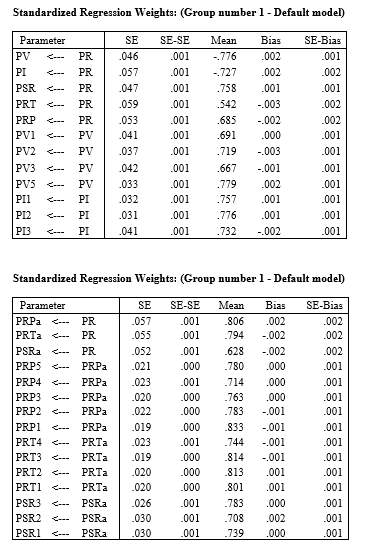
Cite This Work
To export a reference to this article please select a referencing stye below:
Related Services
View all


Related Content
All TagsContent relating to: "E-commerce"
E-commerce is process of buying and selling goods or services online. Some businesses only operate through E-commerce, whilst others have both E-commerce and physical stores to sell their products or services.
Related Articles

DMCA / Removal Request
If you are the original writer of this dissertation and no longer wish to have your work published on the UKDiss.com website then please: