Spatio-temporal Variation in Rainfall-Runoff Erosivity Due to Climate Change in the Lower Niger Basin, West Africa
Info: 10231 words (41 pages) Dissertation
Published: 18th Feb 2022
Tagged: GeographyClimate Change
Abstract
Spatio-temporal variation in rainfall-runoff erosivity resulting from changes in rainfall characteristics due to climate change could have severe consequences on soil and water. Understanding past and future variation in Rainfall-runoff erosivity and its implication, in tropical areas where there are limited continuous daily rainfall records, is important. The present study;
(i) quantified the nature of spatio-temporal variability of erosivity from rainfall amount using Global Circulation Models (GCMs), and
(ii) evaluated the implications of changes in rainfall-runoff erosivity in the Lower Niger Basin, West Africa.
The GCMs scenarios (GFDLCM3, HADCM2, MIROC5, MPIESMLR) were statistically downscaled using the delta method for three-time slices (the 2030s, 2050s and 2070s). The world climate data was used as the current baseline climate since it is the source of the future precipitation simulation. The R factor from the Revised Silo loss equation (RUSLE) was used to determine erosivity, while the RUSLE model was used to ascertain the implications of changes in erosivity
Observation data (1970-2013) from 20 meteorological stations were used to validate the Erosivity model. The result indicates that there is an increasing trend in the annual rainfall-runoff erosivity from the baseline climate up to the GCMs, showing an average change in rainfall-runoff erosivity of about 15.3%, 19.6%, and 25% for the 2030s, 2040s and 2070s respectively. There was a concomitant increase in soil loss of 0.065%, 4.5% and 9.5% from the baseline for the 2030s, 2040s and 2060s respectively. Higher precipitation amounts were the major drivers that increased the spatial and temporal rainfall-runoff erosivity. More studies should be performed to include other important factors that exacerbate increases in erosivity, especially future changes in land use.
The result of this paper can guide soil and water conservationists and stakeholders in developing proper management and mitigation strategies to combat rainfall and runoff-erosivity induced soil loss in the study area.
Keywords: Rainfall-runoff erosivity; Global Circulation Models; RUSLE, Soil Erosion, Niger-basin; Climate Change
1. Introduction
The effects of increased rainfall-runoff erosivity resulting to increased soil erosion are critical issues in many basins across the globe (Angulo-Martinez, et al., 2012; Mondal et al., 2016; Nearing, 2001; Smithen and Schulze, 1982; Vrieling et al., 2014). Rainfall-runoff erosivity is one of the most important factors of soil erosion by water because it is related to the climatic parameter of rainfall (Yang, 2003; Plangoen et al., 2013). Being the erosive force of rainfall, rainfall-runoff erosivity involves the detachment of soil particles by the kinetic energy from falling raindrops, and the transport through surface runoff.
This phenomenon has been demonstrated by Wischmeier (1968) with a raindrops-particle detachment relationship proposed by Govers (1991) and became the most commonly used index for quantifying rainfall erosivity used in the Universal Soil Loss Equation (USLE) (Wischmeier and Smith, 1978) or its Revised-RUSLE (Renard et al.,1997). Erosivity which depends on raindrops, intensity and duration of rainfall does not have a linear relationship with rainfall (Salles et al., 2002). High-magnitude rainstorm events have some degree of control over rainfall erosivity (González-Hidalgo et al., 2009) and may increase with high rainfall intensities. Doetterl et al. (2012) reported that rainfall erosivity together with slope gradient explains about 75% of erosion variability. These factors represent triggers for runoff and soil erosion due to changes in precipitation (Nearing et al., 2005).
Climate change may determine the nature of rainfall through the alteration of trends and patterns of rainfall. The climatic parameter of rainfall can be used to detect the trends in rainfall-runoff erosivity using the past and future climatic data (Gupta and Kumar, 2017; Nearing, 2011, Zhang et al., 2010; Panagos et al., 2017a, Sun et al., 2002) and quantifying the effects of past and future climate-induced rainfall-runoff erosivity is important in identifying key areas prone to erosion under changing climate. Change in erosivity has been directly linked to climate change effects on soil erosion (Nearing et al., 2004; Zhang et al., 2005) because erosivity rates are expected to change in response to climate change.
Different general circulation models (GCMs) have predicted the future states of global rainfall and temperature with increases in rainfall intensity (IPCC, 2001). It has been reported that precipitation is expected to increase by 1.2-2.4% by 2030s under different Representative Concentration Pathways (RCPs) scenarios and by 3.5—11.3% by 2080s (Gupta and Kumar, 2017). Precipitation projections over West Africa are for the most part less predictable with extensive inter-model ranges for seasonal means rainfall responses (IPCC, 2007). These irregularities are somewhat clarified by the failure of GCMs to replicate the systems responsible for precipitation (Lebel et al., 2000), and partly by model confinement in simulating the diverse teleconnections and feedback mechanisms responsible for rainfall fluctuation in Africa (Ardoin-Bardin et al., 2009).
However, despite the fact that these GCMs are flawed, they are effective tools that account for unpredictable processes which will create future climate change (Ardoin-Bardin et al., 2009). The use of GCMs have revealed that changes in climate patterns of rainfall will impact soil erosion through several pathways, including rainfall-runoff erosivity changes (Plangoen et al., 2013). Several studies have investigated, in isolation, changes in erosivity (Biasutti and Seager, 2015; García-Ruiz et al., 2015; Teng et al., 2016; Wen et al., 2015; Zhang et al., 2010) and a combined study of erosivity and soil erosion (Litschert et at., 2014; Segura et al., 2014; Yang et al., 2003, Yang et al., 2015) in different parts of the world using GCMs.
Globally, there is variation in rainfall pattern both in time and space with expected increases in rainfall amounts in the tropics and subtropics. In the tropics, studies (Yang, 2003, Almagro et al., 2017) have shown that the most important factor that is of direct relevance to erosivity studies is rainfall. And that rainfall has been varying both in amount and intensities which can affect soil erosion and by extension, water resources and agriculture. Separate researches by Salako (1995) and Panagos (2017b) have shown that the tropical climate, with its high rainfall intensity, has the highest mean erosivity. Vrieling et al., (2014) has evaluated the importance of the spatial and temporal variability of rainfall erosivity across Africa using the R factor in the RUSLE.
The power at which soil particles are detached, and carried by rain can be determined by changes in erosivity due to increased rainfall. Since a relationship has been established between rainfall characteristics and erosivity, an understanding of the spatio-temporal variability of rainfall erosivity is important to decipher whether the decreasing or increasing trend in rainfall amounts (climate change), for the past and future climates in the tropics and Subtropics (IPCC, 2007), has implications for rainfall erosivity. Precipitation from long-term data is needed to understand changes in erosivity and land degradation through soil erosion which are useful for understanding hydrological processes in any given basin.
Climate change is expected to impact erosivity in the lower Niger basin and other parts of the world. Temporal and spatial prediction of future rainfall-runoff erosivity under changing climate have not been well documented in the lower Niger-basin. The evaluation of rainfall erosivity and its implication can help practitioners and scientist for better soil conservation practices, dam construction and agricultural management.
Therefore, the objectives of this study were to (i) quantify the nature of spatio-temporal variability of erosivity from rainfall amount using World climate data and predicted rainfall from different GCMs (GFDLCM3, HADCM2, MIROC5, and MPIESMLR) for RCP 2.6 and 8.5 scenarios respectively, and (ii) evaluate the implications of changes in rainfall-runoff erosivity.
2. Site Description
With a length of 4,200 km, the Niger Basin houses the third longest river in Africa. It stretches from the mountains of Guinea through the Sahara Desert to the Gulf of Guinea, located between the meridians of 11°30′ W and 15° 00′ E and between the parallels of 22°00′ N and 5°00′ N. The Basin occupies areas with different climatic characteristics. The river is divided into four sub-basins due to different hydrological and topographical features; the Upper, the Central Delta, the Middle and the Lower Niger Basins. Leaving the fringes of Niger, the river passes through Benin and enters Nigeria, where it is joined by several tributaries and exits in Cameroon.
The present research concentrates on the lower Niger basin. The lower Niger basin covers about 528,000 km2: 81% in Nigeria, 12% in Cameroon and 7% in the Benin Republic. The basin is located in different climatic zones, as it passes through the Savannas (Sudan, Guinea, Derived), to the humid forest then exits the freshwater ecosystem. The rainfall varies spatially (Figure 1a) within the basin with the lowest annual rainfall decreasing northwards to the Sudanian zone with an annual rainfall averaging 750m to over 2000 mm for a period of 5 to 7 months. Positioned between the equator and the Tropic of Cancer, the area is largely warm or hot, though the high mountains and the Sahara Desert encounter outrageous temperatures (Andersen and Golitzen, 2005). The annual mean temperature ranges from 21°– 28°C along the coast while it fluctuates between 12°–29°C inland towards the north, according to the prevailing season. It is characterized by the climatic conditions related to the movement of air masses of the Intertropical Convergence Zone (ITCZ). In the Lower Niger Basin, rainfed agriculture (Figure 1b) is the predominant source of livelihood
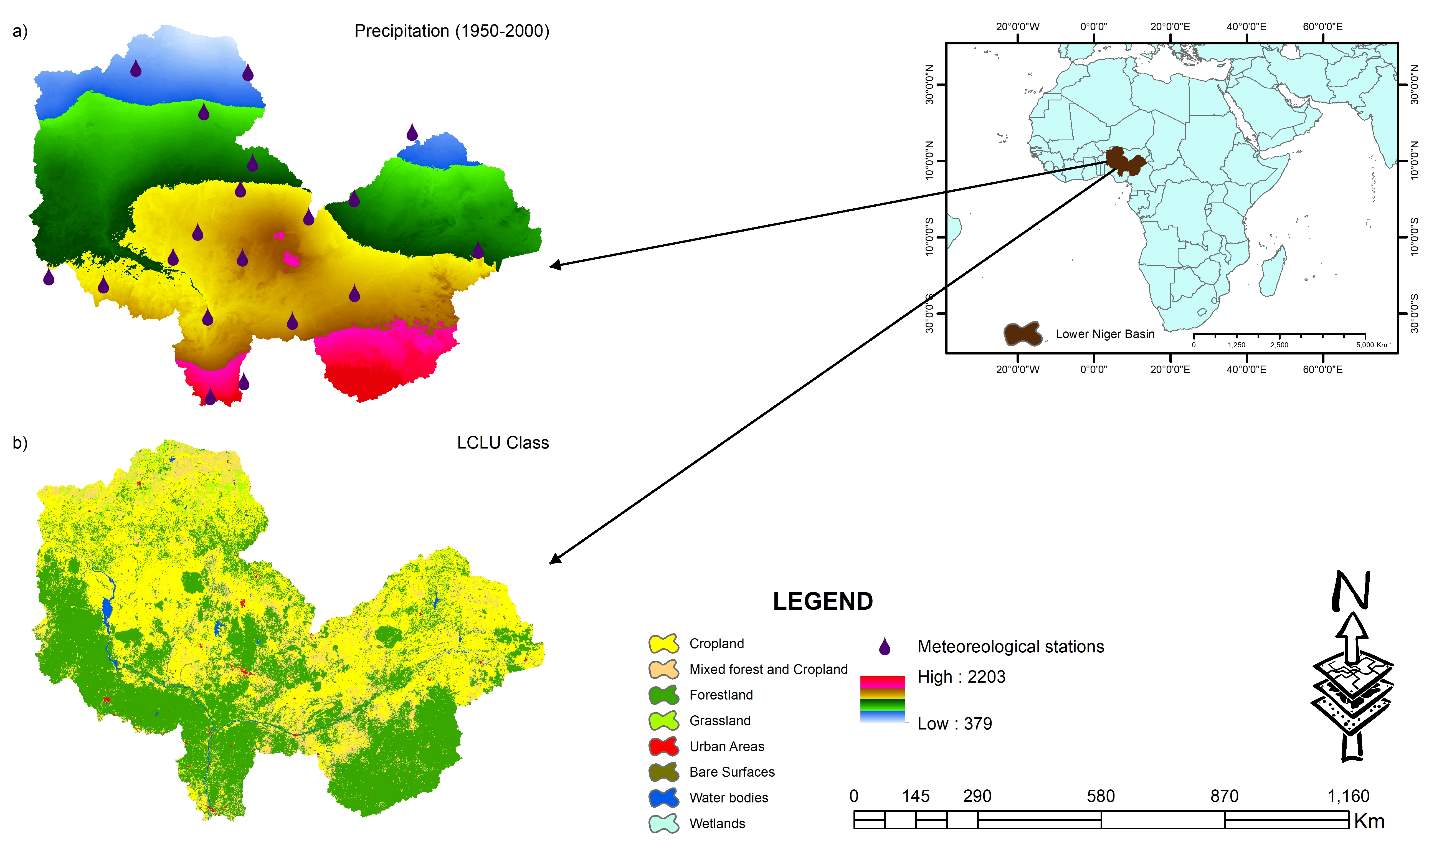
Figure 1. Study area (a) average annual precipitation 1950-2000 from world climate data (b) Landuse landcover classes
3. Materials and methods
3.1 Global climatic data
Compared to the CMIP3, the CMIP5 is a significant model improvement and utilises a new set of emission scenarios referred to as RCPs (Gang et al., 2015). Global climate data from 4 GCMs (table1) under the RCP2.6 and RCP8.5 scenarios were used (Taylor et al., 2012). The GCM were selected because of its (a) relative independence and good performance in precipitation (Knutti et al., 2013; Yan et al., 2015); (b) representativeness of the broader range of models and (c) satisfactory performance for the African continent (McSweeney et al., 2015).
In the evaluation of the future changes in rainfall erosivity and possible implications, projected climate data (precipitation), for the 2030s (2020-2039), 2050s (2040-2069), and 2070s (2060-2099) were obtained from the International Center for Tropical Agriculture climate change (CIAT)[1] portal, statistically downscaled to a 30 arc-second (1km2) horizontal resolution using the delta method (Ramirez-Villegas and Jarvis 2010). The delta data, with respect to the baseline climate, WorldClim 2.0, were used to derive daily and monthly precipitation. Anomalies were then interpolated using a thin plate spline interpolation technique (Ramirez-Villegas and Jarvis 2010). These datasets, for monthly precipitation, were used as input data for this research.
Table 1. Global Climate Models (GCMs)
| Model | Abbreviation | Institution |
| GFDLCM3 (RCP 2.6) | GFDLCM3-2.6 | Geophysical Fluid Dynamics Laboratory, NOAA |
| GFDLCM3 (RCP 8.5) | GFDLCM3-8.5 | |
| HADCM2 (RCP 2.6) | HADCM2-2.6 | Met Office Centre, UK |
| HADCM2 (RCP 8.5) | HADCM2-8.5 | |
| MIROC5 (RCP 2.6) | MIROC5-2.6 | CCSR/NIES/FRCGC, Japan |
| MIROC5 (RCP 8.5) | MIROC5-8.5 | |
| MPIESMLR RCP 2.6) | MPIESMLR-2.6 | Max Planck Institute for Meteorology, Germany |
| MPIESMLR (RCP 8.5) | MPIESMLR-8.5 | |
3.2 Changes in Rainfall-Runoff Erosivity
To better understand the implications of the changes in the rainfall runoff erosivity, R factor from the Revised Universal Soil Loss Equation (RUSLE) was used and integrated into Arc GIS 10.4. This models soil loss with contributing rainfall-runoff erosivity for each pixel of the grid and also for groups of pixels into homogenous polygons (Plangeon et al., 2013), based on several criteria as described in the equation:
Aij=Rij*Kij*LSij*Cij*Pij (1)
Where A is the annual computed soil loss per unit area, (ton ha-1 y-1) of the grid located at (i,j); R is the rainfall-runoff erosivity factor (MJ mm ha-1 h-1 y-1); K is the soil erodibility factor (ton ha MJ-1 mm-1); LS is the average topographical parameter, L is the slope length factor, S is the slope gradient factor; C is the cover and management factor; and P is support practice factor (Renard et al., 1997). LS, C and P are dimensionless (Litschert et al., 2014). To understand how changes in rainfall-runoff erosivity due to climate change affects soil erosion, rainfall-runoff erosivity was calculated using the precipitation values of the gridded GCMs comparing it with the World climate (1950-2000) as explained below.
3.2.1 Rainfall-Runoff Erosivity (R)
Rainfall-runoff erosivity was originally derived from rainfall amount and intensity; this is the product of the kinetic energy and intensity from rainfall events as described by Renard et al., (1971) and Wischemeier and Smith (1978) in the form of:
R=1n×∑j=1n∑k=1mEk(I30)k (2)
Where n is the number of years of the record, m is the number of storms in each year, E is the total storm kinetic energy (MJ ha-1), I30 is the maximum 30 minutes intensity of rainfall (mm h-1), j is an index of number of years used for the average, and k is the index of the number of storms in each year.
The information needed to calculate rainfall-runoff erosivity using the equations described above is usually not available on a large spatial scale even in remote areas (Naipal et al., 2015). As a result, many researchers (e.g. Arnoldus, 1977; Renard and Freimund, 1994) has sorted out the best way to derive rainfall-runoff erosivity. The derivation of R has been proposed using the modified Fournier index (F) (Arnoldus, 1977; Fournier, 1960) or average annual precipitation (P) (Renard and Freimund, 1994; Nearing 2001) when only monthly precipitation data is available. In the tropics, the transformation of the Fournier index may give a spurious result (karamage et al., 2016), rainfall-runoff has been determined using the average annual precipitation as derived by Renard and Freimund (1994).
R=0.04830P1.610 P
R=587.8-1.219P+0.004105P2 P>850 (4)
Where R is rainfall-runoff erosivity and P is the average annual precipitation. Reinhard and Freimund (1994) recommended using equation 3 when P is P is > 850 mm. The data used to derive R is gridded world climate data (here after referred to as baseline climate) of precipitation and the GCMs. This is because it is more coherent to use the world climate data as the current climate (baseline) since the output of the four GCMs used in this study are biased corrected based on the baseline climate data. To ascertain the validity of the derivation of R, based on the data used, mean monthly rainfall and average annual precipitation (1970-2013) derived from daily precipitation (here after referred to as observation data) of 20 meteorological stations were collected from Nigerian meteorological society (NIMET).
Using the coordinates of this stations, precipitation (mm) from the baseline climate data (1950-2000) and that of observation data were transferred to R statistical package to derive the Rainfall-runoff erosivity for each of the data set. The performance of the rainfall-runoff erosivity model was assessed by root mean square error (RMSE), Nash-Sutcliffe coefficient (NASH) and correlation coefficient (CC) (Mondal et al., 2016; Nash and Suchliffe, 1970) shown in equation 5, 6, and 7 respectively. They were used to compare R for observation and base data statistically.
RMSE=∑i=1nxobs,i-ypre,i2n (5)
NASH=∑i=1nxobs,i-ypre,i2∑i=1nxobs,i-y̅pre,i2 (6)
CC=∑i=1nxobs,i- x̅obs × ypre,i- y̅pre∑i=1nxobs,i- x̅obs2 × ∑i=1nypre,i- y̅pre2 (7)
Where xobs is observed values and ypre is predicted rainfall-runoff erosivity at place i. The calculated RMSE values will have the same units as the R values. A small value of the RMSE indicates less discrepancy within the observed and predicted series, and therefore provides better accuracy with prediction. NASH values range from −∞to 1. Between observed and predicted rain-runoff erosivity, the value of 1 will mean a perfect match. The CC is +1 in the case of a perfect increasing linear relationship, and -1 in case of a decreasing linear relationship. NASH and CC with higher values indicate better predictive accuracy. After determining the validity of the model, rainfall-runoff erosivity was then calculated using the ArcGIS software where the gridded GCMs where used as input files to determine future changes in R language.
3.2.2 Soil Erodibility (K factor)
Soil erodibility is the measure of the susceptibility of soil particles to detachment due to its soil properties. K-factor was estimated using sand, clay, silt and soil organic matter compiled by Food and Agricultural Organisation (FAO, 1998)[2] using the equation proposed by William (1995). The soil map is developed with a 5-min resolution using the FAO/UNESCO soil classification, and soil properties are derived corresponding to each soil type. The topsoil (0-30cm) texture and organic matter content are used to determine the K factor.
KUSLE=fcsand∙fcl-sl∙forgc∙fhisand (8)
where
fcsand is a factor, that lowers the K indicator in soils with high coarse-sand content and higher for soils with little sand;
fcl-sl gives low soil erodibility factors for soils with high clay-to-silt ratios;
forgc reduces K values in soils with high organic carbon content, while
fhisand lowers K values for soils with extremely high sand content. The factors are calculated:
fcsand=0.2+0.3∙exp-0.256∙ms∙(1-msilt100 (8a)
fcl-sl=msiltmc+msilt0.3 (8b)
forgc=1-0.0256∙orgCorgC+exp3.72-2.95∙orgC (8c)
fhisand=1-0.7∙1-ms1001-ms100+exp-5.51+22.9∙1-ms100 (8d)
where
ms is the percent sand content (0.05-2.00 mm diameter particles),
msilt is the percent silt content (
orgC is the percent organic content of the layer (%)
3.2.3 Topographic factor (LS)
Topographic factor represents the product of slope length (L) and steepness (S) factor. It describes the effect of topography on soil erosion and has a high value if the length and slope of terrain are more. If the length and steepness of slope are more, the erosion will be high and vice versa. It can be estimated through field measurements or can be derived from digital elevation model (DEM). LS equation has been developed to generate topographic actor map based on DEM (Moore and Wilson 1992). LS factor was estimated from the Shuttle Radar Topography Mission (SRTM), 30m resolution) provided by National Aeronautics and Space Administration (NASA)[3]. The spatial analyst tool of ArcMap 10.4 was used to derive the L and S values of each pixel using the algorithm in equation 9 (L factor) developed by Desmet and Govers (1996) and equation 10 (S factor) using McCool et al. (1987) method.
Li.jAi.j-in+D2m+1-Ai.j-inm+1Dm+2∙xi.jm∙22.13m (9)
m=β1+β (9a)
β=Sin θ/0.08963Sin θ0.8+0.56 (9b)
Si.j= 10.8sinθi.j+0.03,tan θi.j
Where
i.j are grid cell with coordinates;
Li.j is the slope length factor; D is the grid cell size (m);
xi.j=sin ai.j+cosi.j;
ai.j= aspect direction;
Ai.j is the contributing area at the inlet (m2). The slope-length exponent m is related to the ratio of rill erosion (caused by flow) to interrill erosion;
β is the ratio of rill to interrill erosion for conditions when the soil is moderately susceptible to both rill and interrill erosion;
θ is the slope angle in degrees (Litschert et al., 2014; Renard et al., 1997)
3.2.4 Cover Management factor (C factor)
Cover Management factor is the ratio of soil land cultivated under specified conditions to the equivalent loss from tilled, continuous fallow land (Wischmeier and Smith,1978). In this study, vegetation index derived from remote sensing data such as NDVI was used to account for the variation in vegetation density and condition (Reusing et al., 2000; Lin et al., 2006); since the landcover/landuse types were not used to assign vegetation variation density and condition (Gupta and Kumar, 2017). MODIS biweekly mean NDVI provided by the National Aeronautics and Space Administration (NASA)[4] for the rainy seasons (April–October, 2016) computed with equation 11 (Zhou et al., 2008), were used in this study.
C=exp-αNDVIβ-NDVI (11)
Where
α=2 and
β=1 are unitless parameters that determine the shape of the curve relating to NDVI (NDVI-C curve) (Gupta and Kumar 2017; Van der Knijff et al.,2000)
3.2.5 Support Practice (P factor)
The P-factor is the soil-loss ratio with a specific conservation practice to the corresponding soil loss (Renard et al.,1991), with practices such as contouring, strip-cropping and terracing (Wischmeier and Smith,1978). It accounts for how surface conditions influence flow paths and flow hydraulics (Fagbohun, 2016). As there are no major erosion support practices used in the area, the P-factor was assigned values based on different types of land cover as given by Yang et al., (2003) (Table 2). These values have also been used by several researchers (e.g. Park et al., 2011). The LU/LC were observed and verified for proper classification during a field survey, and this information was used for properly classifying the LU/LC classes for the area, the P values were assigned accordingly.
To identify the area that is most affected by changes in past and future rainfall-runoff erosivity with regards to soil erosion, R, K, LS, C, and P factors have been multiplied using the R factor of different time periods. All data were resampled to a 1km cell size of the gridded GCMs before use in RUSLE calculation. After generation of all the input factors of RUSLE, the quantitative output was computed on a pixel-by-pixel basis in ArcGIS 10.4.
Table 2. P values assigned to various Land use /Land cover types
| LU/LC Types | P-factor Yang et al. (2003) | Area(ha) | Area (%) |
| Cropland | 0.5 | 25233439 | 42.91 |
| Forestland | 1 | 25103383 | 42.69 |
| Grassland | 1 | 1052273 | 1.79 |
| Mixed forest and Cropland | 0.8 | 6666963 | 11.34 |
| Urban Areas | 1 | 202459 | 0.35 |
| Bare Surfaces | 1 | 11275 | 0.019 |
| Water bodies | 1 | 521587 | 0.887 |
| Wetland | 1 | 12087 | 0.021 |
4. Results and Discussion
4.1 Rainfall-runoff erosivity under past and future
The simulated (world climate) and the observed precipitation (1970-2013) were statistically and visually compared to summarize the strength with which the simulated world climate data (1950-2000) can reproduce the spatial pattern of mean and annual precipitation. Taylor diagram (Figure 3) was used to demonstrate the quality of the stimulated against the observed data set for all the 20 stations. The correlation of precipitation with the observation is almost 0.97, and the standard deviation is very close to the observed standard deviation. Based on this, it can be concluded that the simulated baseline precipitation represents that of the observation well and are good enough in reproducing present and future precipitation condition. Figure 2a-c represents the average monthly precipitation cycle for the baseline period (1950-2000) and all the projections. Importantly, there was an increase in precipitation from January which peaked in August or September. This was followed by a significant fall in precipitation down to December. Table 3 shows the rainfall-runoff erosivity (R)for the Observation data for the 20 meteorological stations and the R-factor for the baseline data from the same station. It is evident that there is more monthly average precipitation from all the GCMs under the RCP 2.6 and 8.5 scenarios output than in the baseline period from July to October.
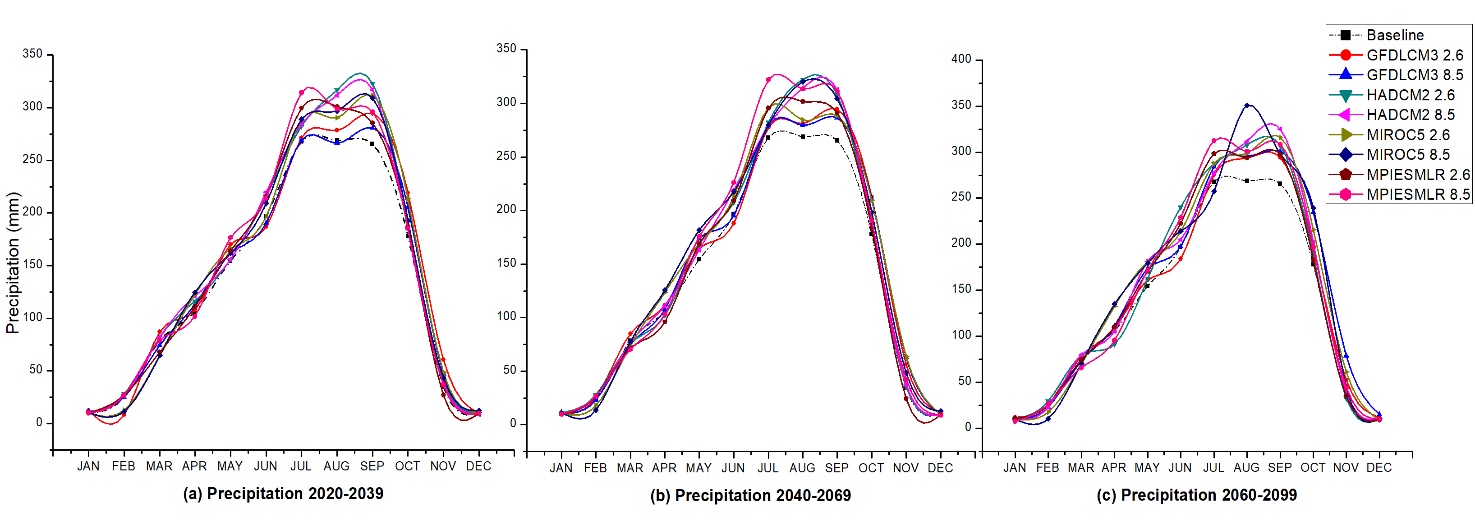
Figure 2: Average monthly precipitation (a-c) for the baseline climate and all climate projections
The precipitation peak range for all climate projection is 266.5-317 mm in the 2030s (2020-3039), 269-322.5 mm in the 2050s (2040-2069), and 269-350.8 mm in the 2070s (2060-2099) for August. Also, it is 265.5-323 mm in the 2030s (2020-3039), 265.5-315 mm in the 2050s (2040-2069), and 265.5-325 mm in the 2070s (2060-2099) for September. The average monthly precipitation was not used to determine monthly erosivity because the equation applied for this study was not designed to use the monthly precipitation for that purpose. It has been observed that changes in monthly rainfall-runoff erosivity are not unidirectional for all time periods (Plangoen et al., 2013). As a result, inter-annual variability in precipitation has been averaged (P) (Table 2 and 3) for determining the rainfall-runoff erosivity using equation 3 and 4. This mathematical model was used to estimate R for each meteorological station for the observation, baseline data and the gridded GCMs. The impact of climate change on rainfall-runoff erosivity can be expressed by changes in total rainfall. The decrease in total precipitation and the indices representing rainfall aggressiveness should not be interpreted as a decrease in rainfall-runoff erosivity because the process of soil erosion is not only linked to rainfall-runoff erosivity but also to the dynamics of vegetation, soil properties and surface geomorphology.
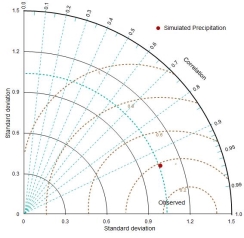
Figure 3: Taylor Diagram for Precipitation
Average annual R for the observation data ranges from 1249-12609 Mj. mm. ha-1 h-1 yr-1 for Katsina and Onitsha stations respectively (Table 3). The baseline data shows an R range of 1255-12593 Mj. mm. ha-1 h-1 yr-1 in Katsina and Onitsha stations respectively. Smithens and Schulze (1982) have reported 12800 Mj. mm. ha-1 h-1 yr-1 rainfall-runoff erosivity in Enugu (Nsuka), which is not too different from the result in this study. The rainfall-runoff erosivity of the observation data was compared with that of the baseline data using the RMSE, CC and NASH; since the baseline data was used to generate the GCMs outputs. This was done to ensure that the use of GCMs output data will be good enough to determine the erosivity of the lower Niger basin accurately. Table 2 exemplifies the validation between the Rainfall-runoff erosivity derived from the observation data and that determined from the base data. The validation reflects the strength of correlation between Robserved and Rbaseline values of 0.96; it indicates a good correlation between the variables. RMSE gives the standard deviation of the model prediction error. The RMSE is the square root of the variance of the residuals. It indicates the absolute fit of the model to the data, i.e. how close the observed data points are to the model’s predicted values. A smaller value indicates better model performance. A low RMSE of 613.4 Mj. mm. ha-1 h-1 yr-1 for R compared to the highest and lowest values of observed and baseline precipitation indicates a good model performance for predicting rainfall-runoff erosivity for the past and future climate. The NASH coefficient of 0.95 indicates a good predictive performance for rainfall-runoff erosivity within the basin because the value is tending towards 1.
The precipitation data of the baseline climate and the downscaled GCMs output were used to calculate the average annual precipitation. Because the current GCMs output does not come with the rainfall-runoff erosivity, the relationship between P and R can be used to derive annual erosivity (Renard and Fremund, 1994; Nearing, 2001). This procedure was utilised to estimate R under future and past climate based on GCMs and World climate data. GCM output has been used for the derivation of rainfall-runoff erosivity and ultimately soil erosion within hydrological models.
Table 3: Rainfall-runoff erosivity for Baseline and Observation data
| Baseline data (1950-2000) | Observation data (1970-2013) | ||||||
| Yelwa | 3998 | Bida | 4756 | Yelwa | 3244 | Bida | 4616 |
| Sokoto | 1262 | Minna | 5114 | Sokoto | 1487 | Minna | 5234 |
| Gusau | 2365 | Abuja | 6542 | Gusau | 2953 | Abuja | 7048 |
| Kaduna | 5062 | Jos | 5388 | Kaduna | 5047 | Jos | 5614 |
| Katsina | 1255 | Ibi | 5837 | Katsina | 1249 | Ibi | 3982 |
| Zaria | 3775 | Yola | 3998 | Zaria | 4072 | Yola | 2744 |
| Bauchi | 3935 | Lokoja | 4840 | Bauchi | 3837 | Lokoja | 5818 |
| Pokistum | 1402 | Onitsha | 12593 | Pokistum | 1552 | Onitsha | 12609 |
| Ilorin | 4689 | Enugu | 11039 | Ilorin | 4934 | Enugu | 11098 |
| Shaki | 4623 | Makurdi | 6093 | Shaki | 4814 | Makurdi | 5146 |
| Validation | CC | RMSE | NASH | ||||
| 0.96 | 613.4 | 0.95 | |||||
NB: R for baseline and observation data are measured in Mj. mm. ha-1 h-1 yr-1 including the RMSE value
The predicted annual rainfall erosivity values from the four GCM projections were compared with those calculated using the gridded monthly rainfall data from World climate for the baseline period (1950-2000). Rainfall erosivity values calculated from the four GCMs member ensembles vary spatially for the RCP 2.6 and 8.5 (Figure 2) compared with the results from the gridded monthly baseline data (Figure 3a).
The result did not show a particular trend with regards to increase or decrease as the time periods increases. Rather the trend is synonymous with the trend in average annual precipitation where a reduction in average annual precipitation shows a reduction in average annual rainfall-runoff erosivity within the basin and vice versa. For instance, GFDLCM3 RCP 2.6 and 8.5 scenarios for all time slices show a greater temporal variation of rainfall-runoff erosivity when the average annual precipitation is high. The MIROC5 for the both RCPs show more rainfall-runoff erosivity probably because of the high predicted spatial precipitation with this ensemble.
Spatially, for all the GCMs and baseline climate, the rainfall-runoff erosivity is higher to the south of the basin but lower to the North of the basin. This erosivity pattern is due to the dryer climate to the North (Sudan Savanna) compared to the wetter Guinea savanna in South of the basin. Average annual rainfall erosivity ranges from about 250–33,481 MJ. mm. ha−1 h−1 from the arid/semi-arid tropics to the very humid tropics (Hoyos et al. 2005), because of the high rainfall intensities and amounts experienced within this ecological zone of > 2000mm. The Guinea savanna within the lower Niger basin has rainfall occurring for up to 7 months during the rainy season with more than 1200mm annual rainfall as opposed to its Sudanian counterpart with rainfall limited to about 3 months during rainy season having an annual rainfall as low as 300 mm. Erosivity will be influenced by variation in the pattern of rainfall pattern and amount due to climate change. This could be caused by a reduction of rain-days and increase in rainfall intensities falling with erosive power during days of fewer rainfall (Salako, 2008).
The study area is within the zone that experiences high rainfall amount and variation in rain intensities, variation in the pattern of erosivity are likely to follow the direction of rain intensities and amounts. Therefore, if the path of rainfall is high in intensities and amounts, rainfall erosivity will increase
Table 4 shows the impact of precipitation on past and future rainfall-runoff erosivity in the lower Niger basin. The GCMs under two emission scenarios (RCP2.6 and RCP8.5) were downscaled and used to represent changes in future climate for rainfall-runoff erosivity calculation and subsequently future soil loss modelling. The result reveals the average annual precipitation and rainfall-runoff erosivity. The ensembles show that precipitation and rainfall-runoff erosivity increase significantly from the baseline across all the ensembles.
The average of all the ensembles reveals that precipitation increased during the 2030s, 2050s and 2070s to 1593 mm,1630mm and 1652mm respectively from the baseline (1482mm). However, the MIRO5 (the 2070s, RCP 2.6) has projected a higher rise in precipitation than the rest of the ensembles with same scenario and period. The future rainfall generated for different scenarios is illustrated well in table 4 for all ensembles. There is also an average increase in rainfall-runoff erosivity for the 2030s, 2050s and 2070s of about 4806, 4983 and 5211 Mj.mm.ha-1 h-1 yr-1respectively.
Table 4: Average annual precipitation and Rainfall-runoff erosivity for the past and future climate
The precipitation and rainfall-runoff erosivity vary across individual GCM without showing a steady increase or decline, while the average annual precipitation and the average annual erosivity shows a steady rise across all the ensembles put together. It has been argued, however, that it is the timing of precipitation and the amount of daily precipitation intensity rather than just the average annual precipitation amount that controls the degree at which rainfall-runoff erosivity and by extension, erosion responds to changes in climate (Plangoen, et al., 2013). Meanwhile, Segura et al. (2014) evaluated the changes in rainfall-runoff erosivity under nine climatic projections for three emission scenarios (A2, A1B, and B1) and found that thevalues would increase with time according to all the projections considered between 1970 and 2090. Changes in the erosive power of rainfall in response to climate change may affect rainfall-runoff erosivity behaviour. It may also vary due to change in frequency and intensity of precipitation, temperature and land use/land cover (Beniston, 2006; Mondal et al., 2016). Nearing (2001) reported that rainfall-runoff erosivity is changing and is likely to increase from 16% to 58% in the current (2000-2019) to future (2080-2090) climates respectively. Research has shown that future precipitation will intensify and the most influencing factor will be the power at which rainfall erodes soil (Nearing, 2001; Pruski and Nearing, 2002). It has shown from the result that the power of rain is a very important factor that controls erosivity with the lower Niger basin.
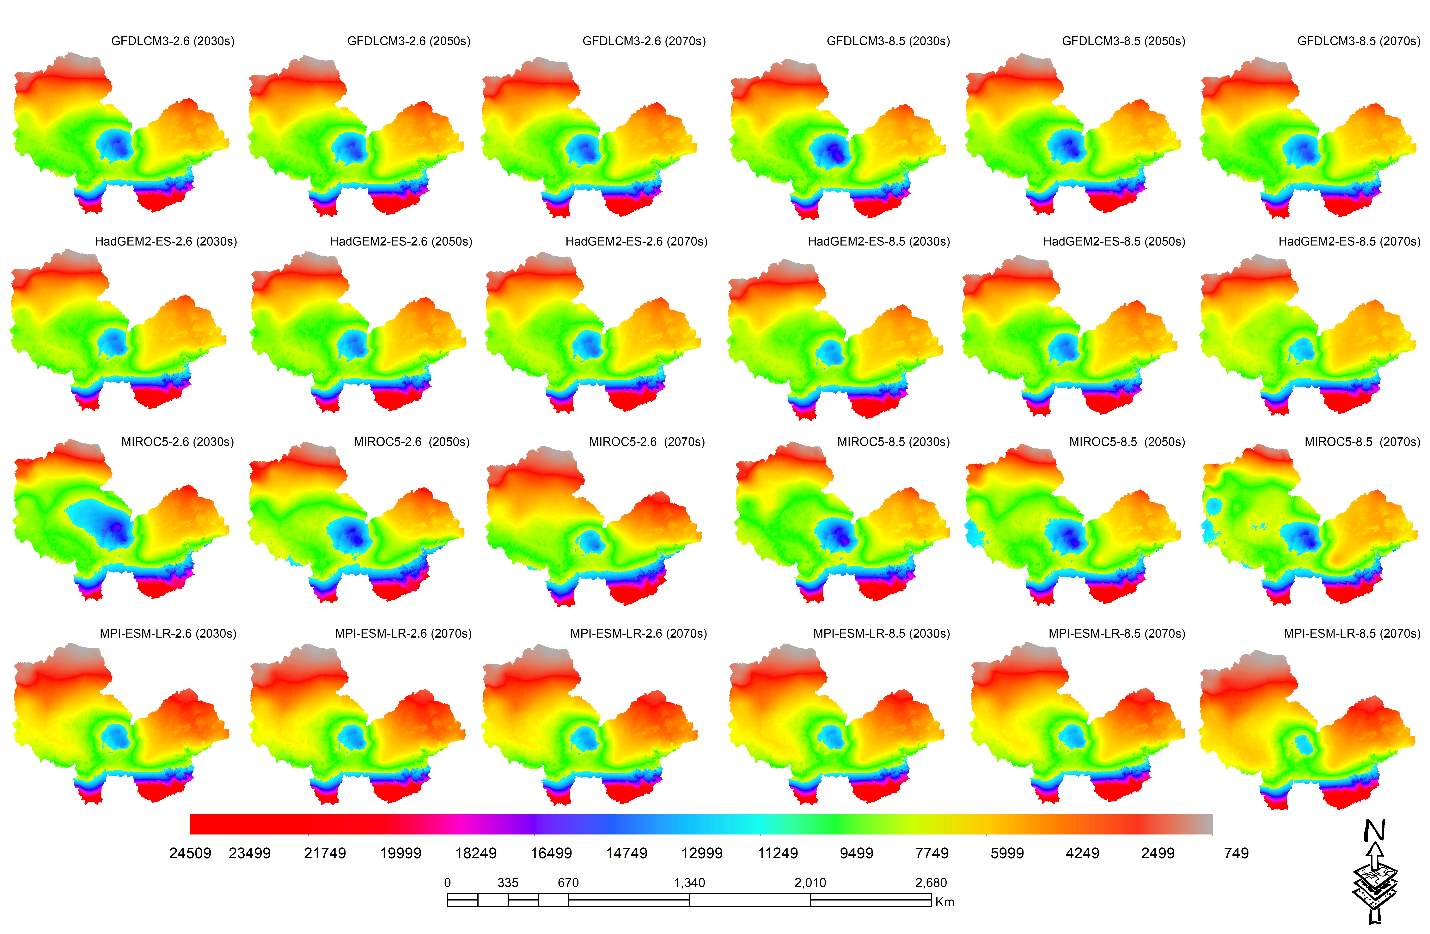
Figure 4. Predicted annual mean rainfall erosivity in the future for RCPs 2.6 (left) and RCPs 8.5 (right) for different time slices for the GCM projections
4.2 The RUSLE factors
The influence of environmental factors on the spatial distribution of soil erosion loss (terrain units, elevation, slope, and land use/cover) were analysed and evaluated. The average annual rainfall erosivity factor (R) for the baseline station (1950-2000) was found to range 715.5 and 17824.8 Mj.mm. ha-1 h-1 yr-1 (Figure 5a). The highest value of the annual R factor was observed at the southern part of the basin (17824.8 Mj.mm. ha-1 h-1 yr-1) with medium values at the middle of the basin decreasing Northwards where the lowest values were observed (715.5 MJ Mj.mm. ha-1 h-1 yr-1). Using the station observation data as a case in point (Table 3, the values gradually increased towards the southern (e.g. Onitsha and Enugu) parts of the basin and reduced to the Northern parts (Katsina and Sokoto). The spatial distribution of R values varied consistently with annual precipitation across the basin. This outcome is consistent with reports made by Farhan and Nawaiseh (2015).
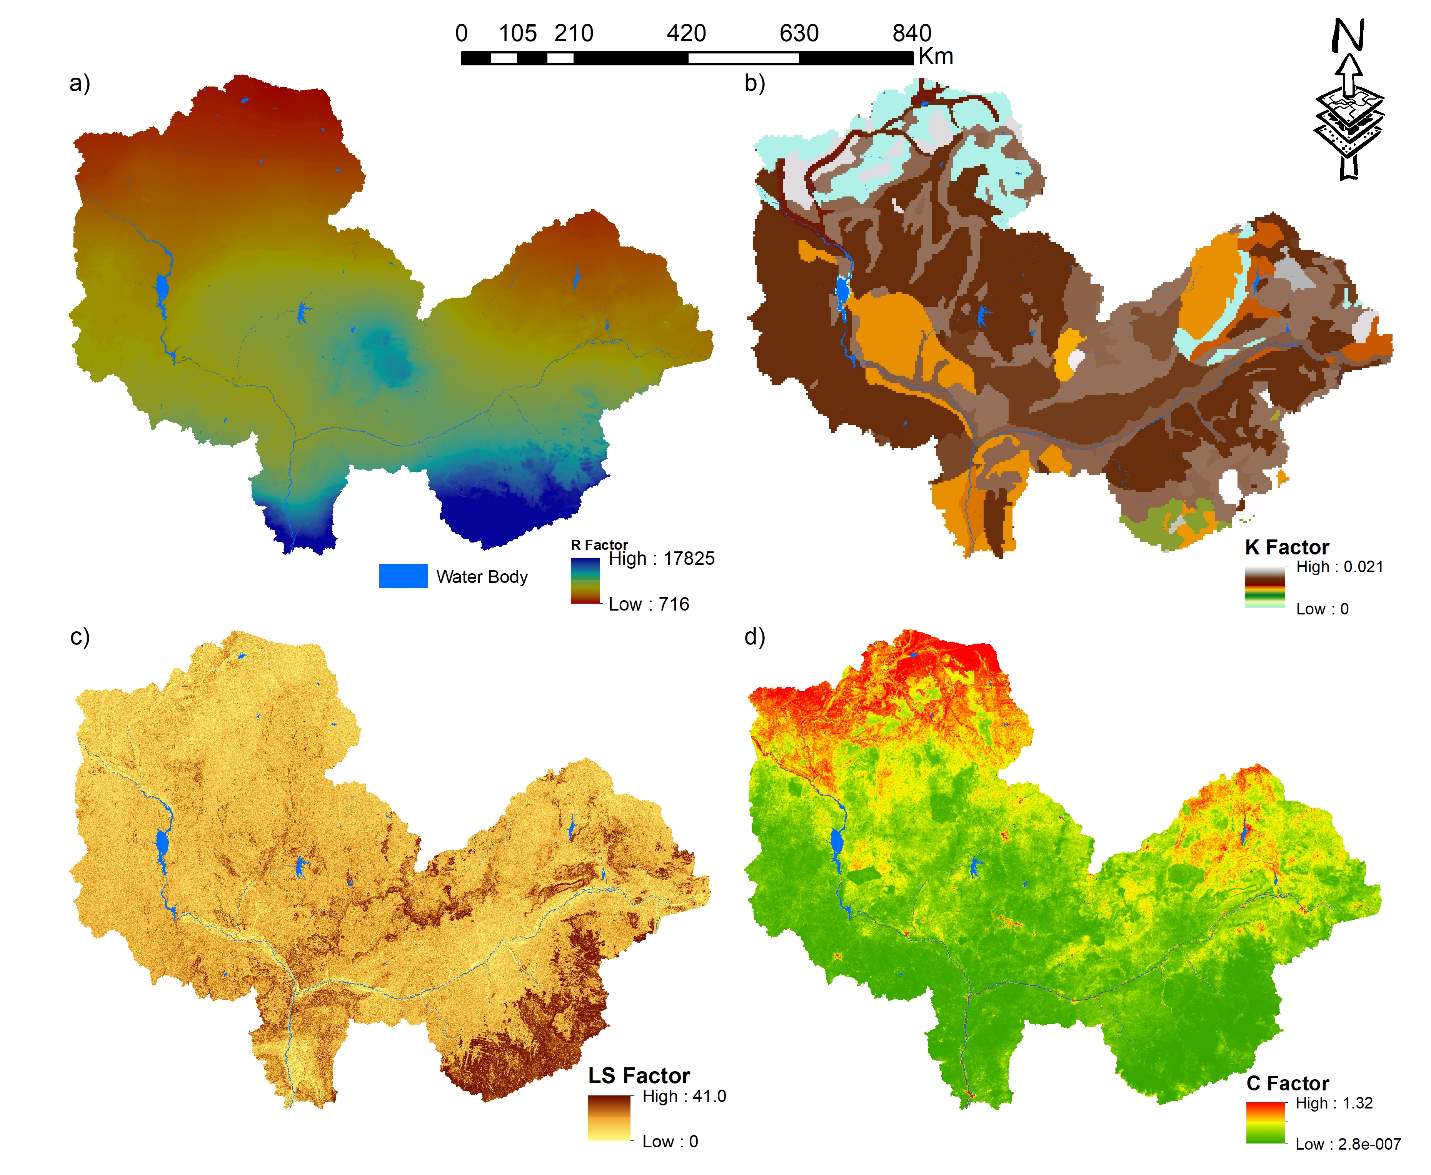
Figure 5. RUSLE factors used to determine soil loss erosion (a) Rainfall-runoff erosivity (b) Soil erodibility factor (c) Length and Slope factor (d) Crop management factor
The soil erodibility factor (Figure 5b) in the study area varies from 0 to 0.021, where 0 represents water surfaces. The soils in the basin are rich in sand (49.262%) and clay (32.2%) having very little organic matter. Soils with a high proportion of organic matter within the basin are considered to play a vital role in reducing soil erodibility (Gupta and Kumar 2017).
Analysis of the landscape reveals that soil erodibility was highest in cropland (0.02) followed by forestland. The average soil organic matter was found to be higher on low to moderate slopes while is lower on steep slopes.
It is expected that as the LS factor (figure 3c) increase, soil erosion per unit area also increases due to the acceleration of overland flow velocity and erosivity of runoff in the downslope direction (Renard et al. 1997; Prasannakumar et al. 2011). The LS factor in the present study varies from 0.0 to 41 (Figure 5c). The spatial distribution of the LS factor values are closely tied to slope categories (00–150, 150–350 and >350) and high elevation exceeding 1280 m. Higher LS values represent high susceptibility to soil erosion. Vegetation and land use/cover are significant factors in erosion process. The degree of vegetation cover has an important influence on the rate of erosion. By calculating the amount of vegetation cover through NDVI which provides better information of vegetation cover condition and density (Heumann et al., 2007). This was subsequently transformed to values of C-factor ranging from 2.8×10⁻⁷ to 1.32 (Figure 5d). The study area is majorly covered with cropland (42.91%), forestland (42.69%), mixed forest and cropland (11.34%) and Grassland (1.79%). The C factor with low values corresponded to dense forest and increased towards croplands and, then grassland then to other land-uses. P factor ranged from 0.5 to 1 corresponding to different land-use as outlined in table 2.
4.3 Implication of Changes in Past and Future Rainfall-runoff erosivity
The implication of Change in the rainfall-runoff erosivity as a result of past and future changes in climate is illustrated in table 6 showing variation in potential annual soil loss in the past climate and future scenarios. This was predicted by integrating R, K, LS, C and P factors to determine the response of annual soil loss erosion at the lower Niger basin. Increases in soil erosion reflecting variation in annual erosion are evident under all the scenarios, with the basin soil erosion showing significant increasing trend under all the scenarios except for the GFDLCM3-RCP8.5 (2020-2039) which shows a decline in rainfall-runoff erosivity of about -16.3% from the baseline climate, with rainfall-runoff erosivity increasing from the baseline climate by about 17.8% at the GFDLCM3- 2.6 for the 2020-2039. The annual soil erosion also shows a corresponding increase of about 1.5% from the baseline climate for the same time slice and climate scenario. For the 2020 to 2039 climate period, the HADCM2-2.6 and HADCM2-8.5 show the highest positive percentage increases of about 26.4% and 25.5% respectively. The percentage changes in annual basin erosion show increases as the rainfall-runoff erosivity increases from the baseline basin erosion.
It is evident that the highest decline in erosion was witnessed in the GFDLCM3-8.5 for 2020-2039. Similarly, for the 2040-2069 climate period, as baseline rainfall-runoff erosivity increased, the annual erosion increase. Within this climate period, the highest rainfall-runoff occurred at the MPIESMLR-8.5 which had the highest annual erosion of about 715 mg/y increasing from the baseline rainfall-runoff erosivity by 26.1%. The 2040-2069 time period also shows the lowest rainfall-runoff erosivity at GFDLCM3-8.5 dropping by 15.6% from the baseline rainfall-runoff erosivity with a corresponding percentage decline of about -0.4% from the baseline average annual soil erosion.
Table 5. Changes in average annual Rainfall-runoff erosivity and erosion under past and future climate change averaged across the basin
for 2060 to 2099 climatic period, the MPIESMLR-8.5 showed the highest rainfall-runoff erosivity with a percentage rise of 32.4% from the baseline. Consequently, the average annual soil erosion also showed an increase (28.2%) for this scenario. The GFDLCM3-2.6 showed the lowest soil erosion decline for the 2060-2099 climatic period.
The increases in annual soil erosion within the lower Niger basin reflects a combination of factors with respect to the climatic scenarios used in this study. Despite other factors, it is important to state that increases in annual rainfall play a significant role in the occurrence of erosion with the basin. Overall, there is an increase in the mean annual erosion from 2020-2039 through to 2060-2099 climate period of about 0.065%, and 9.5% with average respectively; signalling a potential increase in annual soil erosion under the future climatic scenarios. This agrees with the work conducted by Yang et al. (2003), where they reported global percentage rise in future soil erosion due to climate change with Africa reaching about 15.7% in the 2090s. Figure 6 illustrates the spatial variation in erosivity and potential annual soil erosion for the lower Niger-basin estimated from the RUSLE model under different future climatic scenarios from a combination of GFDLCM3, HADCM2, HADCM2, MIROC5 and MPIESMLR with RCP 2.6 and RCP 8.5 emission scenarios. The increases in annual soil erosion could be as a result of a combination of several factors, most importantly changes in rainfall-runoff erosivity resulting from changes in annual rainfall.
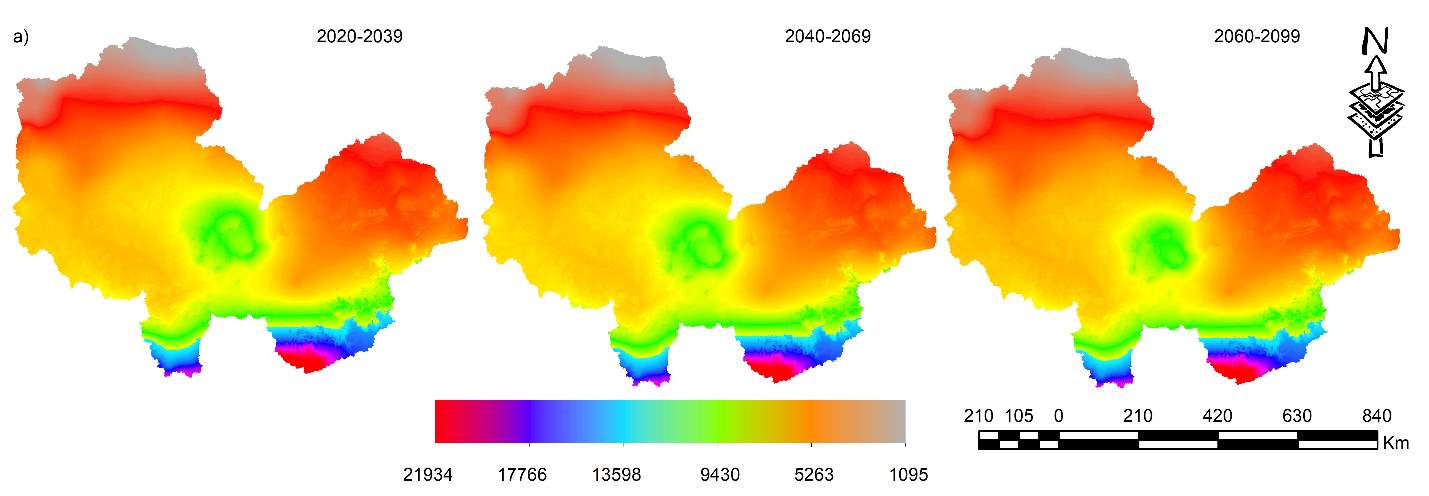
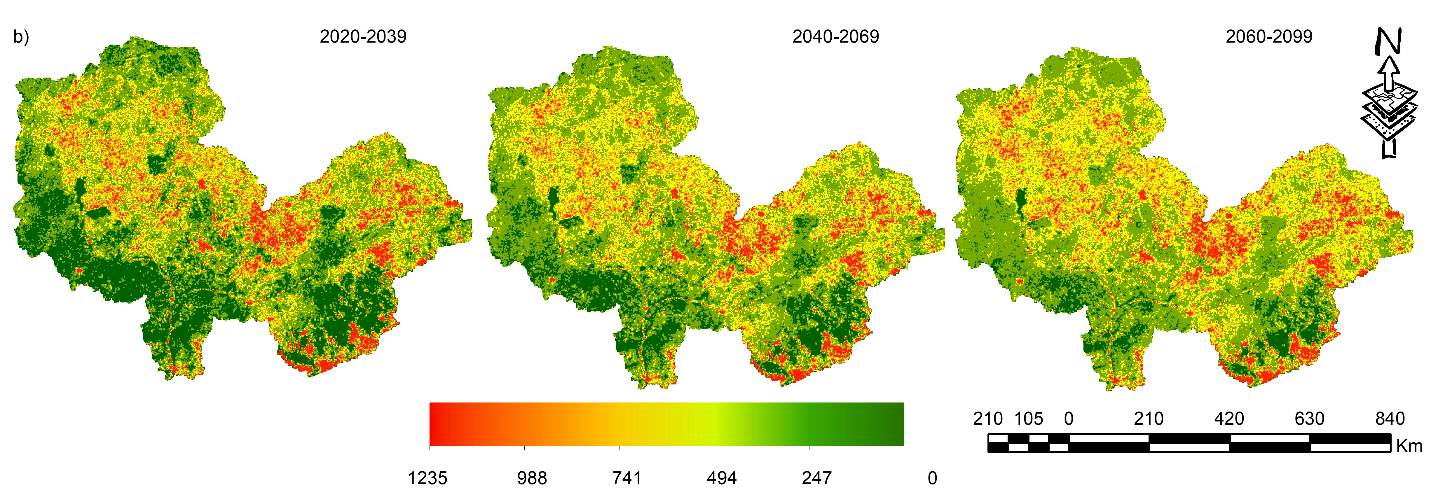
Figure 6. Predicted Rainfall-runoff erosivity and soil loss under climate change: (a) Predicted rainfall runoff erosivity (Mj.mm. ha-1 h-1 yr-1) under all the scenarios for different time slices and (b) Predicted future soil erosion (Mg/y) under all the scenarios for different time slices.
Climate change influences on soil loss erosion may rise or decline depending on the changes in rainfall-runoff erosivity and other interacting factors (Plangoen et al., 2013). This can be said to be true within the lower Niger-basin. The result of mean soil loss changes (Table 5) derived from the RUSLE model under the past and future climate change projections from a combination of four different climate models for three different time periods are between 567.3Mg/y and 620.5Mg/y for 2020-2039 and 2060-2099 time periods respectively. This indicates increases in soil loss as precipitation increase with time. Evidently, soil loss erosion is expected to rise as a result of an increase in annual precipitation and rainfall-runoff erosivity when the downscaled climate change projections are used in determining soil loss. So, expected changes in rainfall behaviour may have a significant impact on soil erosion (Jiang et al., 2014; Routschek et al., 2014). Increased precipitation amounts and intensity leading to increased rate of soil loss has also been observed in various studies (Litschert et al., 2014; Mondal et al., 2016, Michael et al., 2005). Rainfall-runoff erosivity increases in wet periods and regions (Fiener et al., 2013; Wang et al., 2017) and reduces in dryland and dry periods (Angulo-Martinez and Begueria, 2012; Wang et al., 2017).
Vrieling et al., (2014) has reported that seasonal change in areas experiencing high rainfall-runoff erosivity is closely linked to the seasonal movement of intertropical convergence zone in sub-Saharan Africa, implying that more erosivity power is expected in places of more rainfall. Several intense rainfall events are responsible for increased soil erosion and sediment delivery. Even when the study site shows that the combined percentage of cropland and mixed cropping are more than forested area; rainfall erosivity, which is not amenable to human modification, is a very important factor controlling soil erosion. Given that the study site does not have any major erosion support practice system, the impact of rainfall erosivity can be more severe because soils are easily eroded. Fagbohun et al. (2016), have reported increases in soil erosion due to variation in rainfall and lack of soil erosion practices in a sub-basin of the study area
4.4 Uncertainties
To address uncertainties inherent in climate models, the use of GCMs and corresponding scenarios are important (Fang et al., 2017, Taye et al., 2015). Even so, uncertainties encompass future climate change projections and downscaling techniques. The downscaled climate data set are some worth entrenched in some degree of uncertainties because of the downscaling technique, delta change technique, utilised as a part of this research. This is because GCMs are enhanced to predict climate change at their local resolution (Plangoen et al., 2013). The delta change technique is a basic approach to execute and obtain data from GCMs on month by month basis. Numerous statistical downscaling techniques require information from only GCMs on a daily basis, and daily timescale data from GCMs are viewed as less precise by some researchers (Huth et al., 2001; Plangoen et al., 2013). Additionally, there exists a vast uncertainty in the global erosion (Naipal et al., 2015). This shows that modelling erosion by soil on a global or even regional scale is as yet a difficult undertaking because of the high spatio-temporal variability of soil erosion.
5. Conclusion
As a sensitive basin responding to environmental change by climate, the lower Niger Basin has experienced a recurrence of heavy precipitation events, more so in recent decades. Fluctuations in rainfall-runoff erosivity and soil erosion were unavoidable. Nevertheless, the limited and/or inadequate spatial spread of precipitation observation in this tropical latitude have restricted rainfall-runoff research and to extension soil erosion on a large scale. Little is known about the variations in rainfall-runoff erosivity for the entire basin. This research evaluated the long-term variations in the annual rainfall-runoff erosivity in the lower Niger basin utilising past and future climate data. The conclusions were as per the following:
- Increasing trends in the annual rainfall-runoff erosivity were observed from the baseline climate up to the GCMs, and the climate scenarios experienced variations in both erosivity and soil loss. From the baseline climate, the average change in the percentage of rainfall-runoff erosivity is 15.3%, 19.6%, and 25% and 0.065%, 4.5% and 9.5% for soil erosion in the 2030s, 2040s and 2070s respectively.
- Higher precipitation amounts were the major drivers of the increase in the spatial and temporal rainfall-runoff erosivity.
- The relative increasing rate for erosivity and soil erosion comparable, signalling a significant contribution of rainfall-runoff erosivity to the increase in soil erosion.
The local wetting climate increases the risk of soil erosion by increasing rainfall-runoff erosivity in the lower Niger basin, and more studies should be performed to include other important factors that encourage future increases in erosivity, especially future changes in land use.
[1] GCMs, http://www.ccafs-climate.org/data/, Accessed July 2017
[2] Soil data; http://www.fao.org/geonetwork/srv/en/metadata.show?id=14116, Accessed August 2017
[3] DEM, http://www.dwtkns.com/srtm30m/,Accessed, Accessed August 2017
[4] NDVI, http://ladsweb.nascom.nasa.gov/data/html, Accessed June 2017
Cite This Work
To export a reference to this article please select a referencing stye below:
Related Services
View all


Related Content
All TagsContent relating to: "Climate Change"
Climate change describes large changes in global or local weather patterns and global warming generally considered to be largely caused by an international increase in the use of fossil fuels from the mid-20th century onwards.
Related Articles

DMCA / Removal Request
If you are the original writer of this dissertation and no longer wish to have your work published on the UKDiss.com website then please: