Residential Appraisal Report
Info: 15157 words (61 pages) Dissertation
Published: 10th Dec 2019
Tagged: Estate Management
|
RESIDENTIAL APPRAISAL REPORT (BUSI 330, Project No. 2)
LETTER OF TRANSMITTAL INFORMATION |
||
| Property Address
9603 88th Avenue NW |
||
|
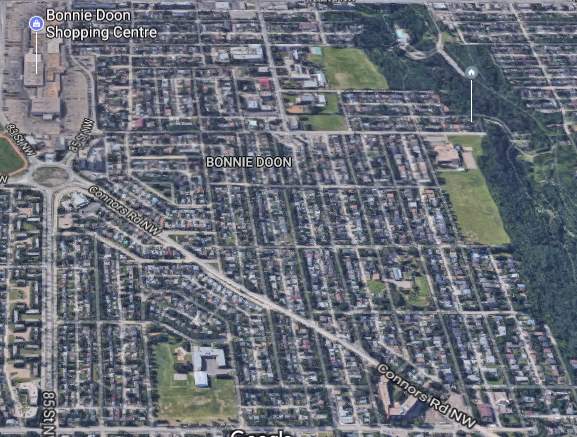
Legal Description Plan 3737AI Block 3 Lots 15 & 16 Prepared For: Jordan River Credit Union 1405 58th Street Vancouver, BC, A4F 6T6 The purpose of this appraisal is to estimate the current market value of the Fee Simple Estate to aid in obtaining mortgage financing. The Effective Date of this analysis coincides with the Date of Inspection, that being November 15, 2017. The subject property entails a two-storey 2,700 sq. ft single family dwelling sitting on a 25,000 sq. ft lot located in the south west of Edmonton within the Bonnie Doon Neighbourhood. The subject site features full-municipal servicing, extensive rear and front landscaping and a rear garden area. The subject property is currently being utilized as a single family dwelling. The highest and best use for the subject property is considered to be a single family dwelling. The property currently exhibits an RF3 – Small Scale Infill Development land use classification. The valuation techniques undertaken will include the Cost Approach and Direct Comparison Approach. The exposure time for the subject property has been estimated at 20 days. As a result of my analysis, I have formulated the opinion that the subject has an estimated market value of $1,400,000.00. Respectfully submitted, |
||
| Page i | ||
|
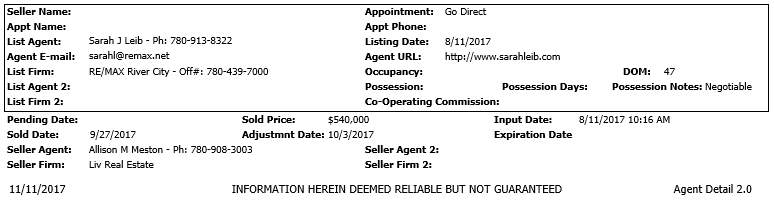
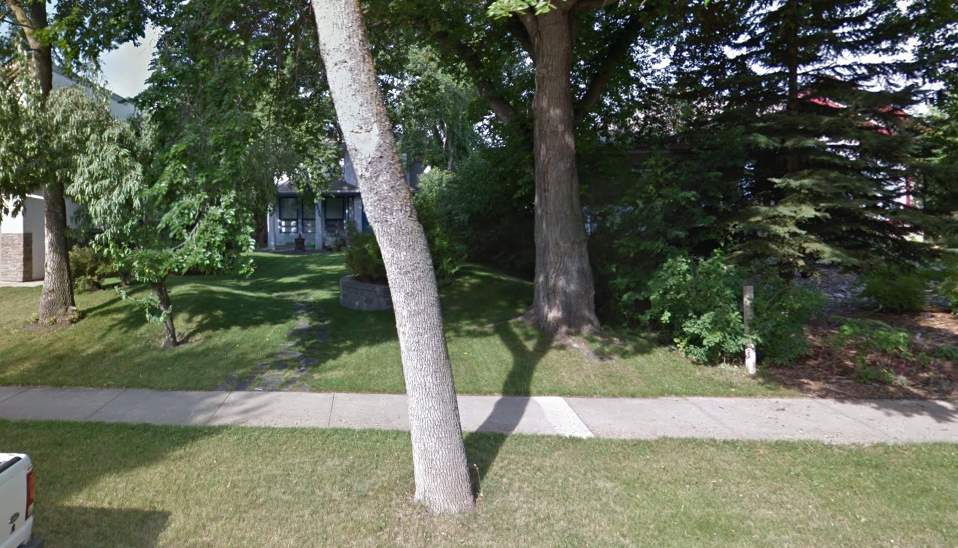
PHOTOGRAPHS OF SUBJECT |
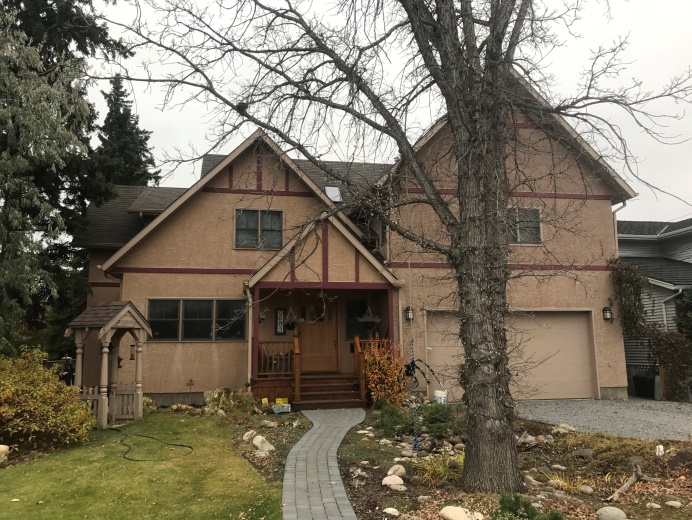
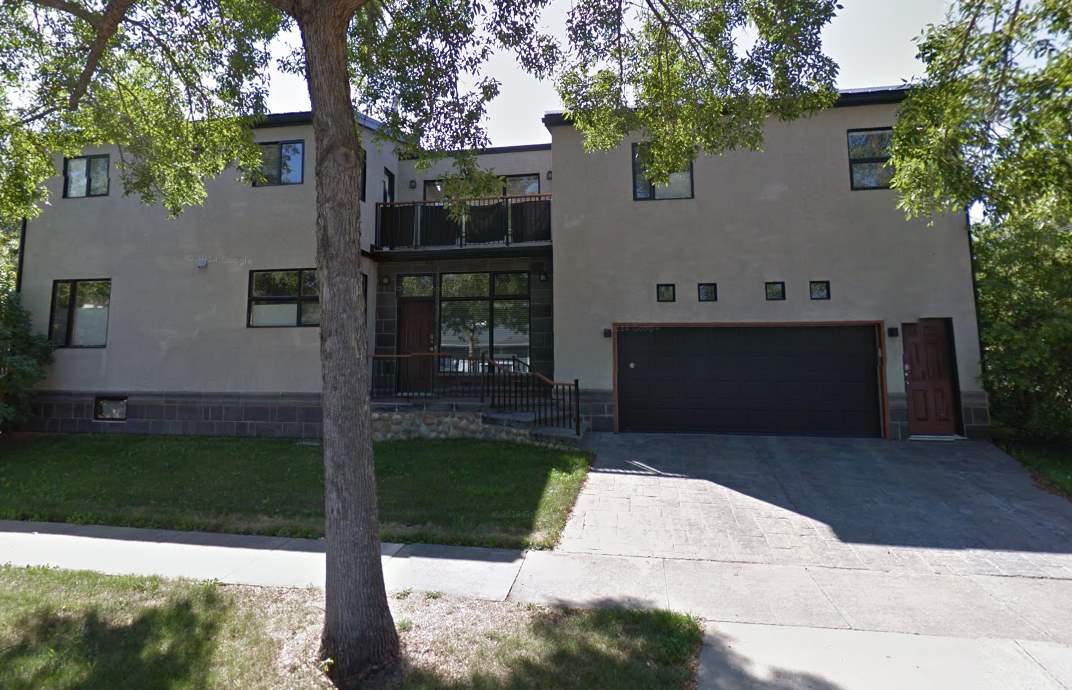
Front View of Subject
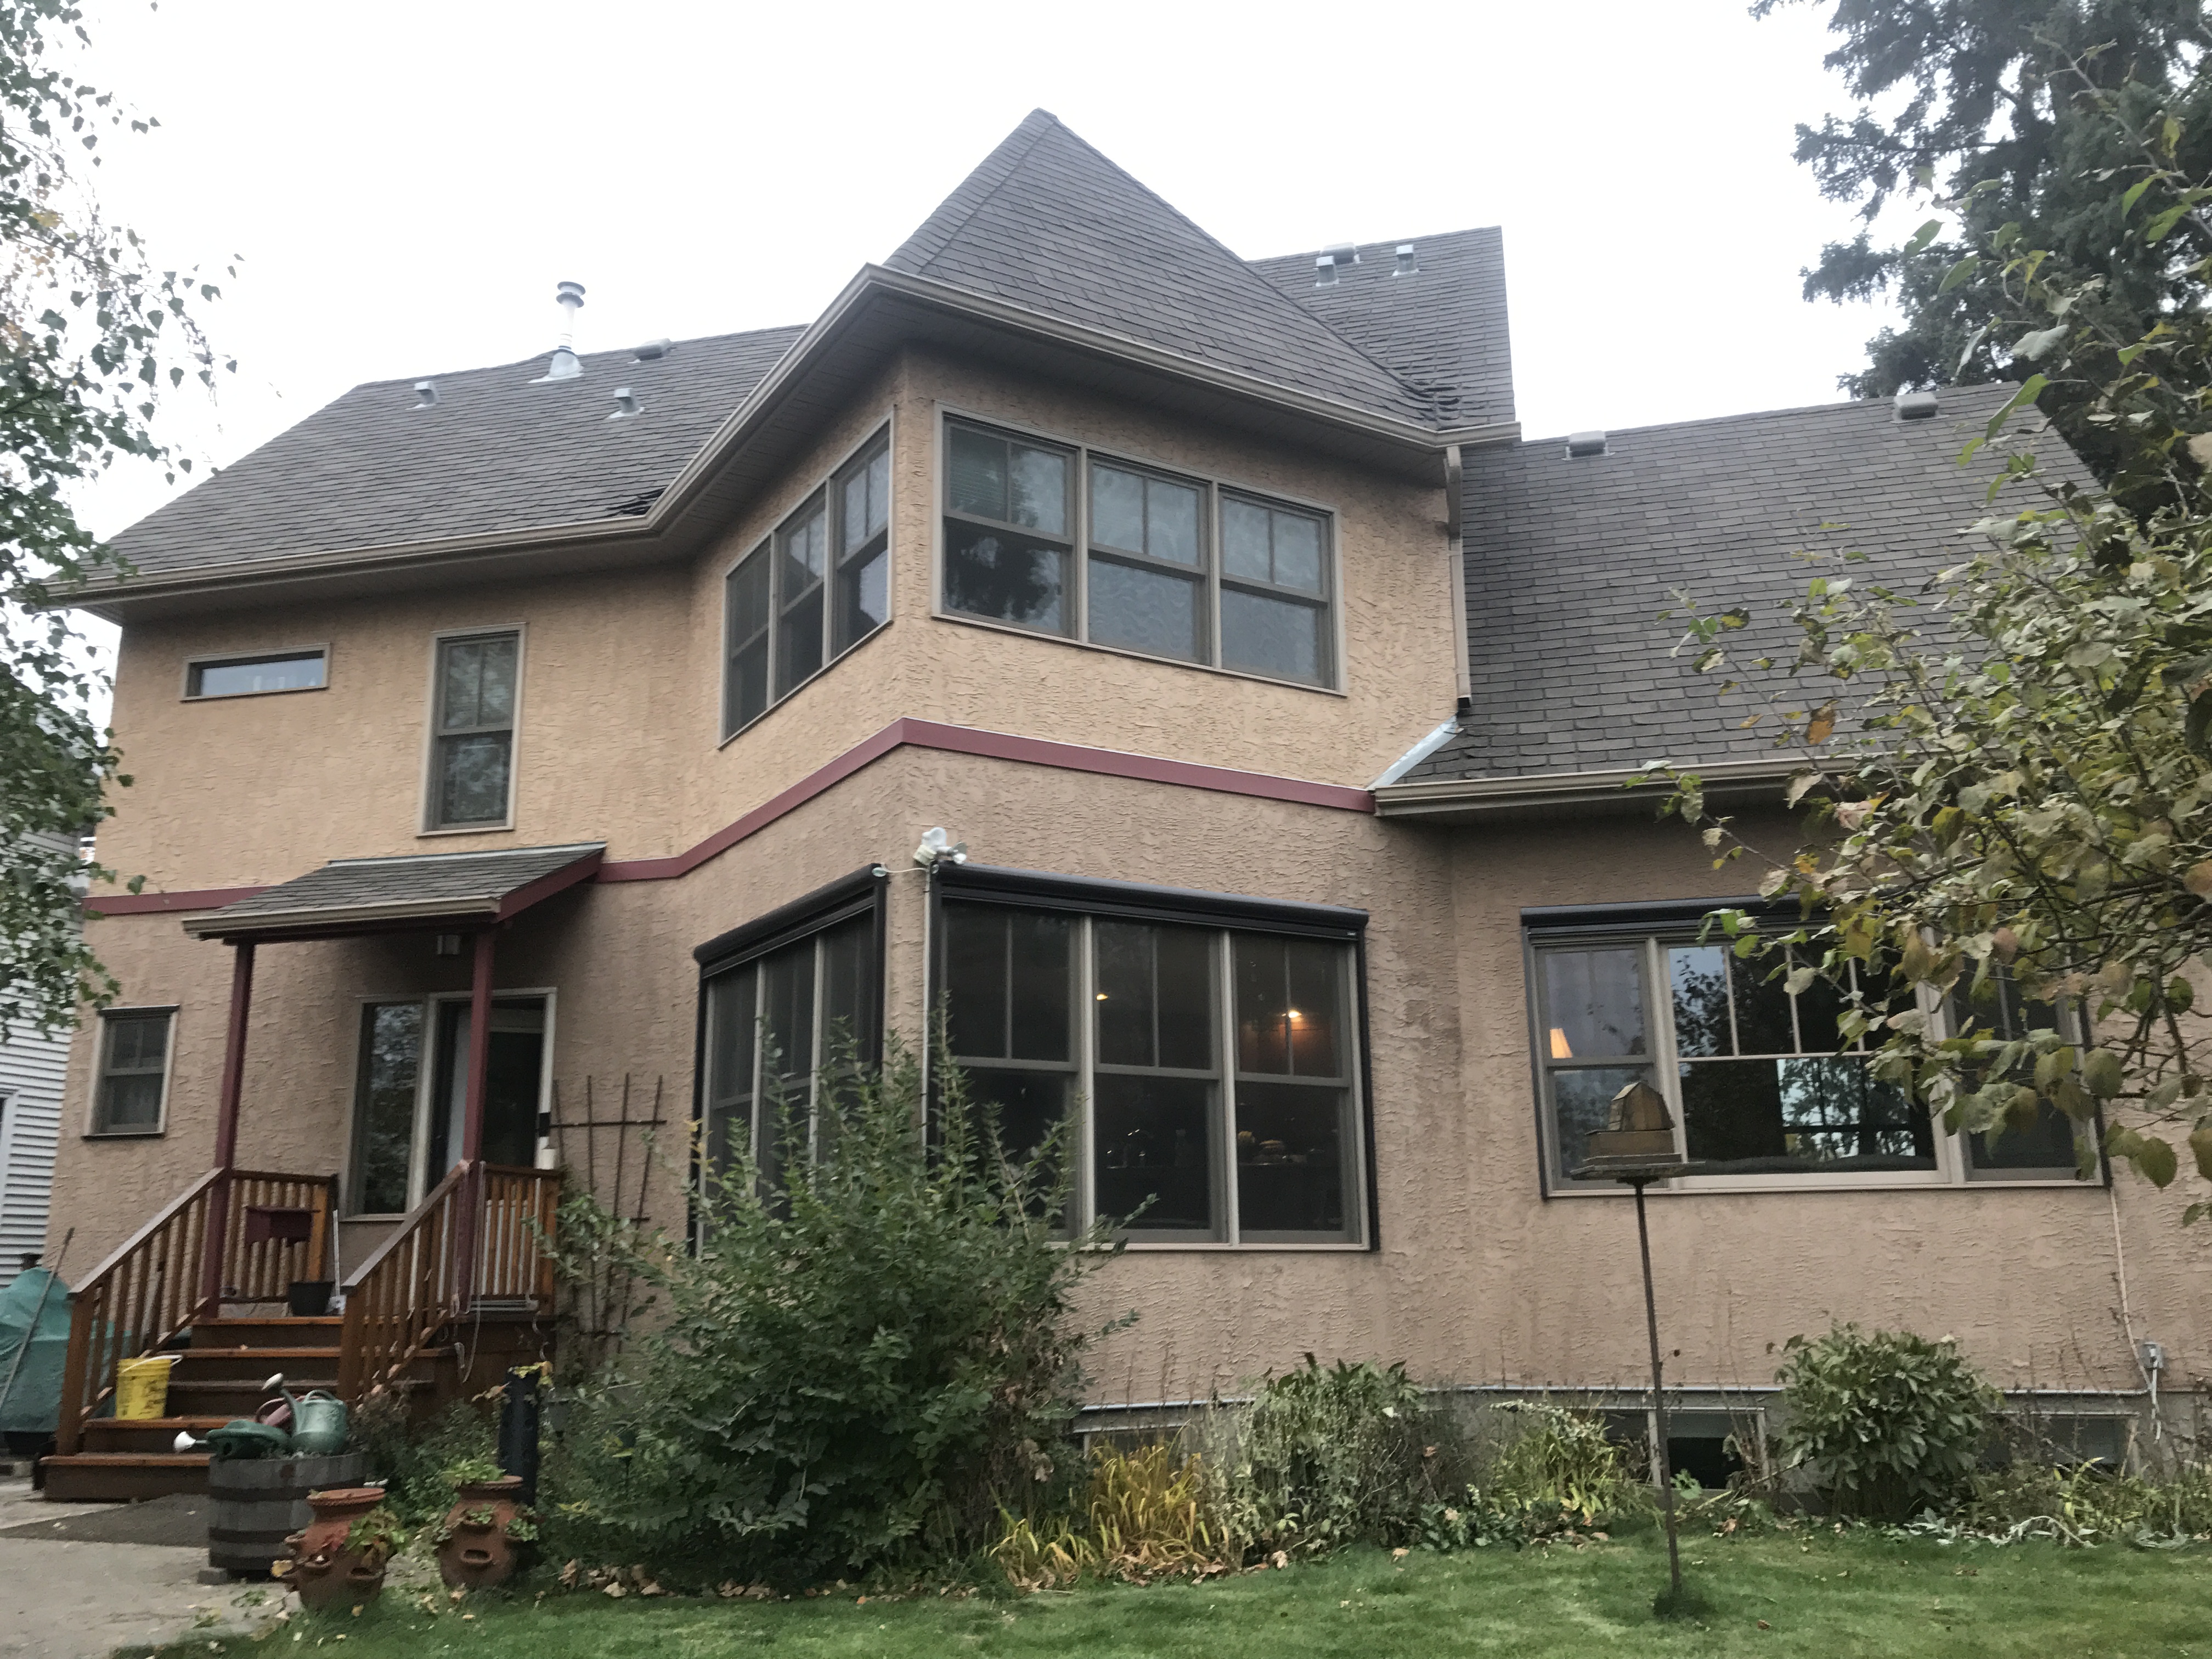
Rear View of Subject
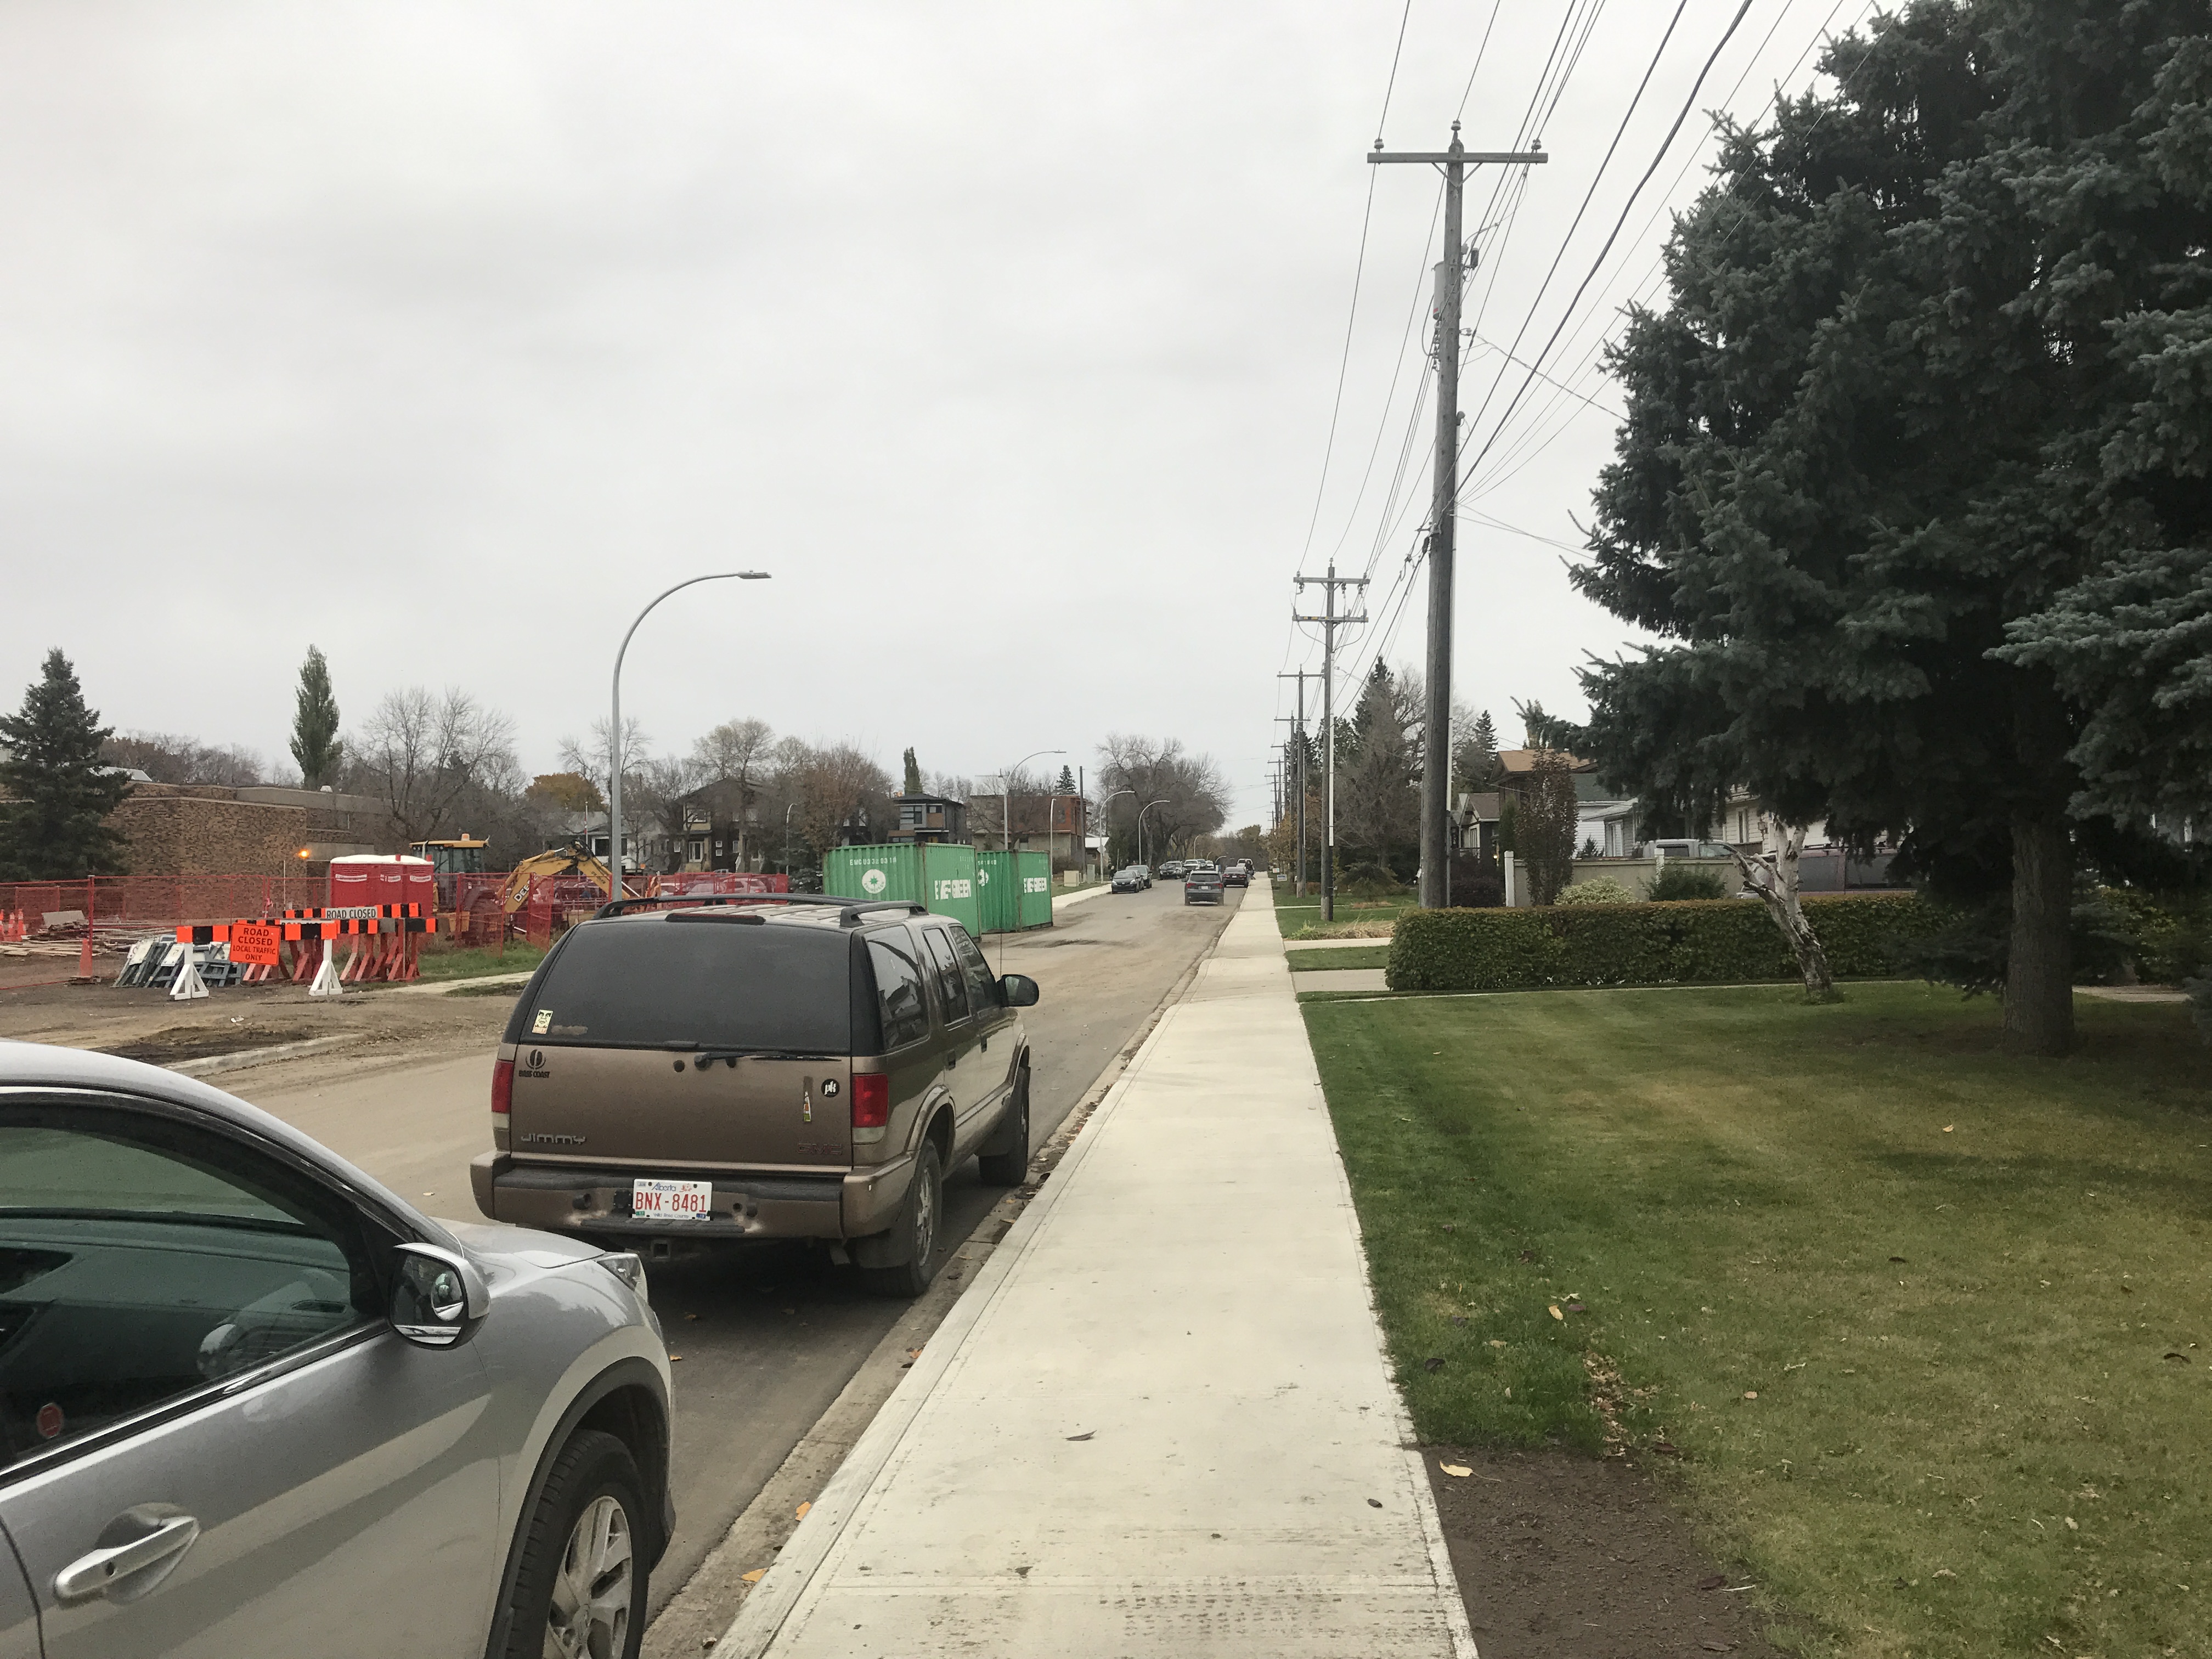
View of 88th Avenue East
| Page ii | |
| TABLE OF CONTENTS
|
|
Section |
Page Number |
| Photographs of Subject Property
Table of Contents Summary of Salient Facts and Important Conclusions |
i
ii iii |
Part I – Preface |
|
| Definition of the Appraisal Problem
Assumptions and Limiting Conditions Regional and Area Analysis (optional) Neighbourhood Analysis and Trends (optional) Land Description and Analysis (optional) Description of Improvements (optional) Description of Improvements: Observed Depreciation |
1
2 |
Part II – Analysis and Conclusions |
|
| Highest and Best Use Estimate
Cost Approach – Land Value – Cost Analysis of Improvements – Depreciation – Summary Direct Comparison Approach Reconciliation of Value Indications and Final Estimate of Value Certification |
|
Schedules |
Addenda Item/Page No. |
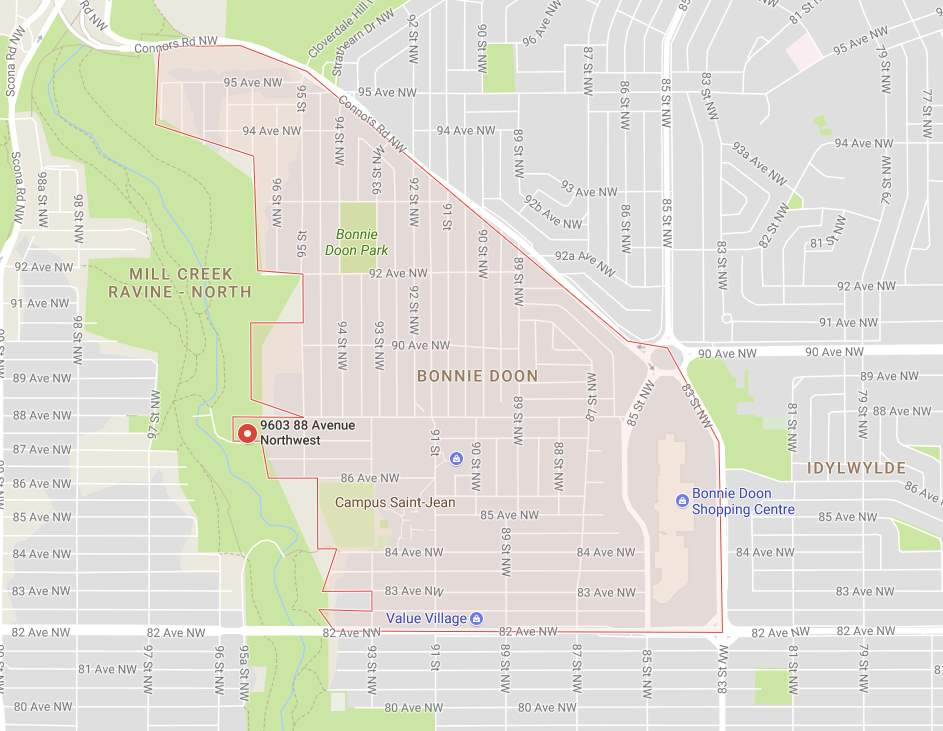
| City/Regional Map
Neighbourhood Map Site/Plot Plan (optional) Floor Plan(s) (optional) Comparable Land Sales Map Cost Summary; Cost Manual/Service Excerpts and Worksheets Comparable Improved Sales Map Photographs of Improved Sales Additional Photographs of Subject (optional) Neighbourhood Photographs (optional) Transfer and Mortgage Documents for Comparables (optional) Other Materials (list) |
A |
| Page iii | |
| SUMMARY OF SALIENT FACTS AND IMPORTANT CONCLUSIONS
|
|
| Type of single family dwelling: Single-Family Detached Home | |
| Address of property: 9603 88th Avenue NW, Edmonton, AB, T6C 1M7 | |
| Effective date of the appraisal: November 15th, 2017 | |
| Dimensions and area of site: 66 | |
| Dimensions and area of building(s): 66” x 160” (10,560 sq. ft.) | |
| Highest and best use: Single-Family Detached Home | |
| Estimate of land value (as if vacant): $990,000.00 | |
| Estimate of value by Cost Approach: $1,367,000.00 | |
| Estimate of value by Direct Comparison Approach: $1,400,000.00 | |
| Final estimate of value: $1,400,000.00 | |
| Page 1 of pages | |||||||
| DEFINITION OF THE APPRAISAL PROBLEM | |||||||
| PURPOSE of the appraisal is to estimate the Market Value of the subject property as at the effective date of appraisal. FUNCTION of the report is for the awarding of credits for completion of course BUSI 330. | |||||||
| Present registered owner: | |||||||
| Past sales history: | No sale history in the past 5 years | ||||||
| Legal description | |||||||
| Plan 3737 AI, Block 3, Lot 15 & 16. | |||||||
| Encumbrances | |||||||
| Mortgage information | [ x ] No mortgage | ||||||
| 1st held by | 2nd held by | ||||||
| Principal
outstanding |
Monthly
payments |
Are taxes
Included? |
Date
due |
Interest
rate |
Amortization
period |
Conditions | |
| 1st | None | None | – | – | – | – | – |
| 2nd | |||||||
| Rights-of-way, other encumbrances | |||||||
| [ x ] none | [ ] (if any, describe) | ||||||
| Definition of property rights appraised | |||||||
| The Fee simple estate is “Absolute ownership unencumbered by any other interest or estate, subject only to the limitations imposed by the governmental powers of taxation, expropriation, police power and escheat.”
Appraisal of Real Estate (3rd Canadian edition) |
|||||||
| Definition of market value | |||||||
| Market value is defined in the Appraisal of Real Estate (3rd Canadian edition) as: “The most probable price, as of a specified date, in cash, or in terms equivalent to cash, or in other precisely revealed terms, for which the specified property rights should sell after reasonable exposure in a competitive market under all conditions requisite to a fair sale, with the buyer and seller each acting prudently, knowledgeably, and for self-interest, and assuming that neither is under undue duress.” | |||||||
| Effective date of appraisal | |||||||
| November 15, 2017 | |||||||
| Page 2 of pages |
|
ASSUMPTIONS AND LIMITING CONDITIONS
|
| This report is subject to the following assumptions and limiting conditions. |
| 1. Legal description is that which is recorded in the Registry or Land Title office and is assumed to be correct.
2. Every effort has been made to verify the information received from others which is believed reliable and correct. 3. Sketches, drawings, diagrams, photographs, etc., are included for the sole purpose of illustration and serve to assist the reader in visualizing the property.
7. |
| Page of pages | |||||||||||||||||||||||||||||||||||||||||||||||||
| DESCRIPTION OF IMPROVEMENTS | |||||||||||||||||||||||||||||||||||||||||||||||||
| DESCRIPTION OF BUILDING | |||||||||||||||||||||||||||||||||||||||||||||||||
| Dimensions | Area | 2,700 sq. ft. | Type/style | 2 storey | Year Built | 2006 | |||||||||||||||||||||||||||||||||||||||||||
| Foundation | [ x ] Poured concrete | [ ] Concrete blocks | [ ] Concrete posts | [ ] Wood posts | |||||||||||||||||||||||||||||||||||||||||||||
| Framing | [ x ] Wood | [ ] Concrete | [ ] Steel | [ ] | |||||||||||||||||||||||||||||||||||||||||||||
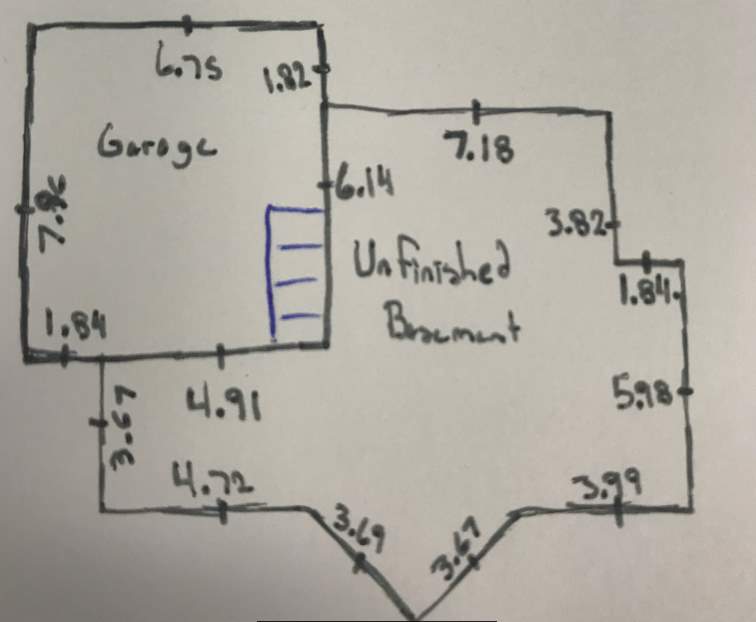
| Basement | [ x ] Full | [ ] Partial | [ ] None | [ ] Slab | |||||||||||||||||||||||||||||||||||||||||||||
| [ ] Crawl space | |||||||||||||||||||||||||||||||||||||||||||||||||
| Basement Finish | Unfinished | ||||||||||||||||||||||||||||||||||||||||||||||||
| Exterior Walls | Brick veneer | Clapboard | Stucco 100% | Siding: | Vinyl | ||||||||||||||||||||||||||||||||||||||||||||
| (percentage) | Wood | ||||||||||||||||||||||||||||||||||||||||||||||||
| Stone veneer | Aluminum | Solid masonry | Aluminum | ||||||||||||||||||||||||||||||||||||||||||||||
| Roof | [ x ] Asphalt shingles | [ ] Wood shingles or shake | [ ] Slate | [ ] Clay/tile | |||||||||||||||||||||||||||||||||||||||||||||
| [ ] Built-up tar & gravel | [ ] Gutters & down spouts | [ ] | |||||||||||||||||||||||||||||||||||||||||||||||
| Interior Walls | [ x ] Dry wall | [ ] Plaster | [ ] Paneling: | type | |||||||||||||||||||||||||||||||||||||||||||||
| Floor Coverings | Above ground | Carpet | Tile | Ceramic | Hardwood | Linoleum | |||||||||||||||||||||||||||||||||||||||||||
| (percentage) | Basement | Carpet | Tile | Linoleum | Other: Concrete | ||||||||||||||||||||||||||||||||||||||||||||
| Fireplaces | Number: 0 | Location: | Type: | ||||||||||||||||||||||||||||||||||||||||||||||
| Kitchen | [ x ] Built-in dishwasher | [ ] Garburator | [ ] Built-in range
and oven |
[ x ] Exhaust fan | [ x ] Vent hood | ||||||||||||||||||||||||||||||||||||||||||||
| Cabinets – type and material: | Quality: High | ||||||||||||||||||||||||||||||||||||||||||||||||
| Counter material: Granite | Other features | ||||||||||||||||||||||||||||||||||||||||||||||||
| Fixtures: | Quality | ||||||||||||||||||||||||||||||||||||||||||||||||
| Electricity | No. of amps: | 100 amp | [ x ] Circuit breakers | [ x ] Fuses | |||||||||||||||||||||||||||||||||||||||||||||
| Plumbing | Pipes | [ ] Copper | [ x ] Galvanized | [ ] Mixed | |||||||||||||||||||||||||||||||||||||||||||||
| Hot water tank | [ ] Electricity | [ x ] Gas | [ ] Oil | Capacity: | 25 gallon | ||||||||||||||||||||||||||||||||||||||||||||
| Connections | [ x ] Washer | [ x ] Dishwasher | [ ] | ||||||||||||||||||||||||||||||||||||||||||||||
| Drainage | [ ] Plastic | [ x ] Galvanized | [ ] | ||||||||||||||||||||||||||||||||||||||||||||||
| Heating | [ x ] Forced air | [ x ] Hot Water | [ ] Steam | [ ] | |||||||||||||||||||||||||||||||||||||||||||||
| [ ] Oil fired | [ x ] Gas fired | [ ] Electric | [ ] Humidifier | ||||||||||||||||||||||||||||||||||||||||||||||
| Air Conditioning | [ x ] Yes | [ ] No | [x ] Central | Swimming pool | [ ] Yes | Type: | |||||||||||||||||||||||||||||||||||||||||||
| Garage | [ ] Single | [ x ] Double | [ x ] Attached | [ ] Detached | [ ] None | ||||||||||||||||||||||||||||||||||||||||||||
| [ ] Carport | [ ] Electricity | [ x ] Heated | [ ] Interior finish | ||||||||||||||||||||||||||||||||||||||||||||||
| Type of construction: | Wood Frame | ||||||||||||||||||||||||||||||||||||||||||||||||
| Flooring: | Concrete | Dimensions: | 20 x 24 | Area: 480 sq. ft | |||||||||||||||||||||||||||||||||||||||||||||
| Porch | [ x ] Open | [ ] Screened | [ ] Enclosed | Size: | [ ] None | ||||||||||||||||||||||||||||||||||||||||||||
| Patio/Deck | [ ] Concrete | [ x ] Wood | [ ] | Size: | [ ] None | ||||||||||||||||||||||||||||||||||||||||||||
| Page of pages | |||||||||||||||||||||||||||||
| DESCRIPTION OF IMPROVEMENTS (continued) | |||||||||||||||||||||||||||||
| Please identify each room with an “X”, or if more than one, indicate with a number | |||||||||||||||||||||||||||||
| Room List | Foyer | Living | Dining | Kitchen | Den | Family Room | Bedrooms | No. Baths | Laundry | Other | |||||||||||||||||||
| Basement | |||||||||||||||||||||||||||||
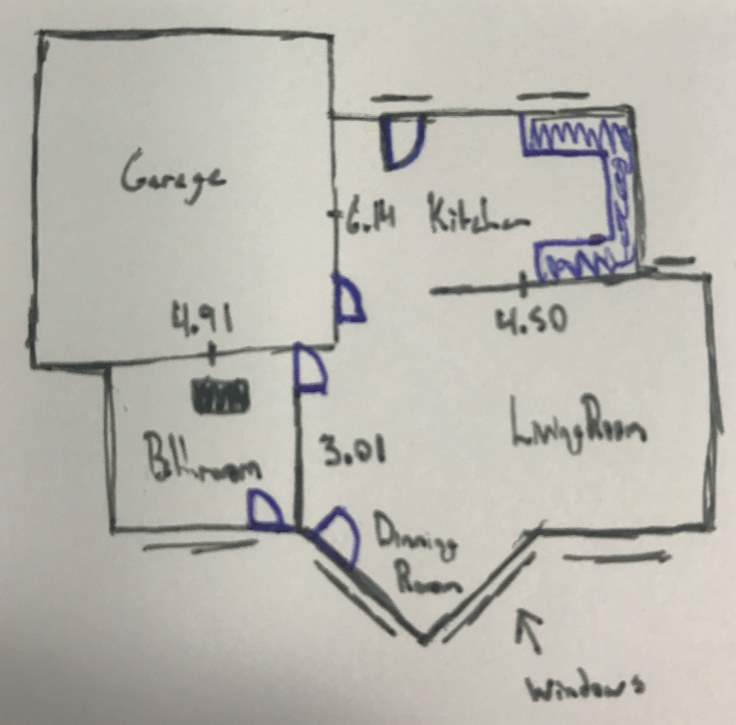
| 1st Level | 1 | 1 | 1 | 1 | 1 | ||||||||||||||||||||||||
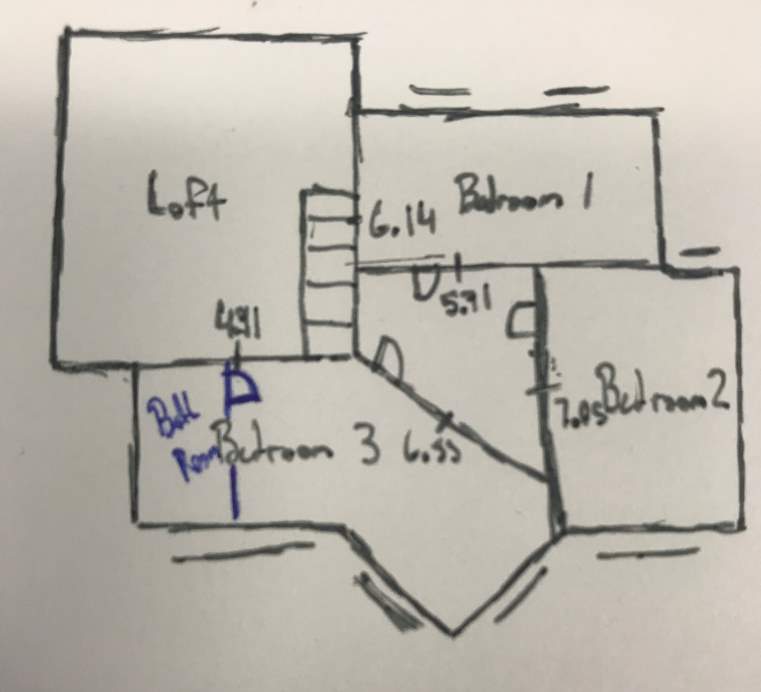
| 2nd Level | 1 | 3 | 1 | ||||||||||||||||||||||||||
| Finished area above grade contains a total area of | 5 | rooms | 0 | bedrooms | 1 | baths | |||||||||||||||||||||||
| Bathroom location | Description of fixtures installed | ||||||||||||||||||||||||||||
| 1st bathroom on main level | Shower, sink, toilet | ||||||||||||||||||||||||||||
| 2nd bathroom upstairs (attached to master) | Shower, tub, sink , toilet | ||||||||||||||||||||||||||||
| *Comments required | Good | Average | Fair | Poor* | |||||||||||||||||||||||||
| Energy efficiency and insulation level | [ x ] | [ ] | [ ] | [ ] | |||||||||||||||||||||||||
| Quality of construction (materials and finish) | [ x ] | [ ] | [ ] | [ ] | |||||||||||||||||||||||||
| Condition of improvements | [ x ] | [ ] | [ ] | [ ] | |||||||||||||||||||||||||
| Rooms size and layout | [ x ] | [ ] | [ ] | [ ] | |||||||||||||||||||||||||
| Plumbing – adequacy and condition | [ x ] | [ ] | [ ] | [ ] | |||||||||||||||||||||||||
| Electrical – adequacy and condition | [ x ] | [ ] | [ ] | [ ] | |||||||||||||||||||||||||
| Kitchen cabinets – adequacy and condition | [ x ] | [ ] | [ ] | [ ] | |||||||||||||||||||||||||
| Compatibility to neighbourhood | [ x ] | [ ] | [ ] | [ ] | |||||||||||||||||||||||||
| Overall livability | [ x ] | [ ] | [ ] | [ ] | |||||||||||||||||||||||||
| Appeal and marketability | [ x ] | [ ] | [ ] | [ ] | |||||||||||||||||||||||||
| Additional features | |||||||||||||||||||||||||||||
| Luxury style kitchen, hardwood flooring, and high-quality windows. Master exhibits walk in closet, 4 pc bathroom.
Living area exhibits a large upper floor family room. Main floor exhibits open concept design, large living room and dining area, and luxury style kitchen. |
|||||||||||||||||||||||||||||
| Recent modernization, renovation, and major repairs. | |||||||||||||||||||||||||||||
| Site improvements | |||||||||||||||||||||||||||||
| [ x ] Driveway | [ ] Paved | [ x ] Gravel | [ ] Concrete | Area: | 500 sq. ft. | ||||||||||||||||||||||||
| [ x ] Fence | [ x ] Wood | [ ] Chain link | [ ] | Length: | 50” | Height: | 10” | ||||||||||||||||||||||
| [ x ] Landscaping | Description | Walkway | |||||||||||||||||||||||||||
| [ x ] Other | Describe | Paving stone | |||||||||||||||||||||||||||
| Page of pages | ||||
|
DESCRIPTION OF IMPROVEMENTS: OBSERVED DEPRECIATION |
||||
| Condition of Building | ||||
| Physical Depreciation – Curable | ||||
| Physical depreciation represents a loss in market value due to physical wear and tear that occurs over the lifetime of an improvement. When physical depreciation is considered curable, it means correcting or repairing the depreciation is economical. For the correction or repair to be economical, the cost to cure must be lower than the value or utility the repair adds to the property. Curable physical depreciation exhibited by the subject property includes the repair of the upstairs plumbing which serves the bathtub. Currently, the owner is unable to use the bathtub due to a leak in the plumbing. Because the subject property is a newer, high-end home, the value of this item to the homes utility is greater than the cost to fix the problem. Therefore, the plumbing should be fixed. | ||||
| Physical Depreciation – Incurable
Physical depreciation represents a loss in market value due to physical wear and tear that occurs over the lifetime of an improvement. Incurable physical depreciation represents a depreciated item which it does not make financial sense to fix. The subject properties front door has become slightly warped but still provides the needed function of a front door. The cost to replace the large custom door is greater than the utility or value the replacement would add as the door still functions. |
||||
| Short-lived: represents items that have a shorter life-expectancy then the life of the home or building. They typically have a life-expectancy of 25 years depending on the cost and overall quality. The subject’s gas-fired furnace, which was installed after the completion of the construction of the home, is nearing the end of its 12-year life-expectancy. This item will need to be replaced soon, though depending on the quality of manufacturing, it could serve its utility past the 12-year life expectancy. | ||||
| Long-lived: represents items which have an expected remaining economic-life that is the same length as the structure. Examples of this would include the foundation and the structural framing of floor, walls and the roof. | ||||
| Age concept | No. of years | |||
| Chronological age | 11 | yrs. | ||
| Effective age | 7 | yrs. | ||
| Economic life | 75 | yrs. | ||
| Remaining economic life | 64 | yrs. | ||
| Justification of Effective Age and Economic Life: | ||||
| The effective age is an estimate of a buildings age, determined by the condition and utility of the property, not the actual chronological age. The appraiser must also consider the buildings to which the subject is competitive with within its respected market place. If a building is well maintained the effective age can be less that its actual age, or vice versa. The subject’s effective age is lower than the chronological age because the subject exhibits modern features and regular maintenance is evident. The subject’s modern features include a luxury style kitchen, hardwood flooring, and high-quality windows. When comparing the subject to similar houses in the immediate market, the subject exhibits a stylish design, high quality exterior materials, and is in equal or superior condition. Taking the above mentioned characteristics into consideration, the subject is deemed to have an effective age of 7 years.
The economic life refers to the period of time over which the improvements will contribute to the overall property. An appraiser should take physical age, quality and the condition of the building into account when calculating economic age. The appraiser should also consider the current economic cycle, when similar buildings undergo major renovation, when similar lands have been rezoned to more intensive uses and when demolition permits are issued for similar buildings. The home is considered in very good condition as regular maintenance is evident. As mentioned above, the exhibits modern features which include a luxury style kitchen, hardwood flooring, and high-quality windows. The subject also exhibits a stylish exterior design, high quality exterior materials, and is in equal or superior condition to when compared to similar houses in the immediate market. The current economic conditions in the Bonnie Doon neighbourhood and region are positive as GDP is expected to grow in 2017, rebounding from the prior year’s contraction. Demand in the neighborhood is also strong, most homes stay on the market for under 30 days, and the neighbourhoods close location to the Edmonton downtown core provides residents access to upper-middle class employment. Similar homes in the neighbourhood have not needed renovations or demolition, as they are not that old. When analyzing similar homes of a greater age, the renovation of the roof is often required around 15 years of age. No homes of similar age have required demolition; however, 1950’s bungalows in the neighbourhood have undergone significant renovation or demolition. Taking this into account, and assuming similar quality of construction, the subject is deemed to have an economic life of 75 years. Therefore the remaining economic life is 64 years, or the difference between the effective age and the economic life. (75 – 7= 64) |
||||
| Functional Obsolescence refers to items which are obsolete, inadequate or super-adequate which may diminish the utility and thus, the value of the improvement. The subject property exhibits a deficiency as it does not have a finished basement. Most homes of similar characteristics and size in the neighbourhood exhibit a finished basement, as it represents a significant increase to the usable area within a home. This functional obsolescence is considered curable as the basement could be completed, adding to the usable area of the home. | ||||
| External Obsolescence is a loss in utility which impacts value that is caused by an external factor. A possible external obsolescence that could impact the subject is the construction of an LRT line in the north section of the neighbourhood. There is the possibility that this line negatively impacts traffic, as previous LRT lines have done in recent years. This could have a negative impact on the subject value should it cause traffic congestion problems. | ||||
| Page of pages |
|
HIGHEST AND BEST USE ESTIMATE |
|
Definition |
| Highest and best use is defined in the text Appraisal of Real Estate (3rd Canadian edition) as “the reasonably probable and legal use of vacant land or an improved property that is physically possible, legally permissible, appropriately supported, financially feasible, and that results in the highest value”. |
|
Analysis and support of highest and best use of the site, as if vacant |
| The analysis of highest and best use commences with a review of the site as if vacant and is analyzed using the following criteria: physically possible, legally permissible, financially feasible and maximally productive.
The writers analysis of what is physically possible to build on the subject site took into account the following factors: size, shape, topography, soil bearing capacity, servicing, exposure, location and access. The analysis concluded the site is of rectangular shape, exhibiting a generally flat topography and full municipal servicing. The soil was concluded to have the needed bearing capacity to support a typical 2-storey structure single-family or multi-family structure, as the current improvements represent a large single-family home. In regards to access and exposure, the site is located at the end of a dead-end interior residential road which provides sufficient access, though some traffic congestion and lack of parking is evident due to the roads use as an access point into Mill Creek Ravine. To conclude, the site fully supports a single-family development. Development of a multi-family structure would risk causing traffic congestion and a shortage of parking for residence, but may still be considered. The writer’s analysis of what legally permissible developments could take place on the subject site took into account the current land-use zoning. The subject falls under RF3 zoning, which states an allowance of: “Single Detached Housing and Semi-detached Housing while allowing small-scale conversion and infill redevelopment to buildings containing up to four Dwellings under certain conditions.” Therefore, the site could be developed into a two dwelling, three dwelling or four dwelling multi-family structure, as well as its current use as a single-family structure. Research into the possibility of a rezoning scenario which would allow a higher density development, found no indication of any planned zoning changes taking place in the foreseeable future (1). The writer also took into account the principle of conformity, which states land must be utilized in a manner that reasonably conforms with the existing standards of the area in order to maintain maximum value (2). The subject’s neighbourhood exhibits a wide range of single-family housing styles, as well as some small multi-dwelling structures. The variations in style can attributed to the age of the neighbourhood, as it is a mature area that has been undergoing infill development for many years. In applying the principle of conformity to the subjects land, it is noted that multi-dwelling developments have only been approved on corner lots that exhibit sufficient traffic flow and provide a large enough area to building a parking area. This eliminates the probability of a multi-dwelling development and lends itself to the notion that the subjects land would be developed as a single-family residence. (2) http://www.century21.ca/cheryl.sebrins/blog/Principles_of_Value The development of the vacant land as a single-family residence or multi-dwelling residence is considered financially feasible. This is because the subject neighbourhood is highly desired and the demand for such a development is strong. The comparables used in the direct comparison approach are examples of large single-family homes that sold recently, all of which spent less than a month on the market. As the city grows and the region returns to favorable economic conditions, the demand for such a development is only anticipated to increase. Lastly, the writer took into account the maximally productive criteria, which looks to identify the type of improvement which would offer the greatest value, or that is the most profitable. Developing a multi-dwelling condo structure would most likely create the most profit for a developer, but it has already been concluded that this type of development would most likely not be approved by council given the subjects location. Therefore, if the site was vacant a single-family home development would provide the greatest value or profit to a developer. |
|
Discussion of adequacy of the existing improvement(s) |
| The subject property has been developed with a two-storey wood-frame single family dwelling which exhibits 2,700 sq. ft. The subject features a concrete foundation and unfinished basement. The subject site features full-municipal servicing, extensive rear and front landscaping and a rear garden area. The property currently conforms to its current zoning, the RF3 – Small Scale Infill Development land use classification. The subject is considered to be in very good condition, as regular maintenance is evident. The subject exhibits modern features which include a luxury style kitchen, hardwood flooring, and high-quality windows.
The demand for properties such as the subjects is very high at the moment, evident as most comparable properties have spent less than 30 days on the market. Furthermore, economic conditions in the region have continued to improve over the last year, increasing anticipated future demand. |
|
Conclusion and support of highest and best use as improved |
| The development of a single-family residence meets the highest and best criteria as it is physically possible, legally permissible, financially feasible, and maximally productive. An analysis of the market found a high demand for such a property, which is anticipated to grow as economic conditions continue to improve. The highest and best use of the subject property is a single-family residence. |
| Page of pages | ||||
|
COST APPROACH – LAND VALUE |
||||
|
Data Comparison Chart |
||||
| Item | Subject | Comparable no. 1 | Comparable no. 2 | Comparable no. 3 |
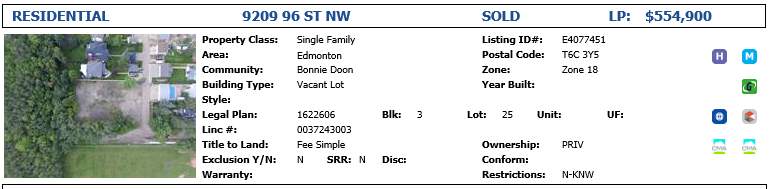
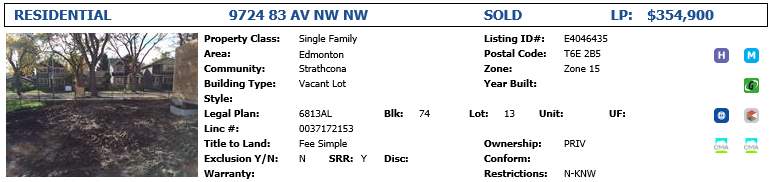
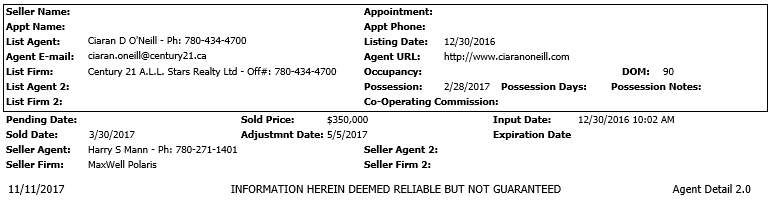
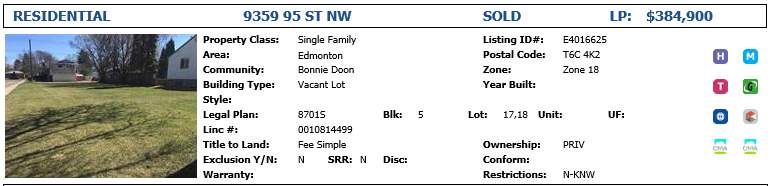
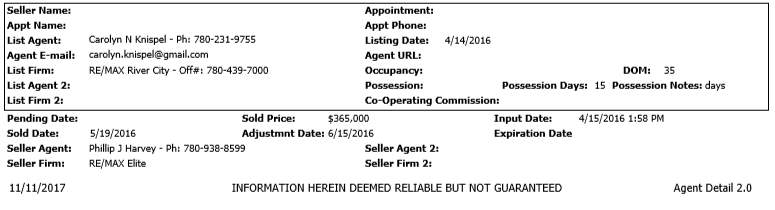
| Address | 9603 88 Avenue NW | 9209 96th Street NW | 9724 83rd Avenue NW | 9359 95th Street NW |
| Legal description | Plan 3737 AI, Block 3, Lot 15 & 16 | Plan 1622606, Block 3, Lot 25 | Plan 6813AL, Block 74, Lot 13 | Plan 8701S, Block 5, Lot 17 & 18 |
| Sale date | – | September 27, 2017 | March 30th, 2017 | May 19, 2016 |
| Instrument no. | – | – | – | – |
| Registration date | – | August 11th , 2017 | December 30, 2016 | April 15, 2016 |
| Vendor | – | – | – | – |
| Purchaser | – | – | – | – |
| Sale price | – | $540,000.00 | $350,000.00 | $365,000 |
| Right conveyed | Fee simple | Fee Simple | Fee Simple | Fee Simple |
| Financing | – | None | None | None |
| Conditions of sale | – | None | None | None |
| Expenses made immediately after purchase | – | None | None | None |
| Time difference | – | 2 months | 8 months | 18 months |
| Zoning | RF-3 | RF-3 | RF-3 | RF-3 |
| Location | Same neighbourhood, similar lot location features (both subject & #1 back onto ravine) | Inferior lot location within neighbourhood | Inferior location within neighbourhood | |
| Frontage/depth | 66” x 160” | 35” x 175” (ft.) | 33” x 131” (ft.) | 32.80” x 131.20” (ft.) |
| Lot area | 10,560 sq. ft. | 6,125.00 sq. ft. | 4,323,00 sq. ft. | 4,303.36 sq. ft. |
| Topography | Level | Level | Level | Level |
| Utilities | Fully Serviced | Fully Serviced | Fully Serviced | Fully Serviced |
| Interior/corner lot | Interior | Interior/corner alleyway | Interior | Corner resulting in exposure to higher traffic road (Writer believes these factors are offsetting) |
| Local Improvement Charges | None | None | None | None |
| Easements/Rights of Way | – | – | – | – |
| Comments | – | No adjustment required | Time adjustment required | Location & time adjustment |
| Page of pages | |||
|
COST APPROACH – LAND VALUE (continued) |
|||
|
Adjustment Chart |
|||
| Item | Comparable no. 1 | Comparable no. 2 | Comparable no. 3 |
| Sale price | $540,000.00 ($15,428.57 fr. ft.) | $350,000.00 ($10,606.06 fr. ft.) | $365,000.00 ($11,128.04 fr. ft.) |
| Real property rights conveyed adjustment | Fee Simple | Fee Simple | Fee Simple |
| Adjusted price | ($15,428.57 fr. ft.) | ($10,606.06 fr. ft.) | ($11,128.04 fr. ft.) |
| Financing adjustment | – | – | – |
| Conditions of sale adjustment | – | – | – |
| Expenses made immediately after purchase adjustment | – | – | – |
| Adjusted price | ($15,428.57 fr. ft.) | ($10,606.06 fr. ft.) | ($11,128.04 fr. ft.) |
| Date of sale adjustment | September 27, 2017 | March 30th, 2017 | May 19, 2016 |
| Adjusted price | ($15,428.57 fr. ft.) | +2%
($10,818.18 fr. ft.) |
+2.5%
($11,406.24 fr. ft.) |
| Other adjustments as required: | – | – | – |
| – Zoning | – | – | – |
| – Location | – | +10%
($11,899.99 fr. ft.) |
+10%
($12,546.86 fr. ft.) |
| – Depth | – | – | – |
| – Lot area | – | – | – |
| – Topography | – | – | – |
| – Utilities | – | – | – |
| – Interior/corner lot | – | – | – |
| – Local Improvement Charges | – | – | – |
| – Easements/Rights of Way | – | – | – |
| Total Other Adjustments | – | – | – |
| Final Adjusted Sale Price | $15,428.57 fr. ft. | $11,899.99 fr. ft | $12,546.86 fr. ft |
| Adjusted unit sale price / frontage | $15,428.57 fr. ft. | $11,899.99 fr. ft. | $12,546.86 fr. ft. |
| For reconciliation purposes: | |||
| Total Adjustment | – | $42,000.00 | $45,625.00 |
| Total adjustment as % of Sale Price | – | 12% | 12.5% |
| Page of pages | ||||||||||||||||||||||
|
COST APPROACH – LAND VALUE (continued) |
||||||||||||||||||||||
|
Adjustment Analysis in Order: 1. Property Rights 2. Financing 3. Motivation 4. Expenses made immediately after purchase 5. Time 6. Other |
||||||||||||||||||||||
Assumptions:
Time Adjustments (Market Conditions):
(*) https://www.zolo.ca/edmonton-real-estate/trends Location Adjustment:
Paired Sales Analysis: The four sales used in the paired sales analysis were similar to both the subject and each other. There was no time adjustment made because the sales dates were within a month of each other.
The paired sales analysis indicates that purchasers are willing to pay 7.5% to 12.5% more for a property that backs onto the ravine. A 10% adjustment is therefore warranted for the inferior location of comparables 2 & 3. Reconciliation: The comparable sales have indicated a price per front foot range varying from $11,899.99 to $15,428.57. Overall, in recognizing all adjustments as discussed, a value per front foot towards the upper end of this range, between $14,000.00 and $15,500.00, is applicable to the subject. In recognizing the similarities between comparable 1 and the subject, as no adjustment was warranted for location or time, the subject’s value per front foot should be similar to this comparable. The subject’s value per front foot is estimated at $15,000.00. Therefore, the market value of the subject is calculated to be $990,000.00 (66” front feet x $15,000.00). |
 Final Estimate of Site Value: $990,000.00 Final Estimate of Site Value: $990,000.00 |
| Page of pages | |||||||||||||||||
|
COST APPROACH – COST ANALYSIS OF IMPROVEMENTS |
|||||||||||||||||
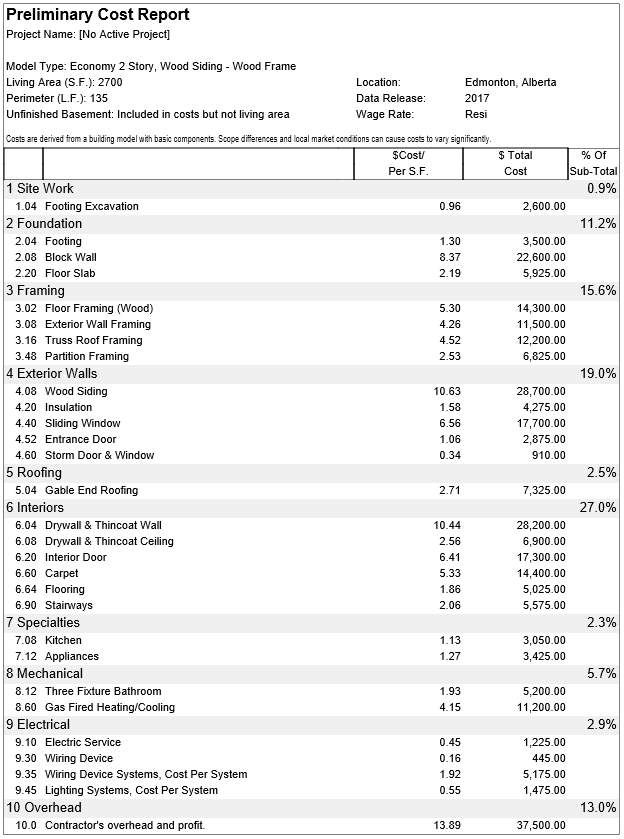
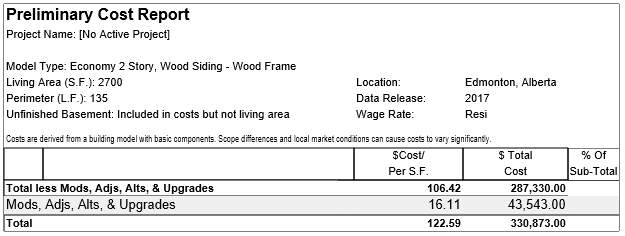
| Reproduction Cost New (RCN) Estimate | |||||||||||||||||
| Cost Manual (name): | Cost Works 2017 | [ X ] Worksheet and excerpts attached | |||||||||||||||
| as Schedule ___ | |||||||||||||||||
| RCN estimate | $330,873.00 | ||||||||||||||||
| Contractors: | Name and Address | RCN Estimate | |||||||||||||||
| $ | |||||||||||||||||
| RCN conclusion and rationale: Accounting for a 15% entrepreneurial/developer profit. | |||||||||||||||||
| Subtotal: $330,873.00 + $49,630.95 ( .15 x $330,873.00) = | $380,503.95 | ||||||||||||||||
| Extras (state source): | https://www.decks.com/calculators/cost-of-building-a-deck | ||||||||||||||||
| (not included in above RCN estimate) | |||||||||||||||||
| Attached deck/patio | $1,394.85 | ||||||||||||||||
| Porches | $ | ||||||||||||||||
| Attached garage/car port | $ | ||||||||||||||||
| Basement finish | $ | ||||||||||||||||
| $ | |||||||||||||||||
| $ | |||||||||||||||||
| $ | |||||||||||||||||
| Subtotal: | $1,394.85 | ||||||||||||||||
| Total Reproduction Cost New of Building(s) | $381,898.80 | ||||||||||||||||
| Site Improvements: (see BUSI 330.9) | |||||||||||||||||
| Item | Cost New | Age/Life | Depreciated Value | ||||||||||||||
| Landscaping | $8,000.00 | – | $8,000.00 | ||||||||||||||
| Backyard Fencing | $4,500.00 | 11/25 | $2,520.00 | ||||||||||||||
| Front Walkway | $2,500.00 | 10/20 | $1,250.00 | ||||||||||||||
| Back Walkway/Paving Stone BBQ Area | $7,500.00 | 10/20 | $3,750.00 | ||||||||||||||
| Driveway | $5,000.00 | 11/20 | $2,250.00 | ||||||||||||||
| $ | / | $ | |||||||||||||||
| $ | / | $ | |||||||||||||||
| Total Depreciated Value of Site Improvements | $17,770.00 | ||||||||||||||||
| Page of pages | |||||
| COST APPROACH – DEPRECIATION | |||||
| Age-Life Method | |||||
| Item | RCN | Effective Age | Economic Life | % Dep. | Accrued Depreciation |
| Hardwood Flooring
Roof/Shingles Central Air Exterior Doors/ Windows Kitchen Cabinet & Counter Tops |
$5,025.00
$7,325.00 $11,200.00 $21,485.00 $3,050.00 |
11
11 11 11 11 |
50
25 15 25 45 |
22%
44% 73.3% 44% 24.4 |
$1,105.50
$3,223.00 $8,209.60 $9,453.40 $744.20 |
| Total | $48,085.00 | $22,735.70 | |||
Description of process applied and justification of estimate:
The estimation of the subject property’s replacement cost as new (RCN), was calculated using Cost Works, a professional construction cost software. The cost summary sheet is provided in the addendum of this report and details the specific costs that contributed to the overall estimate. Entrepreneurial Profit was then accounted for by adding a 15% premium to the initial cost estimate. A 15% premium on the initial cost represents a standard input for Entrepreneurial Profit and is considered a fair and reasonable measure.
The Total Replacement Cost New is $381,898.80.
The site improvement component of this estimate included cost estimates for the subjects landscaping, backyard fence, front walkway, back walkway and BBQ area and the driveway. These cost estimates are not as reliable as the estimates provided by Cost Works, or a local contractor. They represent rough estimates, and there value is based off historical cost data found on the internet. A more reliable estimate would be based off historical data that was region specific, or one provided by a local contractor. After site improvement costs were estimated, the total depreciated value of the site improvements was calculated using the age/life method. This is done by dividing the improvements effective age by its economic life, which estimated the Total Depreciated Value of the Site Improvements to be $17,700.00.
The age/life method is then applied to the subject to calculate the total Accrued Depreciation. The totalAccrued Depreciation is estimated to be $22,735.70
| Page of pages | ||||||||||
| COST APPROACH – SUMMARY | ||||||||||
| REPRODUCTION COST NEW | $381,898.80 | |||||||||
| Less Total Depreciation | $22,735.70 | |||||||||
| DEPRECIATED COST OF BUILDING(S) | $359,162.30 | |||||||||
| Plus Depreciated Site Improvements | $17,770.00 | |||||||||
| Plus Site Value | $990,000.00 | |||||||||
| VALUE INDICATED BY COST APPROACH | $1,366,932.30 | |||||||||
| Rounded to: | $1,367,000.00 | |||||||||
| Cost Approach Conclusion: Market Value = |
|
|||||||||
| Page of pages | ||||||||||||
| DIRECT COMPARISON APPROACH | ||||||||||||
| Data Comparison Chart | ||||||||||||
| Item | Subject Property | Comparable No. 4 | Comparable No. 5 | Comparable No. 6 | ||||||||
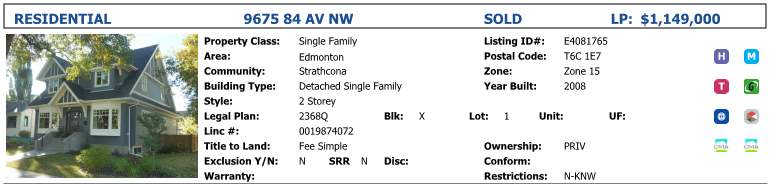
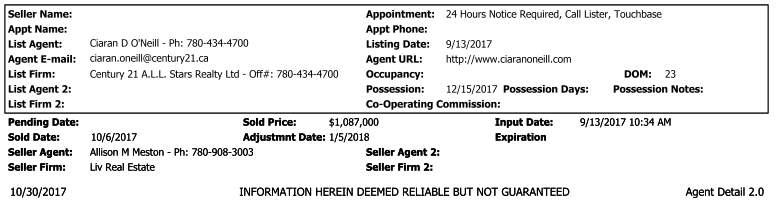
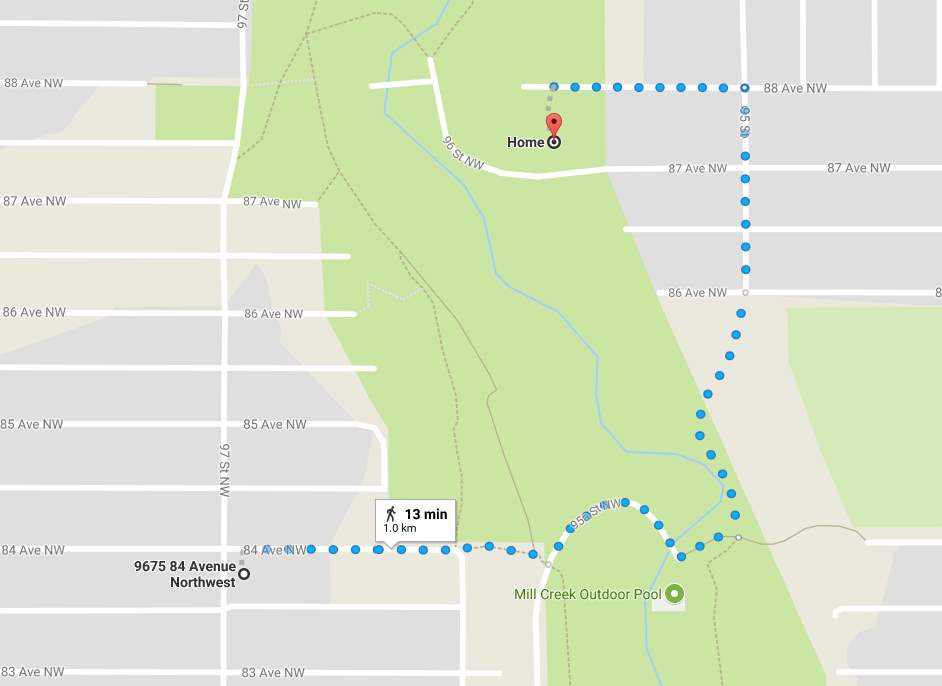
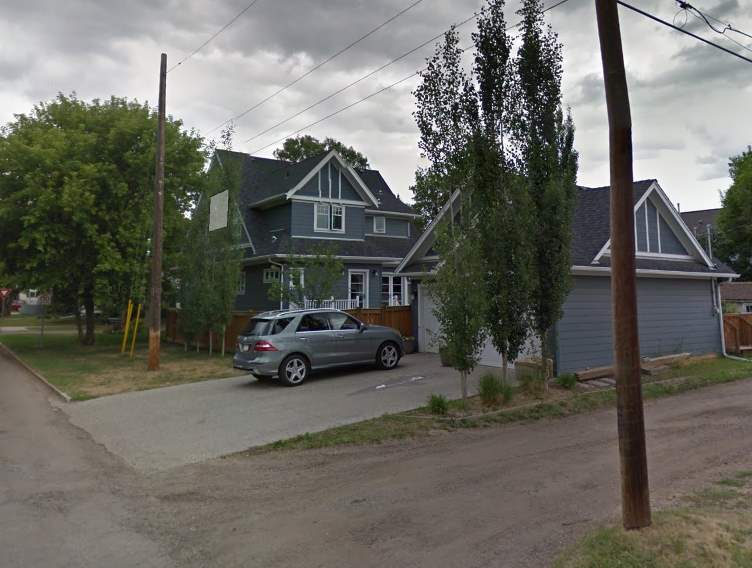
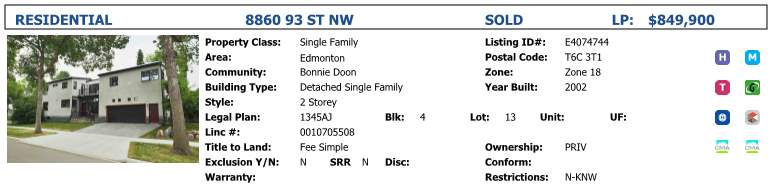
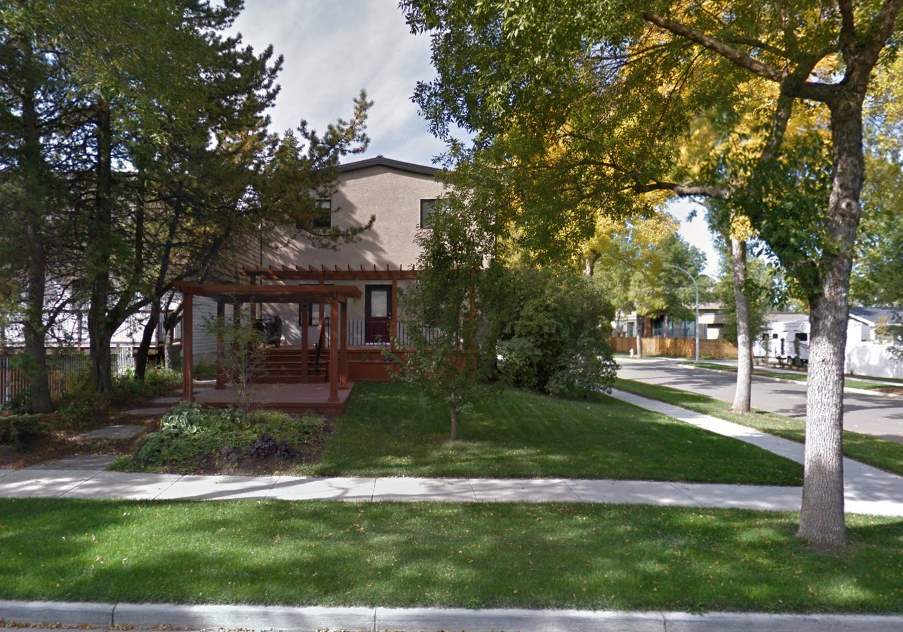
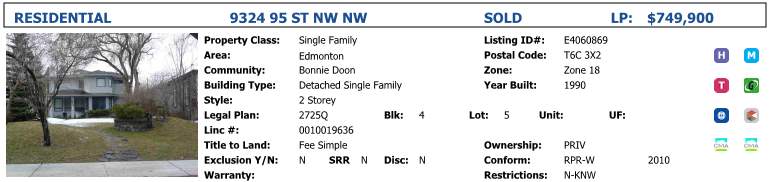
| Address | 9603 88 Avenue NW | 9675 84th Avenue NW | 8860 93rd Street NW | 9324 95th Street NW | ||||||||
| Legal description | Plan 3737AI, Block 3, Lot 15 & 16 | Plan 2368Q, Block X, Lot 1 | Plan 1345AJ, Block 4, Lot 13 | Plan 2725Q, Block 4, Lot 5 | ||||||||
| Sale date | – | October 6th, 2017 | July 31st, 2017 | May 5th, 2017 | ||||||||
| Instrument no. | – | – | – | – | ||||||||
| Registration date | – | September 13th, 2017 | July 21st 2017 | April 25th, 2017 | ||||||||
| Vendor | – | – | – | – | ||||||||
| Purchaser | – | – | – | – | ||||||||
| Sale Price | – | $1,087,000.00 | $846,000.00 | $735,000.00 | ||||||||
| Rights conveyed | Fee Simple | Fee Simple | Fee Simple | Fee Simple | ||||||||
| Financing | – | – | – | – | ||||||||
| Conditions of sale | – | – | – | – | ||||||||
| Expenses made immediately after purchase | – | – | – | – | ||||||||
| Time difference (mos.) | 0 | 1 month | 4 months | 6 months | ||||||||
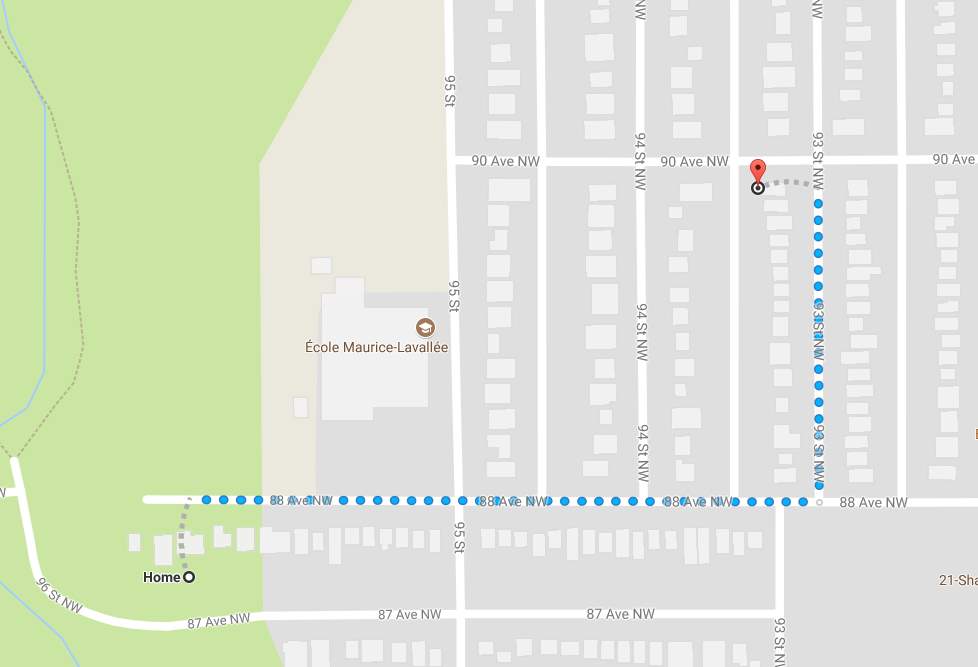
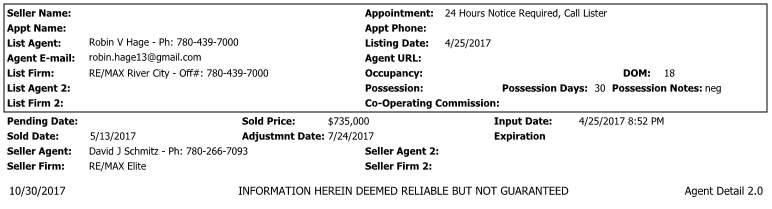
| Distance from subject (blocks) | 0 | Approx. 1450” ft. | Approx. 1,350 ft. | Approx. 2,400 ft. | ||||||||
| Location | Bonnie Doon | Strathcona | Bonnie Doon | Bonnie Doon | ||||||||
| Bldg size (above grade) | 2,700 sq. ft. | 2,404 sq. ft. | 2,373 sq. ft. | 2,626.42 | ||||||||
| Type/Quality Construction | Wood frame, high quality | Wood frame, high quality | Wood frame, high quality | Wood frame, high quality | ||||||||
| Energy efficiency | Average | Average | Average | Average | ||||||||
| Design and appeal | Good | Good | Good | Good | ||||||||
| Age | 11 years | 9 years | 15 years | 27 years | ||||||||
| Condition | Good | Good | Good | Good | ||||||||
| Room Count | Ttl | Bds | Bth | Ttl | Bds | Bth | Ttl | Bds | Bth | Ttl | Bds | Bth |
| 8 | 3 | 2 | 13 | 4 | 4 | 10 | 4 | 2 | 11 | 4 | 3 | |
| Basement | Unfinished | Finished | Finished | Finished | ||||||||
| Air conditioning | Central air | Central Air | Central Air | Central Air | ||||||||
| Heating | Forced air | Forced Air/In-floor heating | Forced Air | Forced Air | ||||||||
| Fireplace | None | 1 | None | 1 | ||||||||
| Appliances | 5 | 5 | 5 | 5 | ||||||||
| Lot size | 66” x 160” (ft.) | 40” x 127” (ft.) | 48” x 120” (ft.) | 50” x 185” (ft.) | ||||||||
| Zoning | RF-3 | RF-3 | RF-3 | RF-3 | ||||||||
| Garage/carport | Double Attached | Double Detached | Double Attached | Double Attached | ||||||||
| Local Improvement Charges | – | – | – | – | ||||||||
| Other comments: | ||||||||||||
| Page of pages | |||
|
DIRECT COMPARISON APPROACH (continued) |
|||
| Adjustment Chart | |||
| Item | Comparable no. 4 | Comparable no. 5 | Comparable no. 6 |
| Sale price | $1,087,000.00 | $846,000.00 | $735,000.00 |
| Real property rights conveyed adjustment | Fee Simple | Fee Simple | Fee Simple |
| Adjusted price | $1,087,000.00 | $846,000.00 | $735,000.00 |
| Financing adjustment | – | – | – |
| Conditions of sale adjustment | – | – | – |
| Expenses made immediately after purchase adjustment | – | – | – |
| Adjusted price | $1,087,000.00 | $846,000.00 | $735,000.00 |
| Date of sale adjustment | (+3.03%) | (-3.33%) | (+5.71%) |
| Adjusted price | $1,119,936.10 | $817,828.20 | $776,968.50 |
| – Location | (-12.5%)
$979,944.08 |
– | – |
| – Building size | – | – | – |
| – Construction | – | – | – |
| – Energy efficiency | – | – | – |
| – Design and appeal | – | – | – |
| – Age | – | – | – |
| – Condition | – | – | – |
| – Room count | – | – | – |
| – Basement unfinished area | – | – | – |
| – Basement/finished below grade area | (-$20,000.00) | (-$20,000.00) | (-$20,000.00) |
| – Air conditioning | – | – | – |
| – Heating | – | – | – |
| – Fireplace | (-$5,000.00) | – | (-$5,000.00) |
| – Appliances | – | – | – |
| – Lot size | 26” x $15,000.00 fr. ft.
(+390,000.00) |
18” x $15,000.00 fr. ft.
(+270,000.00) |
16” x $15,000.00 fr. ft.
(+240,000.00) |
| – Zoning | – | – | – |
| – Garage/carport | – | – | – |
| – Local Improvement Charges | – | – | – |
| – Ravine backyard exposure | +$111,993.60 (10%) | +$81,782.82 (10%) | +$77,696.85 (10%) |
| Total Other Adjustments | |||
| Final Adjusted Sale Price | $1,456,937.68
($606 sq. ft.) |
$1,149,611.02
($484 sq. ft.) |
$1,069,665.35
($407 sq. ft.) |
| For reconciliation purposes: | |||
| $369,937.96 | $303,611.02 | $334,665.35 | |
| Total Adjustment | |||
| Total adjustment as % of Sale Price | 34% | 36% | 45% |
| Page of pages |
|
DIRECT COMPARISON APPROACH (continued)
|
| Adjustment Analysis in Order: 1. Property Rights 2. Financing 3. Motivation 4. Expenses made immediately after purchase 5. Time 6. Other |
|
Time Adjustments (Market Conditions):
The average home price data used in this analysis was gathered from: https://www.zolo.ca/edmonton-real-estate/trends
- Comparable 4: Market data shows that average home price during the start of October 2017 was $395,000.00, increasing to approximately $407,000.00 during the start of November 2017. This represents an increase of $12,000.00 or 3.03%. Therefore, an upward adjustment of 3.03% is warranted to comparable #4.
- Comparable 5: Market data shows the average home price at the end of July 2017 was $421,000.00, decreasing to approximately $407,000.00 during the start of November 2017. This represents a decrease of $14,000.00 or 3.33%. Therefore a downward adjustment of 3.33% is warranted to comparable #5.
- Comparable 6: Market data shows the average home price at the start of May 2017 was $385,000.00, increasing to approximately $407,000.00 during the start of November 2017. This represents an increase of $22,000.00 or 5.71%. Therefore, a 5.71% upward adjustment is warranted to comparable #6.
Paired Sales Analysis for Neighbourhood Adjustment:
Four real market sales were used in a paired sales analysis to determine a location adjustment for comparable #4. All sales used were similar to the subject and comparable.
Paired set #1.
| Paired Set | Sale Price | Sale Date |
| 9041 94th Street NW | $901,000.00 ($371.00 sq. ft.) | October 20, 2017 |
| 10018 88th Avenue NW | $985,000.00 ($443.00 sq. ft.) | September 18, 2017 |
Time Adjustment:
Average home price Sept 15th, 2017 = $403,000.00
Average home price Oct 17th, 2017 = $400,000.00
Price increase/decrease = (-0.74%)
| Paired Set | Adjusted Sale Price | % Price Difference |
| 9041 94th Street NW | $374.00 sq. ft. | 18.40% |
| 10018 88th Avenue NW | $443.00 sq. ft. |
Paired set #2.
| Paired Set | Time Adjusted Sale Price | Sale Date |
| 9060 92nd Street NW | $832,500.00 ($389.00 sq. ft.) | August 31st, 2017 |
| 9726 83rd Avenue NW | $927,000.00 ($416.00 sq. ft.) | May 29th, 2017 |
Time Adjustment:
Average home price May 27th, 2017 = $382,500.00
Average home price August 30th, 2017 = $400,000.00
Price increase/decrease = (+4.57%)
| Paired Set | Time Adjusted Sale Price | % Price Difference |
| 9060 92nd Street NW | $832,500.00 ($389.00 sq. ft.) | 11.80% |
| 9726 83rd Avenue NW | $927,000.00 ($435.00 sq. ft.) |
The paired sales analysis revealed an18.40% and 11.80% price premium given to home in the Strathcona neighbourhood. More weight will be given to paired sale set #2 due to the closer similarities to the subject and comparable #4. A downward adjustment of 12.5% is warranted to comparable #4 because it is located in a superior neighbourhood.
Unfinished Basement & Fire Place Adjustment:
All three comparables have finished basements whereas the subject does not. Cost Works, the program used in the cost approach estimated finishing costs would fall between $15,000.00 and $40,000.00 dollars. A conservative cost estimate and downward adjustment of $20,000.00 dollars was used on all comparables. The conservative cost estimate was due to the writer not having sufficient information on the types of finishes used in the comparable sales basements.
Research into the cost of a fire place revealed an average cost of $4,500.00 to $7,000.00. The writer used a conservative cost estimate and downward adjustment of $5,000.00 dollars on comparable #4 and #6
Source for fireplace costing information: https://www.howmuchisit.org/gas-fireplace-cost/
Lot Size Adjustment:
The comparable sales used in the land cost approach indicated a price per front foot range varying from $11,899.99 to $15,428.57. The subject’s value per front foot was estimated at $15,000.00.
- Comparable #4 had 26” less fr. ft. than the subject, warranting an upward adjustment of (26” x $15,000.00) +$390,000.00.
- Comparable #5 had 18” less fr. ft. than the subject, warranting an upward adjustment of (18” x $15,000.00) +$270,000.00.
- Comparable #6 had 16” less fr. ft. than the subject, warranting an upward adjustment of (16” x $15,000.00) +$240,000.00.
The writer understands these calculations represent significant adjustments to value, but due to the subject’s unusual lot size, no better comparables could be found.
Ravine Exposure Adjustment:
This adjustment was based off the paired sales analysis used in the land cost approach component of this report. The paired sales analysis indicated that purchasers were willing to pay 7.5% to 12.5% more for a property that backs onto the ravine. Using this information, a 10% upward adjustment was made to all three comparables to account for the premium the market is willing to pay for a lot that backs onto the ravine.
| Reconciliation | ||||
| Final Adjusted Sale Prices:
Comparable #4: $1,456,937.68 Comparable #5: $1,149,611.02 Comparable #6: $1,069,665.35 Indicated Range: $1,070,000.00 to $1,455,000.00 The comparable sales have indicated a value range between $1,070,000.00 and $1,455,000.00. All three comparables represent a reasonable estimate of the market value of the subject property and are all recent sales that required minimal time adjustments. All three comparables warranted significant lot size adjustments due to the unique size of the subject property. The lot size adjustments applied to these properties were derived from an in-depth analysis of land prices in the surrounding area. Although the warranted adjustments were derived from an aggressive price per front foot value, they should still be considered accurate due to the subject’s unusually large size, backyard ravine exposure and location which present a rare buying opportunity. Comparable #4 & #5 exhibit improvements that are most similar to the subject and will be given the most weight in estimating the subject’s value. Therefore, a range between $1,200,000.00 and $1,450,000.00 is applicable to the subject. Overall, in recognizing all adjustments as discussed, the subject’s value estimate would be fall in the upper-end of the above mentioned range. Therefore, the market value of the subject is estimated at $1,400,000.00 or $520.00 sq. ft.
RECONCILIATION OF VALUE INDICATIONS AND FINAL ESTIMATE OF VALUE Indicated value by Cost Approach: $ 1,367,000.00 Indicated value by Direct Comparison Approach: $ 1,400,000.00 The appraisal process represents an orderly program in which market data is analyzed and used to estimate the value of the subject property. Generally, there are three main approaches used to estimate market value which include the Cost Approach, Income Approach and Direct Comparison Approach. The Income Approach is more often used for investment properties and derives its estimated market value from the income which the property produces. When estimating residential home values the income approach is not typically used, as like the subject property there is no income stream in place, and therefore was not used in this analysis. The Cost Approach represents a basic appraisal technique which is helpful in estimating value in all types of properties. When using this approach, the subject’s site and improvements are viewed as separable, and a value is estimated for each. Thereafter, depreciation estimations are calculated and subtracted from the improvements cost estimate. The estimated subject value in this analysis was $1,367,000.00. The Direct Comparison Approach involves an analysis of the subject and similar properties. The attributes and characteristics of the selected properties are contrasted and compared against the subject. The approach applies the Principle of Substitution, which assumes that a potential buyer would pay no more for a property than the cost of a similar building and site that serves the same utility. Assuming there is sufficient market data to compare the subject to, this approach provides a solid test of value, as it considers the actions of buyers and sellers in the market place. In this analysis the comparables used were taken from MLS (Multiple Listing Service), and therefore represent real market data. Adjustments were made to these comparables using historical average home price market data to adjust for time, as well as, a paired sales analysis to adjust for neighbourhood using actual market transactions. It should be noted that an adjustment was made to account for the subject’s backyard ravine exposure, and this adjustment was based off a hypothetical paired sales analysis. This adjustment was also made to the land sale comparables during the cost approach. Due to the backyard ravine exposure adjustment being used on both approaches, and the general cost data used by Cost Works, more weight will be given to the Direct Comparison Approach in this analysis. Overall, in place greatest emphasis on the value estimate derived from the Direct Comparison Approach, the value market value for the subject property as of November 15th, 2017 is estimated to be $1,375,000.00. The estimated exposure time for this property is 20 days.
|
| Page of pages | ||||||||||||
| The Market Value, as defined, for the subject property as of | ||||||||||||
| (Date) | ||||||||||||
| is estimated to be | $ | |||||||||||
| The exposure time for the subject property has been estimated at . | ||||||||||||
| CERTIFICATION | ||||
I certify that, to the best of my knowledge and belief:
(Date) |
||||
| ($ ) | ||||
| Signature of Student | Date Signed | |||
Addenda:
Neighbourhood Maps
Floor Plan Sketch
Cost Works Summary
Land Comparables
#1
#2
#3
Comparable 4
Comparable 5

Comparble 6
Cite This Work
To export a reference to this article please select a referencing stye below:
Related Services
View all


Related Content
All TagsContent relating to: "Estate Management"
Estate management concerns the management of land and property in terms of maintenance, preservation, and operation. Traditionally, estate management was reserved for the landed gentry and generally applied to large households with staff. Nowadays, estate management also includes communal areas and access roads on housing estates.
Related Articles

DMCA / Removal Request
If you are the original writer of this dissertation and no longer wish to have your work published on the UKDiss.com website then please: