Determination of Saturation Flow for Bicycles
Info: 23462 words (94 pages) Dissertation
Published: 16th Dec 2019
Tagged: Social PolicyTransportation
Determination of Saturation Flow for Bicycles & Some of the Characteristics and Behaviours of Cyclist at Signal Controlled Junction on segregated cycling lane
- Table of Contents
2.3 The Main Objectives of the Study
3.1.1 Exclusive Off – Street Bicycle Lane
3.1.4 Two-Way Segregated Cycle lanes
3.2.4 Hold the Left Turning Traffic
3.2.5 Crossing the Cycle Tracks
3.2.6 Cycle Advanced Stop Line (ASLs)
3.2.7 Low Level Cyclist Signals
3.3 MOVA (Microprocessor Optimised VA)
3.3.1 TRANSYT (Traffic Network and Isolated Intersection Study Tool)
3.3.2 SCOOT (Split Cycle and Offset Optimisation Technique)
3.4 Factors Effecting the Saturation Flow
3.5 Saturation flow of Cycle Lanes
3.6 Methods of Measuring the Saturation Flow
3.6.3 The Average Headway Method
3.6.4 Asynchronous Multiple Regression Method
3.6.5 Synchronous Multiple Regression Method
3.6.6 Other Methods of Measuring the Saturation Flow
3.6.7 Passenger Car Unit (PCU)
3.7 Cyclist Behaviour Signal Controlled Junctions
4.1 Road Note 34 Method applied to Bicycles
4.4 LOCATIONS AND SCHEMES CONSIDERED
5.1.2 Flow of Cyclist at Junction Aldgate High Street CS2
5.1.3 Characteristic and behaviour of cyclist at Junction Aldgate High Street CS2
5.1.4 Saturation flow at Junction Cable Street CS3
5.1.5 Flow of cyclist at Junction Cable Street CS3
5.1.6 characteristic and behaviour of cyclist Junction Cable Street CS3
5.1.7 Saturation flow at Junction New Bridge Street CS6
5.1.8 Flow of cyclist at Junction New Bridge Street CS6
5.1.9 Characteristic and behaviour of cyclist Junction New Bridge Street CS6
6.1.2 Characteristics and Behavior of cycle lanes at Signal Controlled Junction
6.1.4 The delays at the CS2 Morning & Evening Peak
6.1.5 The delays at the CS3 Morning & Evening Peak
6.1.6 The delays at the CS3 Morning Peak
8.1 Recommendations for further work
LIST OF ABBREVIATION
TFL Transport for London
ALS Advanced Stop Line
PCU Passenger Car Unit
CS Cycling Superhighway
DFT Department for Transport
LCDs London Cycling Design Standards
TRL Transport Research Laboratory
ATC Automatic Traffic Count
MCC Manual Classified Count
S Saturation Flow
2. CHAPTER: 2
INTRODUCTION
Cycling is becoming more and more popular in London roads, about 700,000 journeys are done daily on cycling and the number of cyclist in London is growing. During peak periods, 2.8% journeys are done in cycling in London; however, the percentage is higher during the rush hours and in central London, significant numbers of cyclist use the commuter routes, which often exceeds 10% of total vehicle flow according (TFL, 2013).
According to Central London Cycle Census, (Tfl, April – May 2013) Over 350,000 cycles were counted across the cycle census site between 06:00-20:00. Cycling was the third largest road based mode across the day in London. In the morning the peak hours, it is the second largest mode pedal cycle 16% after Car/LGV.
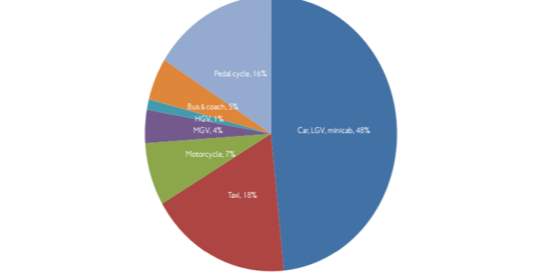
Figure 1: Source Central London Cycle Census, (Tfl, April – May 2013)
In this report, we will be determining the saturation flow for cycles at signal-controlled junction this will involve observation of the capacity on the cycle lanes as there no methods yet developed to measure the capacity of the segregated cycle lanes at the signal control junction in the UK.
In this project and report, we will analyze in depth and discuss in details the cycle lanes, which are reaching high level of saturation flow and some of the design features and standards of the cycle lanes in central London. In addition, we will also look into the some of characteristics and behavior of the cyclist at signal-controlled junction.
Transport for London is committed to making London road safer all road users specially cyclist, according to (TFL, 2017) year 2015 there was 387 cyclists were involved in collation out of 72 of them were seriously injured or killed, in London Network, to reduce these conflicts of cyclist.
Transport for London; have updated the design features at signal-controlled junction and put new safety tips for cyclist and driver’s campaign, and some of safety design features for cyclist, which be discussed in the literature review on this research.
In this research, we will be looking into the saturation flow of segregated cycle lanes and some of the characteristic and the behavior of the cyclist at the signal-controlled junction, how many of this cyclist are using the segregated cycle,
The Cycling conditions in the city have recently found and widely perceived as unsafe in the public eyes and many people that wanted to travel by cyclist are unsure about the safety of the cycling and cycle lanes due to many dangerous incidents and accidents.
In the UK over the past few years there have been many improvements and developments made in the design and infrastructure of Cycling Superhighways which also includes advanced stop line (ALS) this gives the cyclist more space on the carriageway and the raise driver awareness of cyclist.
All of these developments in the design of cycling super highways in London makes cycling more safe more secure and alternative healthy way of travel.
In most areas average speed of cyclist in London is faster than a motor vehicle, since 2001, there have been 400 percent increase in the number of cycling trips and according to central London cycling census cycling is third largest road based mode across the day in London has 16 % mode share for cycling. (TFL, 2013).
According to TFL (Cycling Design Standard 2016) suggested that the first four Superhighways brought about an average 77 percent increase in cycling on the routes concerned, 30 percent of those cycling trips are new or switched from another mode.
The contribution of the cycling superhighways overall network has increased the number of people using cycling as an alternative healthy way of travel which has been the aspirations set out in the Mayor’s Vision for Cycling (TFL, 2013).
The cycle superhighways program has a large interface with the responsibility of London boroughs and others.
In some cases, where the route is on borough owned roads and there is a needs to be close working between TFL and the boroughs to obtain approvals and buy into any proposals. Transport for London is the highway authority and boroughs are closely involved in the design process because the measures implemented are likely to impact beyond the TFL road network. (TFL, Cycling Design Standard 2016).
Cycling is one of the most important means of transport in some of the cities in Europe; the cities in the Netherlands and Denmark have done more than anyone to promote the use of environmentally friendly mode cycling.
In the Netherlands the bicycle per km is compared to train passenger – km and in Denmark they out number them, in Copenhagen where there are 300 km of cycle track is equal to half the road network length, 25 per cent of trips are done by bicycle, extensive cycling paths have been introduced in several cities.
In many countries and cities, many developments have been projected and concluded in to make cycling paths and priority facilities in cycling highways but progress in this direction has been in general slow. (Urban travel and sustainable development, 1995).
The transport planners now see the cycling in cities as a means of transport worthy of consideration, there is a strong case for encouraging cycling as environmentally friendly form of transport which can be enjoyable useful and cheap to use healthy lifestyle.
Generally, in the big cities up to 250,000 people use cycling if the topography is flat, more people cycle because distances are shorter, and there is less traffic congestion due to the growing number of people using cycling as an alternative mode of travel that is why a special provision for cycling is made.
The amount of people that will cycle in the future will depend on many factors, in the cities where cycle lanes are not provided the cycling number is low.
However, cities like Copenhagen the research shows that since the introduction of the cycling lanes beside all
Main roads, cycling has doubled and 9 percent of work trips are made on cycling. (Richards 1990).
Only in china does the density of cyclist exceed that of vehicles, with one intersection in Beijing used by over 10,000 cyclists in one hour also we have seen similar cycling improvement in many other cities (Jun Meng Yang, 1985), citied by (Richards 1990).
According to research carried out in Amsterdam 57% of the residents, use a cycle to work, and in Copenhagen 52% cycle to work and in Cambridge 30 % use cycle to work and university. (TFL, CIBS, report 2013).
The growing demand of cycling worldwide and the developments of cycling super highways in the London has made it essential and necessary to know the cycling lane capacity.
The main aim of this project and research is to find out the ways to determine the saturation flow for bicycles at signal-controlled junction, on Segregated Superhighway Cycle lane and look in the some of the characteristics and behavior of the cyclist at signal-controlled junction.
We will be measuring the saturation flow of the cycle lanes and find out the capacity of the cycle lanes. If they are exceeding the capacity of use or not because there is some cycling, lanes in Central London, that reach high level of saturation, follow.
In order to calculate and measure the saturation flow of bicycles at signal controlled junctions we will be carrying out site visits and will be using a video equipment surveying technics to determine the saturation flow of the segregated cycling superhighways which are saturated and measure capacity of these cycle lanes. In addition, we will look in the behavior of this cyclist at signal-controlled junction.
The saturations flow is important parameters in the planning design and control of a signal-controlled junction. The saturation flow is the maximum flow that can cross an intersection approach at signal controlled or stop line of an approach when there is a green signal and continuous queue of vehicles/cycle.
The number of traffic that would pass the junction at the green signal is the saturation flow is normally, expressed as passenger car unit PCU/hr.
This project and report is based on Exclusive off Street Bicycle Lanes, Cycling Super Highway is Segregated Cycling Superhighways lanes can be either One-way or Two-way cycle lanes, in this research we will look in to both type of the cycle lanes.
In this research we will be focusing on the cycle lanes that are segregated from the other motor vehicles, these cycle lanes can either be One-way or Two – way.
The cycling lanes is separated by a continuous or bear-continuous physical upstand along links segregated island this separates the motor vehicles, pedestrians and other road users from entering the cycling lane the only users allowed are those with bicycles.
This type of segregated cycling lanes have been recently being constructed in London, as part of mayor’s vision for cycling the aim is to promote cycling safety (Department for Transport DFT 2008).
2.1 BACKGROUND OF THE PROJECT
The main aim of this research is finding the saturation flow of the segregated cycling superhighway lanes at signal control junction, as well as measuring the characterises and behaviour of cyclist using this lanes.
As there are, no method yet developed to work out the saturation flow for cyclist in the UK because most of the methods of working out the saturation flow are based on vehicles only.
And also not much of research is done in terms finding out the saturation flow of segregated cycle lanes, and the characterises and behaviour of this cyclist using the fully segregated cycle lanes one- way and two way cycles,
In this project, we will be investigating how to measure the saturation flow of the Cycling Superhighway Segregated One-way and Two ways cycling lanes, and measure the capacity of these cycle lanes when they are saturated. In addition, we will also look into the some of the characteristics of the cyclist at signal-controlled junction and find out how many of these cyclists using these facilities provided according.
According to Akcelik (1981) suggested that saturation flow in vehicles is a basic characteristic to calculate the capacity approach at signal during signal cycle.
Finding the saturation flow rate can be very complicated there are few aspects that can affect the saturation flow, this depends on the road traffic condition design parameters, and geometry traffic of the road in addition the very narrow lanes will normally prove longer gaps between the cyclist which will reduce the saturation flow rate.
The Saturation flow is a very important technique when designing and analysing the road traffic, it is used to measure the performance, and the maximum traffic flow rate at the signal control junction.
One of The principal methods available for calculation of saturation flows is Road note 34 Method (1963) this procedure uses a method that consists of taking 6 seconds intervals during the green and amber period of cycle under saturated flow.
The Saturation flow is determined by site measurements if the signals on the road already exist at the Signal Controlled junction, as opposed to being planned by recording the number of vehicles that cross the stop line during the green phase in 6-second time slices, taking an average of the maximum value.
In this project Road Note 34 (1963), method will be used to measure the capacity saturation flow of the segregated cycle lane at signal control junctions. This basic model assumes that when the signal changes to green the flow across the stop line increases rapidly to saturation flow rate (S) remains constant until either queue is exhausted or the green period ends.
The departure rate is lower during the first few seconds while the vehicles accelerate to normal running speed similarly the departure rate is lower during the period after end of the green time basic model is still valid therefore it should be noted that saturation flow is the maximum departure rate which can be achieved from the queue.
According to this research, the same concept and procedure will be applied to cyclist at signal-controlled junction in order to determine the saturation flow rate.
Then saturation flow is calculated by making the effective green time curved profile into a rectangle from which the dimensions could be calculated. This is normally done by introducing the idea of lost time and effective green time that will be discussed further at chapter 2-literature review.
The lost time is the time from the start of green to a point where traffic is flowing at half the maximum flow plus the time from where the vehicles are flowing at half the maximum flow at the end of saturation to the beginning of the red period.
In this research, we will be looking at two different type cycle lanes, and their design features, One-way and Two-way Cycling lane, based on the study the cycling lanes is segregated, where the cyclist is separated from motor vehicles.
The problems encountered in this research is the lack of estimating measurements for the saturation flow of the segregated cycle lanes at signal control junction. There is no appropriate method yet in the developing world for predicting the values of the saturation flow rate for segregated cycle lanes at signal-controlled junction. As well as the characteristics and behavior of the cyclist using the segregated cycle lanes.
However, it is not yet possible to identify through indicators whether Segregated Cycling Superhighways lanes are in their full capacity. Alternatively, how many of these cyclists are using the cycle lanes.
2.2 AIM & OBJECTIVES
The main aim of this project and research is to find out the saturation flow for Segregated Cycle Lanes at Signal Control Junction. There has been little work done in measuring the capacity of the cycle lanes and the characteristics behaviour of the cyclist using these lanes.
Here in UK and the developing world by understanding the characteristics of the performance of traffic such as the saturation flow for vehicle would help and shed light when designing and developing cycling superhighways in the future.
The main task of this research will be to evaluate and analyse how the saturation flow for cycle lanes at signal-controlled junction could be measured when the lanes are saturated.
We will also analyse and measure when the cycle lanes are within full capacity, we will have an increase understanding of saturation flow for cyclist, and adapt different approach to measure the saturation flow for the cycle lanes. Also analysis the behaviour of the cyclist using the segregated cycle lanes.
This research will require collecting traffic data regarding the saturation flow on cycle lanes, characteristics of lane geometry design of the road, traffic flow of the cyclist, from selected sites.
The first compressive literature review will be conducted which will give a basis of saturation flow design and methodology.
In order to measure the traffic data and saturation flow of the cyclist we will be selecting a location in city where there is segregated cycle lanes with high level of cyclist users and we will obtain information.
This data will be collected and stored manually there will be video recording equipment from selected site, which we will clearly record the amount of cyclist passing through, and the data will be measured using the video and stored manually.
In the winter season, there will be lower level of cyclist compared to summer time where there is usually high level of cyclist. This project and research is taking place during the winter period therefore it would be hard to find out how much effect this would have on the data which will be collected unless, we measure the amount of saturation and traffic flow during the summer time which could be carried out in the future research.
The saturation flow measurement will be conducted from the three different locations where we will evaluate the saturation flow on Segregated One-way and Two-way Cycling lane and determine saturation flow.
The observation of the data from the sites will require understanding and the data will be observed to find out the saturation flow, this will involve analysis and calculations of the saturation flow.
Using the principal method Road note 34 Method (1963) this procedure uses method that consists of taking 6 seconds intervals during the green and amber period of cycle under saturated flow.
The saturation flow is then calculated as the average of the ratio between number of cycles and the number of saturated cycles.
Excluding the first and the last intervals. This will be the method of measuring the saturation flow for segregated cycle lanes.
The measured saturation flow for the cycle lanes would be helpful tool for traffic engineers and planners designing intersection of road.
2.3 The Main Objectives of the Study
- To get understanding of the saturation flow for cycle lanes at signal controlled junction.
- To find out the saturation flow for Segregated Cycle Lanes at Signal Control Junction existing signal timings and phasing, from selected sites.
- To collect data regarding the saturation flow and the traffic composition, geometry, of the cycle lanes, layout of the segregated cycle lanes, one-way or two ways at signal controlled junction.
- To understand some of the characteristics and the behaviour of the cyclist using the fully segregated cycle lanes at signal controlled junction.
- To investigate the international studies, on cycle lanes and their saturation flow.
- To understand compare international design standards and UK design standards and the capacities of the cycle lanes.
- Behaviour of cyclist at signal controlled junction and find how many of the cyclist using the cycle lanes and those using the main roads.
- Cyclist wearing safety clothing (visibly clothing) and those not wearing.
- To understand and evaluate the design features of the cycles at signal controlled junction.
- Generate equation to gives rough predicts of the saturation flow expected on cycle lanes.
- Adapt different approach of finding out the saturation flow of the cycle lanes at signal-controlled junction, and establish a relationship saturation widht of road, gradient.
- Adapt different approach on measuring the characteristics and the behaviour of cyclist using these fully segregated cycle lanes.
Report Content
Chapter: 1
Includes the introduction and background of the project with the main aims and objectives the study and brief summary of every chapter.
Chapter: 2
This chapter consists summary of the literature review on the topics presented identifying the factors to be measured, investigation on international studies related to capacity of cycle lanes. This chapter also looks into (TFL) design standards of the cycling superhighway for segregated cycle lanes.
Chapter: 3
This chapter explains the research method considered for this research, and how it has been utilized.
Chapter: 4
This chapter presents the schemes considered for this research and the results obtained discussion about the results.
Chapter: 5
This chapter presents the analysis and discussion of the results obtained, the measurement of the saturation flow measured geometric parameters and the behaviour of the cyclist at the signal-controlled junction.
Chapter: 6
This chapter presents the significant conclusions and recommendations are delivered for further work.
3. CHARPTER
LITERATURE REVIEW
3.1 Cycle Superhighway
The cycling superhighways are cycle routes, running from outer of London into and across central London. They give cyclist safer, faster and more direct journeys into city centre, the cycle superhighways will meet the demand of commuters with growing appetite for cycling in the city. (Transport for London, May 2010).
Cycling superhighway should be designed to give the new cyclist the confidence and safer environment and need to tackle London roads, research has suggested all segregated cycling infrastructure work well, and the aim is to boost cyclist confidence and feel safer in the segregated lanes.
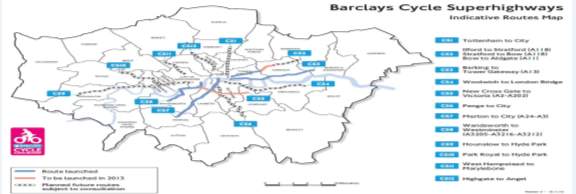
Figure 2: Cycle Superhighway Map (Transport for London, May 2010)
3.1.1 Exclusive off – Street Bicycle Lane
In this report, we will be focusing on the cycle lanes that are segregated lanes these cycle lanes is separated by a continuous or bear-continuous physical upstand along links segregated island this separates the motor vehicles, pedestrians and other road users from entering the cycling lane the only users allowed are those with bicycles.
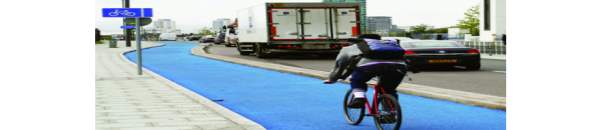 This type of cycling lane has recently being constructed in London, as part of mayor’s vision for cycling the aim is to promote cycling safety. There are vertically separated cycle tracks at intermediate level between the footway and main carriageway with or without buffer. (Department for Transport DFT 2008).
Figure 3: Cycle Superhighway Source London Cycling Campaign (2013)
3.1.2 Segregated Cycle Lanes
Segregated cycle lanes within the carriageway provide a safe and comfortable environment for cyclist without taking the space from vehicles and pedestrian Segregated lanes and track provide a high level of service for cyclist on links, offering comfort and subjective in particular. (TFL Cycling Design Standard 2013).
According to Cycling Design Standard (TFL, 2013) report, it has been noted that cycling infrastructure should be designed in a way that is inclusive for larger types of bicycles models small cycles and those used by the disabled people.
In order to improve the safety on the busy roads and meet London design standards the cyclist need to be separated from the rest of the motor traffic. The separation is done by low height kerbs (stepped track) or by fixing separation unit on the road surface, this will encourage people to ride bicycles and use cycling as an alternative mode and healthy way of travel. (TFL Cycling Design Standard 2013).
3.1.3 One-Way Cycling Lane
The figure below clearly explains the cross section of typical one-way cycle lane. According to London Cycling Design Standard on one-way cycling lanes, when cyclist moving in the same direction that need to overtake each other cycle side by side at least 0.5m clearance required between dynamic envelopes of 1.0m this would mean that effective width of 2.5m is required to permit safe overtaking. (TFL Cycling Design Standard 2013).
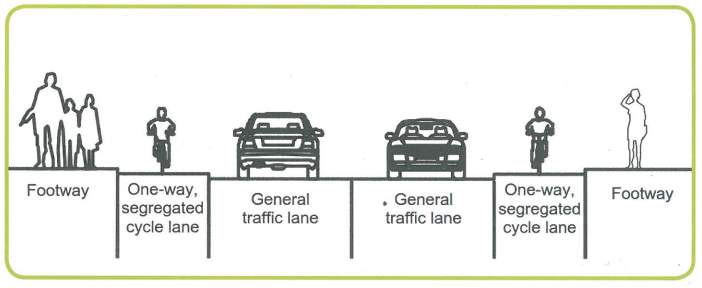
Figure 4 One – Way Cycle Lane source (Go Cycle Kingston 2016)
3.1.4 Two-Way Segregated Cycle lanes
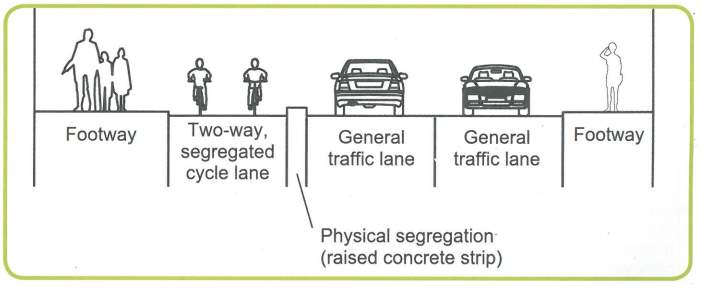
Figure 5 Two-way Segregated Cycle Lanes (Go Cycle Kingston 2016)
The figure 5: above clearly shows and explains is the two way segregated cycle lanes, it also shows that there is physical segregation raised concrete strip. According to London Cycling Standard, at least 3m width needed for comfortable two-way cycling lanes, when cyclist is moving in the opposing directions there is an added risk of head-on collision and at least 1.0m clearance is recommended. This gives rise to a desirable minimum width requirement of 3.0m for two-way cycle lanes (TFL Cycling Design Standard, 2013).
3.2 Signal Controlled Junction
The Signal controlled junctions has a general layout, which is controlled by the proposed signal control method and the presence of the road users such as pedestrian bicycle and bus facilities.
Sometimes it’s normal to accept narrow and sometimes substandard lane width at the junction stop lines, the requirements of pedestrian, cyclist and buses must be designed from the beginning of the design process, they cannot be ignored and then tacked on to a near complete design after detailed capacity assessment have to be made. (Slinn, Guest and Matthews, 1997).
According to Highway Capacity Manual 2010 (HCM, 2010), suggest the capacity of the road is the maximum number of traffic that can pass a given point during a specific time period under prevailing roadway, traffic and signalized control conditions.
Traffic signal control at the junction is used to regulate and control conflicts between opposing traffic movements without use of signals at some sites the major flow will dominate the junction, making entries from the minor road impossible or very dangerous.
At the other site, minor roads might interfere with the flow of the major road traffic to extend, excess conjunction might occur.
The traffic-controlled junction might not only to improve the junction capacity but might also contribute to the safety of the road. (Slinn, Guest and Matthews, 1997).
The most important factor of signal control junction is to understand the capacity of the intersection and the amount of the traffic that can pass through signal controlled junction from a given approach, which depends on the green time.
It is understood that green time is the maximum flow of the traffic, which would cross the intersection, the saturation flow that can be accommodated of the capacity at signal-controlled junction. (Slinn, Guest and Matthews, 1997).
The traffic Signal control when the lights turn green on an approach gaining right of way the of the vehicle discharge across the stop line rises quick to a study values, and remains constant. Until the queue of the vehicles waiting to pass through the signal is exhausted, after which either the arrival rate or the end of the green period determines the rate of flow across the stop line. (Slinn, Guest and Matthews, 1997).
The initial discharge rate is lower during the first few seconds while the vehicles are taking off or accelerating to reach their normal speed, there may be also be a lower discharge rate at the end of the saturated period when the amber signal indicates the imminence of the end of the stage. (Slinn, Guest and Matthews, 1997).
The constant rate at which the queue discharges across the stop line is defined as saturation flow is generally expressed as Passenger Car Unit (PSU) per hour of the green time. For calculation purposes, it is understood that saturation flow is simplified as an ‘an effective green time period.
Through which flow is assumed to occur at the saturation flow rate, with ‘lost time’ at the start and the end when there is no flow-taking place.
Saturation flow occurs when there is continues queuing on the approach and is determined at existing junctions, by direct measurement or from empirical formulae driven from public road and tack test carried out by the TRL. These formulae predict saturation flow, measured geometric parameters at the junction. (Slinn, Guest and Matthews, 1997).
3.2.1 Cycling Design Features at Signal Controlled Junction
Transforming Cycling in London TFL is working on innovative design which been implemented to transform cyclist in London and improve the environment for all road users. In most areas, average speed of cyclist is faster than motor vehicles; the East to West Cycling Superhighway is the longest Segregated Cycle lane in a city and the world when the project is completed.
Cycling Superhighway will make the most efficient way to travel in London however the space will also encourage cycling healthy and active mean of traveling in the city, cycling will have less impact on London environment.
Transport for London (TFL) have introduced new Cycling safety features in the Cycling Superhighways in London’s network roads, to promote the safety of cyclist and encourage more cyclist in the in the newly designed cycling Superhighway roads of London as part of mayors plans, some of the design features to improve safety of the cyclist are.
3.2.2 Early Release
Early release is installed at signal controlled junctions this feature gives the cyclist a head -start than the motor vehicles. The junctions where early release operate will have small cyclist traffic light where the cyclist will get green light before motor vehicles. The cyclist will need to carefully proceed through the junction when turning right.
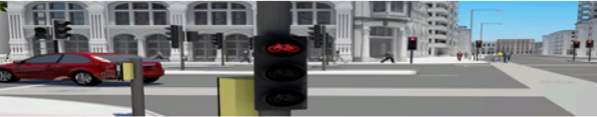
Figure 6 Early release Source: (TfL: 2016)
3.2.3 Two – Stage Turn
This two-stage manoeuvre are used in some of signal-controlled junctions to help cyclist turn and manoeuvre safely and easy, this is normally done in two stages.
Where the cycle lanes are segregated, this Right Turn Manoeuvre can be done at one stage. Where there is Two Way Cycling lane the two-stage process have to follow.
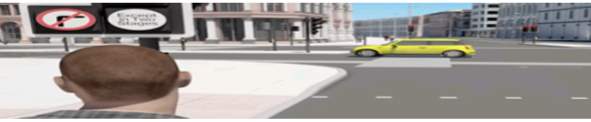
Figure 7 Two-Stage-Turn Source: (TfL: 2016)
3.2.4 Hold the Left Turning Traffic
This feature is designed to prevent any collation at the signal-controlled junction, the feature separates left turning vehicles from the cyclist when the cyclist arrives at the Signal Controlled junction, which is segregated, when the cyclist get green light left turning vehicles are held red.
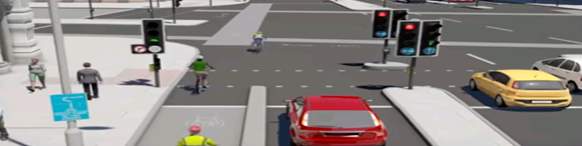
Figure 8 hold the left turning traffic Source: (TfL: 2016)
The cyclist will be stopped at signal-controlled junction and the motorist will be given the green light or to turn left. Cyclist and left turning vehicles and motorist will never get green light at same time at the signal-controlled junction. This feature will be introduced at all Segregated Cycling Superhighways One-Way or Two-Way Cycling lanes.
3.2.5 Crossing the Cycle Tracks
The figure 9 shows that most of the large section of Cycling Superhighways cyclist have their own space dedicated to them. The lanes are separated from other road users, however pedestrian and cyclist will still encounter each other at some busy place like stations, bus stations it is important that cyclist should always expect to encounter with pedestrian and should look out at station and bus stops. (TfL: 2016)
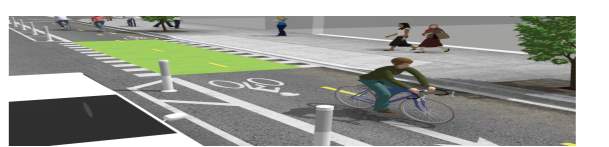
Figure 9 crossing the cycle track source (NACTO 2016)
3.2.6 Cycle Advanced Stop Line (ASLs)
Advanced Stop Line are primarily, the measures designed to increase cyclist safety by allowing cycle users head start on the traffic signal slightly in advance of motorised traffic. According to TFL the current Traffic, models do not consider the impact of ASLs and the relationship with platoon dispersion. (TFL Cyclist Decision Making Research 2014).
According to research conducted by the transport research laboratory TRL in the movements and behaviour of cyclist on the approach to and through signal controlled junctions in London.
This study is particularly paid attention to cyclist lateral position and proximity to other road users, road infrastructure and junction capacity and the impact of road safety for all users; throughout video analysis on the approach, they have concluded range of new approach to traffic control for cyclist. (TFL Cyclist Decision Making Research 2014).
3.2.7 Low Level Cyclist Signals
Low level signals with logos are wide used in the Europe, to provide signals closer to cyclist eye level and also to provide separate signal phases for cyclist at junctions, Transport Research Laboratory are undertaking study on this type of signals, in order UK regulations can be changed to introduce for whole UK. (TFL Cyclist Decision Making Research 2014).
3.2.8 Turning Right
The TFL has tasked Transport Research Laboratory to investigate the possibilities of introducing new ways for cyclist to turning right at signal controlled junction, the aim is to reduce the difficulty that cyclist face in undertaking this type of manoeuvre and avoiding necessity to cross traffic lanes or getting caught between opposing streams of traffic in a junction. There are number of approaches that were identified for further investigation into two ways of turning junction (TFL Cyclist Decision Making Research 2014).
- Fully Segregated Signalised Junction – This approach involves cyclist turning right on a green stage signal from a segregated cycle track.
- Two – Stage Right Turn – Where cyclist is mixed with traffic, the right turn is carried out in two stages with dedicated area provided for cyclist
3.3 MOVA (Microprocessor Optimised VA)
MOVA uses detectors and microprocessor to make decisions on the stage changes, this control system uses loop detectors which assess the cruise the cruise time flow of the traffic, MOVA is extremely affective at all types of isolated signal control junctions, it can also be applied effectively as linked MOVA in small network, especially signal controlled junctions and roundabouts.
3.3.1 TRANSYT (Traffic Network and Isolated Intersection Study Tool)
TRANSYT network is an area wide linked traffic signal system operating with a set of predetermined fixed time signal plans. The signal plans are a series of co-ordinates settings for all the signals in the network TRANSYT is used by many consultancies and local authorities around the world, its offline computer program for designing modelling and studying everything from individual isolated junctions to large complex networks.
TRANSYT network can quickly assess individual junction performance and produce optimum fixed time coordinated traffic signal timings in network of roads when the traffic of the road occurs.
TRANSYT has been the work of extensive quality research over many years ago therefore, it is powerful, and useful also and time saving tool for traffic engineers. (TFL Cyclist Decision Making Research 2014).
3.3.2 SCOOT (Split Cycle and Offset Optimisation Technique)
SCOOT is primarily an area wide signal control technique, which has the structure of which is similar to TRANSYT in that both methods use a traffic model of a network which predicts the delays and stops caused by particular signal setting. Scoot uses information to recalculate its traffic model predictions every few seconds and then makes systematic trail alternations to current signal settings.
Scoot uses data from vehicle detectors and optimises traffic philosophies, which led to the development of Scoot, the system has proven to be effective and efficient tool for managing traffic on signalised road networks that is why nowadays it is used over 250 cities and towns in the UK and the overseas. (TFL Cyclist Decision Making Research 2014)
Scoot response to changes in traffic conditions to enable scoot to respond in variations in traffic demand on a cycle-by-cycle basis, the responds are rapid changes in traffic but not so rabidly, and it avoids large fluctuations in control behaviour as result of temporary changes in traffic patterns.
The scoot system is used for dense urban road network such as the roads in London and other large cities, Scoot is also suitable for smaller networks, scoot is effective where traffic flow is unpredictable such as random changes in the traffic patterns, and it is specially designed to adapt to variations in the traffic flow automatically.
The Transport for London authority (TFL) rely on Scoot to manage traffic, all reference that cyclist SCOOT will be developed and deployed on all the street of London by (2018). (TFL Cyclist Decision Making Research 2014).
3.4 Factors Effecting the Saturation Flow
Few factors that can affect the saturation flow of approach at signal-controlled junctions of approach is. First geometric factors and traffic control factors, the influence of traffic composition lane width and the approach gradient. The capacity at signal controlled junction approach is the sum of the saturated flows of the individual lanes, the saturation flow is independent from traffic and control factors and is the maximum flow passing at signal controlled junction.
The geometric factors affecting the saturation flow are the position of the lane, nearside or non-nearside, the width of the lane and its gradients, and the radius of any turning movements.
Effect of gradient a steep uphill gradient can significantly affect the acceleration of the cyclist when pulling away from stationary at signal-controlled junction. However, studies suggest that the smaller the lane width the capacity of the traffic deteriorates rapidly.
3.5 Saturation flow of Cycle Lanes
According to HCM (2000) stated the capacity of the cycle lane uninterrupted of Two-Way facility is 1600 bicycles/hr., and 3200 bicycles per/hr. on one-way facilities. However, under interrupted – flow, at signal control junction the saturation flow rate of 2000 bicycle lane/hr. for one direction. However, there are also different studies that have calculated the saturation flow of cycle lanes.
According to HCM (2000), they suggested there are number studies that have dealt with the saturation flow at signal-controlled junction and most of them work on lane based traffic conditions. the typical values for a straight ahead lane are the saturation flow are 1800 – 19000 PCUs per hour, the left and right turning lanes are 1650 – 1800 PCUs per hour, this studies in based on mix traffic.
At the existing traffic signal control junction an assessment will be needed to measure the saturation flow. This will be achieved by counting the number of cyclist passing at the signal control junction segregated bicycle lane to measure the capacity of saturated period.
According to this research, there is the lack of measurement methods for the segregated cycle lanes. Therefore, for the purpose of this research I have contacted Transport for London (TFL) to find out if this type of research has been done before so it can be useful for the scope of the project and research.
The TFL has concluded that based on their analysis the saturation flow for cycle lanes is based on mixed traffic only and they have not done study based on segregated cycle lanes.
According to TFL they suggested they could get saturation flow S = 0.83 of a cyclist past stop line in second, which is 2988 bicycles/h-lane when they are stack in line if less than 1.5m 2m width.
TFL has also concluded that some of the cycling Superhighway are wider and the Saturation flow is not known, because these lanes are wider, higher Saturation flow can be obtained.
According to (TFL, LCDs, 2014), indicatively high cycle flow can be achieved on segregated cycling superhighway for one-way cycle lanes over 800 cycles per hour at peak, 1000 cycles per hour on two-way cycle lanes, the recommended with width of the lanes are 2.5 meter, and 4.0 meter respectively.
According to the experimental study for estimating capacity of the cycle lanes, which was done by (Seriani, Fernandez and Hermosilla 192-203). in central London Tavistock square they have suggested that they could get they could get saturation flow of 2.40 bicycles/2sec, which is 4320 bicycles/h-lane, in the morning peak, and saturation flow of 1.79 bicycles/2-sec which is 3222 bicycles/h-lane in the afternoon peak. Their study shows that in the morning it peak was 25% higher than the afternoon peak. This study is based on the partially segregated cycle lanes, and their study suggest the saturation flow increases according to the lane width.
| According to TfL (London Cycling Design Standard draft 2014), they have suggested that at least 3m width is needed for comfortable two-way cycling lanes. Moreover, for One-way cycling lanes, especially when cyclist is moving in the same direction and they need to overtake each other cycle side by side at least 0.5m clearance required between dynamic envelopes of 1.0m this would mean that effective width of 2.5m is required to permit safe overtaking. Highway Capacity Manual (HCM, 2000) suggested minimum of 1.20 m per lane required per cycle lane.
The below table 1, shows the studies of different width for cycle lanes. (Miller and Ramey, 1975; Brilon, 1994) citied by (Seriani, Fernandez and Hermosilla 192-203, 2014) different width of cycle lanes. Table 1- Study of the different widths for cycling lanes |
||||
| Countries of Study | Width (m per Lane) | |||
| London, UK
Davis, California, USA Germany Sweden China Norway |
1.5 – 2.5
1.28 1.0 1.20 |
|||
| 2.50 m for 2 lanes; 1.00 m lane
1.60 |
||||
| * – Study of the different widths for cycling lanes | ||||
Table 1 (Miller and Ramey, 1975; Brilon, 1994) citied by (Seriani, Fernandez and Hermosilla 192-203, 2014)
According to TfL (London Cycling Design Standard, 2014) table 2, recommends, the width of the cycle lanes and consideration be given impact of site- specific conditions on effective width and need to accommodate higher cycle flows over time.
| Absolute minimum | Preferred minimum | |
| Cycle Lane (inc Contraflow lanes) | 1.5m | 2.0m |
| Lead- in lanes to ALS | 1.2 | 2.0 |
| 1 – way cycling track
(Segregated cycle lanes) |
1.5m (Low flow)
2.2m + (medium flow) 4.0m + (high flow) |
|
| 2 – way cycle track | 2.0m (low flow)
3.0 (medium flow) 4.0 + (high flow) |
|
Table 2: Width guidance of cycle lane
Table 2 (TFL, London Cycling Design Standard draft 2014)
The table 3, below shows the studies of (Stembord, 1991; Botma 1995) citied by (Seriani, Fernandez and Hermosilla 192-203, 2014), that there are different values of cycle lanes capacity also there is no clear references to identify what is the correct capacity of the cycle lanes, because the values are based on mixed traffic or segregated cycle lanes only. The best way to find out the traffic flow and capacity of the cycle lanes is to measure the amount of traffic passing is when the cycle lanes are segregated from the other road users.
| Table 3 – Study of the different capacity for cycle lanes. | ||||
| Countries of Study Width (m per lane) | Capacity (bicycle/h-lane) | |||
| Sweden
Canada China Germany |
1.20 1.25 1.0 1.00 0.78 |
1500
5000 1800 – 21000 3200 |
||
| 3000 -3500 | ||||
| * – Study of the different capacity for cycle lanes | ||||
Table 3 (Miller and Ramey, 1975; Brilon, 1994) citied by (Seriani, Fernandez and Hermosilla 192-203, 2014)
We have learned that there are different studies on saturation flow of cycle lanes, however all the studies have different values of saturation flow and capacity, of the cycle lanes, however there is no clear reference on to identify which one is the correct capacity of the cycle lances.
According to experimental study for estimating capacity of the cycle lanes which was done by (Seriani, Fernandez and Hermosilla 192-203) in central London Tavistock square London they have carried out the study which is based on partially segregated lanes.
This is a two-way asphalt cycle lane, which has partially segregated divisors, the total width of the cycle lane is 2.0m, and (1m per lane) the saturation flow of the cycle lanes reached a bidirectional flow of about 1000 cyclist/h at peak hours.
The experimental study done (Seriani, Fernandez and Hermosilla 192-203) also suggested cycle track located in Santiago de Chile, which is two –way asphalt cycle track and is segregated from other road users (e.g., pedestrians and other motor vehicles).
The total width of the cycle track is 2.0m (1m per lane) the cycle track reached a bidirectional flow about 900 cyclists/h at the morning peak and 1300 cyclist/h at the afternoon peak.
3.6 Methods of Measuring the Saturation Flow
According to (TRANSPORTATION RESEARCH RECORD 1320), much of the background work on saturation flow took place at the end of the 1950s and in the 1960s, one of the major problems with the body of literature on saturation flow is that many authors do not report the details of their survey techniques. As result the transferability of the values is questionable, even the potential users are aware of the range of possible fluctuations in saturation flow these flow will be difficult to compare.
There are few studies on how to measure a saturation flow, there are three main principal methods available for the calculation of saturation flow will be explained.
3.6.1 Effective green time
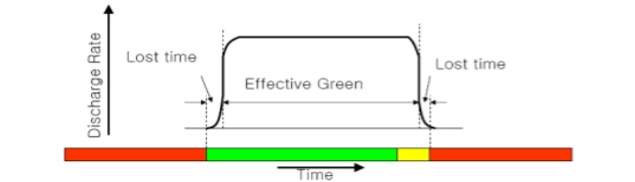
Figure 10 Discharge Diagram
The figure10, is Effective green time discharge curve; effective green time is the time during which a given traffic movement set of the movement proceed at the saturation flow rate it is equal to the cycle length minus the effective time
g = G + Y – lost time, there lost time includes start up delays and a portion of the yellow that is not utilized
Effective Green (g) = (G) Green time + Change Interval – Lost Time
Lost time starts up delays the time during a given phase in which traffic could be discharging through the signal-controlled intersection, but is not. This is the period during the green interval and change intervals that is not used by discharging traffic,
The highest point the curve shown above is the saturation flow and the total lost time is equal to the combined green and amber periods minus the effective green time.
We can clearly understand that the advantage of this concept is that the capacity is directly proportional to the effective green time.
The discharge curve is not appropriate in the case of traffic turning, right subjected to opposing flow, as vehicle maybe be forced to wait until a suitable gap appears in the opposing traffic stream before they can cross.
The saturation flow is defined, as the average rate of discharge of right turning over the period of saturation is highly dependent on the characteristics of the opposing flow. This situation also applies to lanes containing mixed flow of traffic straight ahead and right running vehicles, in a situation the saturation flow will be affected by number of factors in addition to the level and characteristic of the opposing flow. (Capacity and Saturation Flow Rate).
Effective green time is used to simplify the typical flow profile in the figure 10, which assumes that there is a queue on the approach before and after the end of the green stage. (Slinn, Guest and Matthews, 1997).
It has understood that certain aspects of the traffic and the roadway will affect the saturation flow rate of the approach. If the approach has a very narrow lane, that will affect the traffic naturally and will provide longer gaps between vehicles, which will reduce the saturation flow rate, also if you have number of turning movements, large number of Buses and Tracks PSU, HGVs, the saturation flow rate will be reduced.
The saturation flow rate will depend on the traffic conditions opposed which can vary substantially from one region to another, saturation flow will need to be measured in the field, the design manuals usually provide adjustment factors that take parameters such as lane position nearside non nearside width pedestrian gradient, traffic composition, turning radius into account. (Slinn, Guest and Matthews, 1997).
3.6.2 Road Note 34 Method
The Road note 34 Method (1963) is method calculates the saturation flow rate, this procedure uses a method that consist of taking 6 seconds intervals during the green and amber period of cycle under saturated flow, the saturation flow is determined by site measurements if the signal controlled already exist at site.
In addition, opposed been planned by recording the number of motor vehicles across the signal-controlled junction at the stop line during the green phase in 6 seconds time slices taking an average of the maximum value.
The basis of this procedure is to divide the saturation portion of each green period into short intervals of time and to average the total flow rate in the saturated intervals which are free from ‘lost time’ to give an effective measure of saturation flow.
However, this procedure considers each approach separately and the method consists site survey recording the number of traffic discharging from the queue in successive 0.1 minutes’ intervals and the duration of the ‘green’ period plus ‘amber’ and the cycle time, this method uses ‘split second’ hand stop watches and all timings should be recorded to nearest 0.01 minutes. (Road Note 34, 1963).
It’s understood that using this method on site where there are pedestrian crossings it has been found convenient to use the line of studs as reference point, when the flow is no longer at the saturation flow rate level because the queue has disappeared on lanes the recording of the flows in 0.1 minutes should be discontinued.
In practice the exact end of the saturation flow rate it is difficult to determine, this method is assumed that early ends rather late and late start, the saturation flow conditions do not last through the green period,
Below is table that clearly shows the saturation flow, calculation table.
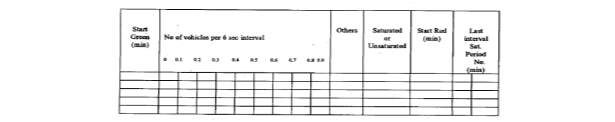
Table 4 Saturation flow table, (Road note 34 Method 1963)
3.6.3 The Average Headway Method
Based on the studies Scraggs; (1964) it clearly stated that the average headway methods require that the data on tune headway between the vehicles stop at the line by the rear bumper of the vehicle. The format counts have to be developed in an attempt to obtain simultaneous estimations of all properties of the discharge process, and the time headway of a vehicle, is measured as the time between the crossings of the stop line by the rear wheels of the vehicle.
This method of measurement requires sophisticated equipment and the recording process should be able to detect different types of vehicles saturation flow (S). Which is then calculated directly from the equations the reciprocal of the average headway saturated flow in passenger unit. S = 3,600/h PCU/hour (Scraggs, 1964).
Where s = saturation flow, h = average headway between the vehicles in seconds.
To obtain a saturation flow rate the number of lanes can be multiplied provided for a given set of movements. The saturation flow rate is the effect of capacity of the approach lane or lanes if they were available for use all the time. The constant headway achieved is referred to as the saturation headway, as it is the average headway that be achieved by a saturated stable moving queue of vehicles passing through the signal controlled junction.
As soon as the saturated stream of vehicles discharge the front vehicles headway are longer because the vehicles are still accelerating, by the time they cross the stop line the first few vehicles are excluded from the calculations of the saturation flow. In addition, the vehicles which cross the stop during the amber or red periods are also excluded from the calculations. (Scraggs, 1964).
3.6.4 Asynchronous Multiple Regression Method
According to Branston (1978). Two methods have been introduced known as asynchronous multiple regression based on counting method. The asynchronous multiple regression suggests that the vehicle departure to be recorded over periods time, which begins and ends at an arbitrary point of time also the number of vehicle departure of each class is recorded.
For both methods the green period is divided into three-time period, the first period begins at the start of green contiguously the middle period covers the time when the departure rate is constant and in saturated state and the last period ends when the amber light shows.
The end of the last counting period the full-saturated cycles is fixed at the change to the amber light by the ends of first and middle may be chosen. In this method, the vehicle departure is recorded over period of time, which begins and ends at an arbitrary point of time (Branston, 1978).
3.6.5 Synchronous Multiple Regression Method
Majority number of researchers have used the synchronous regression they use it as an alternative technique to asynchronous regression for the calculations of the saturation flow, and lost time. This procedure the of vehicles departures of each class are recorded over period of time beginning and ending with the instant of departure of vehicle the first vehicle crossed the line been excluded from the counting therefore this method the saturation flow can be obtained from reciprocal of the average headway.
3.6.6 Other Methods of Measuring the Saturation Flow
According to Akcelik (1981) proposes different approach of saturation flow measurement. This is done by splitting the green period into three intervals; the first interval covers the initial 10 seconds. the middle intervals will cover the rest of the green time period while the saturated flow rate and the last interval includes the period after the end of the green period covering amber and the following red period, in the middle and the last intervals are not interrupted unless a cycle is fully saturated of vehicles.
3.6.7 Passenger Car Unit (PCU)
The capacity of intersection requires that each type of vehicle is equivalent to a number of passenger car unit (PCU). According to this project and research we will not be required calculating the passenger car unit we will be using Road Note 34 to find out the saturation flow of the exclusive Off – Street Bicycle lane this cycle lanes is segregated from other motor traffic.
However, we will only require PCU when there is mix use of traffic, at signal controlled junction Buses PSV, Large good vehicles LGV, motorcyclist, Cyclist, and then the passenger car unit (PCU) will be required in the calculations.
3.6.8 Data Collection
According to research carried out by Transport Laboratory (TRL) Research on local cycle use, suggested unlike the established methodology for counting motor vehicles, monitoring cycle use is still in its early stages, the main problem been lack of reliable automatic traffic count (ATC) equipment designed specially to count cyclist.
- Automatic traffic counters (ATC) can be useful on major cycling superhighway routes that are being promoted, and on adjacent routes from which cyclist might divert, one or more ATC controls should be established, the atutomatic traffic count data is crucial for planning and managing all types of cycling insfrustructure, ATC can suit the veriety of project objectives.
- Manual Traffic Count (MCCs), for the results to be statically significant a number of counts are needed. In most cases the high cost of hiring a sufficient number of enumerators would rule out the MCCs as excluse method of monitoring cyclist.
3.7 Cyclist Behaviour Signal Controlled Junctions
According to research carried out by Transport Laboratory Research (TRL, 2011) a project was undertaken for Department for Transport 2011, to Investigation options for Traffic Management Techniques for cyclist at signal controlled junction in the Urban Environment this study summarised some of the importance of the issues relating to cyclist at signalised controlled junctions, intersections, and outlined. Much needed research and implement new techniques for assisting and giving priority to cyclist at signal-controlled junctions.
The study also looked at the movement of cyclist at signal-controlled junction and impact on safety for all road users, at signal-controlled junction, in the UK.
The research has set out some core principal of good cycling infrastructure if it is to meet the needs of cyclist: convenience, Safety, Accessibility Comfort and Attractiveness, the purpose of the study was to encourage cycling.
The signal controlled Junctions, and Crossings need to facilitate safe passage while avoiding undue delay and interruption to progress such as having to dismount. A key finding in the (DFT) cycling safety study suggested that a disproportionate number of cyclist accidents nearly two thirds occur at or near junctions this was presented in (Knowles et al, 2009) citied by (TRL, 2011). The main cause collision configurations involving a cyclist and a car, the cause mainly were cars turning left or right and cyclist going straight ahead conversely, where cyclist turning right and car is going straight ahead.
Furthermore, disproportionate number of serious accidents involved in left turning large good vehicles. This evidence was reported summarised in (Reid and Adams, 2010) citied by (TRL, 2011).
According to (TRL, 2011). Suggested Cycling infrastructure guidance advices that signal crossings are usually preferable for cyclist in comparison with other forms of junctions, whilst the UK guidance documents identifies a number of standard approach which are used routinely across UK, where there are such as separate lanes and markings to guide the cyclist through the Signal Controlled junction which are used less frequently. (TRL, 2011).
According to (TRL, 2011). With carefully designed cycle infrastructure, there is a growing body of evidence to suggest that many of these short car trips could be replaced by cycle trips, whilst the UK road infrastructure does provide dedicated facilities for cycling traffic,
For example, the toucan crossing and the Advanced Stop Line (ASLs), and few more design features to promote the safety of cyclist, UK cycle utilisation remains lower than other European counterparts do.
It is understood that a lot of work required in this field to generate a safer, more efficient and more encouraging network for cycling infrastructure in the UK, particularly when focusing at junctions. (TRL, 2011).
Study suggest that signal controlled junction can be intimidating for cyclist and unfriendly to cyclist, when considering cycling demographic in urban areas, it is worth bearing in mind that encouraging short trips by cycle can lead to inexperienced cyclist taking to the road and providing friendlier infrastructure can improve the experience on all cyclist. (TRL, 2011).
At signal controlled junctions not only is space contested between different road users, they can also be complicated to comprehend and the behaviour of the road users can be more unpredictable. Almost two thirds of incidents involving of cyclist have been report at junctions summarised (Knowles et al, 2009) citied by (TRL, 2011).
To make cycling the choice for short journeys, the importance of delay and route continuity must also feature in the provision for cyclist. As the cyclist generate their own power, at signal controlled junction are more likely to have a greater interruption impact on journeys by bike, this is summarized in (peck, 2011) citied by (TRL, 2011) who states that breaking to a stop, and start again, loses the equivalent energy to travelling 100m. Thus, he states a 5km journey with 10 stops (e.g. for traffic lights) takes at least 20 % more energy to complete. (TRL, 2011).
According Fietsverkeer (2004) citied by (TLR, 2011) stated that to draw a comprehensive conclusion or practical solutions a sustainable safe approach, knowledge is poor where bicycle provision is concerned and there is certainly room for improvement in this area.
A research into the cyclist collisions has been documented in recent years, and there is evidence to suggest that junctions are significantly factors when investigating the provision for cyclist.
A study undertaken by TRL 2011 (Knowles et al, 2009) found that:
- Almost two-thirds of cyclist killed or seriously injured were at a junction
- The main collision configuration involving a bicycle and car were the car turning right or left while the cyclist was going straight ahead and the cyclist making a right turn while the car was going straight ahead; and
- Collision involving a large good vehicle, HGV were more likely to result in a fatality because of their size, a study by (Robinson, 2005) (citied by TLR,2011) found that most of the collisions occur when large goods vehicles are travelling at less than 10mph. this was because most collisions occurred during manoeuvres, in particular left turns and at roundabouts. When a HGV is involved, the main collision configuration was the HGV driver a left turn while the cyclist was going ahead.
- 38 percent of cyclist Collision involved car/taxi in an urban area at junction;
- The main collision configurations involving a cyclist and car were the car turning right or left while the cyclist was going straight ahead and the cyclist making a right turn while the car was going straight ahead, and
- Collision involving a cyclist another vehicle, failed to look properly’ was found to be a key contributory factor at junctions for drivers and riders (reported 60 percent of serious collision at junctions).
- Failed to look properly was attributed to the car driver in 57 percent of serous collision available sources fail to show whether drivers are looking but failed to see the cyclist or failing to look for them, the strategies adopted by cyclist at junctions are also not well understood; ‘cyclist failed to look properly’ was attributed to the cyclist in 43 percent of all serious injuries.
According to the study, (TRL,2011) listed some engineering measures, including those specific to junctions, which are seen to be beneficial to the cyclist, the finding confirms most of the collision at the junctions.
In addition, some of the issues for cyclist is their luck of visibility, and appearance is a major contributory factor in the rates of collisions whether approaching from rear or to the side, the recommendation for improving cyclist safety are facilities to reduce the speed differential.
Some countries including Germany and the Netherlands have measures in place specifically aimed at improving the visibility of cyclist, with vehicle regulations requiring additional reflectors and other items for road going bikes.
Whilst study have focused on cyclist at the specific location, a consideration must be given to the wider network within which junctions. Whilst segregation is an extremely contentious subject, it is worth noting that research does exist which links the provision at junction must be the nature, of the facilities leading to form the junction.
A study in road safety and perceived risk of cycle facilities in Copenhagen (2007), and Bicycle tracks and Lanes: A Before After Study (2007), citied by (TFL, 2011) an insight in the safety of segregated cycle tracks (adjacent to the road) where tracks where converted to cycle lanes on the approach to signalised intersections the number of accidents fell by 30 percent.
Three main important gains provided by segregated cycle lanes.
- Fever accidents in which cars hit the cyclist from the rear
- Fewer accidents with cyclist turning left (UK right) and
- Fewer accidents involving parked vehicles
According to (TFL,2011) suggested Cyclist passing through a red signal – where are no conflicting vehicular movements, there can be increased temptation for cyclist to disobey the signals, particularly when turning left or going straight ahead at signal controlled junctions.
4. CHAPTER: 4
RESEARCH METHOD
4.1 Road Note 34 Method applied to Bicycles
In order to achieve the objectives of this project it is necessary to measure the saturation flow of the segregated cycle superhighway using the Road Note 34, which gives the prediction of the saturation flows and the lost in time, however sometimes it underestimates the lost time. Which is good for the scope of this project lost time is not required.
The Road Note 34 method requires data in simply classified vehicle count format, the method does not allow calculating PSU values, therefore it is very good for the purpose and scope of this research, which is based on Segregated One-way, and Two – Way-cycling lanes.
Both cycle lanes are the types of the cycle lanes that is segregated, from other motor vehicle that is why the PSU values are not required for the purpose of this research.
The Road Note 34 procedure uses a method that consist of taking 6 seconds intervals during the green and amber period of cycle under saturated flow. In addition, for the purpose of this study due to short cycle (G) green time 2, and 3 sec intervals was considered, the green period was only 17 and 30 seconds, at the signal controlled junction.
The RN34 was applied to the cycle lanes, 2 and 3 sec intervals were used were appropriate to get the average of the maximum value and determine the saturation flow of the signal controlled junction.
The saturation is measured by vising the site and using a video equipment to record the peak hours when there is a lot of cyclist using the cycle superhighways.
According to RN34 (RRL,1963) The purpose of this method was to divide the saturation proportion of each green time into short intervals of time and the average of the saturation flow will be free from the lost time.
Video recording is used to see the number of cyclists that are crossing the stop line during the green phase in 17 and 30 seconds, each cycle. The two, and three-second interval was considered due to short green period, after that saturation flow was calculated by taking the average of the maximum value.
From all the methods researched and analyzed in depth details the Road Note 34 (TRRL) is the most suitable for this type of problem.
However, this procedure considers each approach separately and the method will consist site survey recording the number of cyclist discharging from the queue in successive 0.1 minutes’ intervals and the duration of the ‘green’ period plus ‘amber’ and the cycle time, this method uses ‘split second.
In addition, from the video recordings from the selected sites, we have analyse some of the characteristics and behaviour and of the cyclist at the signal-controlled junction, the data from sites was used to generate the saturation flow, total flow of cycle lanes, and some of the characteristics and behaviour of cyclist at signal-controlled junction. In addition, we have measured the delays of the cyclist using the signal-controlled unction.
From the video recordings, we have measured the characteristics and behaviour of cyclist using the signal-controlled junction. We have establish and gathered data the number of cyclist using the segregated cycle lanes, as well as number of cyclist that not using the segregated facility that using the main road, and we l also looked into how many of these cyclist are private or public bicycles.
In addition, we will also determine of total number cyclist that are wearing (visibility clothing) and those not wearing any safety gear. Which will be discussed in chapter 4.
According to Study (Safety net document for pedestrians and cyclist, 2009) cited by (TFL, 2011) have suggested some of the issues for cyclist is their luck of visibility, and appearance is to me a major contributory factor in the rates of collisions whether approaching from rear or to the side.
However, the data gathered from the site further analysis was conducted to determine the characteristics and the behavior of the cyclist at signal-controlled junction.
4.2 Risk Assessment
Risk assessment was undertaken before the work commenced of the video recording on sites activities were assessed this was required by law adequate control was put in place in order to prevent unforeseen risks, the process which we followed is in the appendix.
4.3 Camera
Camera used for the field work CanonD100 was used to record the saturation flow of the cycle lane at signal controlled junctions, video recording technique is more efficient rather a manual classified counts (MCCs).
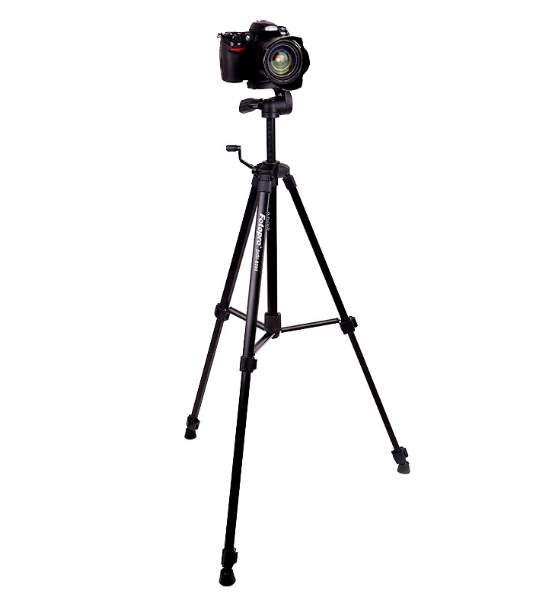
Figure 11 camera Cannon D100
For the scope of this research video equipment Canon D100, was used to record the saturation flow at selected sites, on the peak hours and later video was played back several times for findings to be analysed.
In addition, we will generate data regarding the characteristic and the behaviour of the cyclist using the using the fully segregated lanes as well as those using the main road. Which will be discussed in the next chapter.
4.4 LOCATIONS AND SCHEMES CONSIDERED
 In order to investigate the saturation flow of the cycle lanes at signal-controlled junction we have considered three different schemes, the map of the schemes is CS2, CS3, and CS6 are below.

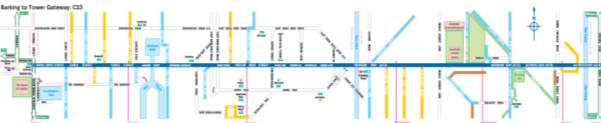
 Figure 12 source (Tfl, 2016) Cable Street, CS3 this is Two-Way fully segregated asphalt cycle lane.
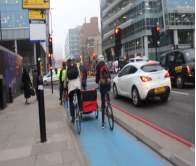
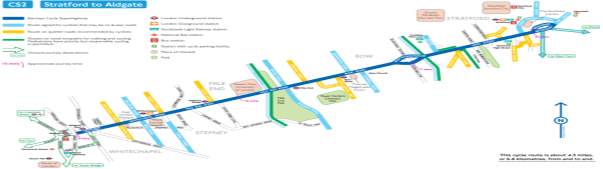 Figure 13 source (Tfl, 2016) Whitechapel high street, CS2 One-Way fully segregated asphalt cycle lane.

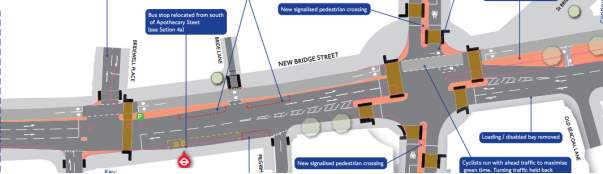
Figure 14 source (Tfl, 2016) new bridge Street signal controlled junction CS6, two-way fully segregated Asphalt cycle lane.
For the purpose of this research, we investigated the saturation flow of Two – Way and One – Way cycle lanes, at signal-controlled junction, and some of the characteristic and behaviour of the cyclist using these lanes.
Site survey visits of the chosen locations was conducted at the busy times of the day where there is high number of cyclist which are going and back from work at the peak hours of the morning and evening peak period (8:25 to 10:00) and (17:25 to 19:00).
Using a video equipment video recording to determine the behavior of the cyclist and the saturation flow of the segregated cycle lanes at the superhighways, which are saturated.
Data collected from the sites surveyed Road Note 34 method is used to determine the saturation flow of the cycle lanes on newly build Segregated Cycling Superhighway One -Way and Two – Way Cycle lanes.
The results obtained from the sites was further investigated, the data generated from the field, is analyzed to see the effect of the saturation flow of cycle lanes width differences, effect of gradients and determine some of the characteristic and behavior of the cyclist at signal-controlled junctions. This will be further discussed on the chapter 4.
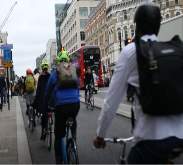
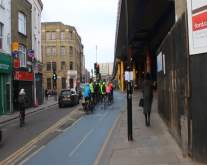
Below figures 15- are pictures of the sites of the of CS2, is one –way fully segregated cycle lane, and CS3 two – way fully segregated cycle lanes, CS6 is two-way fully segregated cycle lane, where study was conducted, and the weather condition of the day fieldwork.
Figure 15 One-way cycle lane Aldgate CS2 (left), and Two-way cycle lane Cable Street, (middle), Two-way New bridge St CS6 (right)
| Date: 08/02/2017 | Date: 07/03/2017 | Date: 29/03/2017 |
| CS2 | CS3 | CS6 |
| Weather: Cloudy | Weather: Cloudy | Weather: Cloudy |
| Temperature: 6 ͦ C | Temperature: 7 ͦ C | Temperature: 12 ͦ C |
| Start time: 8:15am | Start time: 8:15am | Start time: 8:15am |
| Finish Time: 19:15 | Finish Time: 19:15 | Finish Time: 10:15 |
Table 5 Weather condition on day (Fieldwork)
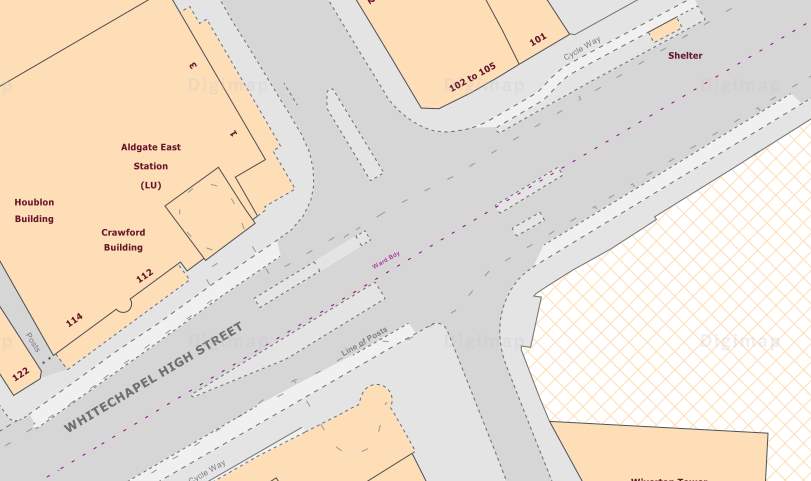
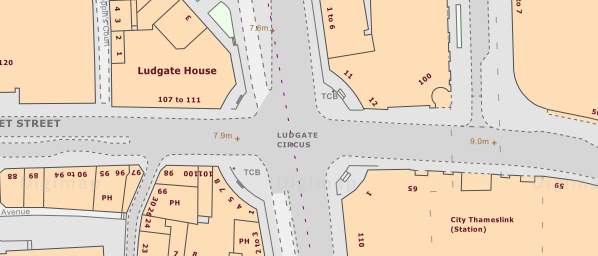
Below figure 16, is map of scheme CS2 Aldgate Highstreets with the dimensions of the road width, each lane is 1.80 m. The measurement was the same for the both directions evening and peak and morning peak.


Single Lane 1.80m
Single Lane 1.80m
Figure 16 Map Demission of the segregated cycle lane, Aldgate, signal controlled junction CS2
Below figure 17, is map of scheme CS3 Cable Street, the two-way cycle lane, and the total width of the lane is 3.50m, each lane is 1.75 m. The measurement was the same for the both directions evening and peak and morning peak.


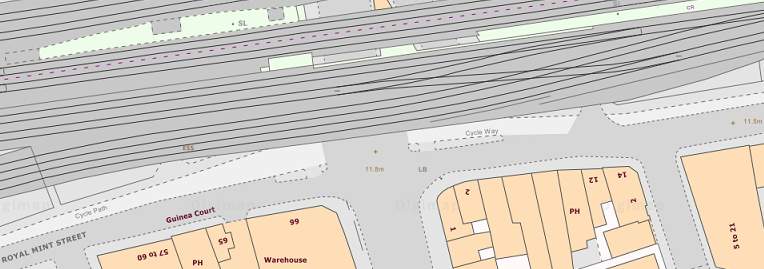 Figure 17 Map Demission of the two way segregated cycle lane, Cable Street, signal controlled junction CS3
Two-way cycle lane, each Lane is 1.75m, Total width 3.50m
Two-way cycle lane, each Lane is 1.75m, Total width 3.50m


Two-way cycle lane, each Lane is 2m, total width 4m
Two-way cycle lane, each Lane is 2m, total width 4m
Figure 18 Map of the two-way segregated cycle lane, new bridge Street signal controlled junction CS6
Below table 6, is measured width of the lanes, and the gradient of the segregated cycle lanes on the schemes considered for this research.
| Scheme | Junction | Direction | Width Of the Cycle Lanes | Gradient at the Approach of junction |
| CS2 – One-Way Cycle lane | Aldgate High-street | Stratford to Aldgate | 1.80 m | 0 % |
| CS2 – One-Way Cycle lane | Aldgate High-street | Aldgate to Stratford | 1.80 m | 0 % |
| CS3 – Two Cycle Lane | Cable Street | Barking – Tower London | 1.75 m per/lane | 0.63 % |
| CS3 – Two Cycle Lane | Cable Street | Tower London – Barking | 1.75 m per/lane | 2.5 % |
| CS6 –Two – Way Cycle Lane | New bridge/Fleet Street | South- North | 2m per lane | 2% |
Table 6 Width of lanes and Gradient of the schemes considered
5. CHAPTER: 5
5.1 Fieldwork and Results
To study the saturation flow of the segregated cycle lanes, and some of the characteristics behavior of cyclist at signal-controlled junction, three schemes is chosen which are full segregated, from the other motor vehicles. The first scheme CS2 location is one-way fully segregated asphalt cycle lane; the total with of the track is 1.80m. However the saturation flow of the segregated cycle lane will determined using the RN34 to get time same condition for vehicles,
The saturation flow of cycle at signal-controlled junction is measured, according to Road Note 34 (TRRL, 1963) but this was modified to cyclist discharge process, we have divided the saturation period to 1 – 2, 3 sec intervals and counted the number of cyclist in each interval from the green period (G) of the traffic signal approach.
The width of the intervals is chosen in order to have at least four saturated intervals, according to RN34 minimum subjects for experimentation.
The method RN34 applied to cyclist at signal-controlled junction, the first intervals start when the green (G) period begins. The average height of the saturated intervals gives the saturation flow. Lost period in which there is no more saturation flow are not considered in the calculations.
To determine the saturation flow of the segregated cycle lanes we have observed the height of intervals below average height of the saturated intervals. In the case of segregated cycle lane, study is carried at the signal-controlled junction of Scheme CS2, Aldgate High Street.
The signal controlled had some of the new design features introduced by TFL, which was discussed in the previous (Chapter 2).
This traffic signal control presented green period of 17 seconds for all cycles during the peak hour (Morning and Evening), the queues were always made at the end of each cycle.
The first period was recorded on Wednesday 08/02/2017 during the (Morning and Evening) peak (8:25am-10:00am) and (17:25 pm – 19:00pm).
5.1.1 Saturation flow CS2
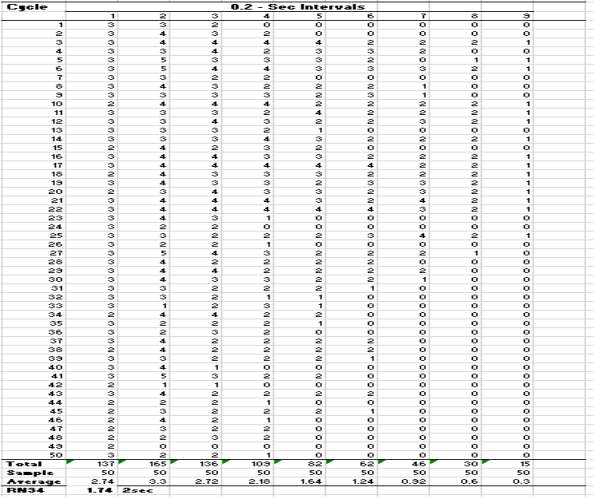 From the methodology presented in chapter 2. It was possible to process the data below table shows the method RN34 applied to cyclist at signal-controlled junction, scheme CS2, Aldgate high-street signal controlled junction, for the purpose of this study, 50 cycles were considered shown in the table. Each cycle is dived into two intervals of 0.1-min (2 seconds).
Table 7 RN34 Method applied to CS2, Aldgate high street
Table 7 RN34 Method applied to CS2, Aldgate high street
The saturation flow was calculated as the average of the ratio between numbers of saturated intervals (2.74 + 3.3 + 2.72 + 2.18 + 1.64 + 1.24 + 0.92 + 0.6 + 0.3) / 9 = 1.74 cyclist/2sec. This means 3132 cyclists/hour were calculated at the segregated one-way cycle lanes width of 1.80m.
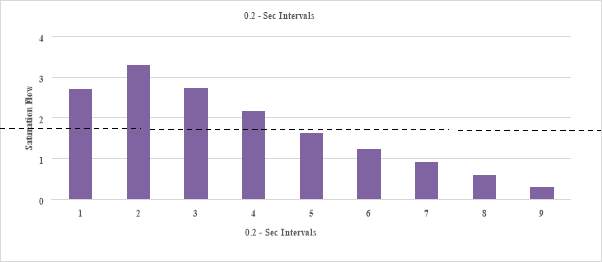
Below figure 19, show the histogram of the saturated intervals at junction, the dotted line presents the average height of the saturation intervals (intervals 1 to 9).
Figure 19 Flow Discharge Diagram at CS2, Aldgate high street (Morning peak)
The figure 19 shows the measured saturation flow of the segregated cycle lanes at CS2, Aldgate High Street, this fully segregated cycle track, a saturation flow reached 1.74 cyclist / 2sec. 3132 cyclists/hour, which is 0.87 cyclist/sec.

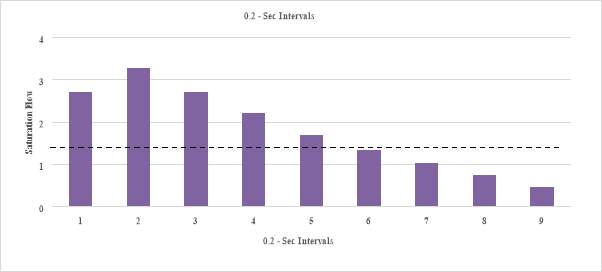
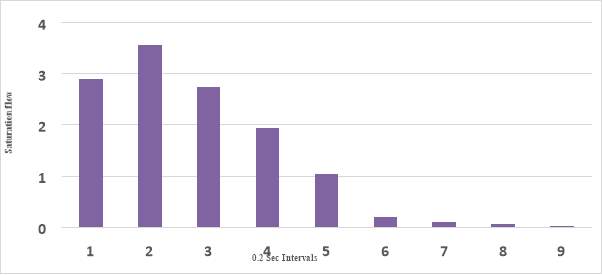 Below figure 20, shows the discharge histogram of the evening peak, CS2, Aldgate high street, at the signal-controlled junction, the saturation flow is measured in direction from (Aldgate to Stratford). The saturation flow reached 1.40-cyclist / 2sec. 2520 cyclist/hr. that is 19 % less than the morning saturation flow.
Figure 20 Flow Discharge Diagram at CS2, Aldgate high street (Evening peak)
5.1.2 Flow of Cyclist at Junction Aldgate High Street CS2
The figures 21 & 22 below show the data gathered from morning peaks and the evening peak flow of the cyclist at each cycle lane, at the CS2 Aldgate high street, signal-controlled junction.
The histogram in the figure 21 &22 shows the flow of the cyclist at peak hours, highest number of cyclist crossed at the signal-controlled junction at once in green signal period (G) 17sec, were recoded 29 cyclists at time in morning peak and the evening the highest was 24 cyclists in one cycle.
The maximum flow recorded on the cycle lane reached 581 cyclist/h at peak hour (morning), during the 90mins of recording the total number of cyclist crossed the signal controlled were 769 cyclists. However, in the evening peak total cyclist count were 433 cyclist hours, during the 90mins recording total flow were 639 cyclist crossed the signal-controlled junctions.
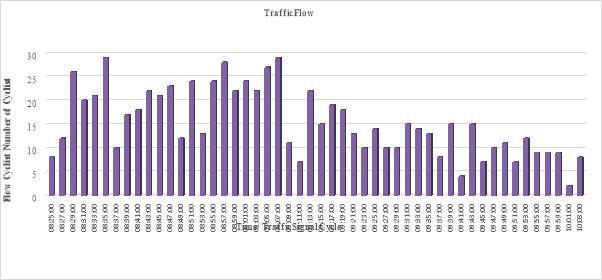 Figure 21 Cyclist flow at Aldgate high-street, signal controlled junction (Morning peak)
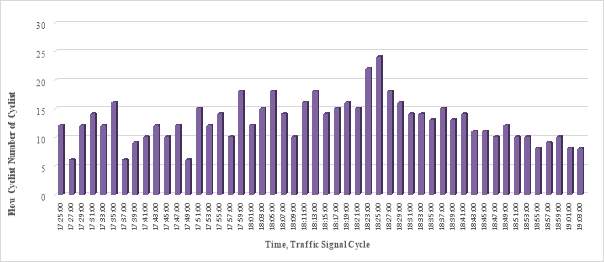 Figure 22 Cyclist flow at Aldgate high-street, signal controlled junction (Evening peak)
5.1.3 Characteristic and behaviour of cyclist at Junction Aldgate High Street CS2
However, the data gathered from the site was analyzed to determine the characteristics and the behavior of the cyclist at signal-controlled junction.
Below is the list of characteristic and behavior of cyclist at signal-controlled junction we will determine in this research report.
- Cyclist jumping Red Light Before the Cycle,
- Cyclist Stopping at Red Light (Signal controlled junction)
- Cyclist jumping Red Light after Green light
- Cyclist Using the Main Road
- Cyclist Using the Pavement
- Cyclist wearing safety gear (visibility clothing)
- Cyclist not wearing safety gear (visibility clothing)
- Private Bicycle
- Public Bicycles
We have measured number of those described above which are on public bikes or private, and how many of them are wearing reflective clothing, study suggested some of the issues for cyclist is their luck of visibility, and appearance is a major contributory factor in the rates of collisions whether approaching from rear or to the side.
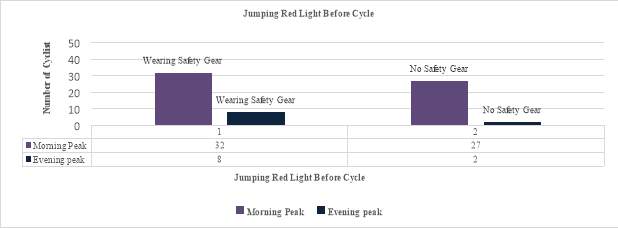
Figure 23 Cyclist Jumped Red Light before Cycle at Aldgate high street, (CS2) signal controlled junction.
The above figure 23, shows number of cyclist jumping red light before cycle, at the signal controlled junction in the for the morning and evening peak.
Total number of cyclist that jumped the red light were recorded 69 cyclists, which is percentage 4.90 % of the total flow of the morning and evening peak. As you can see from the figure 23 it also indicates, more cyclist has violated the traffic light in the morning then evening peak. In addition, 40 cyclists, which is 2.84% of those, jumped the red light were wearing safety gear (visibility clothing). While those not wearing safety gear, were 29 cyclists 2.05%.
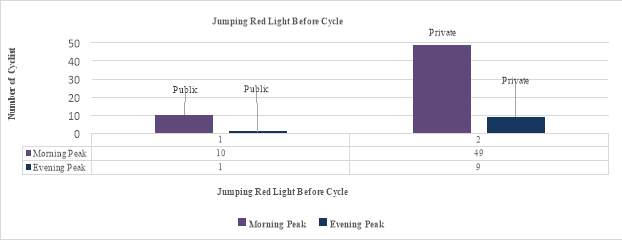
Figure 24 Cyclist Jumped Red Light before Cycle at Aldgate high-street, signal controlled junction
Figure 24, above shows moreover, 58, (4.11 %) of cyclists jumped the red light were private bicycles, while those were public 11 (0.78%) cyclists in the morning and evening peak.
The figure 25, below shows the number of cyclist that jumped red light after the green period ended. Those jumped the signal were recorded to be 56 cyclists, which is total 3.97 % of the total flow of the Morning and Evening peak. 35, of those cyclists was wearing visibility clothing, which is 2.48 %. While those not wearing visible clothing is 21 cyclists which is 1.49 %.
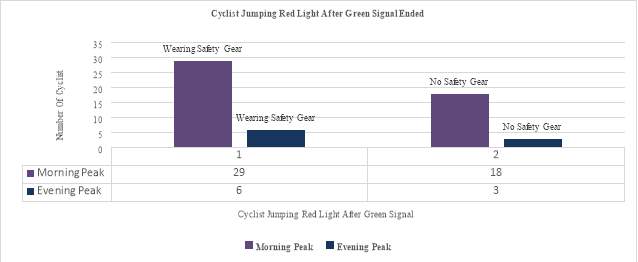
Figure 25 Cyclist Jumped Red Light after Green Signal Ended at junction, Aldgate high street, (CS2).
The figure 26, below shows those that jumped red after green period ended. 14 cyclists were public bicycles (0.99%). while the other 42 cyclists 2.98 % were private in the (morning/evening).
.
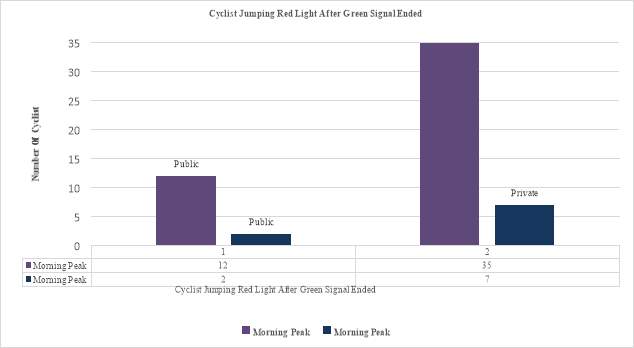
Figure 26 Cyclist Jumped Red Light after Green Signal Ended at junction, Aldgate high street, (CS2)
The below figure 27, shows, the number of cyclist stopped at the signal controlled junction waited for green signal were recorded 939 cyclists (morning/evening). Which is 66.69 % of the total flow of the morning and the evening peak.
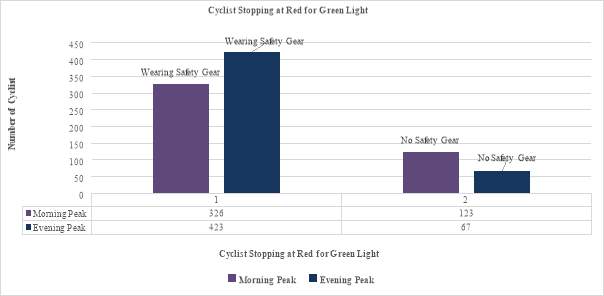
Figure 27 Cyclist Stopping at Red for Green Light at junction, Aldgate high street, (CS2)
Those waited 749 were wearing safety gear (visible clothing) (53.19 %). While 190 cyclists were not wearing visible clothing which is 13.49%.
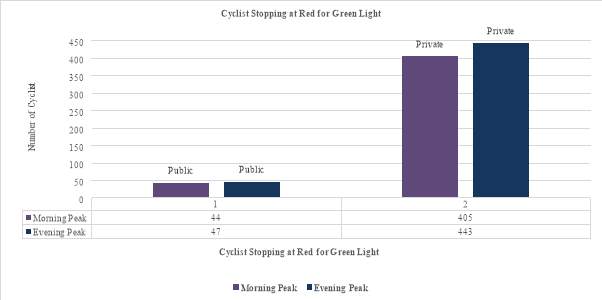
Figure 28 Cyclist Stopping at Red for Green Light at junction, Aldgate high street, (CS2)
Figure 28, above shows, 848 cyclist stopped at red signal for green were private bicycles (60.22 %). while the other 91(6.46 %) cyclists were public in the (morning/evening).
The figure 29, below shows number of cyclist using the main road not using the segregated cycle lanes, at the signal controlled junction those recorded were 408 cyclists is around 28.97 % using the main road, which 305 (21 %) cyclists were wearing visibility clothing which indicated they were more experienced cyclist.
103 cyclists not wearing visibility clothing which (7.31%) of the total flow.
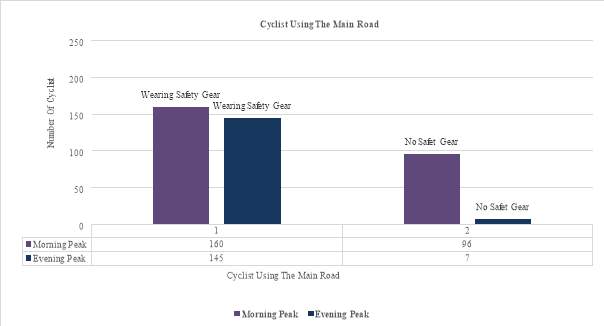
Figure 29 Using the Main Road at junction, Aldgate high street, (CS2)
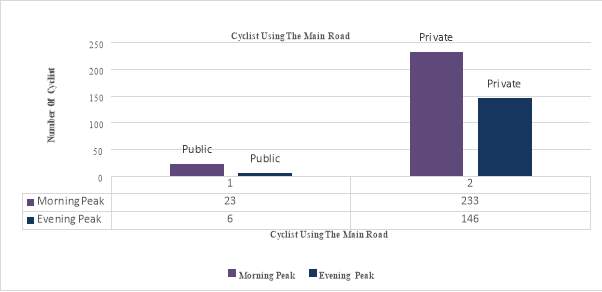
Figure 30 Using the Main Road at junction, Aldgate high street, (CS2)
The figure 30, above shows (2.05 %) cyclists were public, and those private bicycles were 379 cyclists which 26.91 % of those using the main road were more experienced cyclist.
Below figure 31, shows those cyclists that approached the signal control junction while green period and crossed the did not to stop were 469 cyclists. 33.30 % percent of the cyclist crossed the signal-controlled junction and they did not require stopping as they approached the signal at (Green period).
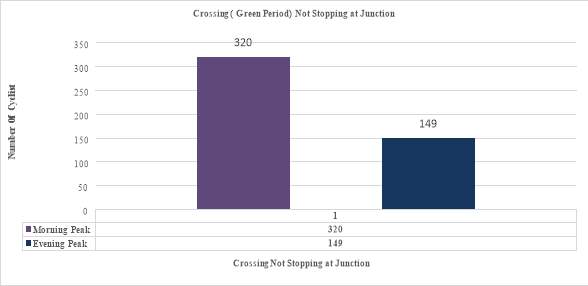
Figure 31 Not Stopping at Junction Crossing (Green Period), Aldgate high street, (CS2)
5.1.4 Saturation flow at Junction Cable Street CS3
Similar approach of the RN34 is applied to find out the saturation flow CS3, Cable Street signal controlled junction.
Below figure 32, shows the discharge histogram of the Morning peak, CS3, Cable Street, the saturation flow was measured in direction from (Barking to Tower gate) in morning peak. The saturation flow reached 1.50 cyclist / 2sec. that is 2700 cyclist/hr. 0.75 cyclist/sec.

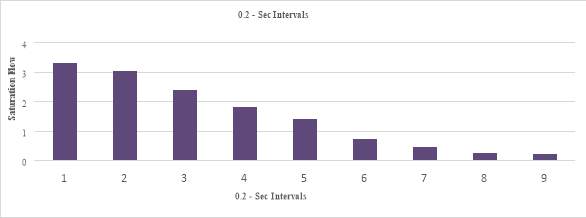
Figure 32 Flow Discharge Diagram at CS3, Cable Street (Morning peak)

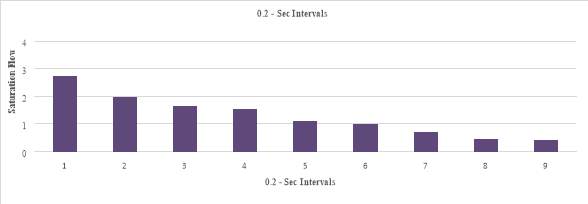
Figure 33 Flow Discharge Diagram at CS3, Cable Street (Evening peak)
The figure 33, above shows the discharge histogram of the evening peak, CS3, Cable Street, signal controlled junction. The saturation flow was measured in direction from (Tower gate to Barking) evening peak. Flow reached 1.29 cyclist / 2sec. that is 2322 cyclist/hr. 0.65 cyclist/sec. is 14 % less than the morning saturation flow.
5.1.5 Flow of cyclist at Junction Cable Street CS3
The figures 34 & 35, below shows the data gathered from morning peaks and the evening peak flow of the cyclist at each cycle lane, at the CS3 Cable Street, signal-controlled junction.
The histogram in the below figure 34 & 35 shows the flow characteristics of the cyclist at the junction.
During the 90mins of recording the total number of cyclist crossed, the signal-controlled junction were 676 cyclists. The evening peak total cyclist count recorded in 1.5hr flow reached 569 cyclists at the signal-controlled junctions.
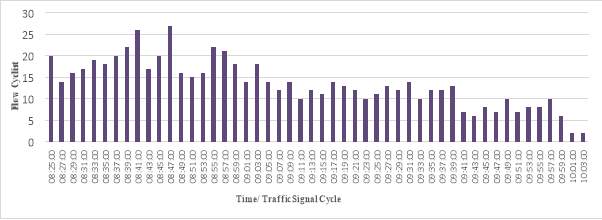
Figure 34 Cyclist flow at Cable – street, signal controlled junction (Morning peak)
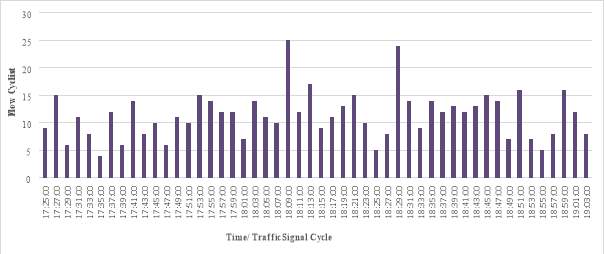
Figure 35 Cyclist flow at Cable – street, signal controlled junction (Evening peak)
5.1.6 Characteristic and behaviour of cyclist Junction Cable Street CS3
Below figure 36, show some of the characteristic and the behaviour of the cyclist at the signal Cs3 Cable Street.
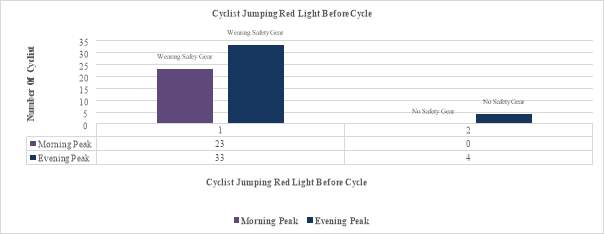
Figure 36 Cyclist Jumping Red before Cycle flow at Cable Street, signal controlled junction (CS3)
The figure 36 shows the total number of cyclist jumping red light before cycle, at the signal-controlled junction in the (morning) and (evening) peak.
Total number of cyclist that jumped the red light were recorded 60 cyclists, which is percentage 4.81 % of the total flow of the morning and evening peak. 56 (4.49) % of those cyclists jumped the red light were wearing safe gear (visibility clothing).
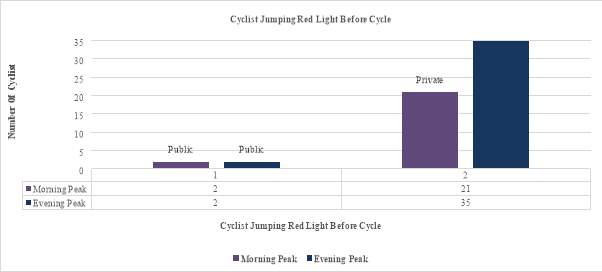
Figure 37 Cyclist Jumped Red Light before Cycle at Cable street, signal controlled junction (CS3)
The figure 37, above shows four 0.32% cyclists were public and those private bicycles were 56 cyclists in morning and evening peaks, which is 4.49%.
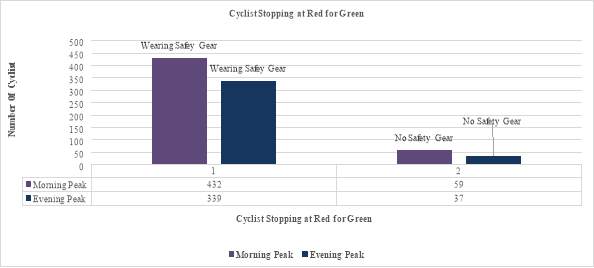
Figure 38 Cyclist Stopping at Red Signal for green at Cable Street, Signal controlled junction (CS3)
The above figure 38, shows, the number of cyclist stopped at Red Signal, waited for Green light at the signal-controlled junction were recorded 867 cyclists, which is 69.63 % of the total flow of the morning and the evening peak.
Those waited 771 cyclists were wearing 61.92 % (visible clothing), while 96 not wearing (visibility clothing). 7.71%
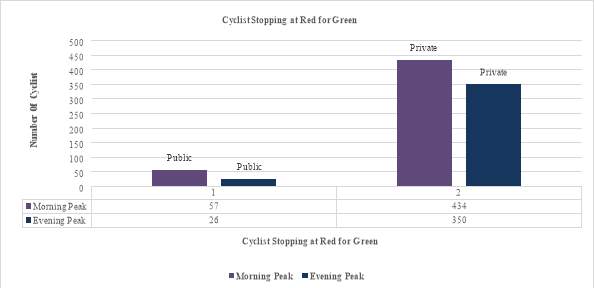
Figure 39 Cyclist Stopping at Red Signal for green at Cable Street, Signal controlled junction (CS3)
However, the figure 39, shows those that were public or private bicycles were 83 6.6% and 784 62.97% cyclists respectively.
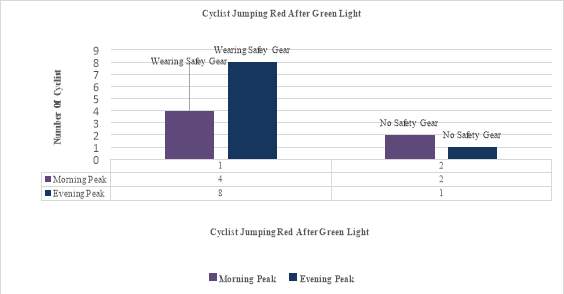
Figure 40 Cyclist Jumping at Red Signal after Green period ended Cable-street, signal controlled junction (CS3)
The figure 40, above shows the number of cyclist that jumped red light after the green period ended. Moreover, those jumped the signal were recorded to be 15 cyclists, which is total 1.20 % of the total flow of the Morning and Evening peak. 12 (0.96) % of those cyclists was wearing visibility clothing. Those not wearing is three cyclists 0.24%. 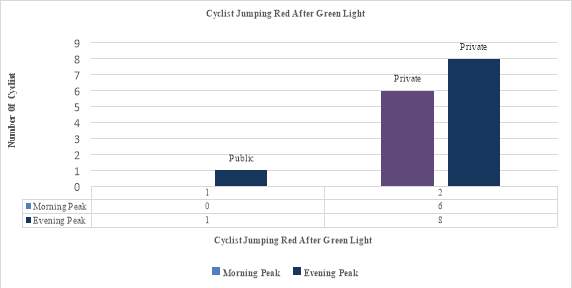
Figure 41 Cyclist Jumping at Red Signal after Green period ended Cable-street, signal controlled junction (CS3)
However, the figure 41, shows those that were public and private were one (0.80%) and 14 1.12% cyclists respectively.
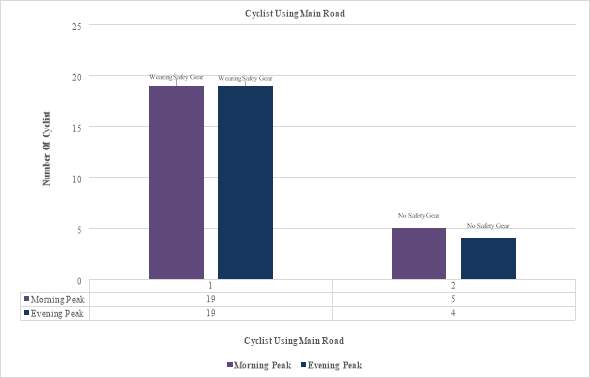
Figure 42 Cyclist Using the Main Road at Cable-street, signal controlled junction (CS3)
The figure 42, shows number of cyclist using the main road not using the segregated cycle lanes, at the signal controlled junction those recorded were 47 cyclists is around 3 % using the main road, which 38 cyclists were wearing visibility clothing. Nine cyclists not wearing visibility clothing. However, the difference 23 % less of those using the main road at segregated one-way cycle track.
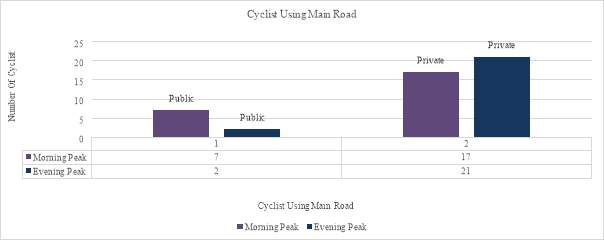
Figure 43 Cyclist Using the Main Road at Cable-street, signal controlled junction (CS3)
Figure 43, Those that were public or private bicycles were 9 0.72% and 38 3.05% cyclists respectively.
Below figure 44, shows, those cyclists that approached the signal control junction without stopping because they green signal, were 378 cyclists. 30.36 % percent of the cyclist crossed the signal controlled junction did not have to stop because of the Green period.
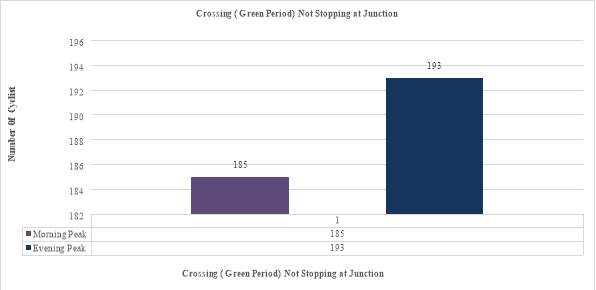
Figure 44 Not Stopping at Junction Crossing (Green Period), Cable Street, (CS3)
5.1.7 Saturation flow at Junction New Bridge Street CS6
Similar approach of the RN34 was applied to find out the saturation flow CS6, New bridge Street signal controlled junction.
Below figure 45, shows the discharge histogram of the Morning peak, CS6, New Bridge Street, the saturation flow was measured in direction from South to North. The saturation flow reached 3.98 cyclist/3sec. that is 4776 cyclists/hr. 1.33 cyclist/sec.
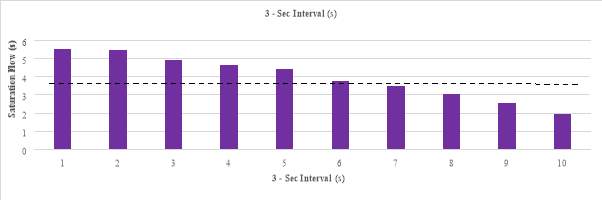
Figure 45 Flow Discharge Diagram at CS6, New bridge Street (Morning peak)
5.1.8 Flow of cyclist at Junction New Bridge Street CS6
The histogram in the below figure 46, shows the flow of the cyclist, highest number of cyclist crossed at the signal -controlled junction at once in green signal period (G) 30 sec, were recoded 64 cyclists at the morning peak. However, there was more cyclist could have crossed the junction due to short 30 sec green periods this was not possible, queues were made after each cycle. The queue of the cyclist waiting to cross the signal controlled junction reached 70 cyclist waiting to cross the signal in peak period.
The cycle lane reached maximum 1432 cyclist/h at morning peak between (8:25am-10:00am) the total number of cyclist crossed the signal controlled were 1709 cyclists.
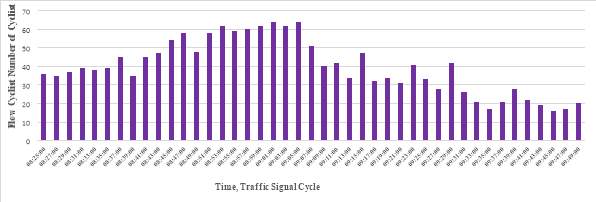
Figure 46 Cyclist flow at New Bridge Street, signal controlled junction CS6, (Morning Peak)
5.1.9 Characteristic and behaviour of cyclist Junction New Bridge Street CS6
Below data figure 47, show some of the characteristic and the behaviour of the cyclist at the signal CS6, New Bridge (Morning Peak).
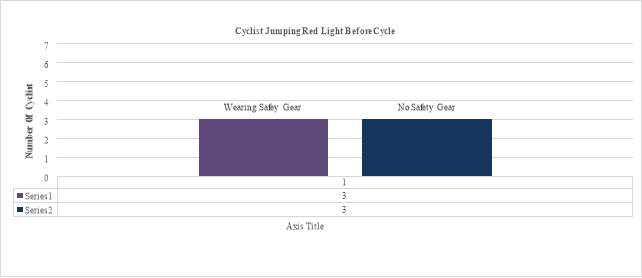
Figure 47 Cyclist Jumping Red before Cycle flow at New Bridge Street, signal controlled junction (CS6)
The figure 47, shows the total number of cyclist jumping Red light before cycle, at the signal controlled junction in the for the (morning) peak.
Total number of cyclist that jumped the red light were recorded 6 cyclists, which is percentage 0.35 % of the total flow of the morning peak. Three (0.17%) of those cyclists jumped the red light were wearing safe gear (visibility clothing). Moreover, three cyclists not wearing visibility clothing.
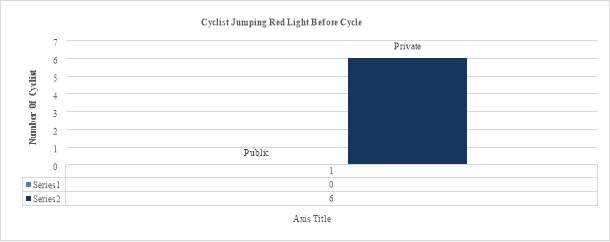
Figure 48 Cyclist Jumping Red before Cycle flow at New Bridge Street, signal controlled junction (CS6)
The figure 48, above shows zero cyclists were public, and those private bicycles were 6 (0.35%) cyclists in morning peak.
The figure 49, shows the total number of cyclist stopping, at the signal controlled junction in the (morning) peak.
Total number of cyclist that stopped at red signal were recorded 792 cyclists, which is percentage 46.34 % of the total flow of the morning peak. 746 (43.65%) of those cyclists stopped the red signal were wearing safe gear (visibility clothing). In addition, 54 (3.15 %) cyclists not wearing visibility clothing.
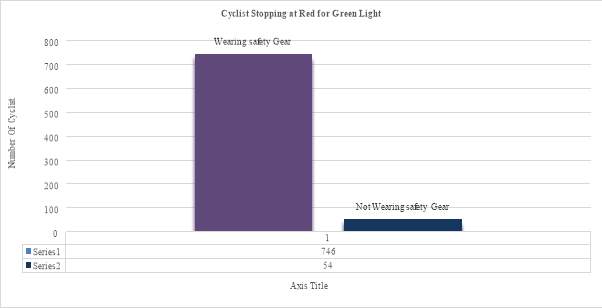
Figure 49 Cyclist stopped for Red Signal at New Bridge Street, signal controlled junction (CS6)
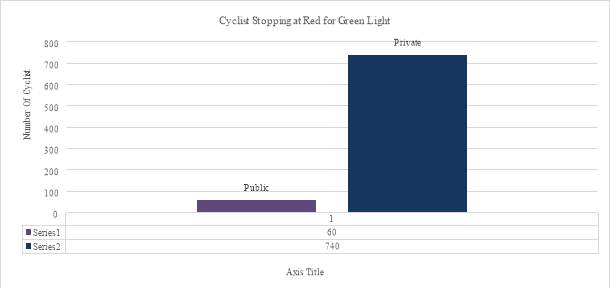
Figure 50 Cyclist stopped for Red Signal at New Bridge Street, signal controlled junction (CS6)
The figure 50, above shows 60 (3.51%) cyclists were public, and those private bicycles were 740 (43.30%) cyclists in morning peak.
The figure 51, shows the total number of cyclist Jumping Red Signal after Green period ended, at the signal controlled junction in the (morning) peak.
Total number of cyclist that Jumped Red Signal after Green period ended were recorded 11 cyclists, which is percentage 0.64 % of the total flow of the morning peak. 10 (0.58%) of those cyclists violated the signal were wearing safe gear (visibility clothing). In addition, 1 (0.05%) cyclist not wearing visibility clothing.
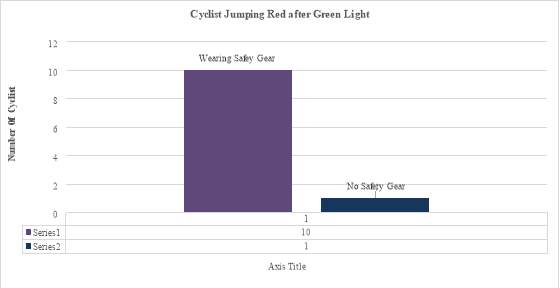
Figure 51 Cyclist Jumped Red Signal after Green period ended at New Bridge Street, signal controlled junction (CS6)
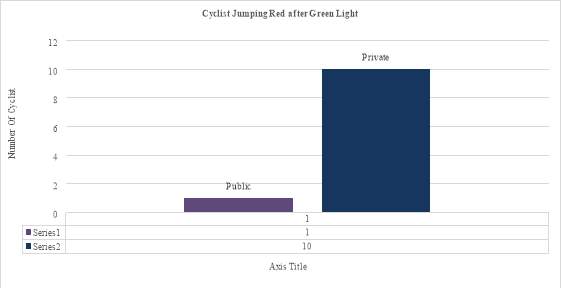
Figure 52 Cyclist Jumped Red Signal after Green period ended at New Bridge Street, signal controlled junction (CS6)
The figure 52, shows one (0.05%) cyclist was public, and those private bicycles were 10 (0.58%) cyclists in morning peak.
The figure 53, shows the total number of cyclist using the Main road, at the signal controlled junction in the (morning) peak.
Total number of cyclist that using the main road were recorded 13 cyclists, which is percentage 0.76 % of the total flow of the morning peak. 13 (0.76%) of those cyclists using the main road were wearing safe gear (visibility clothing).
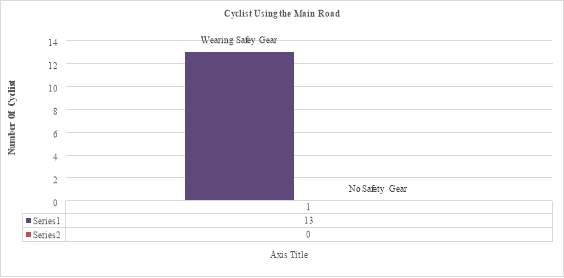
Figure 53 Cyclist Using the Main Road at New Bridge Street, signal controlled junction (CS6)
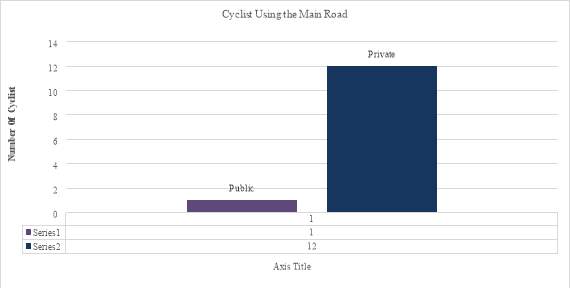
Figure 54 Cyclist Using the Main Road at New Bridge Street, signal controlled junction (CS6)
The figure 54, shows one (0.05%) cyclist was public, and those private bicycles were 12 (0.70 %) cyclists in morning peak.
The figure 55, shows the total number of cyclist crossed the junction and did not have to stop because of the green period was still valid, at the signal controlled junction in the (morning) peak.
Total number of cyclist that crossed not stopping were recorded 895 cyclists, which is percentage 52.36 % of the total flow of the morning peak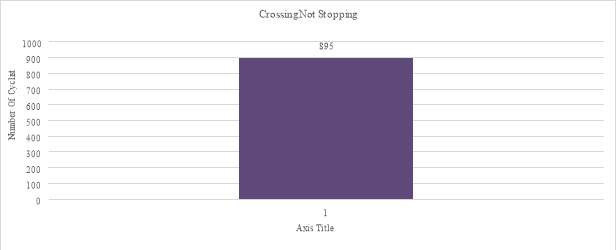
Figure 55 Cyclist Crossed not stopping at New Bridge Street, Signal controlled junction (CS6)
6. Chapter 5
Analysis & Discussion
6.1.1 Saturation flow
From the methodology presented in the literature review, we can stablish the effect of the saturation flow because of the gradient, below figure show the effect of the gradient on saturation flow same width of cycle lane of 1.75 m with different in saturation flow measured is 13%.
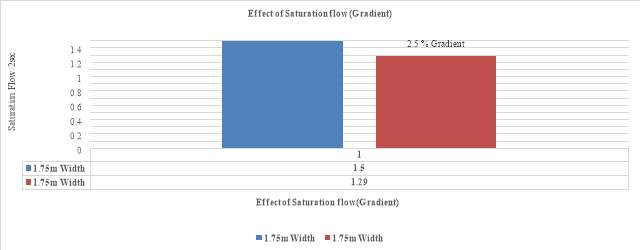
Figure 56 effect of gradient on saturation flow
The below presented table 8, compares all results obtained of saturation flow and the geometry details of the segregated cycle lanes measured.
| Scheme | Junction | Direction | Width Of the Cycle Lanes | Gradient at the Approach of junction | Saturation flow
Cyclist/hr |
| CS2 – One-Way Cycle lane | Aldgate High-street | Stratford to Aldgate | 1.80 m | 0 % | 1.73/2sec
0.86/sec 3114 cyclist / hr |
| CS2 – One-Way Cycle lane | Aldgate High-street | Aldgate to Stratford | 1.80 m | 0 % | 1.40/ 2sec
0.70/sec 2520 cyclist/hr |
| CS3 – Two Cycle Lane | Cable Street | Barking – Tower London | 1.75 m | 0.63 % | 1.50 / 2sec
0.75/sec 2700 cyclist hr |
| CS3 – Two Cycle Lane | Cable Street | Tower London – Barking | 1.75 m | 2.5 % | 1.29 /2sec
0.65/sec 2322 cyclist/hr |
| CS6 –Two – Way Cycle Lane | New bridge Street / Fleet Street | South- North | 2 m | 2 % | 3.98/3sec
2.65/2sec 1.33/sec 4776 cyclist/hr |
Table 8 Saturation flow measured all schemes and geometry details of lanes
The below figure 57, presents measured saturation flow of the schemes considered for this research the figure below indicate the saturation flow increases with width of the road linearly, we have established a relationship and analysis of the saturation and generated an equation that will get you rough estimation of the (S) saturation flow expected with any width of road.
S = 4.6*w – 6.55
The above equation can use be used with good confidence and accuracy, you do not have go and measure what we measured in this project, the equation above will give you rough estimation of the saturation flow expected for any width of lane.
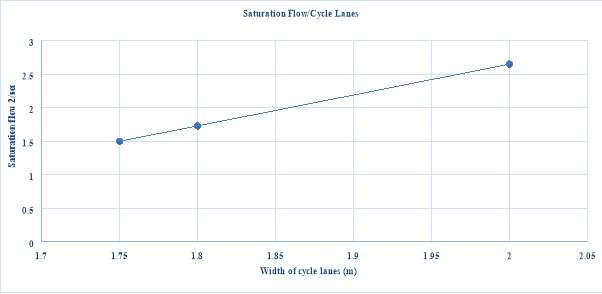
Figure 57 Rough prediction of the Saturation flow graph
From the methodology presented in the literature review, it was possible to process the data obtained from the segregated cycle lanes measured in this research.
The figure 57, indicates if the width of the cycle lane increases, the saturation flow will also rise reaching the maximum value.
The Saturation flow equation for cyclist will be useful for traffic engineer’s planners designing a cycle lane at intersection using the equation above will give a rough estimation of cycle expected width different of cycle lane.
6.1.2 Characteristics and Behavior of cycle lanes at Signal Controlled Junction
The table 9, below compares the number of cyclist that have violated the traffic signal control at all schemes morning and evening peak. The Transgressors were counted that did not flow the standards established in the literature review. However, the noticeable ones can be seen in the table below is a breakdown of those violated the traffic lights. Total number of cyclist that jumped the red light were recorded 217 cyclists, which is 4.97 % of the total flow from the entire three scheme. As you can see from the table it also indicates, the percentages of the private cyclist that have violated the traffic light were higher than public cyclist 4.26% and 1.39% respectively.
In addition, those cyclist wearing the safety gear (visibility) clothing were 3.57% and not wearing reflective clothing were 1.39 % of the total flow of all schemes.
| Cyclist Jumping Red light before cycle and after cycle (Cyclist Violating the signal) | ||||||||||
| SCHEMES | Number of cyclist Wearing Safety Gear (visible Clothing) | Number of Cyclist Not Wearing Safety Gear (visible Clothing) | Number of Public (Bicycles) | Number of Private (Bicycles) | Number of Cyclist counted at each scheme | |||||
| No of cyclist: | Percentage % | No of cyclist: | Percentage % | No of cyclist: | Percentage % | No of cyclist: | Percentage % | |||
| CS2 | 75 | (5.32%) | 50 | (3.55%) | 25 | (1.77%) | 100 | (7.10%) | 1408 | |
| CS3 | 68 | (5.46%) | 7 | (0.56%) | 5 | (0.40%) | 70 | (5.22%) | 1245 | |
| CS6 | 13 | (0.76%) | 4 | (0.23%) | 1 | (0.58%) | 16 | (0.93%) | 1709 | |
| Total Number of Cyclist Violated the Signal Control Junction | ||||||||||
| TOTAL | 156 | 3.57 % | 61 | 1.39 % | 31 | 1.39 % | 186 | 4.26 % | 4362 | |
Table 9 Analysis of the Cyclist Jumping the Red Light
The table 10, below presents number of cyclist that have stopped at the traffic red signal for green light, total number of those stopped 59%, which number of the cyclist wearing safety gear (visibility clothing) were 51.94% and those not wearing 7.79%.
The percentages of the private cyclist that have stopped the red signal for green light were higher than the public cyclist 54.37% and 5.36% respectively.
| Cyclist Stopping at Red signal for Green light | ||||||||||||
| Schemes | Number of cyclist Wearing Safety gear (visible clothing) | Number of Cyclist Not Wearing Safety Gear (visible clothing) | Number of Public (Bicycles) | Number of Private (Bicycles) | Number of Cyclist counted at each scheme | |||||||
| No of cyclist: | Percentage % | No of cyclist: | Percentage % | No of cyclist: | Percentage % | No of cyclist: | Percentage % | |||||
| CS2 | 749 | (53.19%) | 190 | (13.49%) | 91 | (6.46%) | 848 | (60.22%) | 1408 | |||
| CS3 | 771 | (61.92%) | 96 | (7.71%) | 83 | (6.6%) | 784 | (62.97%) | 1245 | |||
| CS6 | 746 | (43.65%) | 54 | (3.15%) | 60 | (3.51%) | 740 | (43.30%) | 1709 | |||
| Total Cyclist Stopping at Red signal for Green light | ||||||||||||
| TOTAL | 2266 | 51.94% | 340 | 7.79 % | 234 | 5.36 % | 2372 | 54.37 % | 4362 | |||
Table 10 Analysis of the Cyclist Stopped at Red Signal for Green Light
The table 11, presents the number of cyclist that have been using the main roads at all schemes morning and evening peak. However, the noticeable ones were scheme CS2 can be seen in the table below had 0 % gradient, which had the more cyclist using the main road.
Total number of cyclist using the main road in all schemes were recorded 468 cyclists, which is 10.72 % of the total flow. As you can see from the table it also indicates, the percentages of the private cyclist that have using the main road were higher than public cyclist 9.83% and 0.89 % respectively.
In addition, those cyclist wearing the safety gear (visibility) clothing were 8.16 % and not wearing reflective clothing were 2.56 %.
| Cyclist Using the Main Road | |||||||||||
| SCHEMES | Number of cyclist Wearing Safety gear (visible clothing) | Number of Cyclist Not Wearing Safety Gear (visible clothing) | Number of Public (bicycles) | Number of Private (bicycles) | Number of Cyclist counted at each scheme | ||||||
| No of cyclist: | Percentage % | No of cyclist: | Percentage % | No of cyclist: | Percentage % | No of cyclist: | Percentage % | ||||
| CS2 | 305 | (21.66) | 103 | (7.31%) | 29 | (2.05%) | 379 | (26.9%) | 1408 | ||
| CS3 | 38 | (3.05%) | 9 | (0.722%) | 9 | (0.722%) | 38 | (3.05%) | 1245 | ||
| CS6 | 13 | (0.76%) | 0 | 0 | 1 | (0.58%) | 12 | (0.70%) | 1709 | ||
| Total Number of Cyclist Using the Main Road | |||||||||||
| TOTAL | 356 | 8.16% | 112 | 2.56% | 39 | 0.89% | 429 | 9.83% | 4362 | ||
Table 11 Analysis of the Cyclist Using the Main Road
The table 12, is presented number of bicycles that have been using the pavement to avoid waiting at the signal controlled junction to turn left. The percentage of this transgressor were very low about 0.38 % of the total flow of all schemes, however the site CS2 with 0 % gradient have higher number than the other sites.
| Cyclist Using the Pavement | |||||||||
| SCHEMES | Number of cyclist Wearing Safety gear (visible clothing) | Number of Cyclist Not Wearing Safety Gear (visible clothing) | Number of Public (bicycles) | Number of Private (bicycles) | Number of Cyclist counted at each scheme | ||||
| No of cyclist: | Percentage % | No of cyclist: | Percentage % | No of cyclist: | Percentage % | No of cyclist: | Percentage % | ||
| CS2 | 1 | (0.07%) | 9 | (0.63%) | 1 | (0.07%) | 9 | (0.63%) | 1408 |
| CS3 | 5 | (0.40%) | 2 | (0.16%) | 1 | (0.80%) | 6 | (0.48%) | 1245 |
| CS6 | 0 | 0 | 0 | 0% | 0 | 0% | 0 | 0% | 1709 |
| Total Number Cyclist Using the Main Road | |||||||||
| TOTAL | 6 | 0.13% | 11 | 0.25% | 2 | 0.04% | 15 | 0.34% | 4362 |
Table 12 Analysis of the Cyclist Using the Pavement to (Turn left)
The below table 13, presents number of cyclist crossing the signal controlled junction while the signal was green the total number of cyclist crossed not stopping were 1742 which 39.39% of the total flow on all schemes considered for this project.
| Cyclist Crossing the Signal Controlled junction Not Stopping | ||||
| SCHEMES | Cyclist Crossing Not Stopping | Number of Cyclist Counted at each Scheme | ||
| No of cyclist: | Percentage % | |||
| CS2 | 469 | (33.30%) | 1408 | |
| CS3 | 378 | (30%) | 1245 | |
| CS6 | 895 | (52.36%) | 1709 | |
| Total Number of Cyclist Crossed Not Stopping | ||||
| TOTAL | 1742 | 39.93% | 4362 | |
Table 13 Analysis of the Cyclist Crossing the Signal controlled Junction Not Stopping (green-period)
6.1.3 Analysis of Delays
With the videos recorded, it was possible to obtain the delays at the junction. For over a period of five minutes taken to consideration to work the average delays for the segregated cycle lanes at the signal-controlled junction on all the schemes.
6.1.4 The delays at the CS2 Morning & Evening Peak
The table 14 & 15, below shows the delays at the CS2 morning & Evening Peak
| Delays at CS2 Morning Peak | |
| Cyclist Stopping | 46 (Cyclist) |
| Non – Stopping Cyclist | 32 (Cyclist) |
| Total Cyclist Delay | 690 (Sec) |
| Average Delay per Cyclist | 8.84 (Sec) |
| Average Delay per Stopping Cyclist | 15 (Sec) |
| The Proportion of Cyclist Stopping | 0.58 |
Table 14 Analysis of Delay at CS2 Morning Peak
| Delays at CS2 Evening Peak | |
| Cyclist Stopping | 40 (Cyclist) |
| Non – Stopping Cyclist | 21 (Cyclist) |
| Total Cyclist Delay | 600 (Sec) |
| Average Delay per Cyclist | 9.83 (Sec) |
| Average Delay per Stopping Cyclist | 15 (Sec) |
| The Proportion of Cyclist Stopping | 0.75 |
Table 15 Analysis of Delay at CS2 Evening Peak
6.1.5 The delays at the CS3 Morning & Evening Peak
Below table16 & 17, presents analysis of the delay at the CS3 morning and evening peak
| Delays at CS3 Morning Peak | |
| Cyclist Stopping | 41 (Cyclist) |
| Non – Stopping Cyclist | 23 (Cyclist) |
| Total Cyclist Delay | 615 (Sec) |
| Average Delay per Cyclist | 9.61(Sec) |
| Average Delay per Stopping Cyclist | 15 (Sec) |
| The Proportion of Cyclist Stopping | 0.64 |
Table 16 Analysis of Delay at CS3 Morning Peak
| Delays at CS3 Evening Peak | |
| Cyclist Stopping | 34 (Cyclist) |
| Non – Stopping Cyclist | 13 (Cyclist) |
| Total Cyclist Delay | 510 (Sec) |
| Average Delay per Cyclist | 10.85 (Sec) |
| Average Delay per Stopping Cyclist | 15 (Sec) |
| The Proportion of Cyclist Stopping | 0.72 |
Table 17 Analysis of Delay at CS3 Evening Peak
6.1.6 The delays at the CS3 Morning Peak
Below table 18, presents analysis of the delay at the CS6 Morning the delays at this junction were very high compare with the other schemes we look at.
The morning peak period the number of cyclist stopped at the junction were recorded up to 50 – 60 cyclist queued because of the short green period and gradient been considered not enough for all cyclist to cross the signal-controlled junction, higher queues were always made at the junction.
| Delays at CS6 Morning Peak | |
| Cyclist Stopping | 161 (Cyclist) |
| Non – Stopping Cyclist | 16 (Cyclist) |
| Total Cyclist Delay | 2415 (Sec) |
| Average Delay per Cyclist | 13.64 (Sec) |
| Average Delay per Stopping Cyclist | 15 (Sec) |
| The Proportion of Cyclist Stopping | 0.90 |
Table 18 Analysis of Delay at CS6 Morning Peak
7. Chapter 6
7.1 Conclusions
Overall, the measurement technique chosen for this project were able to achieve all the objectives of this research in addition we have also looked into the behavior of cyclist at the signal-controlled junction.
The saturation flow was measured using the RN34 reached a maximum value of 4776 cyclists/h in morning peaks for 2m width lane, with 2% gradient, two-way cycle lane CS6 due to the limitation, we have only measured the saturation in the morning peak. However, with 0 % gradient more saturation flow could be achieved with width of 2m lane.
We have observed other schemes to determine the saturation flow, CS2 one-way fully segregated cycle lane width (1.80 m) 0% gradient on both approaches of the junction, the flow reached 3114 cyclists/h –lane in morning peak, and 2520 cyclist/hr. in the evening peak.
However, the scheme CS3 two-way fully segregated cycle width of (1.75m) with 0.63% gradient reached maximum value of 2700 cyclist/h in morning peak approach (Barking to Tower London), and the evening peak approach (Tower London to Barking) the measured gradient is 2.5% the saturation flow reached, 2322 cyclist/h in evening peak, which is 8% less saturation than the morning peak due to effect of the gradient on saturation which is been discussed in the literature review paper.
According to (TFL, 2014) LCDS indicatively high cycle flow can be achieved on segregated cycling superhighway for one-way cycle lanes over 800 cycles per hour at peak, 1000 cycles per hour on two-way cycle lanes, the recommended with width of the lanes are 2.5 meter, and 4.0 meter respectively. However, this was not the case, in comparison the saturation flow measured for a two-way cycle 4m each lane width of 2m each, with 2% gradient was 4776 which is 21% higher than the saturation flow recommended, in London cycling design standards (LCDs),
However, the measured results are comparison with to the other studies which measured the saturation flow. According to the experimental study for estimating capacity of the cycle lanes which was done by (Seriani, Fernandez and Hermosilla 192-203). in central London Tavistock square they have suggested that they could get they could get saturation flow of 2.40 bicycles/2sec, which is 4320 bicycles/h-lane, on two-way cycle lane with 2m width each lane 1m, this study is based on the partially segregated cycle lanes.
However, the values of saturation flow measured in this research project were in line with the international studies on the different capacity for cycle lanes, discussed in the literature review. We have learned there is different are different values of saturation flow for cycle lane, moreover there is no clear reference on to identify which one is the correct capacity of the cycle lane.
In this research we have managed to identify the correct saturation flow of the cycle one –way or two – way cycle and also established a relationship with the width and the saturation flow of the measured schemes, this research
It has understood from the methodology presented in this report if the width increases the saturation flow will also increase linearly.
We have established a relationship between saturation flow and width based on the schemes measured in (chapter 5).
With confidence were able to produce the saturation flow equation for segregated cycle lane that will get you rough estimation of the (S) saturation flow expected with any width of road.
S = 4.6*w – 6.55
The above equation can use be used with good confidence and accuracy, you do not have go and measure what we measured in this project, the equation above will give you rough estimation of the saturation flow expected for any width of lane.
The above equation will help traffic engineers and planners with the calculation of the saturation flow and optimum width, further work is required in field required which will look into the effect of saturation flow due gradient and other geometry factors on the junction approach.
Behavior of cyclist at signal controlled junction the number of cyclist wearing safety gear (Visibility clothing)
According to Study (Safety net document for pedestrians and cyclist, 2009) cited by (TFL, 2011) have suggested some of the issues for cyclist is their luck of visibility, and appearance is to me a major contributory factor in the rates of collisions whether approaching from rear or to the side.
However, the percentage of cyclist wearing their (visibility clothing) were very high in all schemes measured in this report over 75 % of the cyclist were wearing some form of visibility clothing helmet full body gear etc.
The was no evidence from the video analysis the behavior of cyclist at the signal at controlled junction small number of cyclist went through red light, however over all schemes measured the percentage of cyclist that have violated the signal controlled junction were very small percentage 4.96 %.
However, the noticeable was the schemes with 0% percent gradient had high number of transgressors comparing with the other schemes.
Overall, the percentage of cyclist using the main road were smaller over all 10.72 %. moreover, the noticeable ones were, the schemes with high 0% gradient had more of this cyclist using the main road not the segregated cycle lane provided.
From this research report, we have learned schemes like CS6; the green period was only for 30 secs in morning peak. Due to high number of cyclist queueing up at junction, 30 secs is not enough for all cyclist to clear the junction. At some point in the morning peak, there were more cyclist than people in road.
Number of cyclist waiting at signal controlled junction were recorded in the morning peak which reached up to 70 cyclist queuing up the signal controlled junction for green signal, queueing was made after each cycle, due to not enough time for the cyclist to cross the junction.
The delays of CS6, the total cyclist delay was 2415 secs, and the average delay per stopping cyclist were 15 sec. average delay per cyclist is 13.64 sec.
7.2 Recommendations for further work
REFERENCES:
- “Capacity And Saturation Flow Rate”. Webpages.uidaho.edu. N.p., 2016. Web. 29 Dec. 2016.
- “London Cycling Design Standard”. TFL. N.p., 2016. Web. 2 Dec. 2016.
- “Signal Detection And Actuation – National Association Of City Transportation Officials”. National Association of City Transportation Officials. N.p., 2016. Web. 9 Dec. 2016.
- “Two-Way Cycle Tracks – National Association Of City Transportation Officials”. National Association of City Transportation Officials. N.p., 2016. Web. 9 Dec. 2016.
- ‘’Cyclist behaviour call off TFL report’’ TFL. N.p., 2016. Web. 2 Dec. 2016.
- ‘’INTERNATIONAL CYCLING INFRASTRUCTURE BENCHMARKING STUDY DRAFT REPORT’’ TFL. N.p., 2016. Web. 2 Dec. 2016
- ‘’Traffic Modelling Guidelines’’. TFL. N.p., 2016. Web. 20 Oct. 2016.
- “Laboratory, Road Research”. “Road Research”. OR 4.2 (1963): 30. Web.
- “TRANSPORTATION RESEARCH RECORD 1320” pdf file, Retrieved November 22, 2016, from http://onlinepubs.trb.org/Onlinepubs/trr/1991/1320/1320-018.pdf
- Akcelik, R. Traffic Signals. 1st ed. Vermont South, Vic.: Australian Road Research Board, 1981. Print.
- Botma, H. Method to Determine Level of Service for Bicycle Paths and Pedestrian-Bicycle Paths. 1st ed. Print.
- Brandston, D.M., Van Zulylen, J.M. (1978). Estimation of Saturation Flow, Effective Green Time and Passenger Car Equivalents at Traffic Signal by Linear Multiple Linear Regression’’, Transport Research Journal Vol.12, UK.
- Branston, David and Peter Gipps. “Some Experience with A Multiple Linear Regression Method of Estimating Parameters of the Traffic Signal Departure Process”. Transportation Research Part A: General 15.6 (1981): 445-458. Web
- Garber, NJ and LA Hoel. Traffic and Highway Engineering, 4Th Ed. 1st ed. Toronto, Canada: Cengage Learning, 2009. Print.
- HCM 2010. (2010). 1st ed. Washington, D.C.: Transportation Research Board.
- HCM, 2000. Highway Capacity Manual, Chapter 11 Pedestrian and Bicycle Concepts. Transportation Research Board, Washington, D.
- Richards, Brian. Transport in Cities. 1st ed. London: Architecture Design and Technology Press, 1990. Print. P54
- Scragg, D.A (1964). “Determination of Passenger Car Equivalent of a Goods Vehicle in a Single Lane Flow at Traffic Signals’’
- Seriani, Sebastian, Rodrigo Fernandez, and Esteban Hermosilla. “Experimental Study For Estimating Capacity Of Cycle Lanes”. Transportation Research Procedia 8 (2015): 192-203. Web.
- Slinn, M., Guest, P. and Matthews, P. (1997). Traffic engineering design, principles and practice. 1st ed. London: Arnold.
- Transport, and Road Research Laboratory. A method of measuring saturation flow at traffic signals Road Note No. 34, HMSO, London (1963).
- Urban Travel and Sustainable Development. 1st ed. Paris: European Conference of Ministers of Transport, 1995. Print.p109.
Cite This Work
To export a reference to this article please select a referencing stye below:
Related Services
View all


Related Content
All TagsContent relating to: "Transportation"
Transportation refers to the process of goods, people or animals being moved from one place to another. There are multiple methods of transport, including train, boat, bus, plane, lorry, and more.
Related Articles

DMCA / Removal Request
If you are the original writer of this dissertation and no longer wish to have your work published on the UKDiss.com website then please: