History of Tooth-Size Discrepancy Analyses
Info: 12495 words (50 pages) Dissertation
Published: 13th Dec 2019
Tagged: Dentistry
Andrews in his study in 1972, outlined “The six keys to normal occlusion” these include: Molar relationship, correct crown angulation, correct crown inclination, no rotation, tight contacts and flat occlusal planes.2 Bennett and McLaughlin, added a seventh key which was correct tooth size. In order to achieve an ideal occlusion with satisfactory intercuspation and a correct overjet and overbite, the maxillary and mandibular teeth must be proportionate in size.1 Mesiodistal tooth width has an anthropological significance because it provides valuable information on human evolution with its technological and dietary changes.3, 4 Clinically, mesiodistal tooth width is correlated to the arch alignment and large teeth are associated with crowded dental arches.5, 6 Many authors studied tooth width in relation to occlusion and proposed different methods of measuring the TSD.2, 7-9 Researchers have been interested in determining if patients with differing malocclusion groups have different prevalence of TSD. Most evidence suggests that TSD tend to have slightly larger incidence with Class III patients with mandibular tooth excess.10, 11
- History of Tooth-Size Discrepancy Analyses:
G.V. Black in 1902 was the first to study the mesio-distal widths of teeth. The mean dimensions found in his study are still being acknowledged in current research.12 In 1923, Young investigated inter-arch asymmetries. He reported two cases that had normal posterior occlusion but presented different overbites. He measured the tooth widths of the central incisors to the second premolars in both arches and found that the patient with anterior end-to-end occlusion had maxillary teeth that were 10.9 mm larger than the mandibular teeth while the patient with larger overbite had a difference of 17.0 mm.13 However, Young’s new idea of TSD being an etiologic factor to malocclusion was not given much consideration until Ballard14 published on intra-arch asymmetries in 1944. He measured 500 sets of dental casts and compared the mesio-distal widths of each tooth with its contralateral. He found that more than 90% of cases had 0.25mm or greater TSD between the left and right sides of an individual arch with more than 80% having discrepancies of 0.5mm or greater. Ballard suggested interproximal stripping of teeth to balance out arches with larger asymmetries.14
In 1949 Neff conducted a study comparing the widths of the maxillary and mandibular anterior teeth to come up with a ratio that he called “the anterior coefficient”. He credited Kesling (1945) and his invention of the tooth positioner with popularizing the serious investigation of inter-arch TSD. To create a tooth positioner teeth are individually sectioned from a plaster model of a patient’s dental arches and replaced into an ideal position, holding them with wax. A rubber mold is then made of this ideal cast and the patient wears it for several weeks to help move the teeth into the new setup. In the creation of these positioners Kesling and other orthodontists realized that it was impossible to idealize some patients’ setups.7 In order to examine TSD, Neff measured over 200 dental casts and found a range of 1.17 to 1.41 for the anterior coefficient. He then concluded that to achieve an ideal occlusion with overbite of 20% the coefficient should range between 1.20 and 1.22. A higher anterior coefficient was associated with deeper bite. Neff then created one of the first mathematical formulas for determining TSD before orthodontic treatment is initiated.
Ballard, Neff and Kesling’s work helped create a shift in the view of the importance of TSD in the field of orthodontics.7, 8
Wheeler (1940), one of the main investigators in dental anatomy, published a textbook containing tooth dimensions which have been formulated so that artificial teeth could be fabricated and set up in an ideal occlusion.15
- The Bolton Analysis:
In 1958 a study conducted by Wayne A. Bolton9 investigated TSD, which he described as tooth size disharmony. The study was carried out in a way similar to Neff’s study in 1949. The aim of the Bolton study was to analyze a group of individuals with “excellent occlusion” and to determine whether or not statistically proven mathematical ratios could be established between the sum tooth widths of the lower dental arch and the upper dental arch, both for overall dental arch length (first molar to first molar) and anterior dental arch length (canine to canine). By establishing a way for assessing TSD, Bolton helped clinicians in diagnosing and treatment planning orthodontic problems, and in determining treatment outcomes.8, 9, 11
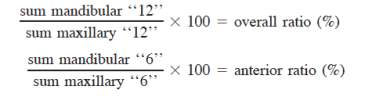
Bolton’s sample consisted of fifty-five subjects with “excellent occlusion” according to the author. Forty-four cases were treated orthodontically without extraction and eleven untreated cases with excellent occlusion. The dental casts of the sample with excellent occlusion were chosen from ten different private practices and the department of orthodontics at the University of Washington. Bolton used three-inch needle pointed divider to measure the mesiodistal width of all the teeth except second and third molars. The dimensions were measured to the nearest millimeter. The sum of the twelve mandibular teeth was calculated and compared to the sum of the twelve maxillary teeth. He named this ratio the “over-all ratio”. The ratio was defined as:
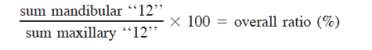
The same method was used to identify a ratio between the six anterior mandibular to the corresponding maxillary anterior teeth. The anterior ratio was defined as:

In the same study, Bolton also measured the degree of overbite, overjet, angles of the maxillary and mandibular incisors to the occlusal plane, incisor length, and cusp height. He found the mean of overbite of his sample was 31%. Bolton emphasized the need for considering the premolar sizes on an individual basis before making the final decision in the extraction cases. However, he could not find many clinically significant correlations from most of these measurements.
For the overall ratio, Bolton found the range to be between 87.5 to 94.8 with a standard deviation of 1.91 and a mean of 91.3%. According to Bolton’s research, if the overall ratio for a given patient was greater than 91.3%, then it can be said that the patient has “mandibular excess” or “maxillary deficiency”. A ratio of less than 91.3% would be indicative of “maxillary excess” or “mandibular deficiency”. In the case of significant mandibular excess, the occlusion will show the following: may not have enough overjet to properly finish a case by having spaces between the maxillary anteriors when the posterior segment is in proper interdigitation or may be Class II in the posterior if the anterior teeth are properly aligned. A case with maxillary excess would have the opposite problem with excess overjet. For the anterior ratio the mean was 77.2% while the range was 74.5-80.4 with a standard deviation of 1.65.
Bolton highlighted the advantages of his formulas. He stated that the analyses could be completed easily and efficiently. However, he still suggested doing a diagnostic setup if the analysis found a large discrepancy so that the TSD could be more adequately visualized. In 1953, a year after its development, the analysis was included the diagnosis of every orthodontic case treated at the University of Washington.8, 9
In 1962 Bolton published a follow-up clinical application article. The article focused on the clinical use of his analysis with emphasis on various extraction patterns. Bolton also revealed two clinical features that could affect the anterior TSD, one of which was the labial angulation of the incisors and the other was their labiolingual thickness. Bolton concluded that the two ratios could be used as diagnostic tools, allowing clinicians to assess the functional and aesthetic outcome of treatment without the use of a diagnostic wax up.8, 16 Since Bolton introduced his analysis in the late 1950’s it has become an important diagnostic tool for orthodontists around the world. The Bolton analysis has become so widely accepted that TSD are now often called Bolton discrepancies.17
- Causes of tooth size discrepancy:
The size and form of teeth are mainly genetically determined. However growth and morphology of the dentition and facial structures is absolutely influenced by environmental factors. In fact, Harris and Smith suggested that the position of teeth and occlusion are more influenced by environment than heredity.18 Analysis of the nature of malocclusion, by Lundstrom, concluded that the genetic contribution to dental anomalies was only 40%. Lundstrom had previously studied 50 pairs of monozygotic twins and 50 pairs of dizygotic twins. In that study, he concluded that heredity played a major role in determining width and length of arch, crowding and spacing of the teeth, and degree of overbite.19 The most common dental abnormality is variation in size, particularly of maxillary lateral incisors. Alvesalo and Portin have provided a significant evidence to support the view that missing and malformed lateral incisors may be the result of a common gene defect. Abnormalities range from peg shaped through microdontia to missing lateral incisors, all of which have familial trends, are associated with other dental anomalies such as ectopic canines.20
- Methods of assessment of tooth size discrepancy:
The importance of correct tooth size proportions between the upper and lower arches has been demonstrated. G. V. Black in 1902 was the first one who assessed tooth size and measured the mesio-distal widths of a large number of human teeth in order to establish the mean dimensions for each tooth in the dental arch.12 Neff developed an anterior coefficient, which was a proportion for the width dimension of the teeth. A ratio of 1.20 – 1.22 when the maxillary mesio-distal sum was divided by the mandibular mesio-distal sum would result in an optimal overbite.7 Lundström studied the relationship between the mandibular and the maxillary anterior sum and named it “the anterior index”. The optimal ratio was found to be from 73 to 85%, with a mean of 79% for an ideal overbite.21 Gilpatric showed that the total mesio-distal tooth diameters in the maxillary arch exceeded those in the mandibular arch by 8 – 12 mm, and a value greater than this resulted in an excessive overbite.22 However, the most recognized work is that of Dr. Wayne Bolton (1958)9 who assessed tooth size disharmony in relation to the treatment of a malocclusion. Bolton’s analysis included comparisons of the total mesio-distal widths of the dental arches including the distal surfaces of the first molars. The summed mesio-distal widths of twelve mandibular to maxillary teeth were measured for the overall ratio, and the six anterior mandibular to the corresponding maxillary teeth for the anterior ratio.
Bolton concluded that an overall ratio of 91.3 ± 2SD and an anterior ratio of 77.2 ± 2SD were necessary for proper articulation of maxillary and mandibular teeth. 9, 11, 16
- Methods for measuring tooth width for Bolton ratios:
There are several methods available for the measurement of mesio-distal widths of teeth in order to analyze Bolton ratios, and these are continuing to progress with the advances in technology. It is important that the method of measurement be easy, quick accurate, and reproducible in order to be widely used. The traditional methods for measuring mesio-distal widths of teeth on dental casts have used either needle-pointed dividers or a Boley gauge.8 In 1995 Shellhart et al.23 evaluated the reliability of Bolton analyses using these two instruments and investigated the effect of crowding on measurement error. Four investigators analyzed pre and post treatment casts of 15 patients on two separate occasions two weeks apart. Casts were selected on the basis where there was at least 3mm of pre-treatment crowding in one arch and treatment records indicated no inter-proximal tooth reduction has been done. To match pre and post-treatment cases, teeth extracted were not included in the measurements. The investigators were all trained in Bolton analysis but had different experience level in orthodontics.23 The authors concluded that significant measurement errors could occur when Bolton analysis is performed on teeth that have at least 3mm of crowding, although there was considerable variations between investigators. This indicates that clinicians should not perform TSD analysis in substantially crowded cases until the teeth are aligned. The authors also concluded that when comparing these two measuring devices, the Boley gauge demonstrated a higher frequency of significantly correlated repeated measures and thus may provide more reliable measurements than needle pointed dividers.8, 23
The recent introduction of digital calipers that could be linked to computers allows for quick calculation of Bolton’s ratios. In addition, study casts can now be scanned or digitized into a computer so that images can be measured on-screen. The use of digital calipers with direct input into a computer program can virtually eliminate measurement transfer and calculation errors seen with manual analyses that require rulers, dividers and calculators.8, 23, 24 Ho and Freer24 developed a computer program called the Ho-Freer Graphic Analysis of Tooth Width Discrepancy (GATWD) (University of Queensland School of Dentistry, Brisbane, Australia 4000). The program provides a simple graphic description of the tooth – width relationships between the dental arches. It can also represent the tooth-width ratios in various arch segments and serves to as a method of localizing TSD.8, 24
Computer-aided analyses of TSD were investigated further by Tomassetti et al. (2001). They performed a study comparing manual measurements with a Vernier caliper and 3 computerized methods: QuickCeph Imaging program, the Hamilton Tooth Arch System software (HATS) and the OrthoCAD software. The Quick Ceph imaging system involved digitizing the models in to the Quick Ceph image program, which then measured the teeth and calculated Bolton analysis. In contrast, the Hamilton Tooth Arch System uses digital calipers to measure the actual study casts, and then transfers the data directly into a computer program which then calculates the Bolton analysis. The final method using OrthoCAD that involved shipping the models to CADENT Inc, where they were scanned to construct 3-dimensional images, upon which the Bolton analysis was performed. Tomassetti et al. concluded that QuickCeph was the fastest method of measurement at 1.85 minutes, followed by the HATS system at 3.4 minutes, OrthoCD at 5.37 minutes, and finally Vernier callipers at 8.06 minutes. Although these findings are helpful, the authors did not measure the reproducibility of each method by means of replicate measurements.25
Othman and Harradine26 in 2007 tested the reproducibility and speed of the HATS digital calipers compared to manual measurements and the Odontorule slide rule. A sample of 150 Caucasian orthodontic patients was randomly selected. The results of this study showed that there were small or no systematic errors within or between these two methods. A very significant difference was evident in the mean time measurements between the two methods. The mean time was 3.5 minutes for the HATS and 8.9 minutes for the Odontorule. There was relatively high error variance for both methods as a percentage of the total variance. The authors concluded that On-line electronic measurement was more rapid than manual. Both measuring methods produced high random errors, which has significant consequences on the clinical application of the Bolton’s ratios.26
Zilberman et al.27 compared the accuracy of measuring models with the aid of Vernier calipers and OrthoCAD. Twenty set ups of artificial teeth resembling various malocclusions were created and used to produce plaster and virtual orthodontic models. No more than 5 mm of crowding existed in any of the models. The same investigator then performed tooth size measurements of mesiodistal tooth widths. Every isolated artificial tooth was measured after removal from the set up, using electronic calipers, accurate to 0.01 mm. Teeth on plaster models were measured again using the abovementioned calipers while virtual models were measured on OrthoCAD. The authors concluded that the measurements made directly on plaster models with electronic calipers were the most accurate and reproducible followed closely by the digital ones measured on OrthCAD. These digital measurements were considered to be clinically acceptable.27
In 2004, Arkutu N.28 evaluated commonly used methods of assessing Bolton’s discrepancy and compared them to the gold standard, defined as measurements using “Vernier calipers” accurate to 0.1 mm. Four methods were used: eyeballing, quick check method comparing the size of the laterals and second premolars (Proffit 2000), needle point dividers and stainless steel rule (0.5 mm) and Vernier calipers (nearest 0.1 mm). Anterior and overall Bolton’s ratios were calculated on 200 study models. When comparing eyeballing and Proffit’s method against Vernier calipers there was poor agreement regarding measurement of Bolton’s anterior and overall discrepancies. Assessments made using dividers and a stainless steel rule showed moderate agreement with the Vernier caliper method. Authors also performed sensitivity and specificity tests and they found that, when compared with actual measurement with calipers, these visual tests are poor at detecting a lack of Bolton discrepancy and very poor at accurately identifying a significant Bolton’s discrepancy.8, 28
- The prevalence of tooth size discrepancies:
The prevalence of TSD in the general population is around 5 percent according to the proportion of cases that fall outside two standard deviations from Bolton’s mean ratios.29 However other studies have reported a higher prevalence of TSD and found that a greater percentage of cases have anterior as compared to overall Bolton’s ratios.8 In 1989, Crosby and Alexander conducted a study consisted of 109 patients with varying malocclusions (Class I; Class II, Division 1; Division 2; and Class II surgery) who were treated orthodontically. They reported that 22.9% of the cases had an anterior teeth ratio with a significant deviation from Bolton’s mean.8, 30 Freeman et al., found that the overall Bolton discrepancy was likely to be a relative excess in the maxilla or the mandible, while the anterior Bolton discrepancy was nearly twice as likely to be a relative mandibular excess (19.7%) than maxillary excess (10.8%).8, 31 Further studies that have examined orthodontic patients reported similar prevalences.8, 32, 33
Bernabe et al., in 2004 assessed a group of 200 Peruvian non-orthodontic school children with untreated malocclusions and found an anterior TSD of 20.5% and an overall TSD of 5.4%. 34
- Tooth size discrepancies and malocclusion groups:
Studies that have focused on the prevalence of Bolton’s discrepancy in orthodontic patients have investigated the different malocclusions and found mixed results. Five studies found relative mandibular tooth excess in Class III malocclusions.33, 35-38 One study found a relative maxillary excess in Class II malocclusions, whilst other studies found no significant differences.30, 36, 39
Araujo and Souki, assessed the prevalence of TSD in a sample of 300 Brazilian patients divided into three Angle malocclusion groups and subgroups according to gender. As a second aim they investigated the differences in the Bolton’s anterior TSD among the three malocclusion groups. They also compared their findings to the ratios presented by Bolton. Each tooth was measured at the largest mesiodistal dimension using a digital caliper accurate to 0.01mm and all measurements were made by the same examiner. No significant differences were found between TSD and the three groups as a function of Angle’s classification. Results showed that there was a statistically significant higher prevalence in TSD among the Class I and III subjects than the Class II subjects. No significant differences were observed between genders. The mean anterior Bolton’s ratio was statistically greater in the Class III sample than the Class I and Class II samples.33
Alkofide and Hashim, (2002) conducted a study on a sample of 240 pre-treatment casts with both genders evenly distributed. Sixty cases had normal occlusion, sixty were Class I malocclusions, sixty Class II malocclusions and sixty Class III malocclusions according to Angle’s classification. The purpose of their study was to determine if a difference existed in tooth size ratios between the different malocclusion classes and normal occlusion in Saudi patients, and if sexual dimorphism exist. Mesiodistal tooth widths were measured directly on the dental casts by one examiner using digital calipers accurate to 0.01mm. Results showed that the average overall Bolton ratio for all classes combined was 92.61, with the mean anterior ratio was 78.86 where both ratios were higher than the Bolton’s ratio norms. Comparison between the three malocclusion classes showed that the mean overall ratio for Class II cases was higher than for Class I and III.38 This disagrees with Nie and Lin36, who found in their study that the mean Bolton ratio in Class III was higher than for both Class I and II in a Chinese population. When the three malocclusion groups were compared in males and females, the results showed that the mean overall and anterior Bolton ratios for Class III cases were greater than Class I and II malocclusions in both males and females.38 This finding agrees with result of Araujo and Souki,.33 The study also concluded that significant sexual dimorphism existed for the anterior Bolton ratio in Class III malocclusion, with males having a significantly higher mean anterior ratio.38
Statistically significant associations were found between the anterior ratio of the Bolton standard and the Class III malocclusion group in a study done by Ta et al., on 110 Southern Chinese subjects. (Ta et al., 2001). Subjects were randomly selected from 1247 12-year old Southern Chinese children and divided to 50 Class I, 30 Class II and 30 Class III. A digital caliper was used to measure the mesiodistal widths of the teeth. No statistically significant sex differences were found between the anterior and overall ratios in the three malocclusion groups. Statistically significant differences in the overall ratios were found between the Bolton standard and the Class II occlusion group, and between the Class II and Class III groups. The authors concluded that the Bolton standards could be applied to southern Chinese children with Class I occlusion but not to those with Class II or III occlusions. Although the young age group in this study was chosen to minimize the possibility of alteration in mesiodistal tooth dimensions due to caries, attrition or restorations but it was not made clear in their inclusion criteria whether patients were in the mixed or permanent dentition. This is extremely critical, as the differences in size between the primary and permanent dentitions will inevitably affect TSD measurements.8, 37
Nie and Lin, conducted a study in 1999 to assess the intermaxillary TSD among the different malocclusion groups in Chinese patients? and to assess sexual dimorphism. The sample of the study comprised 60 patients as the normal occlusion group and 300 patients divided into five malocclusion groups based on their skeletal ANB classification (Class I with bimaxillary protrusion, Class II division I, Class II division II, Class III, and Class III surgical cases). The age range was between 13-17 years for all groups except for the Class III subjects who were older at 17-23 years. Tooth width measurements were made on dental models of normal occlusion and pre-treatment models of patients using a three-dimensional measuring machine with an accuracy of 0.01mm. Tooth size ratios were analyzed as described by Bolton. The results showed no sexual dimorphism for the tooth size ratios in each of the six groups. No significant differences were found between subcategories of Class II malocclusion, thus these groups were then combined into three groups: Class I, Class II and Class III. Comparisons were then performed between the three groups and the results showed that the Bolton’s anterior ratio, the posterior ratio and the overall ratio were greatest in Class III followed by Class I, then Class II.8, 36 The results support the work carried out by Sperry et al.,35 which showed that Class III cases with mandibular prognathism had more TSD with mandibular tooth size excess for the overall ratio than did Class I and II subjects. Moreover the finding of Nie and Lin36 showed that not only Class III surgical but also Class III non-surgical groups had a greater frequency of TSD with mandibular tooth size excess than other malocclusion groups. The authors also concluded that there was a tendency for maxillary tooth size excess in the Angle Class II malocclusion group.8, 36
Crosby and Alexander, studied a sample of 109 patients who were randomly selected from a private practice and divided into: 30 Class I cases, 30 Class II div I cases, 29 Class II div II cases and 20 Class II surgical cases. Mesiodistal tooth width measurements were taken with digital calipers accurate to 0.01mm. They concluded that there were no significant differences in the prevalence of TSD in the four malocclusion groups. However, the skeletal categories in this study were not mentioned, although some Class II cases were treated surgically. Also there were no Class III cases in this study, and as indicated from the previous studies these cases tend to show a higher degree of anterior TSD. In addition the study did not mention the female to male ratio in each group nor did it analyze the differences between them. This study displayed a large number of subjects within each malocclusion group with discrepancies greater than 2 SD from Bolton’s means indicating the importance of tooth size analysis before starting the orthodontic treatment.8, 30, 40
Liano et al., found no association between TSD and the different malocclusion groups. However only 13 subjects were included in the Class III group which may not be quite representative of this population.41
Uysal et al., found similar results but reported that all malocclusion groups had significantly higher average ratios than the group of 150 untreated normal occlusions.39
- Tooth size discrepancies and racial variation:
Bolton’s original study in 1958 was carried out on a group of 55 Caucasian females, and provided no information relating to other racial groups. Therefore the Bolton standards may not necessarily be applicable to other racial groups.
Lavelle, compared mesiodistal tooth widths of the maxillary and mandibular teeth in the three major racial groups: Caucasoid, Mongoloid and Negroid. These three terms for racial groups are anthropological and can be considered equivalent to white, far eastern and black. A total of 120 casts with excellent occlusion were included in the study, 40 from each racial group. Male to female ratios were equal and the age range was 18 to 28 years. Mesiodistal tooth widths and percentage overbite were calculated. The study concluded that both the overall and anterior ratios were greater in Negroids than in Caucasoids, with Mongloids again being intermediate. Percentage overbite was greater in Caucasoids followed by Negroids and then lastly Mongoloids.8, 10
Bishara et al., compared mesio-distal and bucco-lingual crown dimensions in three different populations. The sample included 54 subjects from Egypt, 60 subjects from Mexico and 57 from USA. The samples matched for age and male to female proportion. Mesio-distal crown dimensions were measured on casts using pointed calipers. The findings indicated that the differences between mesio-distal crown widths were of small magnitude and of no statistical significance. There was a sexual dimorphism between the three populations, and in general sex differences were more pronounced in Mexicans. The differences in tooth dimensions noticed between these different groups could have been related to the degree of mixture within the population groups.8, 42
Merz et al., conducted a study to assess tooth diameters and arch perimeters in both black and white populations. The sample included records of 51 black and 50 white. The mesiodistal diameters were measured for all teeth in the lower left quadrant, first molar to central incisor. In addition arch width and depth were measured. Results of this study showed that the mean mesiodistal crown diameters of the canines, premolars and molars in the black population were all significantly larger than in the white population. Mean mesiodistal diameters of the central and lateral incisors showed no significant difference between the two ethnic groups.33, 43
Smith et al., agrees with the evidence of racial variation with respect to TSD. Their sample consisted of a total of 180 study models, 60 study models from each racial group with an equal male to female ratio. The models then were measured and anterior, posterior and overall ratios were compared. The results showed significant ethnic group differences in all 6 arch segment lengths and in all interarch ratios. Whites displayed the lowest overall ratio (92.3%), followed by Hispanics (93.1%), and blacks (93.4%). The group differences were due primarily to the relationships between the posterior segments. The anterior ratio, however, was statistically significantly larger in Hispanics (80.5%) than blacks (79.3%). In addition the overall and posterior ratios were significantly larger in males than in females. The authors also concluded that Bolton’s ratios apply only to white women and may not be applied broadly to white men, blacks, or Hispanics.8, 44, 45
Santoro et al., (2000) examined 54 Dominican Americans and aimed to establish normative data on the mesiodistal crown widths of this population group compared to Bolton’s ratios. The sample consisted of 36 male and 18 female orthodontic patients were second or third generation Dominicans residing in New York. The results showed that male crown measurements were slightly larger than females. They showed closer similar measurements when the results were compared to that previously available of the African American sample. Maxillary and mandibular tooth dimensions in Dominicans were slightly smaller than those in the African American sample, with the exception of the mandibular central and lateral incisors, which were larger. The American Dominican tooth ratios were then compared to the Bolton ratios, and it was noted that the overall tooth size ratio was equivalent to the original Bolton overall ratio 91.3, but the anterior tooth size ratio was 78.1, slightly larger than the Bolton anterior ratio 77.1.8, 32
In similar studies, Bernabe, (2004) studied 200 Peruvian school children to determine maxillary to mandibular tooth size ratios. No significant differences were found in anterior and total tooth-size ratios according to gender. For this reason, they combined the male and female groups and then the anterior and total ratios were calculated. There were clinically significant anterior and overall tooth-size discrepancies in almost one third of the sample, although this was not predicted by the 2 SD range from the Bolton mean.8, 34
- Tooth size discrepancy and gender:
Lavelle, (1972) conducted a study to compare maxillary and mandibular tooth size ratios between males and females. The overall and anterior ratios were both greater in males than females, although the differences were small (less than 1%).10
Richardson et al., sampled 162 American negroes with an equal male to female distribution. The mean mesio-distal crown dimensions in the maxillary and mandibular arches were greater in males than females. The anterior and overall mandibular to maxillary arch ratios were the same for both genders.8, 46
Bishara et al., conducted a study to assess tooth dimensions in populations from Egypt, Mexico and the United States and as well as assess racial variation and to compare female to male tooth width dimensions within each population. They found that the maxillary and mandibular canines and first molars were larger in Egyptian males than females. The sum of the maxillary right canine and first and second premolars was also significantly greater in Egyptian boys. In the Mexican sample, the canines, first premolars, second premolars and first molars were significantly larger in males than in females, although there was no significant difference between the sexes regarding incisors. The subjects from the US displayed significantly larger canines and first molars in males than females, with no significant differences between the incisors. Unfortunately TSD ratios were not measured in this investigation.8, 42, 45 Smith et al., found that overall and posterior ratios were significantly larger in males than females, although the differences were small (0.7% for the overall and 0.9% for the posterior ratio).8, 44
On the contrary, other studies have found no significant differences between TSD in males and females.33, 36, 38
- Clinical significance of tooth size discrepancy:
An excellent orthodontic treatment result with optimal occlusion and ideal intercuspation, overjet, and overbite is often jeopardized by TSD or problematical tooth anatomy. 47
Anterior teeth are occasionally positioned in an end-to-end anterior relation and are unable to perform anterior function in the mutually protected occlusion because of insufficient overbite. The lack of adequate overbite of anterior teeth in finished orthodontic cases is usually the result of a discrepancy in anterior interocclusal arch length. The arch length discrepancy could be the result of excessively large lower anterior teeth.33
For good occlusion, the upper and the lower teeth must be proportional in size. If larger upper teeth were combined with small lower teeth, or vise versa, achieving ideal post treatment occlusion would be difficult. Treatment planning should always take into consideration a discrepancy of the tooth size ratios and should include compensating esthetic procedures such as composite bonding, prosthetic crowns or veneers, stripping, and crown re-contouring.
TSD must be taken into account when treatment is planned since they are a principal factor in accurate space analysis. At the planning stage it is important to quantify the space required in each arch to correct a malocclusion. Crowding or spacing, arch width change and incisor antero-posterior changes can have substantial space implications. Space analysis can be used to assess the need for interproximal reduction, tooth build-up or even extractions, to determine anchorage requirements and to plan mechanics during treatment.
Assessment of arch width and the antero-posterior position of the labial segment is essential when deciding the line of the arch upon which to base treatment objectives. A diagnostic wax up can be a useful aid when planning management of TSD as planned tooth movements, composite additions and prosthetics can be visualized. In addition it also allows a number of treatment options to be explored prior to deciding upon a definitive plan.9, 16, 33
The decision to extract teeth is a critical one in relation to orthodontic treatment and may affect the Bolton overall ratio. Premolar teeth are usually the extractions of choice. Bolton, in 1962 discussed the consequences of premolar extraction on the overall ratio, which was reduced from a mean of 91.3% to 86% by extraction of four premolars.16 Saati and Yuckay, investigated whether the extraction of four premolars was a factor in the creation of a TSD. The results indicated that the difference between the pre-treatment and post-extraction Bolton ratios was found to be statistically significant following first premolar extractions but not significant for other combinations.48 A TSD may occur in normal overall ratios after premolar extractions, but TSD might be corrected with big overall ratios after premolar extractions.
Many of the studies examining TSD have used 2 SD from the Bolton’s means as the level at which TSD is clinically significant.11, 30, 49 Othman and Harradine argued that while this makes sense statistically it may not be a good measure of clinically significant TSD. They argued that Bolton’s sample is not representative of the amount of variation in the general population because he used only ideal occlusions in one gender and ethnic group, a narrow sample that may not follow a normal distribution. They suggest using actual measurement numbers to help in determining clinical significance.26 Bernabe et al had used 1.5mm as their cutoff point, according to Profitt’s textbook, which they considered to be of clinical significance. They found that 35.6% of patients in their study had clinically significant TSD.34 Othman and Harradine, used 2mm as a cutoff point, simply by stating that 1mm per side “seems a reasonable minimum for intervention to change the size of teeth”. With a cutoff of 2mm they found that 24-28% of patients had clinically significant TSD.26 Endo et al also recommended a 2mm cutoff of significance.50
- Management of tooth size discrepancy:
The main goal of orthodontic treatment is to achieve the best possible esthetic and functional result. Where a TSD exists, there may still be residual spaces or an excessive overjet or an increased overbite following treatment. Management will of course depend on whether there is excess space or a lack of space and this is discussed in more details below.
- Tooth tissue reduction:
Although TSD is evaluated during treatment planning, it is not until the finishing phase that they are usually managed. Inter proximal dental reduction “stripping” is the usual method to compensate for discrepancies caused by tooth excess. Space can be gained from reduction of the mesiodistal width of an unusually broad tooth. When stripping of enamel is part of the original treatment plan, most of the stripping should be done initially, but final stripping can be deferred until the finishing stage. This would allow direct observation of the occlusal relationships before the final adjustments are made.29
- Incisor angulation (mesiodistal tip):
Generally, small TSD can be masked by altering the position of the incisors in several ways, including mesiodistal angulation, inclination and rotation. If upper incisors are too vertical they take up less space in the arch than if they are correctly angulated.51
Andrews, in the six keys to normal occlusion article, found that the degree of tip of incisors, for example, determines the amount of mesiodistal space they consume and, therefore, has a considerable effect on posterior occlusion as well as anterior esthetics.2
Tuverson, demonstrated the use of diagnostic wax ups to show that 2mm of excess space can be easily absorbed by mesial angulation of upright upper incisors. However incorrect angulation does not necessarily signify that a space requirement exists, although, if incorrectly angulated teeth are corrected, space is gained by correcting them to normal angulation. The space gained is small and it is important to plan this with the anchorage requirements of mesiodistal and apical movements, which are likely to be of greater clinical relevance.47
- Incisor inclination (torque):
Andrews, also pointed out the importance of correct labio-lingual inclination of the upper incisors if they are to occupy the correct amount of space. Failure to establish correct inclinations would lead to either an incorrect buccal occlusion or spacing and would compromise the final aesthetic result.2, 52 Torque of the upper incisors can be used to compensate for larger or smaller upper incisors. Leaving the incisors slightly more upright makes them take up less space relative to the lower arch and hence masks large upper incisors. On the other hand slightly excessive torque can partially compensate for small upper incisors. Tuverson, suggested that 1mm of excess maxillary space could be absorbed by applying palatal root torque to maxillary incisors.47
- Building up small teeth:
When TSD is caused by small teeth, the maxillary lateral incisors are often to blame. A small space distal to the lateral incisors can be aesthetically pleasing and functionally acceptable, although the amount of tooth material in both arches must be proportional to achieve an excellent occlusion. A composite resin restoration of small lateral incisors is a common option and this can either be carried out towards the end of treatment or as soon as possible once the patient is in retention.53 This would require an initial retainer to hold the space and a new retainer once the restoration is completed. Alternatively, an indirect restoration i.e. composite resins, veneers or crowns could be provided, and again this can be carried out once orthodontic treatment has been completed. The main advantage of waiting until after orthodontic appliances have been removed is to allow gingival inflammation to resolve.29, 54
- Accuracy and reliability of digital study models produced by OrthoCADTM:
Today, many orthodontists are incorporating digital orthodontic records into their clinical practices and using computer software to assist with diagnosis and treatment planning as well as to lessen storage constraints for records. Proffit stated that an advantage of using analytical software is that the computer can provide a quick result.55 Digital models may well replace plaster models in the future, since they show high validity and clinically acceptable differences compared to plaster models for intra-arch and interarch measurements, diagnosis and treatment planning.56, 57
Digital study models were introduced commercially in 1999 by OrthoCADTM (Cadent, Carlstadt, NJ, USA). The technology used to produce digital study models varies considerably.57
Many studies have tested the validity and reliability of the use of digital models in orthodontic field. Costalos et al., conducted a study to determine whether digital models can be used with reasonable accuracy and reliability for assessing patients’ final occlusions. The sample included plaster and digital (OrthoCAD, Cadent Inc, Carlstadt, NJ) posttreatment models of 24 patients from the postgraduate orthodontic clinic at Columbia University School of Dental and Oral Surgery. The models were scored by using the ABO measuring gauge and the 7 criteria of the ABO grading system. Results of the study indicated that the means of the total score and those for marginal ridges, occlusal contacts, occlusal relationships, overjet, and interproximal contacts were not significantly different between plaster and digital models. However, the means for alignment and buccolingual inclination were significantly different. The authors concluded that digital models might be acceptable for use in the ABO model examination.55, 57 Leifert, et al., compared space analysis measurements made on digital models (OrthoCAD, Cadent, Fairview, NJ) with those from plaster dental casts. They found a slight (0.4 mm) but statistically significant difference in the space analysis measurements on the maxillary models; measurements on the mandibular models were not significantly different. No significant difference was found between the measurements of the 2 examiners. The authors concluded that the accuracy of the software for space analysis evaluation on digital models is clinically acceptable and reproducible when compared with traditional plaster study model analyses.58 Fleming et al., conducted a systematic review that aimed to evaluate the validity of the use of digital models for orthodontic measurements compared with plaster models. They found that orthodontic measurements with digital models were comparable to those generated from plaster models. The use of digital models as an alternative to conventional measurement on plaster models may be recommended.57 Munisha Nanda 59, evaluated the accuracy and reliability of OrthoCAD digital and plaster models from a single alginate impression. Overbite, overjet, Boltonʼs analysis, intermolar width for maxillary and mandibular as well as space analysis and a vertical measure of the upper right central incisor were measured for 27 sets of each plaster and digital models. The results indicated that while there were some statistically significant differences between plaster and digital model measurements, they were not clinically significant.59 Fabels et al., conducted a study to test the interexaminer and intraexaminer reliabilities of 3-dimensional orthodontic digital setups in OrthoCAD (Align Technology, San Jose, Calif). Six clinicians made digital orthodontic setups on 6 digital models using OrthoCAD software twice with 2-4 weeks interval. Treatment goals were all set the same according to the American Board of Orthodontics Objective Grading System (ABO-OGS). The results indicated that all but 1 intraclass correlation coefficient (ICC) value showed significant excellent agreement for intraexaminer reliability. One ICC value was insignificant and showed moderate agreement. Interexaminer reliability revealed significant good agreement.56
In summary, the literature suggested that the use of digital models produced by the OrthoCADTM system seems to be a viable alternative to plaster models.
The 1958 publication of Bolton’s original TSD study has long been the gold standard in orthodontics to determine clinical TSD.17 The study however, was not without limitations especially with regards to its case selection and the demographic characteristics of the sample, which implies potential selection bias. The selected casts were chosen from a large number of excellent occlusions and there was little information about the sample subjects. The selection criterion of “excellent occlusion” was not defined, nor an explanation known for why one set of casts was selected from the larger group and another cast was not. Othman and Harradine suggested that Bolton’s mean ratios in general are more applicable to white females.8
The prevalence of Bolton’s TSD in this study was 13.3% for the overall ratio, while the prevalence of anterior TSD was very high (46.7%) and serves as an indicator of how important it is to perform a thorough diagnosis before orthodontic treatment. In this study, we demonstrated that 27 individuals (45%) of a total sample of 60 presented had anterior TSD greater than 2 SD and 1 individual (1.7%) had a Bolton of less than 2 SD using the Bolton analysis parameter. The prevalence of overall TSD in this study (13.3%) was similar to the findings of Freeman et al.31 (13.5%), Johe et al.49 (12%), Santoro et al.32 (11%), but higher than Bernabe et al.34 (5.4%), Endo et al.50 (8.3%), Othman and Harradine8 (5.4%) and lower than Uysal and Sari39 (18%). The prevalence in these previous studied ranged from 5.4% – 18%. (Table 4)
The prevalence of anterior TSD in this study (46.7%) was considerably higher than that found by Crosby and Alexander30 (22.9%), Freeman et al.31 (30%) and Santoro et al.32 (28%), Othman and Harradine8 (17.4%), Bernabe et al.34 (20.5%), and Araujo and Souki33 (22.7%), Uysal and Sari39 (21.3%), Endo et al.50 (21.6%), Johe et al.49, (17%) and O’Mahony65 (37.9%), Wedrychowska-Szulc et al.61 (31.2%),. The prevalence in these previous studied ranged from 17% – 37.9%. (Table 4)
The differences in the TSD prevalence between this study and the other investigations might be attributed to the sample size, method of analysis, and large standard deviation as found in this study. Also, the type of population and differences among racial groups could explain it. Johe et al.,49 attributed the variations in TSD prevalence between different studies compared to Bolton’s study to the varying ethnic and genetic sample population. Endo et al.,50 suggested that the potential reason for these different results might be related to population and type of malocclusion. Another reason could be the methodology of the study which in turn would affect the results. Freeman et al.,31 reported a higher incidence of clinically significant TSDs. In that study, the measurements of the casts were made by 24 clinicians. No measurement error was reported in the study and the error could be huge; this could explain the large reported TSDs.34
In the current study, a greater percentage of subjects with higher anterior TSD (46.7%) than discrepancy in the overall ratios (13.3%) was noticed. The probable reason for this finding may be the excess of tooth material in the mandibular anterior segment was compensated for by the presence of larger mandibular posterior teeth or smaller than usual maxillary posterior teeth which in turn brings the overall ratio to normal values.32 Another justification for that finding is that the size of the anterior teeth has, mathematically, less effect on overall ratio.8 It could be also explained by the fact that anterior teeth, mainly the maxillary and mandibular incisors, have a much greater incidence of tooth size abnormalities and the greatest variables in mesio-distal tooth width occur in the anterior region.39
The prevalence of Bolton’s TSD in different racial and malocclusion groups has been studied extensively for a number of populations, and the studies have generated varying results. According to Othman and Harradine8, the Bolton’s original study was carried out on a group of 55 Caucasian females with excellent occlusions, and so its application to males, non-Caucasian populations, and different malocclusion groups has been questioned.
The majority of studies comparing Bolton’s ratios have tried to establish whether or not differences existed between males and females. The results of these studies have varied. Bishara et al.,42 looked at three groups of children from the United States, Egypt and Mexico and found that there were sex differences within each racial group, with males showing large mesio distal tooth widths for different teeth. Richardson et al.,46 showed that tooth size dimensions were greater in a group of Negro males than females. Lavelle,10 compared the overall and anterior ratios for males and females and found both to be greater in males, although the difference was less than 1%. Strujic et al.,66 have assessed the presence of TSD in a sample of 301 Croatian subjects, assessing variation with regard to Angle’s classification and looking at sexual dimorphism. Their results showed a statistically significant gender difference in the anterior ratio. Crosby and Alexander30 did not differentiate between sexes and did not mention the ratio of sexes in each group. In their study, it was not clear whether there was sexual dimorphism for tooth size ratios. The findings of a study done by Fattahi et al.,63 revealed statistically significant differences in the anterior ratio between males and females among the different malocclusion groups, but not for overall and posterior ratios. Therefore most studies have concluded that there is little impact of sex on TSD.
In the present study, there was no statistically significant sexual dimorphism for the overall Bolton TSD. Although the ratio of males to females in subjects with anterior Bolton TSD was higher, however this finding was not statistically significant. These findings are in agreement with those of previous studies on several other populations.50 Endo et al.,50 showed no statistically significant sex differences in anterior or overall ratio in any malocclusion group among 180 Japanese subjects. Johe et al.,49 compared mean tooth-size ratios between different sexes, malocclusions and ethnicity groups and they concluded that there were no significant differences between all groups. Al-Tamimi and Hashim 67 also found no sexual dichotomy in Bolton ratios in a sample of 65 Saudi subjects. Nie et al.,36 investigated the prevalence of anterior and overall TSD in different malocclusion groups and found no sexual dimorphism for these ratios in each group. Akylcin et al.,68 also investigated the frequency and association of Bolton TSD with dental discrepancies among different malocclusion groups and concluded that sex was not discriminating. Ta et al.,37 compared Bolton anterior and overall ratios among different occlusion groups of southern Chinese children. The results of that study showed no statistically significant sex difference was found between the anterior and overall ratios in the 3 occlusion groups. Uysal et al.,39 conducted a study in Turkey and one of their objectives was to identify the possible sex differences in tooth size ratios between males and females. Results of that study indicated that a significant sexual dimorphism for the malocclusion groups did not exist. Araujo and Souki,33 Basaran et al.,62 O’Mahony et al.,65 Paredes et al.,69 Santoro et al.,32 and Al-Omari et al.,70 observed no significant difference in TSD (anterior and overall ratios) between males and females.
Compared to the original Bolton’s ratios, the results of our study showed statistically significant differences of the mean overall and anterior ratios than the average mean in the Bolton study (P=0.000). The larger standard deviations of both anterior and overall ratios for our subjects than for Bolton’s subjects can be explained by the fact that all of our subjects had malocclusions while Bolton’s subjects had optimal occlusion.32, 61
Moreover, notice in our study that the coefficient of variation in the anterior tooth size ratio was 1.44 times higher than the coefficient of variation in the overall tooth size ratio as verses 1.02 times higher, when comparing the same ratios in the Bolton study (1958). This allows a relatively larger standard deviation for the anterior tooth size ratio. Lastly, the study sample coefficient of variation in the anterior tooth size ratio was 1.66 times higher than the coefficient of variation in the Bolton sample. This means that our data set spread widely around the mean of the anterior ratio comparing to the Bolton study.
Much of the research assessing the association between malocclusion and TSD suggests that mandibular tooth size excess is greatest in Class III malocclusions (Araujo and Souki 33, Alkofide E, Hashim H,38, Nie and Lin, 36; Ta et al.,37, Sperry et al.,35).
Strujic et al.,66 found there was a tendency for mandibular tooth excess in subjects with Class III malocclusions and for maxillary tooth excess in subjects with Class II malocclusions in an orthodontic population. Othman and Harradine26 suggested that this may be another factor that complicates the treatment of Class III malocclusion which may have restorative implications.
This trend towards higher tooth size ratios in Class III malocclusion was supported by the findings of the current study as significant differences existed for the anterior ratios among the subjects, which all predominantly had Class III malocclusion.
Our results are in disagreement with the findings of Uysal et al,39 who found no significant differences in anterior or overall ratio when comparing Angle Class I, Class II division 1, Class II division 2, and Class III malocclusion subjects with the corresponding ANB angles. Crosby and Alexander30, Al-Khateeb and Abu Alhaija4, and Akyalcin et al68 showed no significant differences in anterior or overall ratio among the malocclusion groups but they had minor differences in sample selections from our study. The study by Crosby and Alexander30 was made up of four groups of subjects: Angle Class I, Class II division 1, Class II division 2, and Class II subjects. It neither included patients with Class III malocclusion nor differentiated between sexes. Al-Khateeb and Abu Alhaija,4 analyzed Angle Class I, Class II division 1, Class II division 2, and Class III malocclusion groups in a Jordanian population, whereas Akyalcin et al,68 included in their Turkish study sample Angle Class I, Class II, and Class III subjects.
With regard to the ethnic background of our sample which was predominantly Caucasian, it provides no information relating to other racial groups. It has been suggested that TSD differs between various racial or ethnic groups, however there have been few good studies that assessed this factor.8 Lavelle,10 studied tooth-size and ratios in Caucasoids, Negroids and Mongoloids. Both the overall and anterior average ratios were greater in Negroids than in Caucasoids, those for Mongoloids being intermediate. Another study done by Smith et al.44 on inter-arch tooth-size relationship of 3 populations found that whites displayed the lowest overall ratio, followed by Hispanics, and blacks. The anterior ratio, however, was statistically significantly larger in Hispanics than blacks.
One of the objectives of the current study was to investigate possible association between the overall and anterior tooth size ratio, and each of the following variables: ANB angle, Wits analysis, overbite, overjet, crowding, dental midline shift, posterior (intermolar) arch width, FMA, FMIA, IMPA, U1-SN angle. The Student’s t-tests suggested that the anterior tooth size ratio showed a statistically significant association with each of the following variables ANB in subjects with anterior Bolton ratios > 80.5 (P=0.045) and maxillary crowding (more crowding) in subjects with normal anterior Bolton ratios (P=0.049). (Figure 4,6)
Furthermore, the following factors were categorized according to most commonly accepted standards as explained earlier: Overbite (Normal-Shallow-Deep), FMA (Normal-Low-High), FMIA (Normal-Low-High), IMPA (Normal-Low-High). Several dento-skeletal factors have been investigated in the literature but in this study we were further focusing on most interesting factors which are commonly associated with the skeletal Class III malocclusion. These include but not limited to anterior shallow or open bite, high mandibular plane angle and the dental compensation for the skeletal malocclusion which is expressed often in the lingual inclination of the lower incisors. We investigated for any possible association between either the overall tooth size ratio, or the anterior tooth size ratio and each of the previously mentioned factors using chi-square tests. The results of these tests did not show statistical significance of any association with the overall tooth size ratio, or the anterior tooth size ratio (p>0.05).
Many studies have suggested that the overbite (Bolton, 1958)9, overjet (Bolton,1962)16, tip of incisors, torque of incisors, interincisal angles (Tuverson, 1980; Bolton, 1962)16, 47, and lastly tooth thickness (Rudolph et al., 1998; Bolton, 1962)16, 71 may affect ideal tooth size ratios in order to achieve an acceptable occlusal result in a given case. It has been shown using diagnostic setups that changes in the incisal angulation of the anterior teeth may result in an increase or a decrease of arch length suggesting a change in the ideal tooth size ratios (Tuverson, 1980)47. Lundstrom21 demonstrated that the biologic distribution in the tooth size ratios have a significant influence on the position of the teeth, on alignment of the teeth and on the overbite and overjet relationship. Shellhart et al.,23 evaluated the reliability of the Bolton tooth size analysis in crowded dentition. He concluded that clinically significant errors can occur when the Bolton tooth size analysis is performed on casts that have at least 3 mm of crowding. Akyalcin et al, 68 investigated the frequency and association of Bolton tooth size discrepancies with dental discrepancies (e.g. overjet, overbite, midline discrepancy, maxillary and mandibular crowding, IMPA and U1-SN) in different malocclusion groups (Class I, II and III). The results of that study indicated Bolton’s anterior ratio discrepancies had significant correlations with midline shifts in Angle Class I cases and with U1-SN angle in Angle Class II cases only. No significant correlations were found between anterior ratios and those factors in Class III group. In contrast, our results disagree with these findings, where statistically significant associations were found between anterior TSD with ANB and maxillary crowding. The explanation for our results is that the ANB angle represents the measurement of the class III malocclusion which is supported by the fact that our sample showed more prevalence of the anterior TSD. On the other hand, the maxillary crowding was found to be statistically significant (more crowding) in the subjects with normal anterior Bolton ratios which could be explained by the excess tooth material in those subjects expressed as crowding, while those with anterior TSD has less tooth material and eventually less crowding. Akyalcin et al. 68 in the same study, also found that Bolton discrepancies related to overall ratio had significant correlations with overjet in Class I cases, with overbite and U1-SN angle in Class II cases, and with IMPA in Class III cases. Their findings are again in disagreement with the results of our study where no statistically significant evidence found between overall Bolton ratios and these dental/skeletal factors.
It is recommended to perform a diagnostic setup when the tooth size ratios are significantly deviated from the means, especially when there is a need to include inter-proximal reduction in the treatment.16 Another way to assess the necessity for interproximal reduction would be to align the upper and lower dental arches orthodontically and pursuit good interarch relation in all three dimensions. Then if the clinician encountered a difficulty to achieve a proper incisal relationship; it is recommended to perform selective interproximal reduction or dental buildups depending on the clinician’s discretion to correct the TSD. As a summary, the Bolton analysis has been shown to be a reliable tool in detecting TSD in malocclusions. However, it is inaccurate to make final assumptions of the existence of TSD by only assessing tooth size ratios.11
Limitations of the Study:
As with any research project, there are several inherent limitations that exist for this study. The generalizability of the study may be somewhat limited due to the homogeneity of the sample group which consisted entirely of Caucasians.
Another limitation of the study may result from the wide age range of the subjects that were included in our sample. With aging there is a tendency for the teeth to have more attrition or abrasion.
With regard to the quality of the records, it could be another limitation since there were no predetermined standards for who and how the impressions were taken, storing impressions and mailing them to the OrthoCAD laboratories.
The definition of skeletal class III malocclusion was made only on the reading of ANB angle (ANB < 0). However ANB angle has few limitations where a false value can be measured with altered antero-posterior and vertical position of Nasion, change in vertical face height and alteration of SN plane.
Clinical implications:
On the basis of the results of this study, the high prevalence of Bolton TSD in skeletal class III orthodontic patients necessitates that the orthodontist should be aware of these possible discrepancies for better diagnosis and treatment planning. A proper relationship of the total mesio-distal width of the maxillary dentition to the mesiodistal width of the mandibular dentition will favor an optimal final occlusion. Treatment planning should always take into consideration a TSD and should include compensating procedures such as composite bonding, prosthetic reconstruction, stripping, and crown recontouring. A lack of information about TSD could also compromise the final results of the orthodontic treatment especially in extraction cases if the chosen extraction pattern leads to a clinically significant TSD.
Research Implications:
Many studies have examined Bolton TSD, mainly in the same protocol as Bolton used in 1952. Future research into Bolton TSD should be focused on the applicability of Bolton TSD measurements to clinical outcomes. The buccolingual thickness of teeth, particularly the lingual marginal ridges of the maxillary incisors, plays a major role in how anterior teeth fit together. An ethnic group tends to have thicker maxillary incisors in the buccolingual dimension this may account for some variation in TSD in regard to overjet within the group and compared to other ethnic groups.
The effects of extractions on Bolton TSD have mainly been studied with the extraction of four first premolars. The effects of the other pattern of extractions have yet to be examined.
Future research may be done with more specific inclusion criteria to be addressed. A narrow age range would exclude the possibility of the interproximal attrition of the teeth associated with aging. Also, the ANB angle readings may be categorized into groups according to the severity of the malocclusions.
Cite This Work
To export a reference to this article please select a referencing stye below:
Related Services
View all


Related Content
All TagsContent relating to: "Dentistry"
Dentistry is a branch of medicine that involves treating and preventing issues relating to your teeth, gums, and jaw. Dentistry not only ensures that you have a healthy mouth, but it can also have a positive impact on your general health and well-being.
Related Articles

DMCA / Removal Request
If you are the original writer of this dissertation and no longer wish to have your work published on the UKDiss.com website then please: