US Office Real Estate Markets: Development, Trends, and Finance
Info: 17278 words (69 pages) Dissertation
Published: 13th Dec 2019
Tagged: FinanceReal Estate
Table of Contents
d. Office Building Project Feasibility Process
f. Calculating Effective Rental Rate
o. Building Permits vs. Case-Schiller Home Price Index
4. US Office Market Real Estate Outlook
b. Economic Growth Impact to Office Asset Class
c. Historical Events in the US Office Market Landscape
a. Demographics & Technology Trends
b. Absorption Trends: Suburbs vs. CBD
n. Top US Office Deals Q4, 2016
6. South Florida Office Market Trends
a. Absorption Trends: Suburbs vs. CBD
b. Absorption Trends: By Building Class
i. South Florida Office – Select Deliveries FY 2010
j. South Florida Office – Under Construction Projects
k. Top South Florida Office Deals FY2016
e. Standby and Forward Commitments
h. Capex (Implication for ROI)
i. National Income & Expense Trends
j. National Income & Expense Summary by Region, Size, Age, Rental Range in Select Cities
k. National Income & Expense Trends in Graphical Format
l. National Income & Expense Breakdown
m. Metropolitan Miami Income & Expense Breakdown
n. National Office Building Type of Ownership Analysis
1. Executive Summary
The investment climate entering 2017 has shifted from last year, mostly after the election of President Trump in November. Trump’s election set in motion a rapid rise in interest rates, and opened numerous questions about what investors should expect as far as fiscal, tax, monetary, trade, immigration and regulatory policies. Expectations of steady economic and employment growth offer investors a positive outlook, particularly for office assets, which have enjoyed six years of gains.
The economic cycle appears to be well into the seventh year of growth. During this time, more than 15 million jobs have been created and more than 460 million square feet of office space was absorbed. Many believe that the length of the cycle is indicative of a slowdown in the economy. However, few signs of a slowdown are evident. Hiring remains strong, with employers adding between 2.0 – 2.5 million jobs to the economy each year, while the unemployment rate has held below 5.0 percent range. These trends is driving new demand for office space during a period of slow office construction and will continue to drive down the office vacancy rates.
Suburban properties, often overshadowed by the Downtowns will continue to record gains and offer investors good alternative options. New leasing activity driven by professional and other technology companies are taking place. Class A rents in most markets are holding firm or growing but at a reduced pace. Almost 75 percent of the metro office markets are seeing an increase in asking rents. Construction of new office space is driven by pre-leasing contracts. But speculative development is occurring in select pockets due to perceived shortage of modern and prime assets.
The investment climate is likely to remain vibrant as buyers looking for stable returns make acquisitions from property owners ready to cash out on recent gains. Liquidity remains positive due to the shortage of inventory and high demand for office space. Investors are chasing high returns in suburban assets and institutional as well as cross-border investors are still attracted to trophy central business district assets with high-credit, long-term income stream clients.
Miami, one of the top primary markets, rents are expected to rise at or above 5 percent this year. Miami ranks in the top ten of the high-yield markets as its Class A institutional assets seldom trade, causing the high volume of Class B/C properties to skew the yield.
The dynamics point to an engaging year of investment activity with a wide range of buyers and sellers repositioning portfolios as they re-assess their strategies ahead of the anticipated changes the new president will bring. There will be many uncertainties along the way for investors in the coming year, with prospects of steady economic growth offsetting a rising interest rate environment and a potentially more aggressive Federal Reserve.
2. Office Development
a. Office Classification
Per, the Building Owners Management Association (BOMA), “office space is classified into three classes and in accordance with one of two alternative bases: metropolitan and international. These classes represent a quality rating which indicates the ability of buildings to attract similar types of tenants. The metropolitan base is for use within an office space market and the international base is for use primarily by investors among many metropolitan markets.
A combination of factors such as rent, building finishes, system standards and efficiency, building amenities, location/accessibility and market perception are used as relative measures. Building amenities include food facilities, copying services, express mail collection, physical fitness centers or child care centers.
As a rule, amenities are those services provided within a building. The term also includes such issues as the quality of materials used, hardware and finishes, architectural design and detailing and elevator system performance.” (BOMA, 2017)
Metropolitan Base Definition
Class A – The most prestigious buildings competing for premier office users with rents above average for the area. Buildings have high quality standard finishes, state of the art systems, exceptional accessibility and a definite market presence.
Class B – Buildings competing for a wide range of users with rents in the average range for the area. Building finishes are fair to good for the area. Building finishes are fair to good for the area and systems are adequate, but the building does not compete with Class A at the same price.
Class C- Buildings competing for tenants requiring functional space at rents below the average for the area. (BOMA, 2017)
International Base Definition
Investment- Investment quality properties are those that are unique in their location in the best metropolitan markets in the world, their design and construction quality, the profile of tenants, the tenant markets that they serve and the top-notch management. These properties stand out as leaders not only within their own metropolitan areas but also within the international investment community.
Institutional- Institutional grade properties are those of sufficient size and stature that can command attention by large national or international investors. These properties are of good design and construction, but they are not monumental in design and will not use the best construction materials. They will have a very stable tenant base. (BOMA, 2017)
Speculative properties usually will conform to popular design, but also will not use the best construction methods and materials. The design and construction of these properties emphasizes functionality instead of image and do not carry the name of any particular tenant. (BOMA, 2017)
b. Office Building Type
Four major office building types are widely used for categorizing purpose:
- Typical Office – Single structure located in downtown or suburbs with office use being the main revenue stream; possibly a minor retail component.
- Mixed Use Development (MXD) – One or more structures combining at least two significant revenue streams (i.e. retail, office, residential). Suburban MXDs cover more than 100 acres with buildings of various heights.
- Garden Office – Low-rise structures clustered together in office parks with extensive landscaped areas; and
- Flex Space – One- or two-story building usually located in business parks that has an office component combined with light industrial or warehouse use. (Peiser, 239)
c. Use & Ownership
Office buildings can also be classified by their use and owners. Building can be single- or multiple-occupant structures.
- Owner-Occupied – The building is occupied by the actual owner.
- Build-to-Suite – A building designed and constructed for a tenant that occupies most or all the space.
- Spec (speculative) Building – A single or multi-occupant building designed and developed without a commitment from a tenant.
- Medical Office – A unique product, designed specifically for doctor’s offices. It can be single tenant or multiple-tenant space. It is often located in a campus setting near hospitals or hospital grounds. (Peiser, 240)
c. Location
In most urban areas, at least four distinct types of office hubs can be found:
- Central Business District (CBD) – These have high land costs. They encourage more vertical development in the form of mid-rise and high-rise structures. Typical tenants include Fortune 50 companies, law firms, insurance companies, financial institutions, government and their services that require high-quality prestigious space.
- Suburban Locations – Are office locations outside the city centers. Suburban office buildings are often found in business districts, in clusters near freeway intersections, or in major suburban shopping centers. Rents are traditionally lower than CDB and tenants may include regional headquarters, high-tech and engineering firms, smaller companies, and service organizations that do not require a location in the CBD.
- Neighborhood Offices – Small office buildings are frequently located away from the major hubs, where they serve the needs of residents by providing space for service and professional businesses. Neighborhood offices can be integral parts of neighborhood shopping centers or freestanding buildings.
- Business Parks – Business parks include several buildings serving a range of uses from light industrial to office. These developments vary from several acres to several hundred acres. (Peiser, 240)
d. Office Building Project Feasibility Process
First step in the process is to conduct a market analysis to determine if a market exist for the office product. It also it provides direction for site selection and design by indicating the type of space and amenities that office users are looking for.
Market analysis is a study of demand and supply which is used to determine vacancy rates, cap rate, and property values. Developers must keep in mind the reasons why companies look for new space and attempt to fulfill those demands.
Market analysis also provide critical input to the financial analysis which will ultimately be used to demonstrate the feasibility of the project to investors and lenders.
(Peiser, 243)
e. Sublease & Shadow space
It is important to look at subleases when assessing supply because, although technically leased, it is often available, formally or informally, and is thus part of the market competition.
Shadow space is a leased space for which a tenant pays rent but it is vacant or not fully occupied and it is not yet available for sublease. It is a potential threat to a building’s rental stability and market recovery during a down cycle because an increase indicates tenant contraction, which can eventually increase vacancy if the trend continues. Shadow space is inefficient to landlords because it cannot be considered stable income and the space could be offered on the market with a better return. Unfortunately, none of the published resources track shadow space and assessment can only be done by talking to area property managers. (Peiser, 246)
f. Calculating Effective Rental Rate
An important distinction in office market analysis is the difference between quoted (face) rent and effective rents. Property owners sometimes use incentives to maintain the appearance of certain rent levels while effectively reducing rent for certain times or tenants.
Typically, lenders determine a specific rent and preleasing threshold as a
condition of funding or for releasing of the developers’ personal guarantee on the construction loan. To meet these conditions in a soft market, developers may offer tenants concessions in the form of free rent for a specified period, an extra allowance for tenant improvement, or moving expenses, if the rent meets the lenders requirements.
Concessions such as Tenant improvements are market driven, by lease type, property type, and location. Rental concessions are harder for market analysts to identify than asking rents because brokers tend to understate concessions due to the negative influence on their commission. Concessions is a common practice across markets and there are several factors influencing the numbers and amounts of concessions. Lenders generally use effective rent rate in their analysis before funding a loan. (Peiser, 246)
g. Site Selection
Site selection is crucial part of project feasibility analysis because it affects the rent and occupancy levels. Developers must compare location access, physical attributes, zoning, development potential, and rents and occupancy of comparable buildings and sites to identify the right opportunities and obstacles.
In general, office use can support the highest rents of any land use type and thus is often located on the highest-priced land. This factor should not deter developers because a high price is usually indicative of site desirability. Similarly, developers choosing sites based on lower prices can find themselves unable to compete in the market, even at lower rates.
Th site should be able to accommodate an effective building design and in accordance to local demands.
Primary consideration in site selection should be convenient access to regional transportation systems. Public transportation system is important in urban locations. Developers should look for sites highway and transit access and check with transportation authorities before proceeding.
Lastly, office buildings should be in a site that offers a sense of place. Where synergy exists between office buildings ad activities such as restaurants, shopping, entertainment, hotels, and residential uses. (Peiser, 247)
h. Design & Construction
Per Peiser, the key to successful office design is to address area market and building codes and offer an efficient building at an appropriate price. Among the major design decisions, are the shape of the building, interior design, bay depths, type of exterior, and lobby design, all of which create an image and identify the structure. (Peiser, 251)
Office buildings also need to be adaptable and flexible to meet the shifting demands of tenants. Today’s workplaces are different from those of the past. Formerly, executive offices were on the perimeter with several workstations around them. Poor acoustics, limited flexibility and views, and a lack of meeting space was common.
Now, the walls are coming down because of the changing work styles, mobility, and the growing presence of Millennials.
“More than ever, we see young companies owned or dominated by Millennials moving toward historic downtown buildings, where they’re installing sustainable, laid-back interiors with clean furniture systems and high finish quality.” (BCNETWORK, 2017)
“With 72 percent of corporate real estate executives tasked by the responsibility of productivity improvements, decision makers are putting emphasis on modifying their facilities to support creativity, focus, and teamwork. In some high-tech companies run by Millennials, nonconventional workspaces are the thing. “Millennials are collaborators, and they don’t like to isolate themselves,” says Marlyn Zucosky, IIDA, Partner and Director of Interior Design with JZA+D “Providing more open places for informal meetings is a successful strategy. And Millennials in general have a lower demand for privacy than Baby Boomers.” High-tech companies are amplifying this trend, according to a workplace experts. (BCNETWORK, 2017)
“Hierarchy, tenure, and seniority are no longer the key factors in design, and flexible work zones are displacing high, opaque walls.
With workers spending more time away from their workstations, workplace density is on the rise. Per the global technology research firm Gartner Group, knowledge workers typically spend just 40 percent of their time at their desks, and non-group tasks have decreased to about 20 percent of the working day. Thus, personal workspaces decreasing 30–40 percent.” (BCNETWORK, 2017)
In 2001, an average of 300 SQF was allotted per worker. By 2010, space allocation was down to 225 SQF––and in 2012, it dropped to 176 SQF per person. Per CoreNET Global (A Corporate Real Estate Association) the metric could go as low as 100 SQF per person within a few years. In part, the trend is the result of moving casual meetings from the cubicle or office to a huddle area. (BCNETWORK, 2017)
3. State of the US Economy
Before we get into into the world of national and local office asset data, statistics, and metrics, we must first examine the state of the US economy as this is going to provide the rational for the current as well as future Office Market behavior.
a. Fed Fund Rate
The Federal Reserve raised the target range for its federal funds by 25 base points from 0.75 percent to 1 percent during its March 2017 meeting. The decision came in line with market expectations as the labor market strengthened and economic activity continued to expand. Interest rate forecasts point to another two rate hikes this year. In the Fed’s view, the economy is growing quickly enough and should not overheat. However, the increase to the target rate is minor and all types of interest rates remain very low. An increase in interest rate, tends to trigger a slow-down in barrowing which in turn slows own the economy. (Tradingeconomics, 2017)
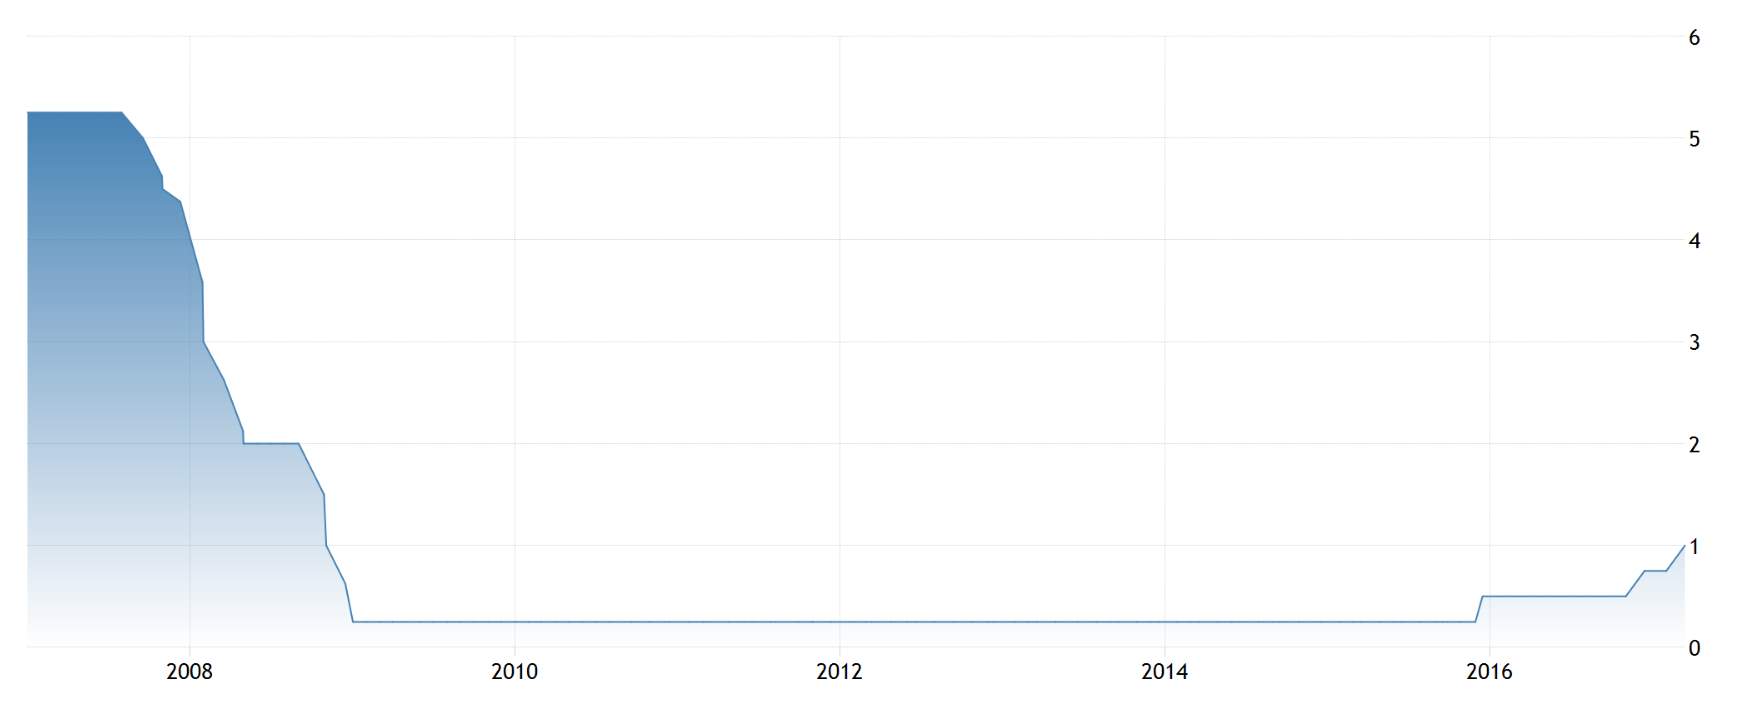
Figure 1 US Fed Funds Rate (Source: Tradingeconomics.com | US Bureau of Economics)
Per international brokerage firm Marcus & Millichap, strength in the overall domestic economy, tightening monetary policy and expanding government spending will continue to drive interest rates and the US dollar. The upside is that higher interest rates in the US could attract more foreign investment, at the expense of American exports which could become more expensive, imposing difficulty for US manufacturers. The central bank anticipates raising the Fed Funds rate three more times this year. (Marcus & Millichap, 2017)
b. LIBOR
US Dollar LIBOR Three Month Rate was quoted at 1.15 percent on Monday April 3. Interbank Rate in the United States averaged 3.88 percent from 1986 until 2017, reaching an all-time high of 10.63 percent in March of 1989 and a record low of 0.22 percent in May of 2014. LIBOR is a rate that is commonly used in short term, riskier loans as you will see later in this research. Construction loan rates are based on LIBOR for major lenders, while smaller community banks offer rates based on the prime rate. (Tradingeconomics, 2017)
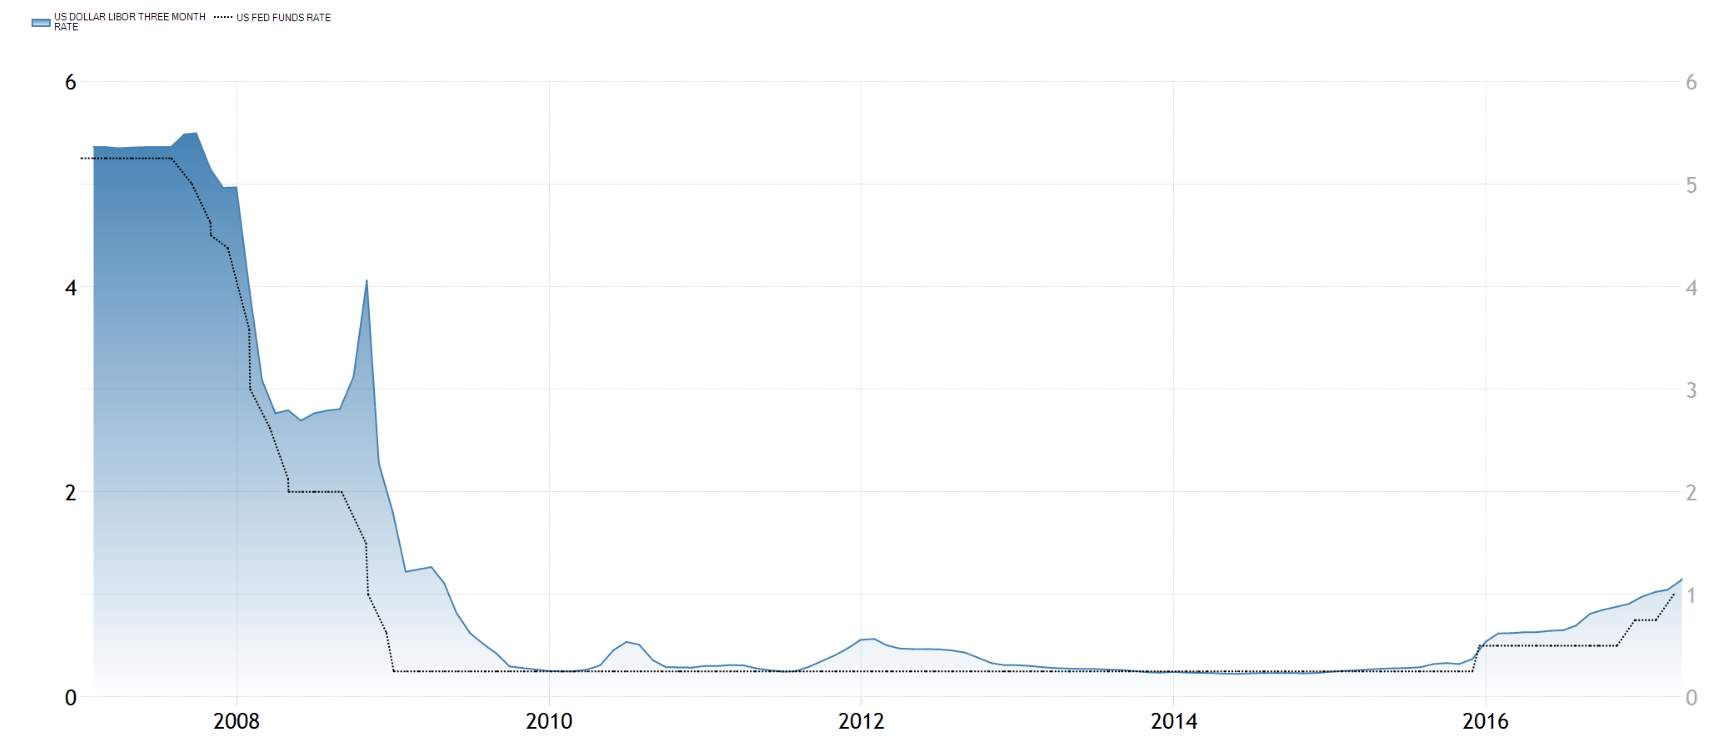
Figure 2 US LIBOR Rate vs. Fed Fund Rate (Source: Tradingeconomics.com)
c. GDP
“The Gross Domestic Product (GDP) in the United States was worth 18036.65 billion US dollars in 2015. The GDP value of the United States represents 29.09 percent of the world economy. GDP averaged 6560.26 USD Billion from 1960 until 2015, reaching an all-time high of 18036.65 USD Billion in 2015 and a record low of 543.30 USD Billion in 1960.+ (Tradingeconomics, 2017).
“The Trump administration is signaling plans to energize domestic economic growth via infrastructure and defense spending, comprehensive tax reform and deregulation. The Republican-led Congress is likely to go along enabling quick resolution to the passage of a budget and a higher debt limit.” (Marcus & Millichap, 2017)
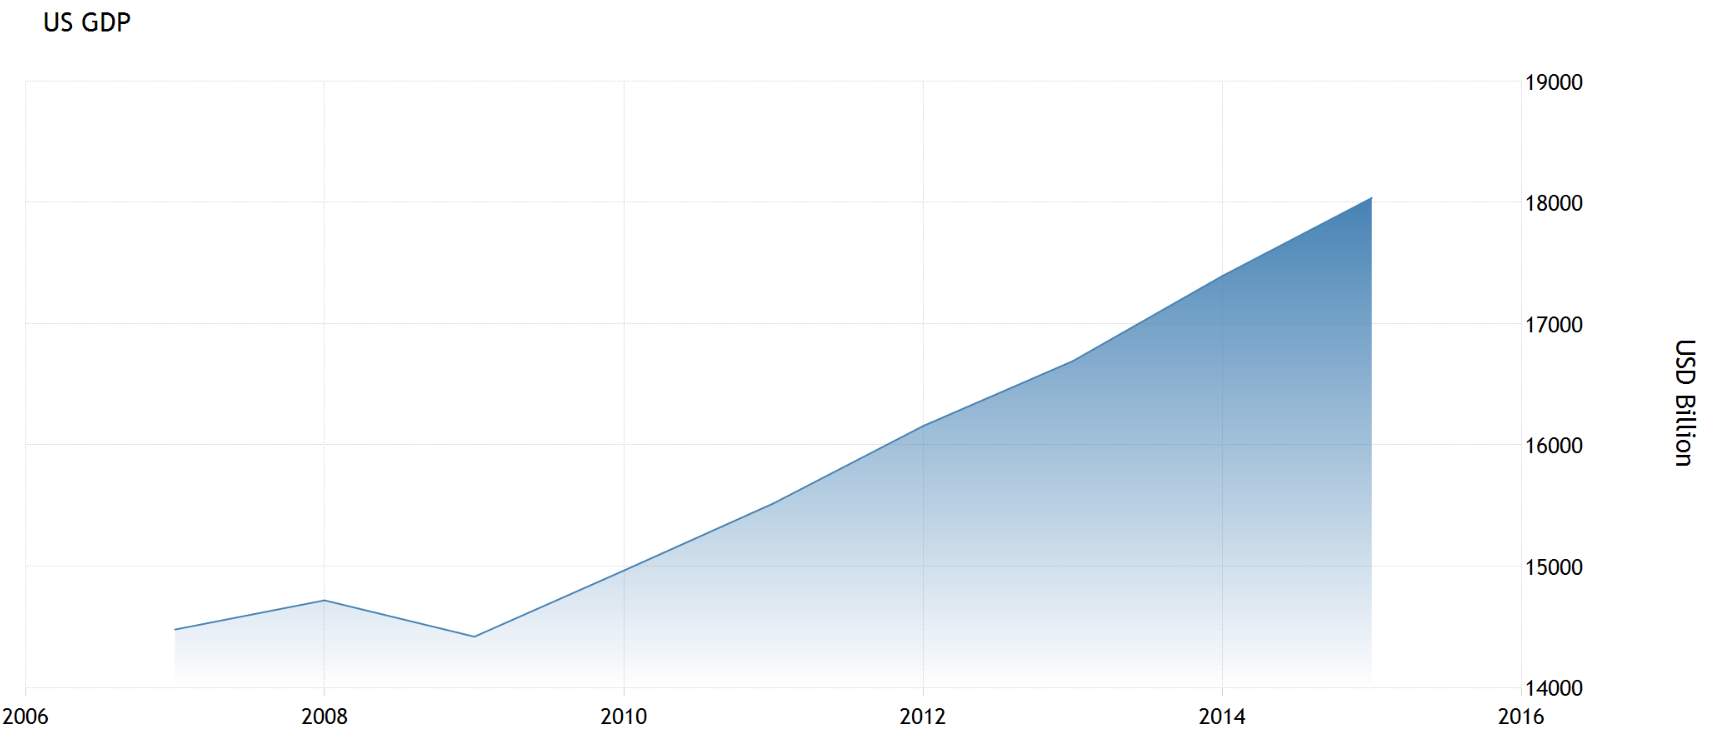
Figure 3 US GDP (Source: Tradingeconomics.com | World Bank)
d. GDP Growth Rate
The US economy grew by 2.7 percent on quarter in the fourth quarter of 2016, higher than previous estimates. Personal consumption expenditures (PCE) increased more than previously estimated. (Tradingeconomics, 2017)
Two issues could mitigate immediate growth: the tightening labor market and the ambiguity of the Trump administration’s proposals regarding fiscal policy and trade. Once the new administration’s policies are more clearly defined, the pace of economic growth could elevate as businesses proceed with greater certainty. (Marcus & Millichap, 2017)
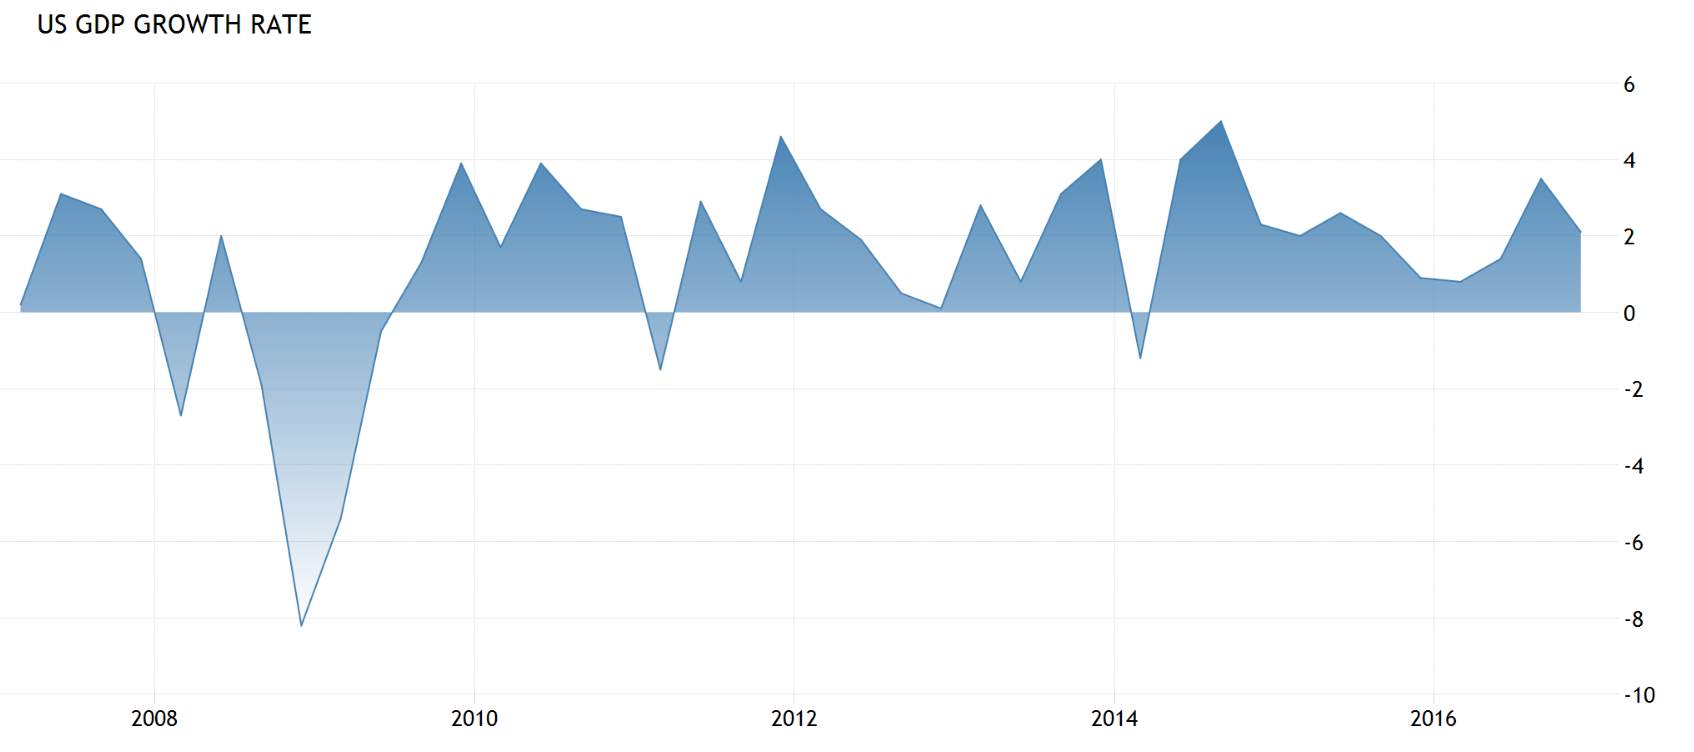
Figure 4 US GDP Growth Rate (Source: Tradingeconomics.com)
e. Inflation
Consumer prices in the United States increased 2.7 percent year-on-year in February of 2017, following a 2.5 percent rise in January and in line with market expectations. (Tradingeconomics, 2017)
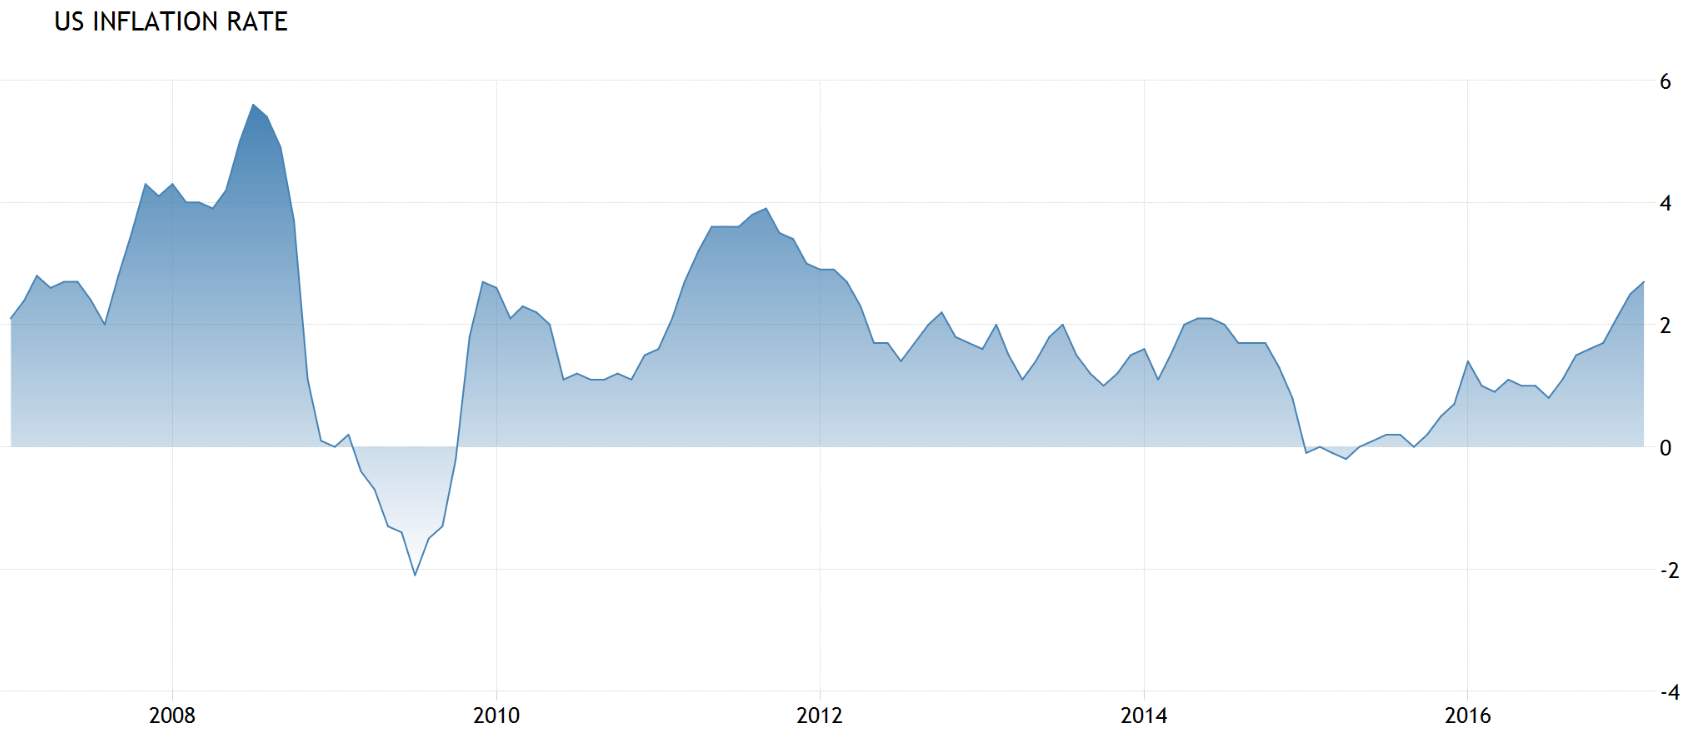
Figure 5 US Inflation Rate (Source: Tradingeconomics.com | US Bureau of Labor Statistics)
f. Consumer Spending
Consumer Spending in the United States increased to 11669.80 USD Billion in the fourth quarter of 2016 from 11569 USD Billion in the third quarter of 2016. (Tradingeconomics, 2017)
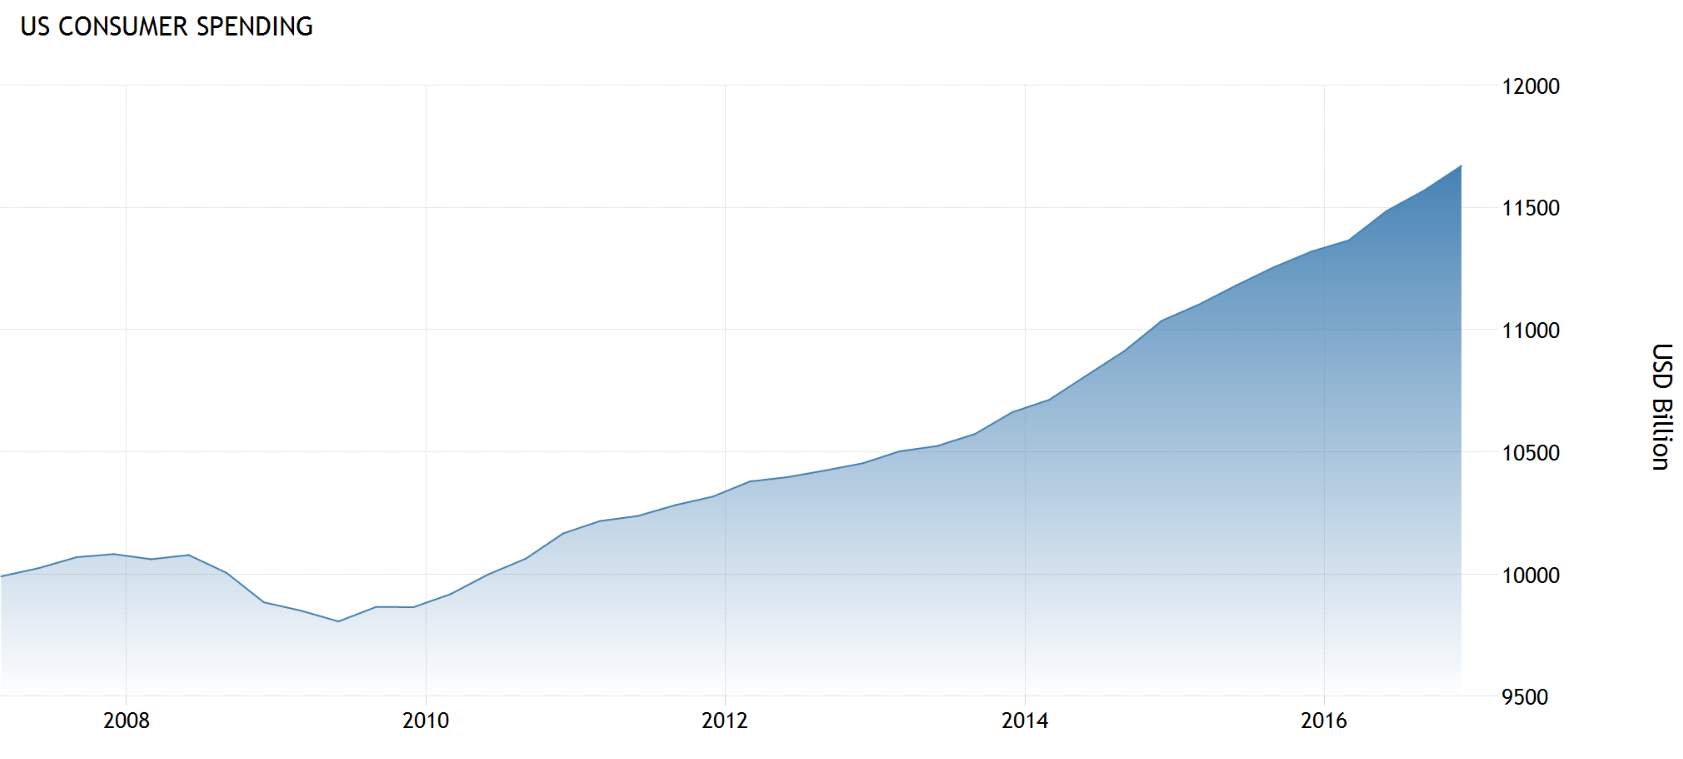
Figure 6 Consumer Spending (Source: Tradingeconomics.com | US Bureau of Economic Analysis)
g. Purchasing Managers Index
“The Institute for Supply Management’s Manufacturing (ISM) PMI rose to 57.7 in February of 2017 from 56 in January and well above market expectations of 56. It is the highest since August of 2014 amid rising new orders and production while employment eased. Comments from the ISM largely indicate strong sales and demand, and reflect a positive view of business conditions.” (Tradingeconomics, 2017)
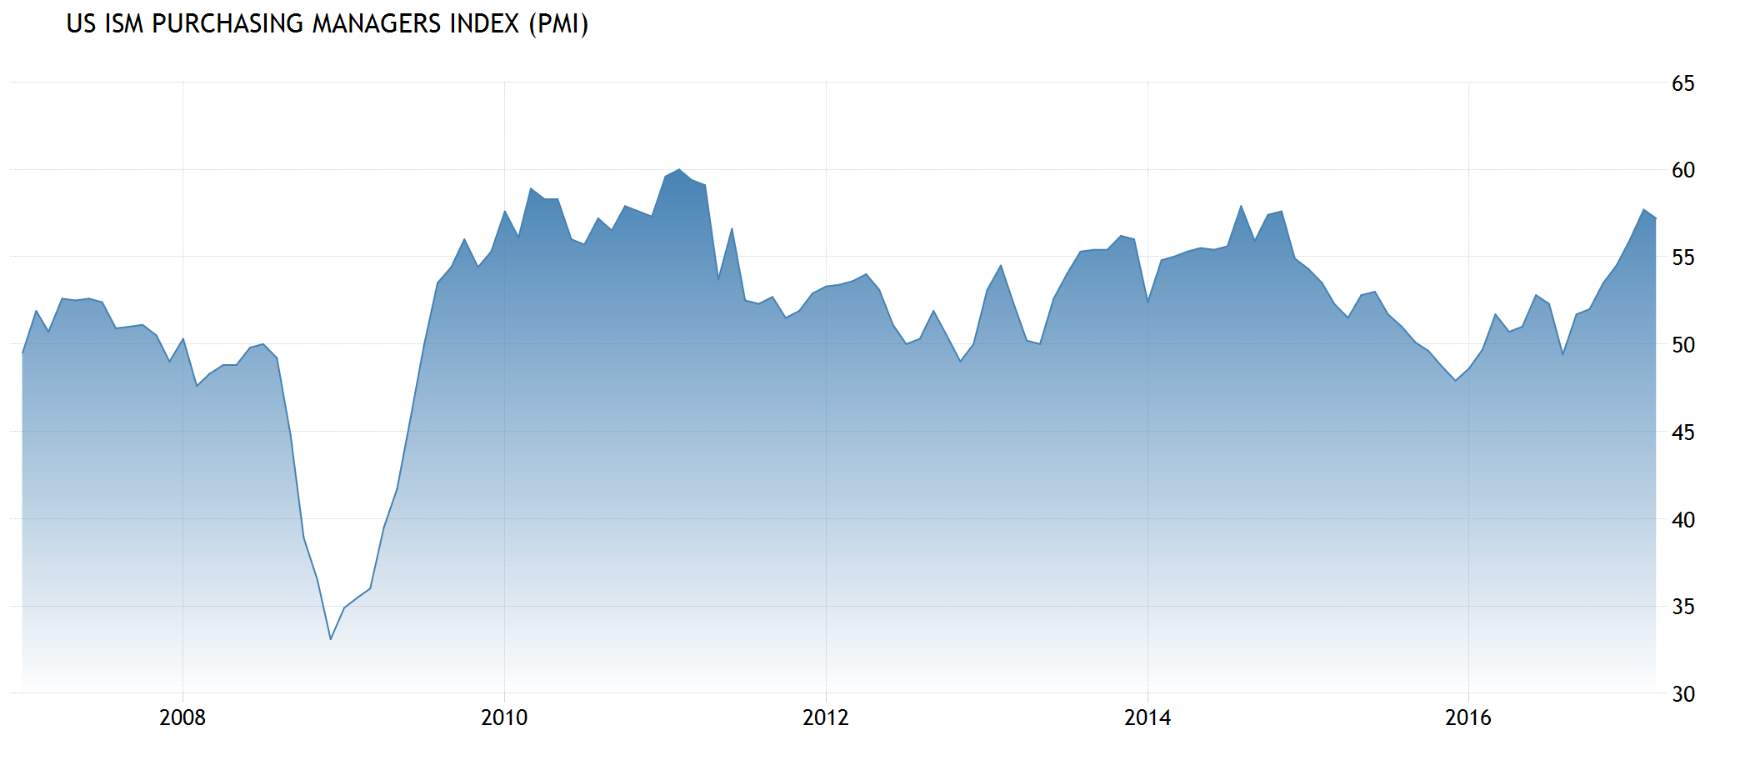
Figure 7 Purchasing Managers Index (Source: Tradingeconomics.com | Institute for Supply Management)
h. Government Spending
Government Spending in the United States is expected to be 2907.52 USD Billion by the end of this quarter. Analysts estimate Government Spending in the United States to stand at 2910.44 in 12 months’ time. In the long-term, the United States Government Spending is projected to hit around 2913.74 USD Billion in 2020. (Tradingeconomics, 2017)
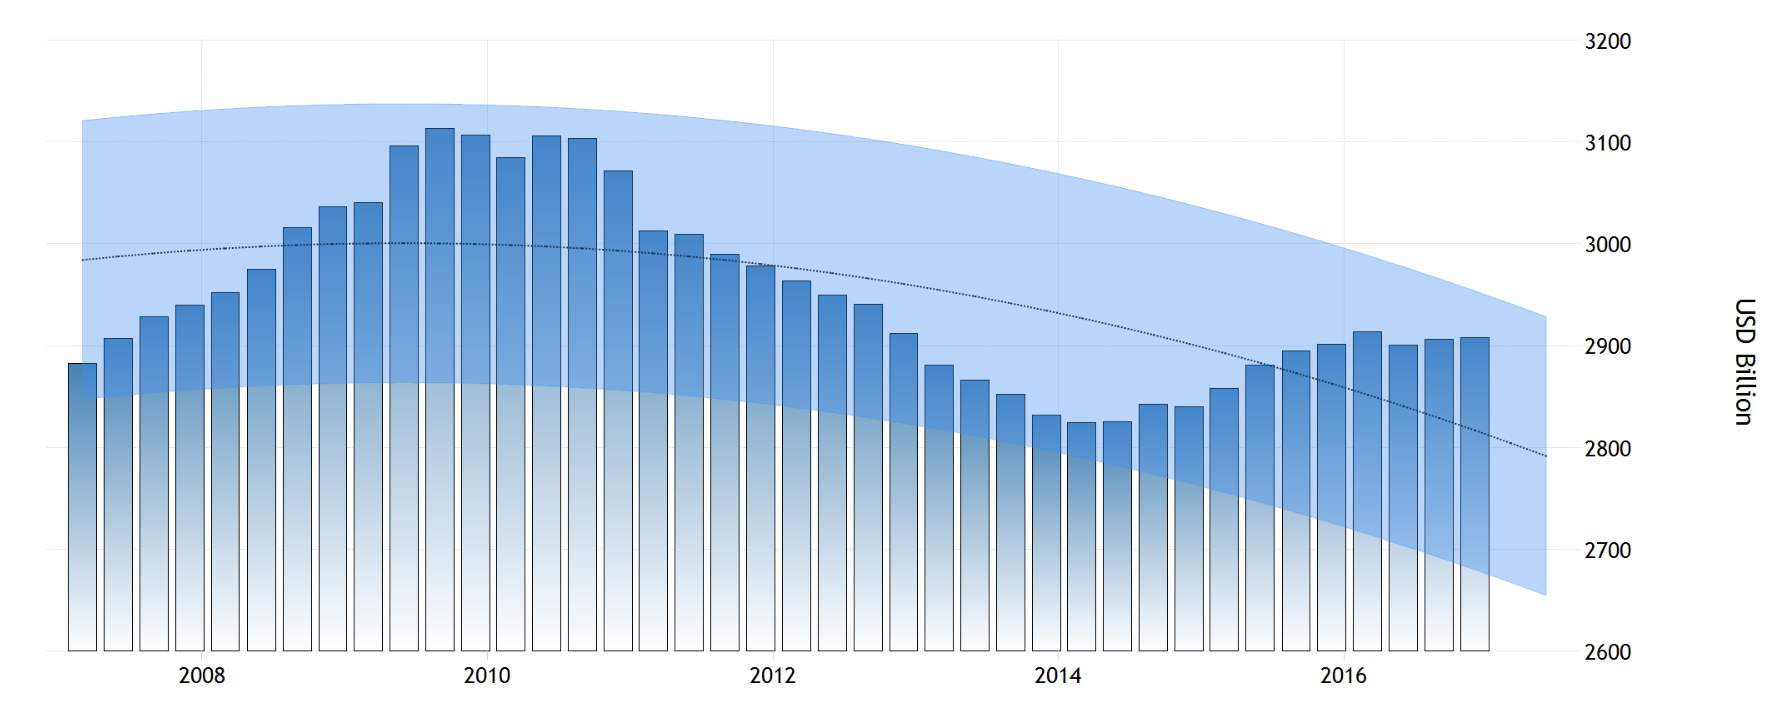
Figure 8 US Government Spending (Source: Tradingeconomics.com | US Bureau of Economics)
i. Exports vs. Imports
Total exports from the United States rose 0.6 percent month-over-month to USD 192.09 billion in January 2017, the highest value since December 2014. Sales of industrial supplies and materials hit their strongest level since December 2014. On the other hand, total imports to the United States climbed 2.3 percent month-over-month to USD 240.6 billion in January 2017. It was the highest value since December 2014, as petroleum imports were the largest in two years and purchases of automobiles hit a record high. (Tradingeconomics, 2017)
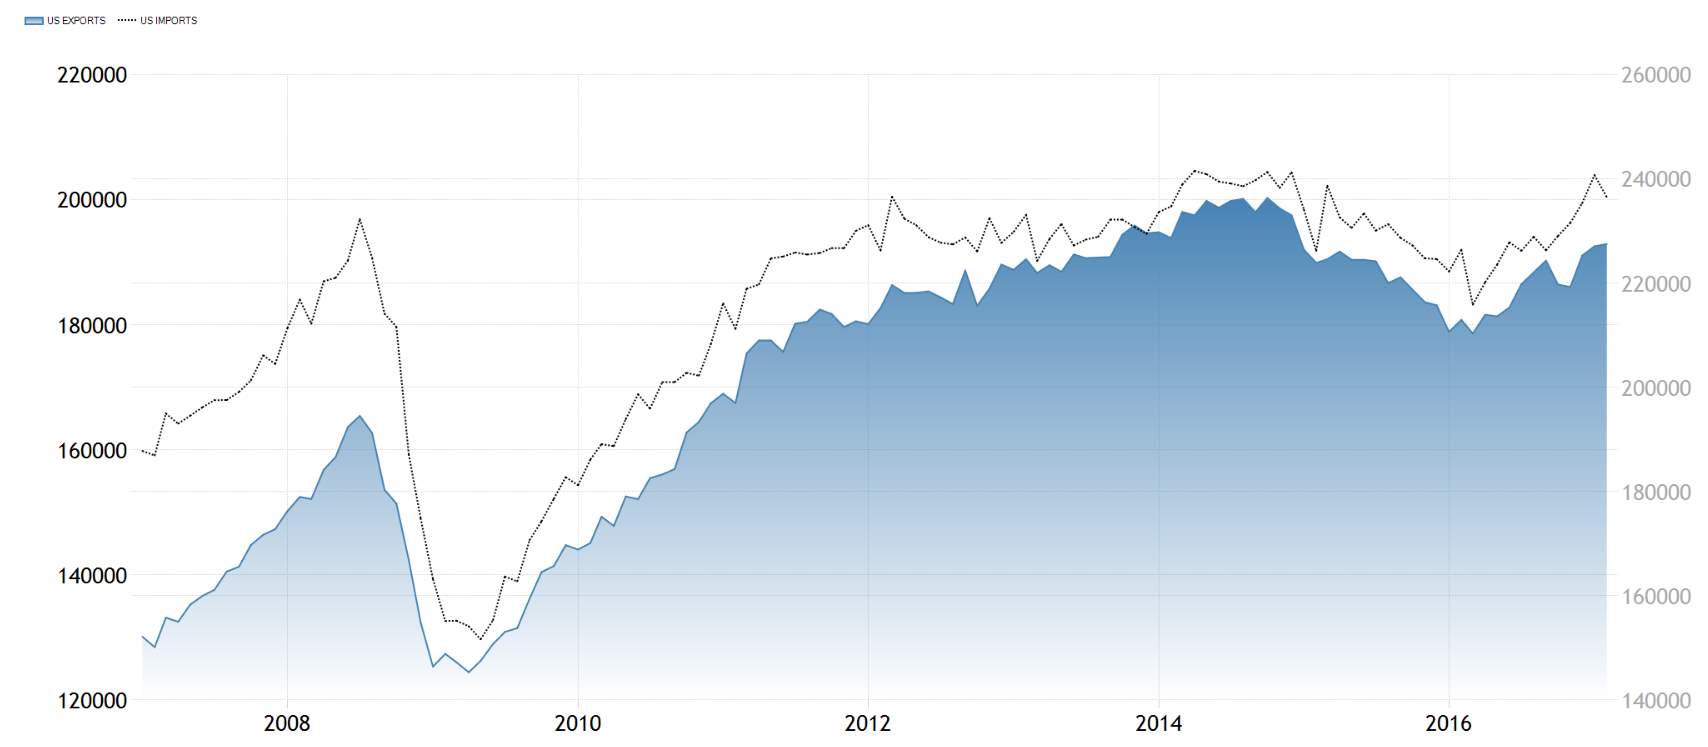
Figure 9 US Exports (Source: Tradingeconomics.com | US Census Bureau)
j. Balance of Trade
The goods and services deficit in the United States increased to USD 48.5 billion in January of 2017 from a USD 44.3 billion gap a month earlier and in line with market expectations. It is the highest deficit since March of 2012 as imports jumped 2.3 percent due to consumer goods and oil and exports rose at a slower 0.6 percent. (Tradingeconomics, 2017)
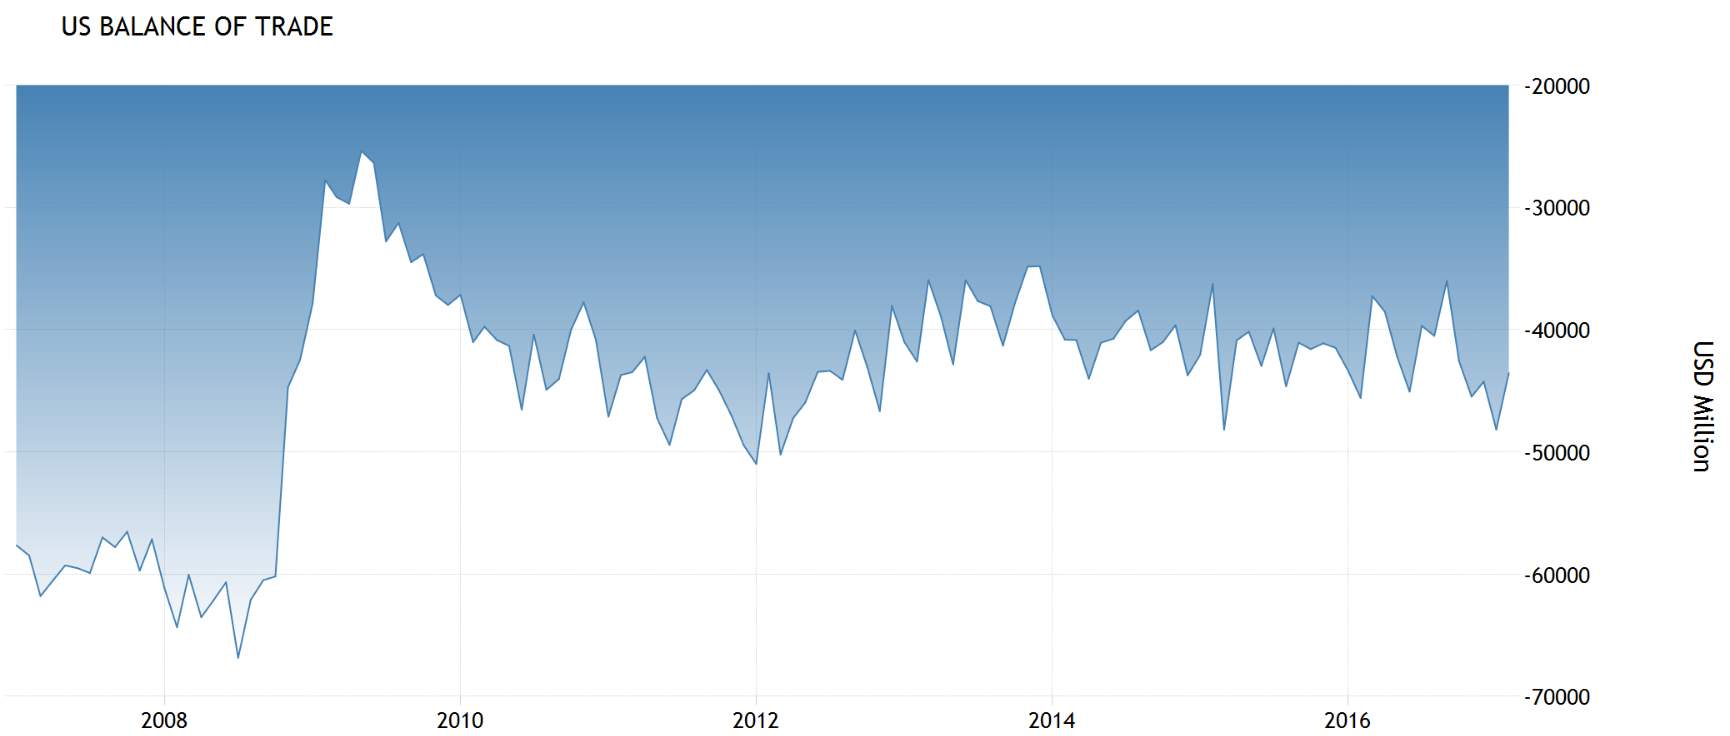
Figure 10 US Balance of Trae (Source: Tradingonomics.com | US Census Burau)
k. Major Indexes
For the whole first quarter of 2017, all major indices showed strong gains, with the S&P increasing by 4.6 percent; the S&P 500 by 5.5 percent; and the Nasdaq by 9.8 percent. (Tradingeconomics, 2017)
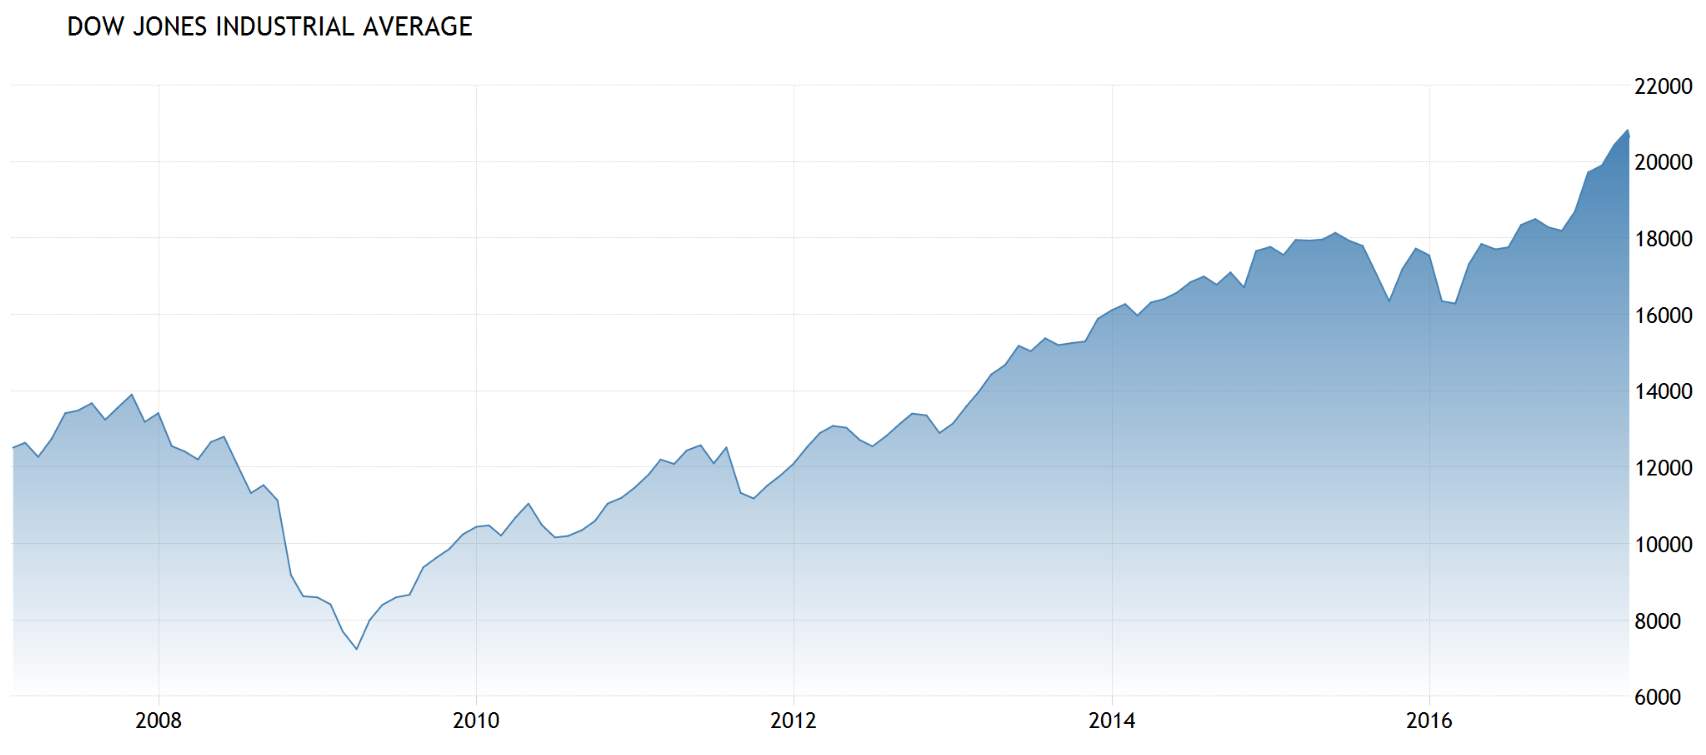
Figure 11 Down Jones Industrial Average (Source: Tradingeconomics.com)
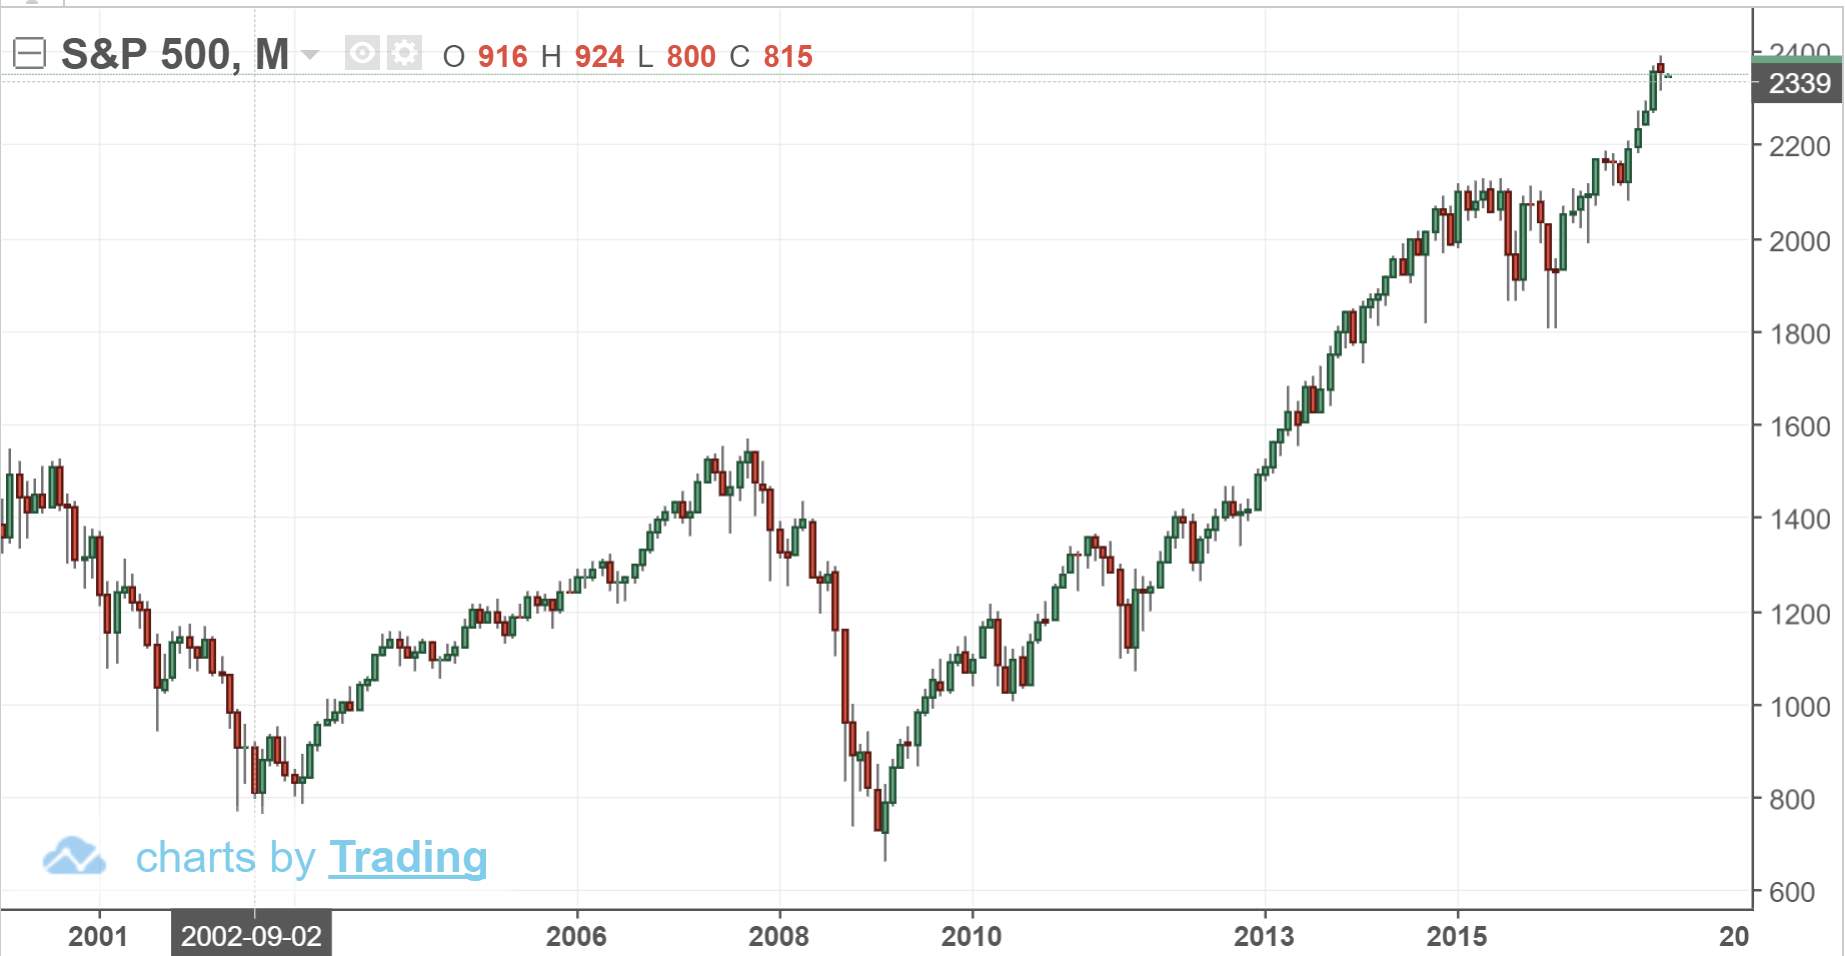
Figure 12 S&P 500 Opening April 4, 2017 (Source: Tradingeconomics.com)
l. US Government Bond 10Y
US 10 Year Treasury Bill decreased 0.03 percent or 0.03 percent to 2.39 on Friday March 31 from 2.42 in the previous trading session. Historically, the United States Government Bond 10 year reached an all-time high of 15.82 in September of 1981 and a record low of 1.36 in July of 2016. (Tradingeconomics, 2017)
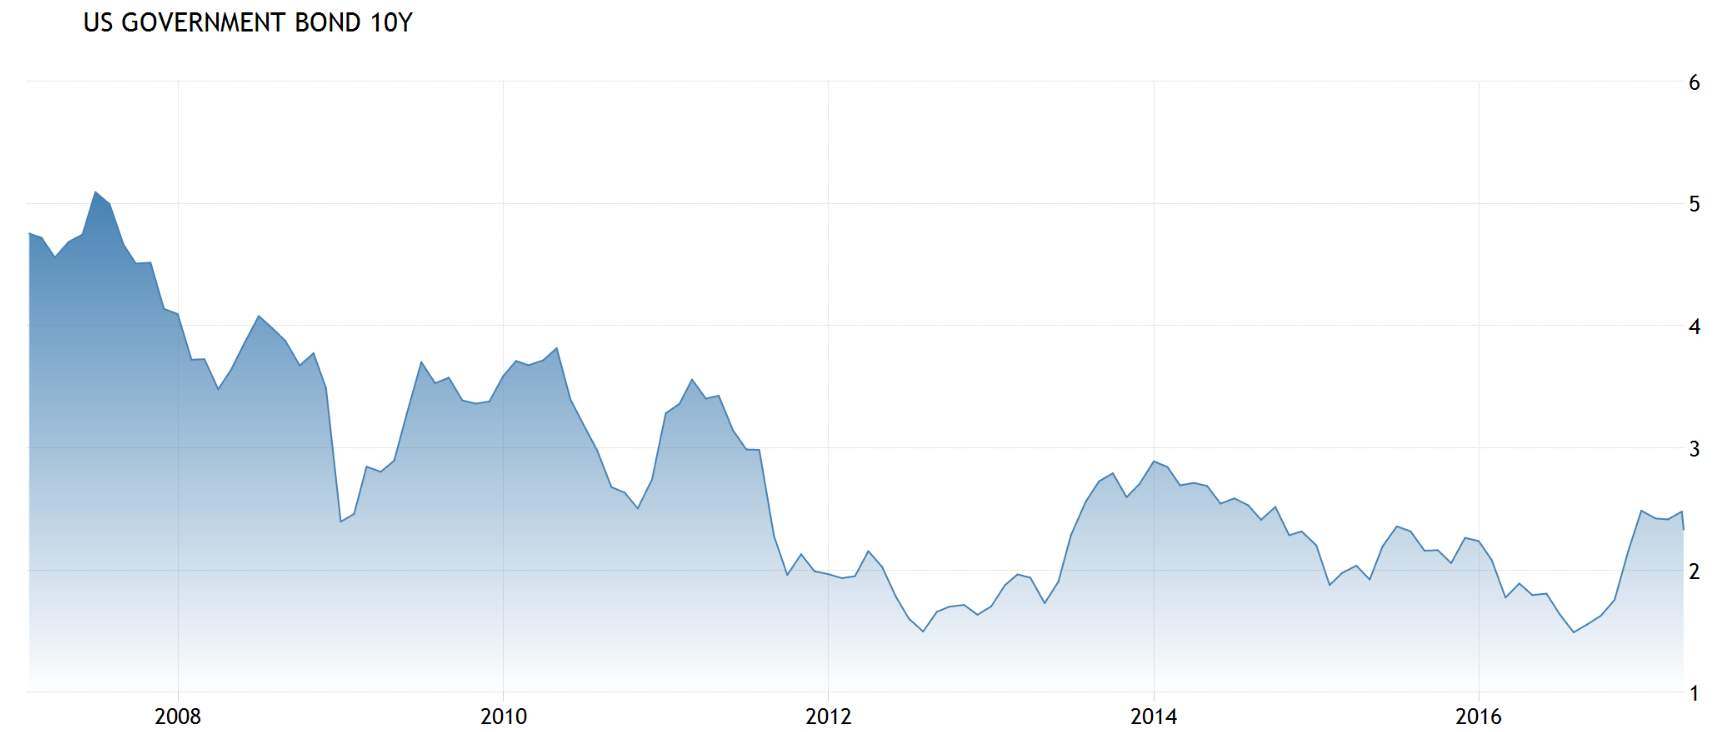
Figure 13 Ten Years US Treasury Bill (Source: Tradingeconomics.com | US Department of Treasury)
It is important to highlight what the perception is on the street with respect to the 10 Year Treasure Bill vs. the S&P 500 Index. Per John Hussman, from the Hussman Fund, “last week, Treasury bill yields rose to 0.75 percent following the Federal Reserve’s quarter-point hike in the target Federal Funds rate, placing the yield on even risk-free liquidity above a 0.6 percent estimate for 12-year prospective S&P 500 annual total returns.” (Hussman, 2017)
m. Personal Income
“Personal income in the United States rose by 0.4 percent month-over-month in February 2017, following an upwardly revised 0.5 percent increase in January and in line with market expectations. Wages and salaries went up by 0.5 percent, compared to 0.4 percent increase in January, and personal current transfer receipts rose by 0.2 percent after growing by 1.2 percent in the previous month.” (Tradingeconomics, 2017)
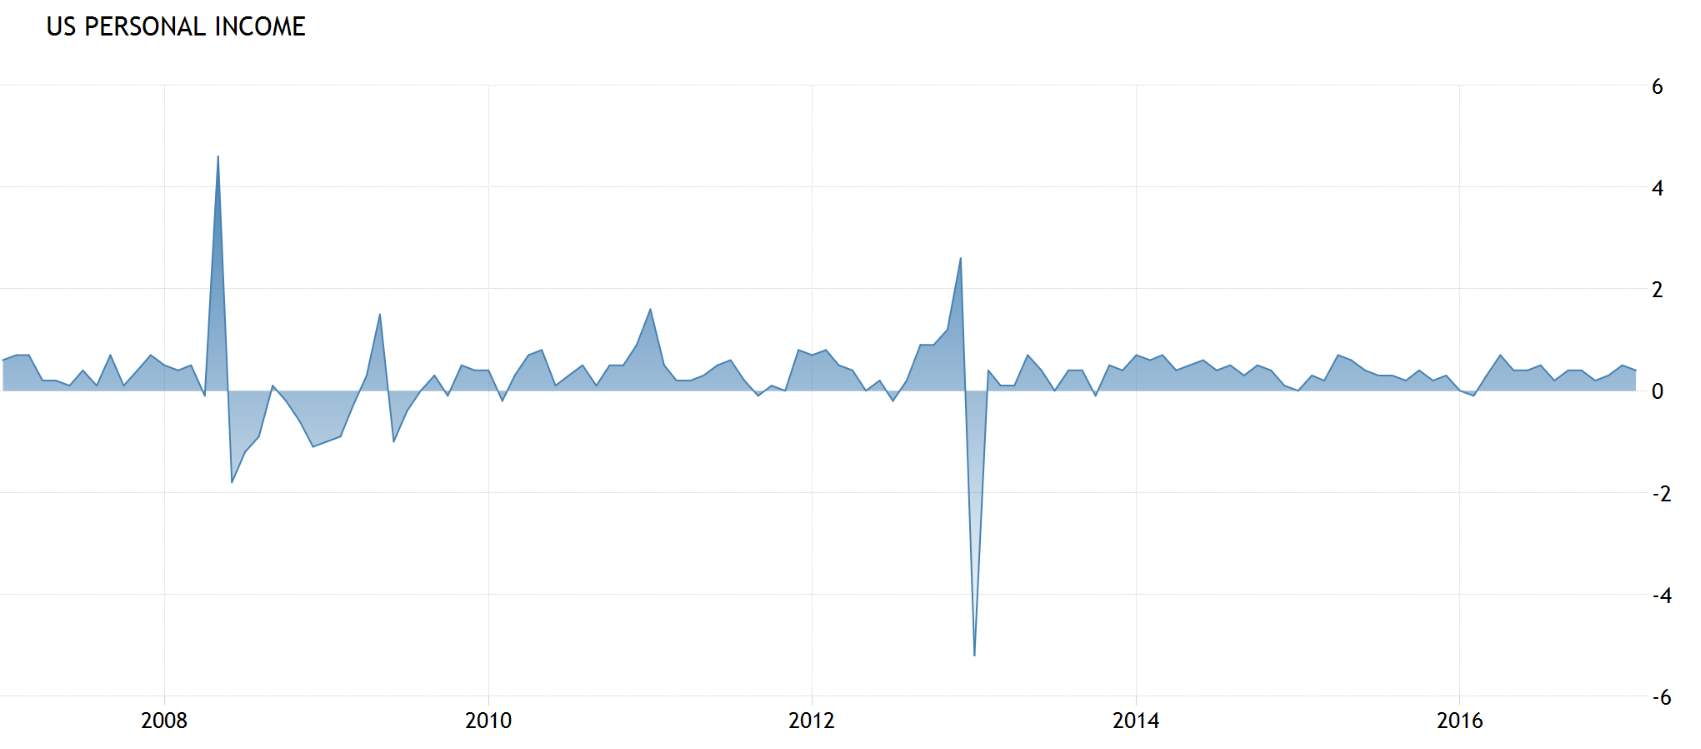
Figure 14US Personal income (Source: Tradeconomics.com US Bureau of Economic Analysis)
n. US Unemployment Rate
US unemployment rate fell to 4.7 percent in February 2017 from 4.8 percent in the previous month, in line with market expectations. The number of unemployed persons was almost unchanged at 7.5 million while the labor force participation rate increased by 0.1 percentage point to 63 percent. (Tradingeconomics, 2017).
“Per Marcus & Millichap, job creation will moderate as the labor market tightens. After adding roughly 2.2 million jobs in 2016, employers will create 2.0 million
positions this year. The total includes 690,000 workers in office-using employment sectors.” (Marcus & Millichap, 2017)
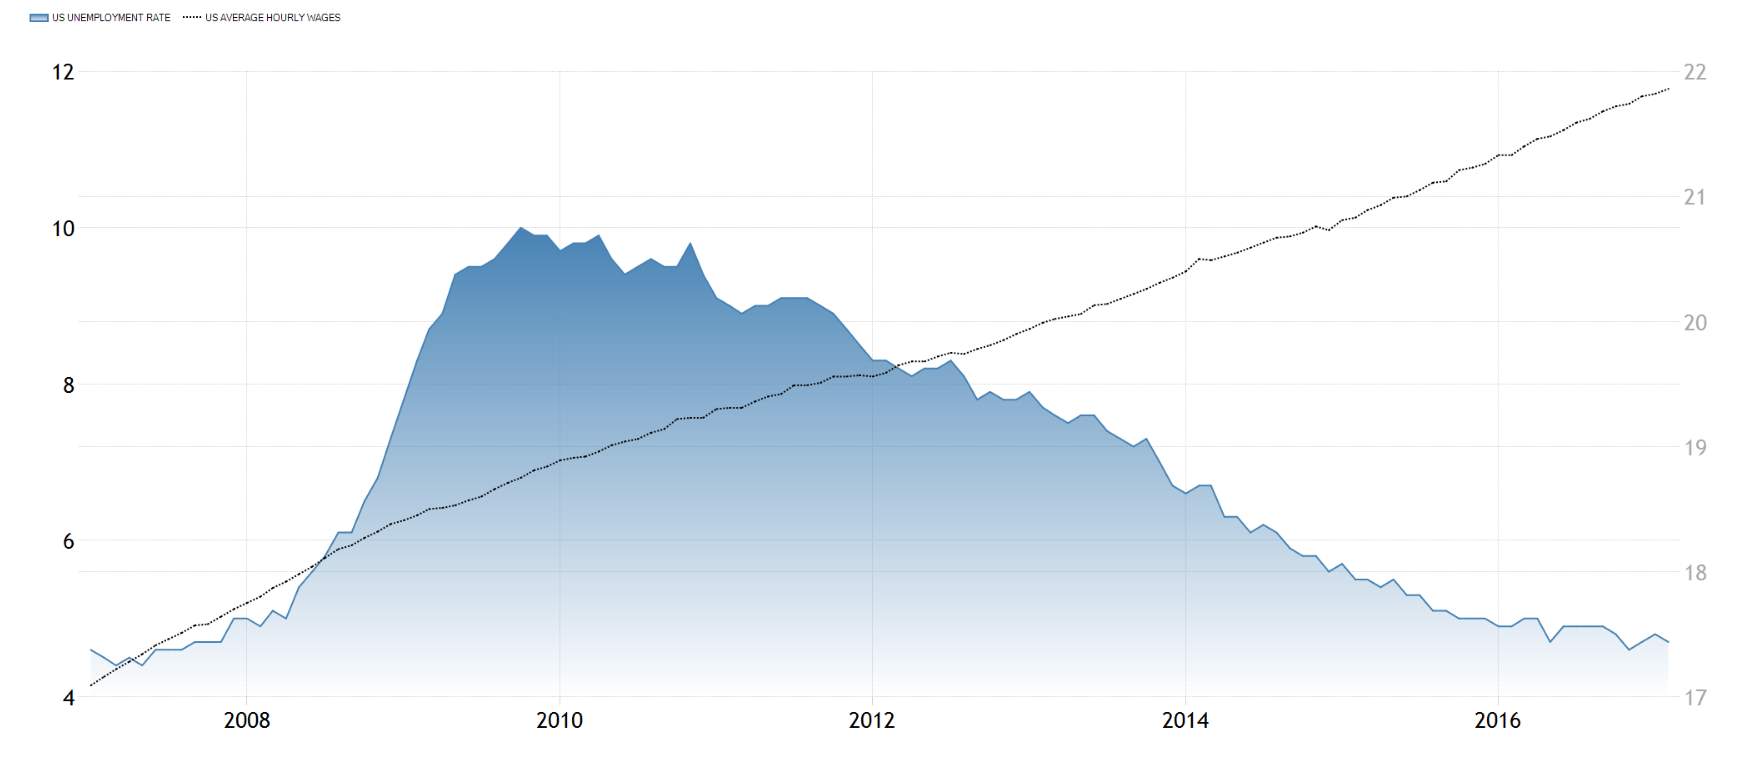
Figure 15 US Unemployment Rate vs Wages (Source: Tradingeconomics.com | US Bureau of Economics)
Additional job creation within the tight labor market could raise wage pressure. Rising consumer confidence and increasing discretionary income could drive more robust spending leading to moderate economic growth. (Marcus & Millichap, 2017)
o. Building Permits vs. Case-Schiller Home Price Index
Building permits in the United States fell by 6 percent month-over-month to a seasonally adjusted annualized rate of 1,216 thousand in February 2017.
The S&P CoreLogic Case-Shiller composite index of 20 metropolitan areas in the US rose 5.7 percent year-on-year in January of 2017, following a downwardly revised 5.5 percent increase in the previous month. It is the biggest gain since July of 2017, beating market expectations of a 5.6 percent gain. (Tradingeconomics, 2017)
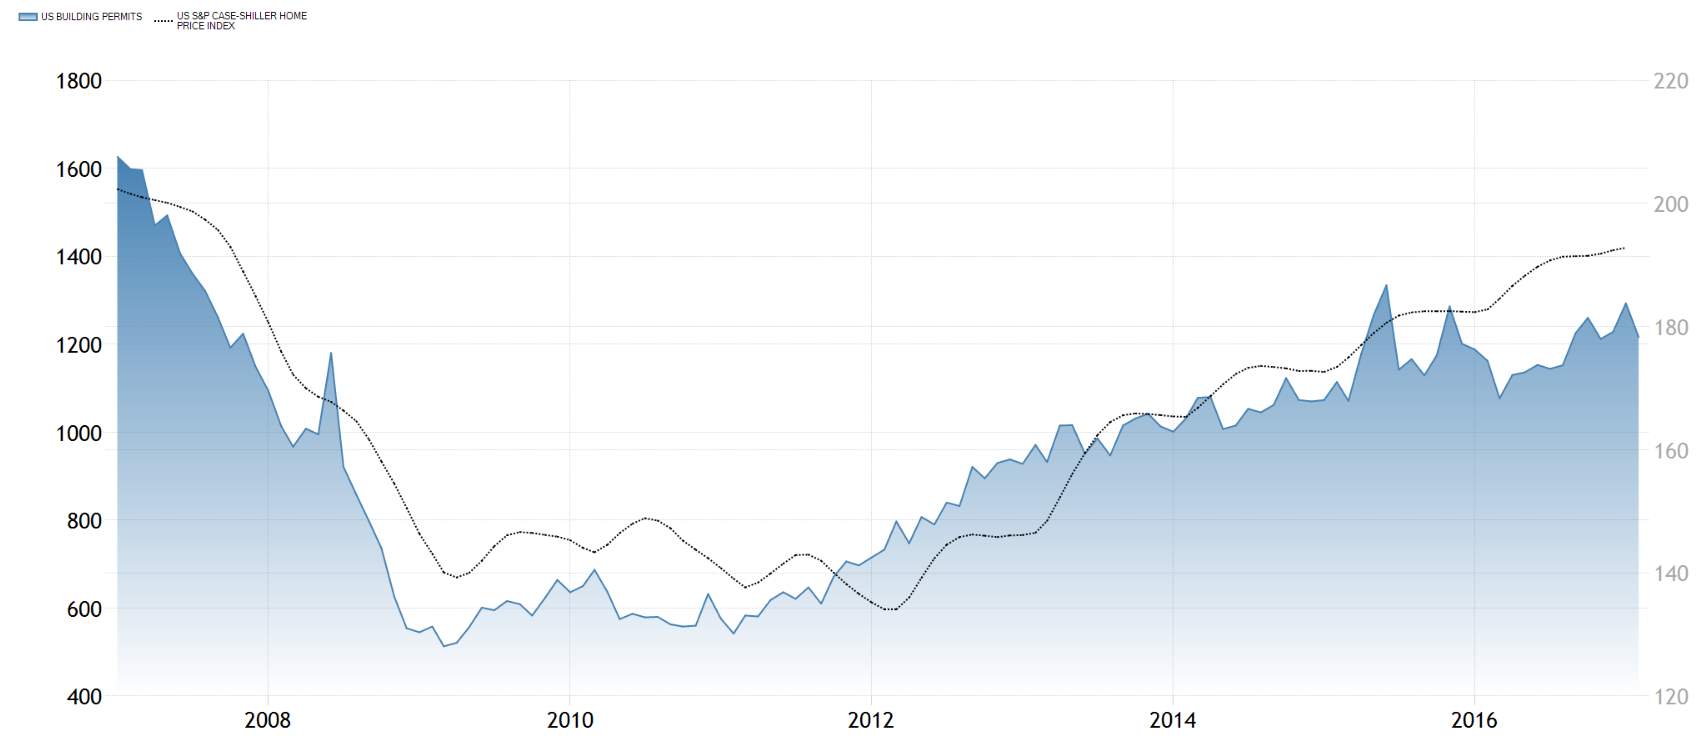
Figure 16 US Building Permits vs. Case-Shiller Home Price Index (Source: Tradingeconomics.com | US Census Bureau)
p. Non-Farm Payroll
“Non-Farm Payrolls in the United States increased by 235 thousand in February of 2017, lower than upwardly revised 238 thousand in January but above market expectations of 190 thousand. Employment gains occurred in construction, private educational services, manufacturing, health care, and mining.” (Tradingeconomics, 2017)
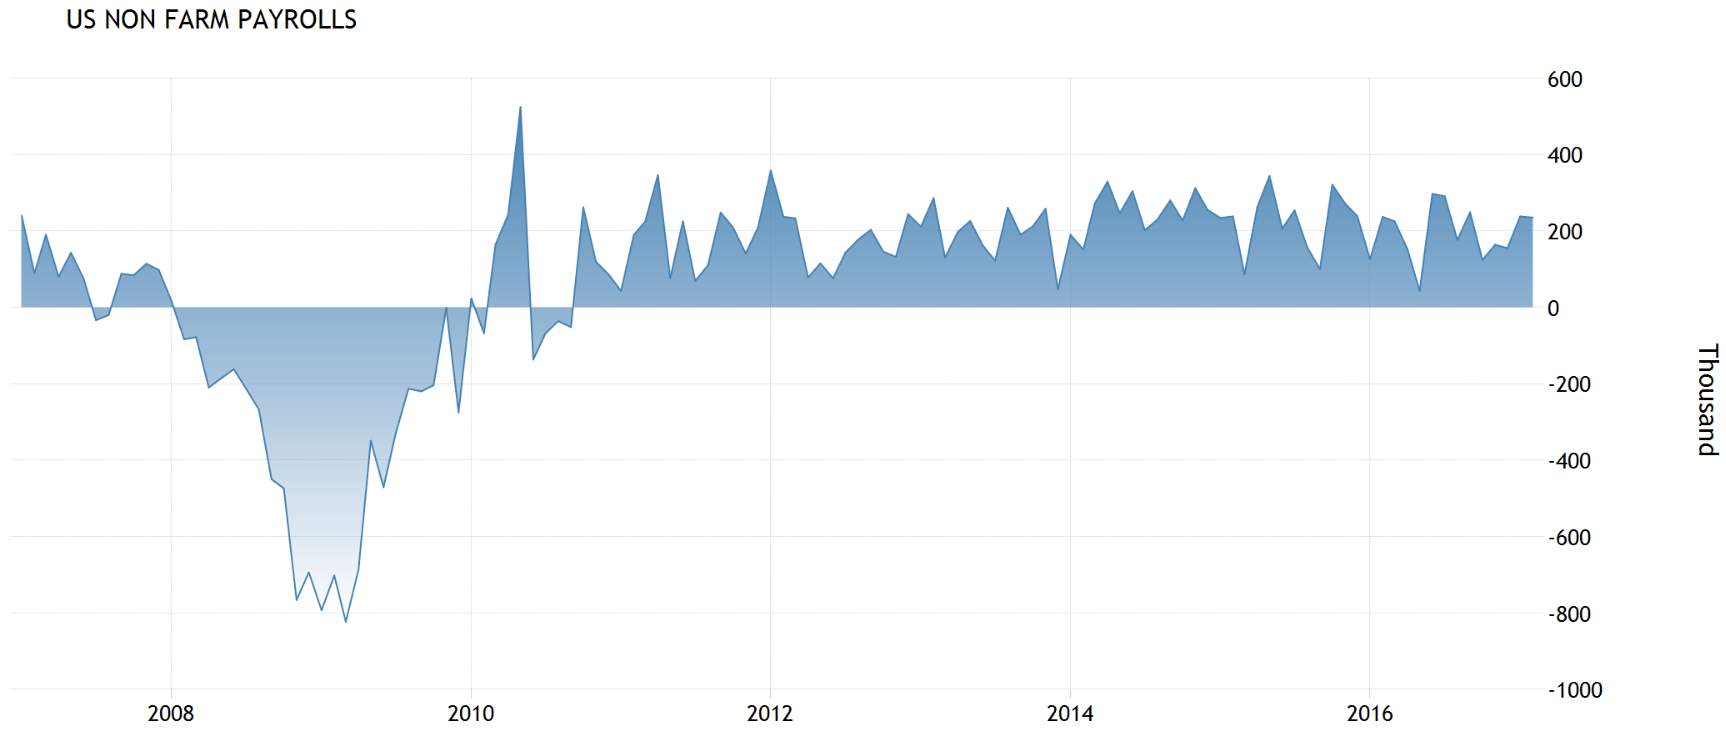
Figure 17 US Nonfarm Payroll (Source: Tradingeconomics.com | US bureau of Labor Statistics)
“In February, construction employment increased by 58,000, with gains in specialty trade contractors (+36,000) and in heavy and civil engineering construction (+15,000). Construction has added 177,000 jobs over the past 6 months.
Employment in private educational services rose by 29,000 in February, following little change in the prior month (-5,000). Over the year, employment in the industry has grown by 105,000.
Manufacturing added 28,000 jobs in February. Employment rose in food manufacturing (+9,000) and machinery (+7,000) but fell in transportation equipment (-6,000). Over the past 3 months, manufacturing has added 57,000 jobs.
Health care employment rose by 27,000 in February, with a job gain in ambulatory health care services (+18,000). Over the year, health care has added an average of 30,000 jobs per month.
Employment in mining increased by 8,000 in February, with most of the gain occurring in support activities for mining (+6,000). Mining employment has risen by 20,000 since reaching a recent low in October 2016.
Employment in professional and business services continued to trend up in February (+37,000). The industry has added 597,000 jobs over the year.
Retail trade employment went down in February (-26,000), following a gain of 40,000 in the prior month. Job losses occurred in general merchandise stores (-19,000); sporting goods, hobby, book, and music stores (-9,000); and electronics and appliance stores (-8,000).
Employment in other major industries, including wholesale trade, transportation and warehousing, information, financial activities, leisure and hospitality, and government, showed little or no change.”(Tradingeconomics, 2017)
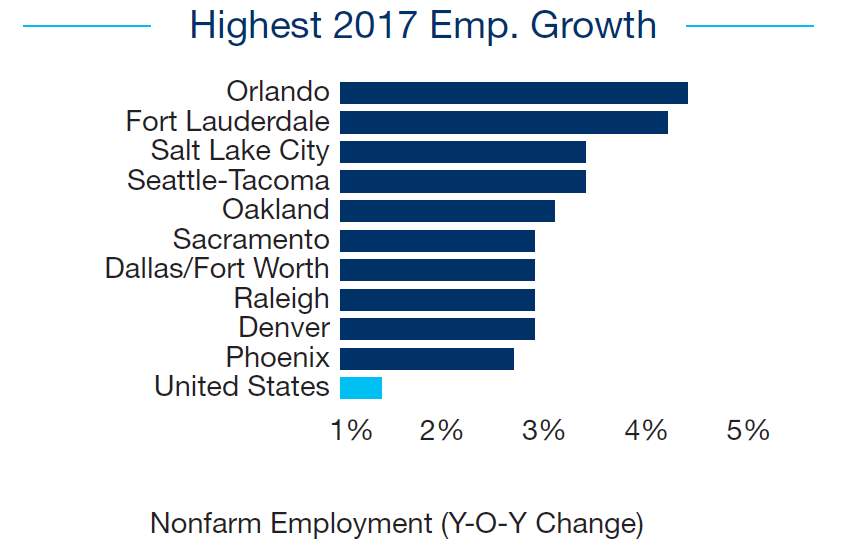
Figure 18 Highest Employment Growth (Source: Marcus & Millichap) |
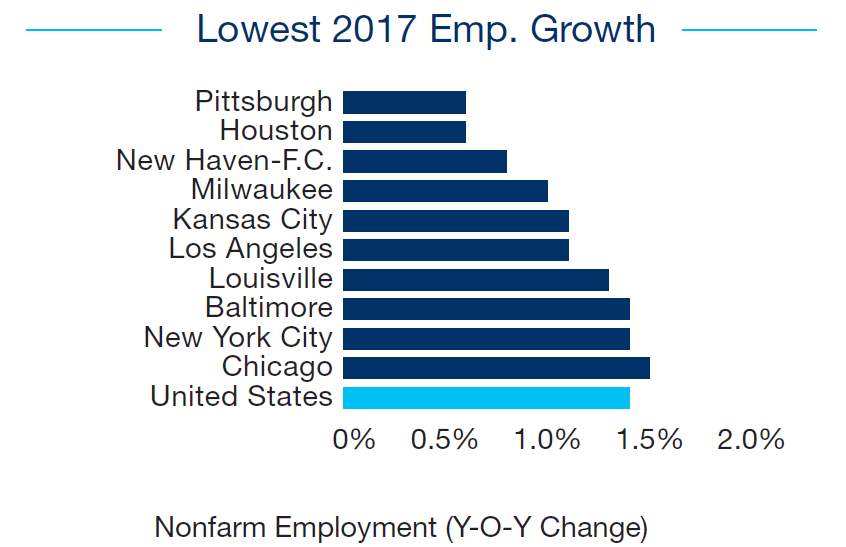
Figure 19 Lowest Employment Growth (Source: Marcus & Millichap) |
4. US Office Market Real Estate Outlook
The National Director of Office Research with Colliers International, Stephen Newbold, says “the US office market seems to be reaching equilibrium. While rents increased modestly in 2016, rent growth has slowed considerably and vacancies appear to be bottoming out.”
Net absorption also went down in 2016 as consolidation, downsizing and renewals became more prevalent. In spite of this, investors continue to have a strong appetite for office assets. Some investors are also becoming less risk-averse as they chase higher yields, with a focus on suburban assets. “In 2017, the expectation is that economic growth will provide a boost to the US office market, but overall, the market will move forward at a slower pace.” (Colliers Intl, 2016)
a. Key Observations
- Absorption drops but GDP Growth is expected to drive up demand: Net absorption fell in 2016 as tenants try to limit costs.
- “New leasing has been restricted by an increase in downsizing, consolidation and renewals as well as backfilling shadow space. Still, increased GDP growth in 2017 could help offset this trend.” (Colliers Intl, 2016)
- “Financial services and technology companies should continue to lead leasing activity. If enacted by the new administration, deregulation and business tax reductions may lead to higher demand.” (Colliers Intl, 2016)
- Vacancy leveling off and rent growth slowing down: At the peak of the prior cycle in 2007, the national office vacancy rate fell to a low of 12.2 percent. In 2016, the vacancy rate held at virtually the same level.
- Class A rents are are growing at a reduced pace, tenant incentive packages are increasing in some locations where vacant new supply is being added or occupiers are moving out.
- Most markets are still improving: Almost 75 percent of the metro office markets tracked saw an increase in asking rents and a fall in vacancy rates in 2016. Just over 60 percent experienced positive net absorption.
- “Market cores continue to shift: Suburban markets account for most current absorption, driven by large build-to-suit campuses and new urban environments that compete with traditional downtown locations. Office tenants are not abandoning downtowns but the desire to be located near highly-qualified, young professionals who prefer urban living must be balanced against the limited availability of large blocks of space.” (Colliers Intl, 2016)
- “Pre-leased space leads development activity: Construction activity remains elevated but most space under construction is pre-committed. The delivery pipeline is heavily front-loaded, so deliveries will likely ease by 2018.” (Colliers Intl, 2016)
- Speculative development is occurring in select pockets of downtown/urban fringe markets where there is a perceived shortage of modern, prime assets, and this may put pressure on rents.
- “Investors chase returns as yield gaps narrow: Investment in suburban assets in 2016 outpaced investment in downtown markets, accounting for 59 percent of the total sales volume. As yield gaps tighten due to rising inflation and increased finance costs, investors are selectively chasing higher yields. Additionally, several large suburban campuses were brought to market, boosting the suburban total.” (Colliers Intl, 2016)
- “Institutional and cross-border investors are still attracted to trophy central business district assets with high-credit, long-term income stream clients. Low domestic bond yields continue to drive cross-border purchases.” (Colliers Intl, 2016)
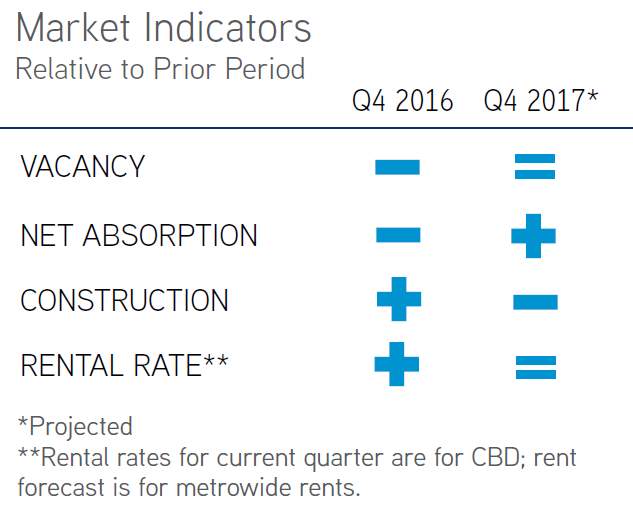 |
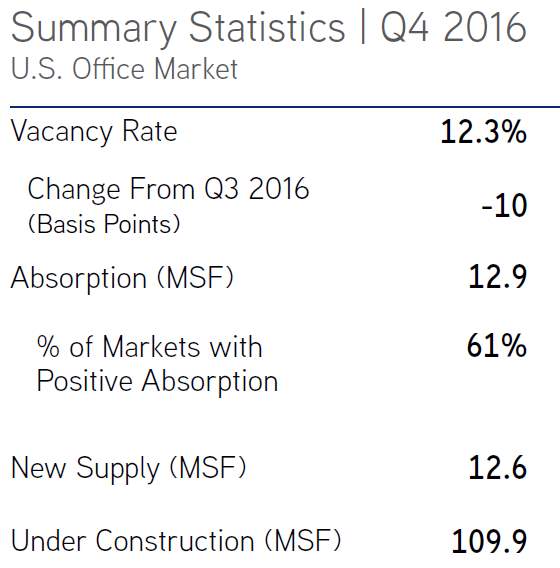
Figure 20 Summary Statistics US Office Market Q4 2016 (Source: Colliers Intl) |
 |
b. Economic Growth Impact to Office Asset Class
The US economy appears to be moving in the right direction. GDP growth that accelerated in the second half of the year to 2.7 percent, is further driving growth for the coming year. After creating approximately 2.2 million jobs in 2016, employers will make 2.0 million new hires in 2017. (Marcus & Millichap, 2017)
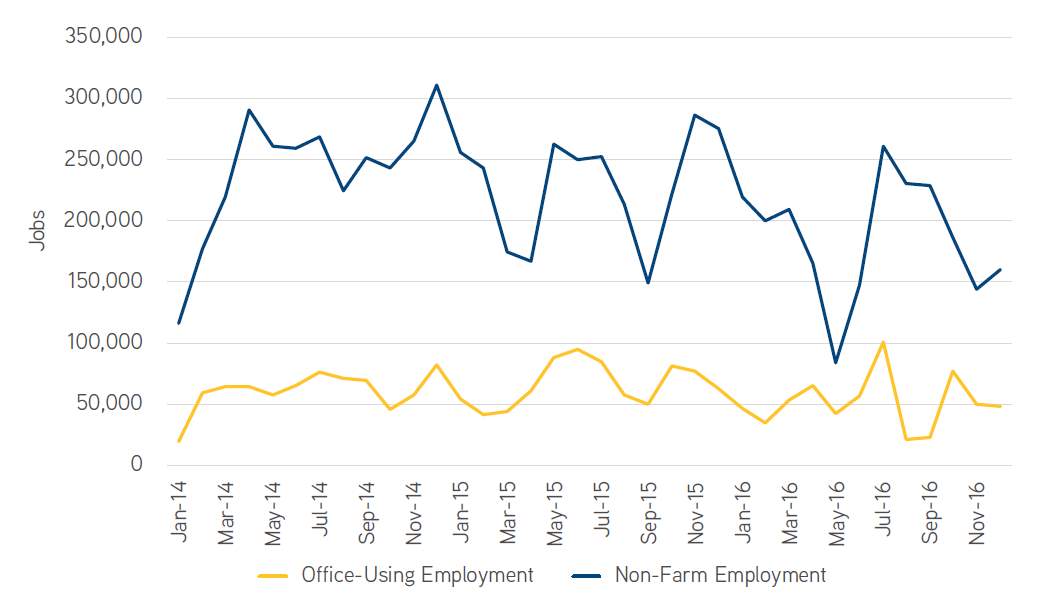
Figure 21 US Job Growth Trends 2 Month Moving Average (Source: Colliers Intl)
Job growth in the office-using sectors added 661,000 new office-using jobs added in 2016 — two-thirds of which were created in the second half of the year. (Colliers Intl, 2016)
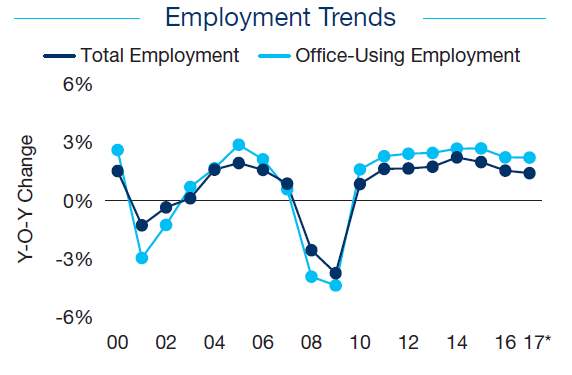
Figure 22 Office Market Employment Trend (Source: Marcus & Millichap)
c. Historical Events in the US Office Market Landscape
Before we examine current trends, is important that we take some time to look at some historical events that affected the US Office Market and which might shed some light as to why the market behaves way it does today.
In the 80s, significant increases in liquidity combined a lot of optimism on demand and rents led to significant office overbuilding, causing substantial vacancies (20 percent) in the early 1990s. It took ten years of economic expansion with relative little new office construction to decrease the national vacancy rate to around 10 percent – when today 5 percent is considered the “normal” rate.
Development started increasing when in 2001 recession (caused by the dot.com bubble and attacks of September 11, 2001) triggered employee layoffs and corporate cost cutting, leading to higher vacancies and lower rents. The short recession of 2001 was followed by the Great Recession, creating a financially frozen market (lack of debt and equity). Although the Great Recession ended in 2009 its effects remain into 2012, with vacancies around 13 percent while development continued to face challenges.
The lack of corporate reinvestment, slow job growth, tight capital, and lack of credit market liquidity marginalized real estate development. Regardless of project type, location, or leasing activity, construction loans remained difficult to obtain.
In 2007-2008, the preleasing requirement for office building was 40-50 percent; by the summer 2010, it increased to 75 percent, with an equity requirement of 20-30 percent and substantial guarantees. (Peiser, 240)
Several Factors caused the credit freeze in commercial lending from 2008 through 2010:
- Significant exposure of lenders to residential defaults/capital losses;
- A major shift of commercial bank asset portfolios to real estate (37 percent in 2007 compared to 25 percent before 2000);
- Poor due diligence and underwriting standards (investors and capital providers over relied on quality ratings by rating agencies, such as Moody’s rather than in-depth due diligence, leading to significant suppression of cap rates from 2000 to 2006;
- Lack of transparency in financial dealings and instruments; and
- Mismatch of duration between borrowing short and lending or investing long.
Two additional factors affected commercial property liquidity of suppliers, beyond bankers:
- Perception of risk after the bust of the housing bubble and the possibility of a commercial bubble due to the continued price increases; and
- International accounting standards (promoted by the Securities and Exchange Commission) requiring property owners/investors to identify the fair or true market value of their assets when computing their balance sheets.
Also, because of the Great Recession, several under-construction office projects required work-outs. The approach used in each work-out is different due to the parties involved, type of lender, problem, and reputation of the developer. Some insights are provided regarding some causes of project challenges during and after the Great Recession:
- Developers were not conservative, they became greedy, in part due to market liquidity.
- Developers were significantly overleveraged, assuming they would refinance with improved terms or sell the asset for profit when the loan was due.
- Developers underestimated budget expenses, which were not finalized before construction.
- Developers’ capital structure was problematic with significant debt, minimal equity, and not enough preleasing.
- Permits were not secured and/or were delayed by local municipalities, adding to costs.
5. US Office Market Trends
Growing space demand, declining vacancy and consistent rent growth provide opportunities for office property investors to enhance asset performance. “The decline in the US vacancy rate in 2016 marked the sixth consecutive annual decrease and highlighted emerging trends that could become more firmly embedded.” (Marcus & Millichap, 2017)
a. Demographics & Technology Trends
Changing demographics drive structural shift in office demand. As the
millennial generation reshapes the workforce, tenants will favor assets that stimulate community and teamwork. Popular amenities include a complete re-design of the typical office space, recreation spaces, on-site medical offices, restaurants, and childcare centers.
“A growing number of newly-formed millennial families will migrate to “urbanized” suburbs with walkability and proximity to city centers, making office assets in those types of location an attractive investment opportunity.” (Marcus & Millichap, 2017)
Technologies that facilitate remote working arrangements are becoming increasingly common while greater reliance on contract workers and smaller staffs of centralized fulltime employees have converged to reduce traditional worker space ratios. (Marcus & Millichap, 2017)
b. Absorption Trends: Suburbs vs. CBD
Per Colliers International, absorption is falling and vacancies are levelling off. National office absorption slowed in 2016 to 57.9 million square feet, a 40 percent reduction from the 2015 total. Suburban markets accounted for more than 80 percent of absorption in the second half of 2016. Ten suburban markets saw more than half a million square feet of absorption in Q4 2016, led by Los Angeles, Seattle and Dallas with totals exceeding 1 million square feet each.
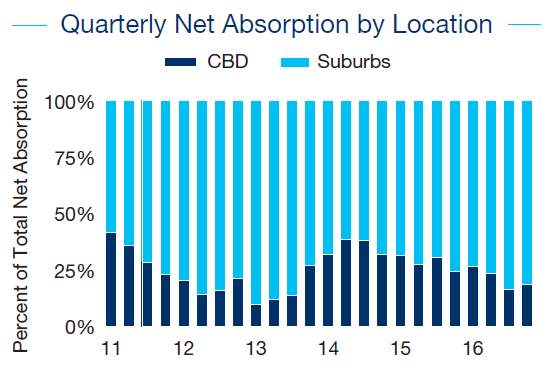
Figure 23 Quarterly Net Absorption CBD vs. Suburbs
(Source: Marcus & Millichap)
Marcus & Millichap estimates that “net absorption of approximately 83 million
square feet will generate a 20-basis-point decline in the US vacancy rate to 14.3 percent, marking the low point of the current cycle. The reduction in vacancy will spur an increase in the average asking rent of 3.5 percent in 2017.” (Marcus & Millichap, 2017)
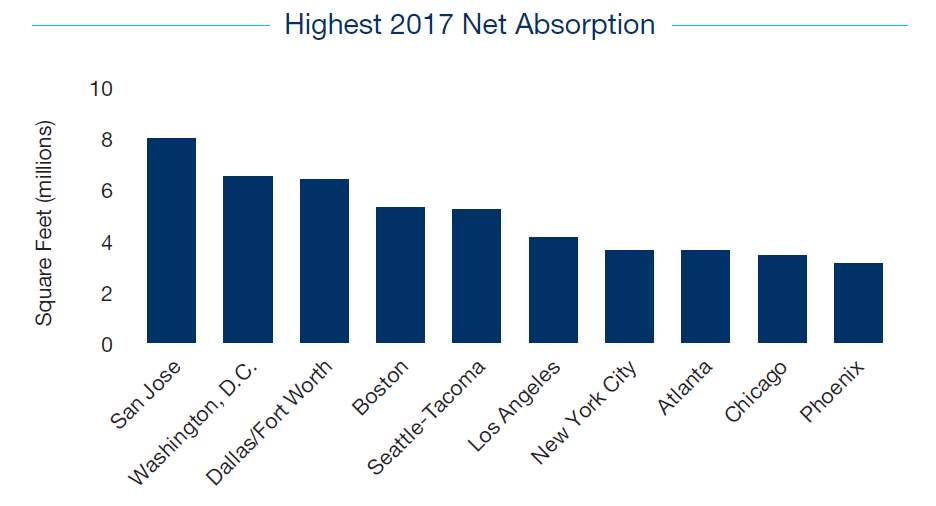
Figure 24 Office Markets with Highest Net Absorption (Source: Marcus & Millichap)
c. Relocate or Renew
A rising number of tenants are choosing to renew their existing leases rather than relocate, signaling a cautious mood. Four of the top five lease transactions in Manhattan in Q4 2016 were renewals. Renewals also led recent leasing activity in markets from Atlanta to Chicago to Miami. Cost control and more efficient space usage continue to factor into the decision-making process. Where moves are occurring, more tenants are reducing their footprints and consolidating into single buildings. (Colliers Intl, 2016)
d. Vacancy Trends
The US office vacancy rate fell slightly in Q4 2016 to 12.3 percent, but appears to be plateauing. Less than a third of US markets have a vacancy rate below 10 percent. A significant number of these markets — both primary and secondary — are those in which tech tenants are a major demand driver. Vacancy in downtown markets was relatively static over the past year with a 10-basis-point increase to 11.4 percent in Q4 2016. The suburban vacancy rate fell from 13.4 percent to 12.8 percent over the same period. (Colliers Intl, 2016)
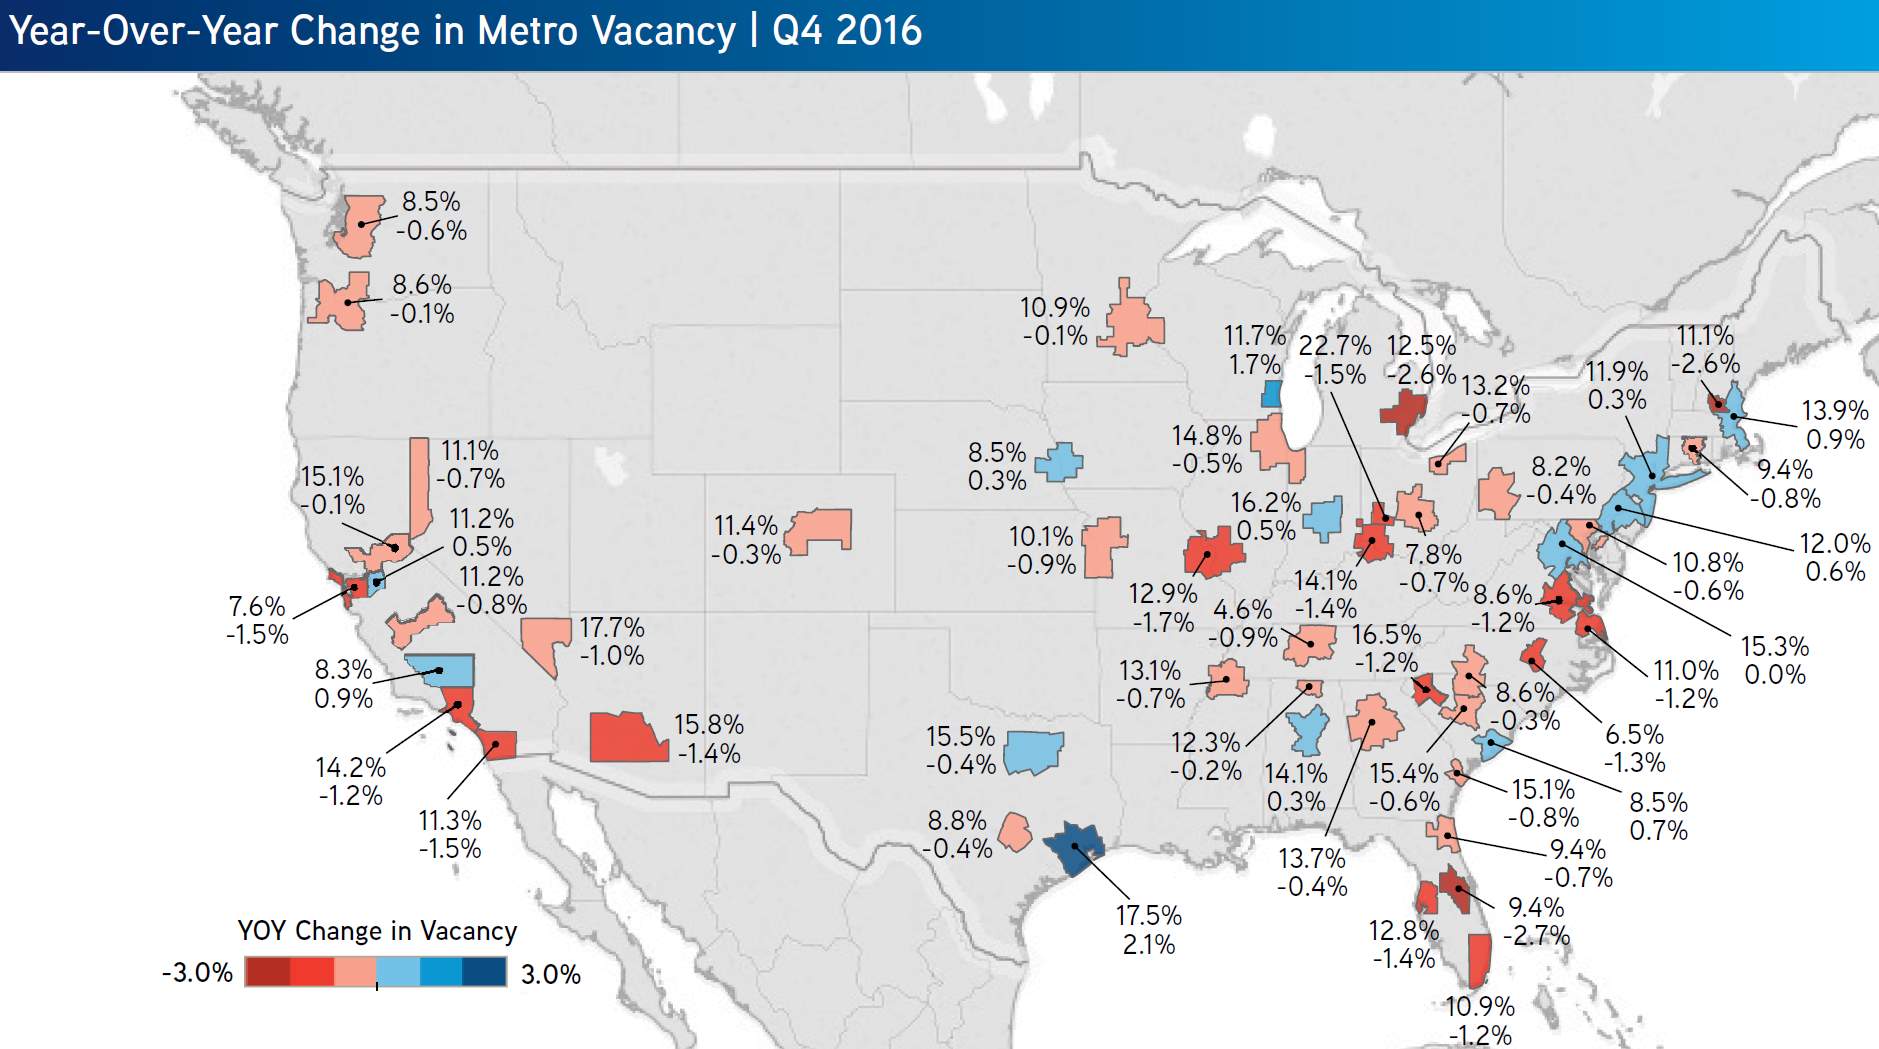
Figure 25 YoY Change in Metro Vacancy | Q4 2016 (Source: Colliers Intl)
Speculative or partially unleased new construction in some downtown markets — most notably San Francisco, Seattle and Washington, D.C. — could also strain occupancy levels in 2017. Nine speculative projects across these three markets — totaling 2.8 million square feet — are set to deliver this year and almost 60 percent of this space is available. (Colliers Intl, 2016)
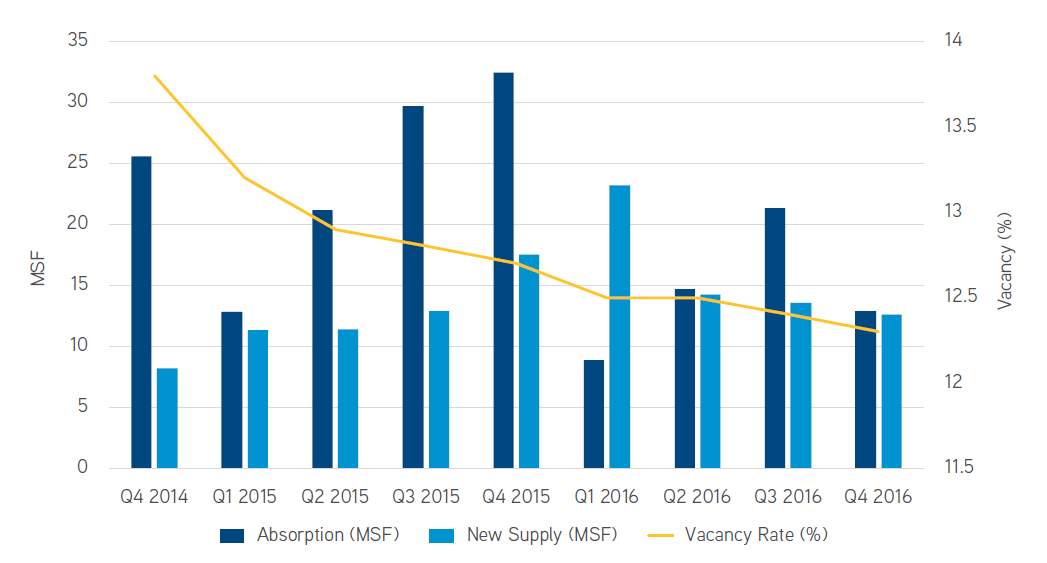
Figure 26 US Office Market: Absorption, Supply, Vacancy | Q4 2014 – Q4 2016 (Source: Colliers Intl)

Figure 27 Office Markets w/ Highest Vacancy Rates (Source: Marcus & Millichap) |
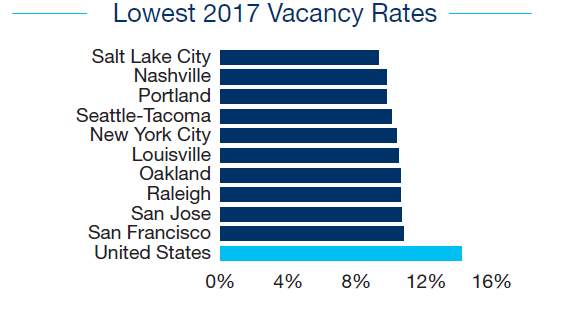
Figure 28 Office Markets w/ Lowest Vacancy Rates (Source: Marcus & Millichap) |
New supply will challenge CBD markets. Developers will complete 82 million square feet of space this year, exceeding the amount of new space delivered in 2016. New buildings in CBD locations, where space demand growth has eased recently, may face longer periods to stabilize. The share of demand growth in suburbia, however, is growing, a trend that will persist in 2017.
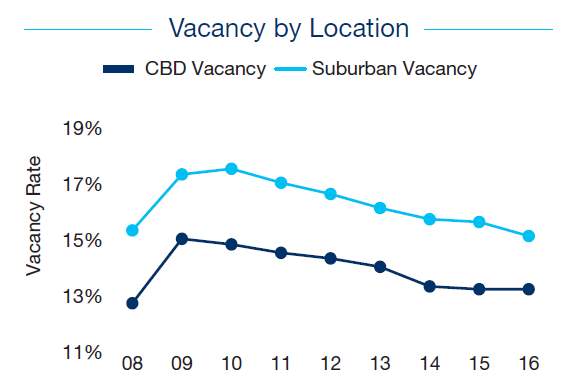
Figure 29 Vacancy CBD vs. Suburbs (Source: Marcus & Millichap)
e. Cap Rate
Private investors actively looking for places to invest. Capital flows to suburbs may accelerate. Transaction volume declined slightly last year, primarily reflecting fewer deals by REITs at higher price points. Private investors in the $1 million to $10 million price bracket dipped 3 percent compared to the preceding year’s trend.
Access to acquisition financing will sustain purchases in this segment of the market and offer additional opportunities to transact for owners seeking to monetize recent gains in property income.
Heading into 2017, both the average price per square foot and cap rates are on par with their 2007 peak, though vacancies have yet to reach previous lows. The recent rise in long-term interest rates may slow the compression of cap rates, potentially bringing additional investors into the market.
As suburban assets continue to contribute a greater share of net absorption and vacancy rates compress, a greater flow of capital to the suburbs could take place. (Marcus & Millichap, 2017)
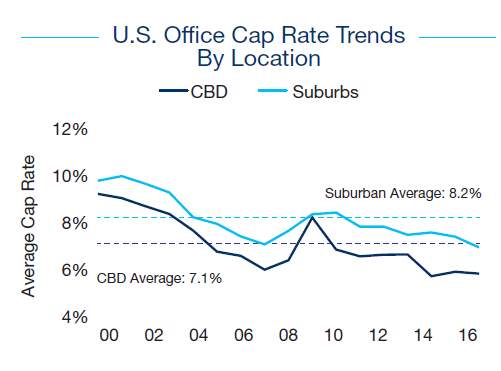
Figure 30 US Office Cap Rate CBD vs. Suburbs (Source: Colliers Intl)
f. Rent Rate Trends
Rents rose in 2016 but growth is set to slow down. Almost three-quarters of the metro markets that Colliers International tracks saw an increase in asking rents in 2016. Asking rents for all classes of office space across the US grew by 5.4 percent in 2016 to an average of $28.81 per square foot.
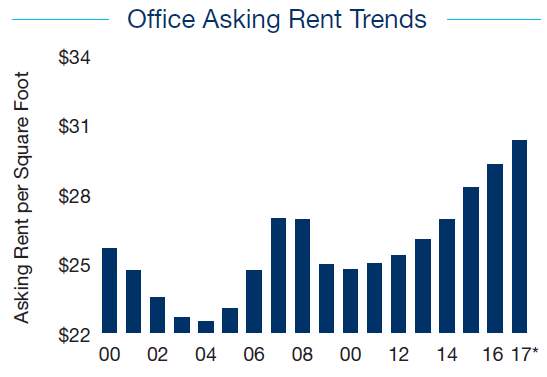
Figure 31 Office Asking Rent Trend (Source: Marcus & Millichap)
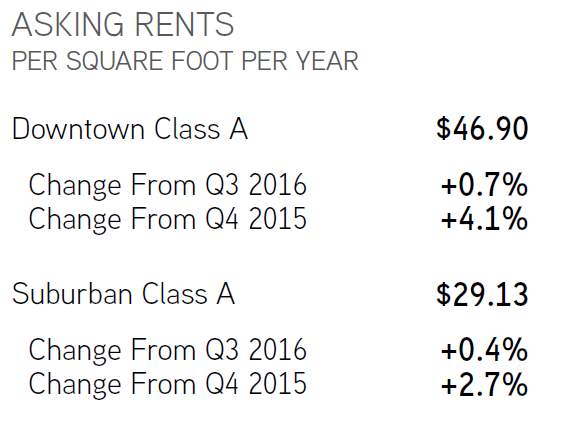
Average Class A asking rents closed out 2016 at $46.90 per square foot in downtown areas and $29.05 per square foot in the suburbs. Both figures represent annual gains, but the pace of rent appreciation has slowed. Class A downtown asking rents increased by 4.1 percent as of Q4 2016 compared to 2.7 percent in suburban markets — down from 12-month growth rates in Q3 2016 of 7.6 percent and 3.3 percent, respectively.
To achieve pro-forma rents, landlords and developers in some markets are resorting to significant incentives. Rent-free periods of up to 24 months and tenant incentive packages of $100 per square foot are being offered to achieve a 15-year term
in markets where there is an excess of new supply. (Colliers Intl, 2016)
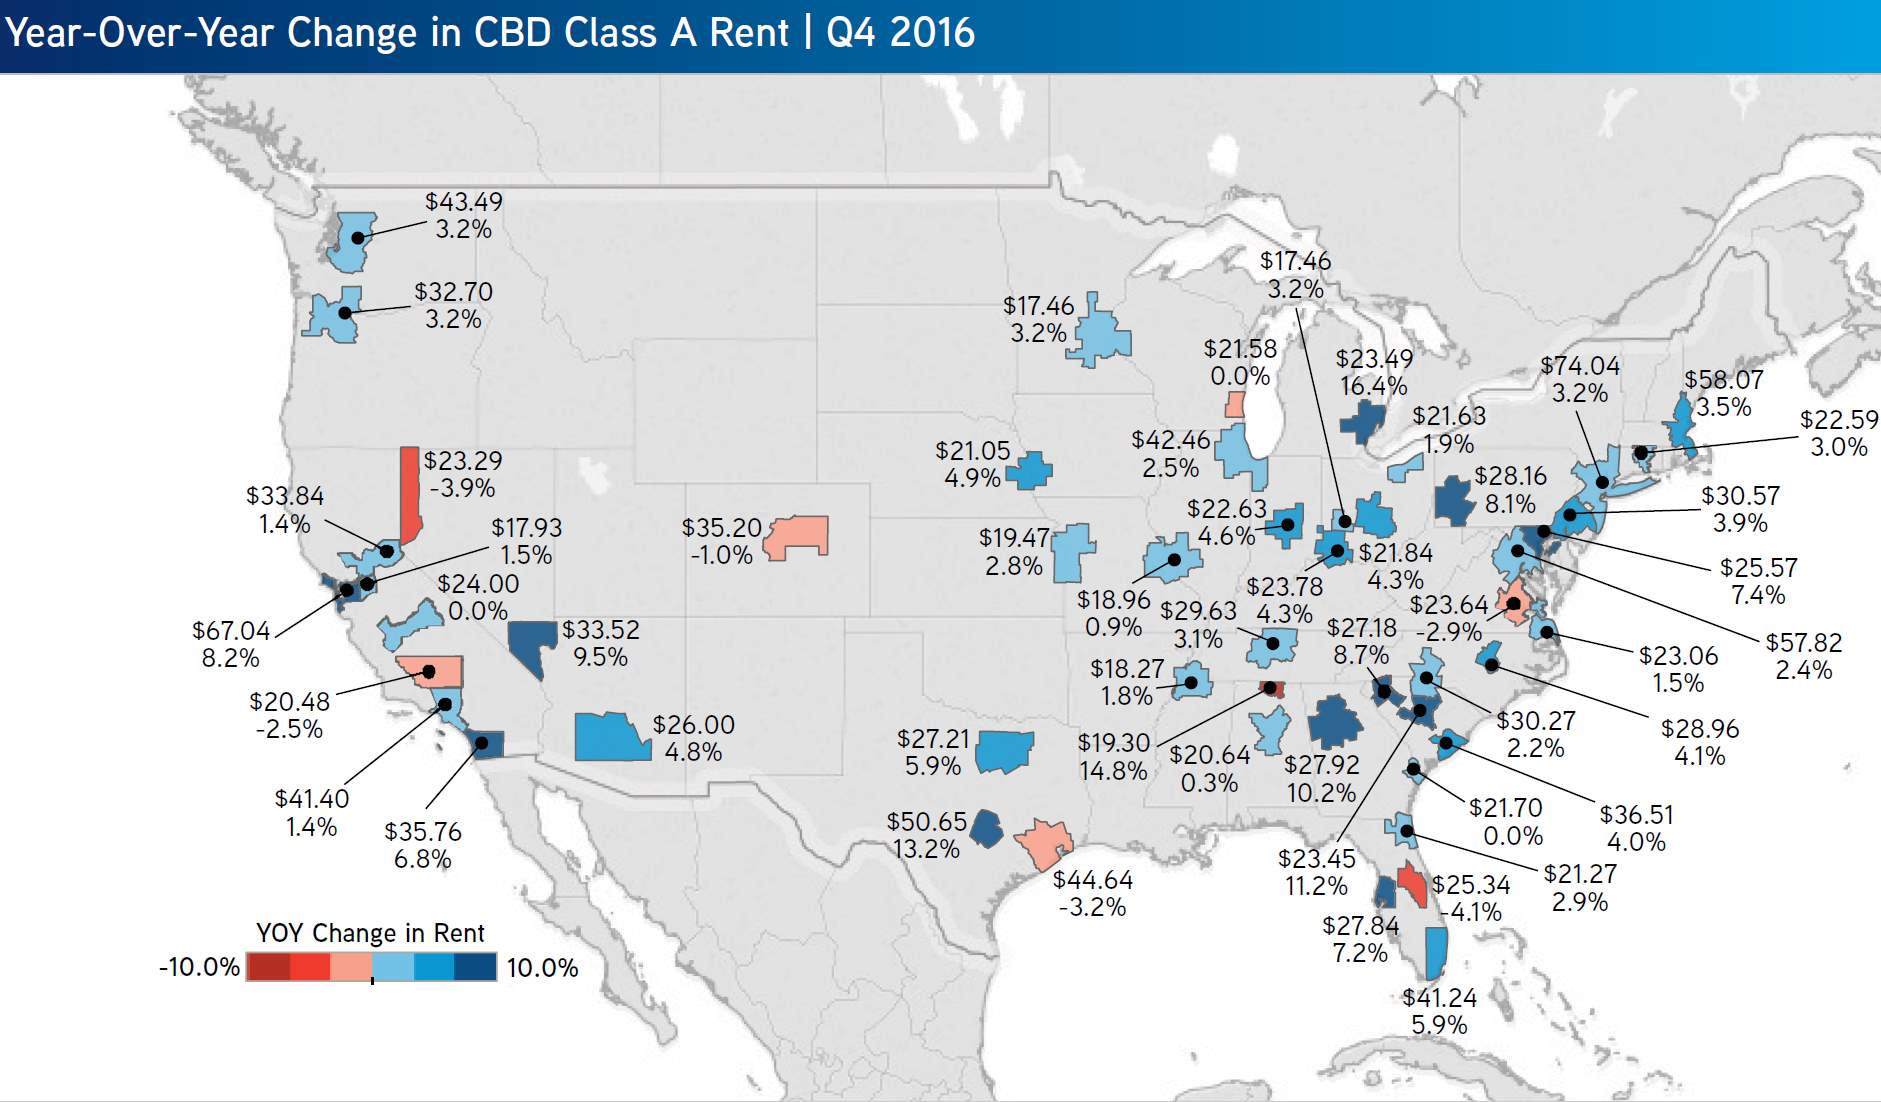
Figure 32 YoY Change in CBD Class A Rent Rate |Q4 2016 (Source: Colliers Intl)
In the suburban markets, the highest rents are concentrated in the west with the San Francisco Bay Area, San Diego, Seattle/Puget Sound and Greater Los Angeles occupying the top four slots. Six suburban markets achieved rent growth of 6 percent or higher over the past 12 months, led by Portland at 8.8 percent. Portland and Oakland are examples of markets that are profiting from lower cost bases. (Colliers Intl, 2016)
g. Office Construction Trends
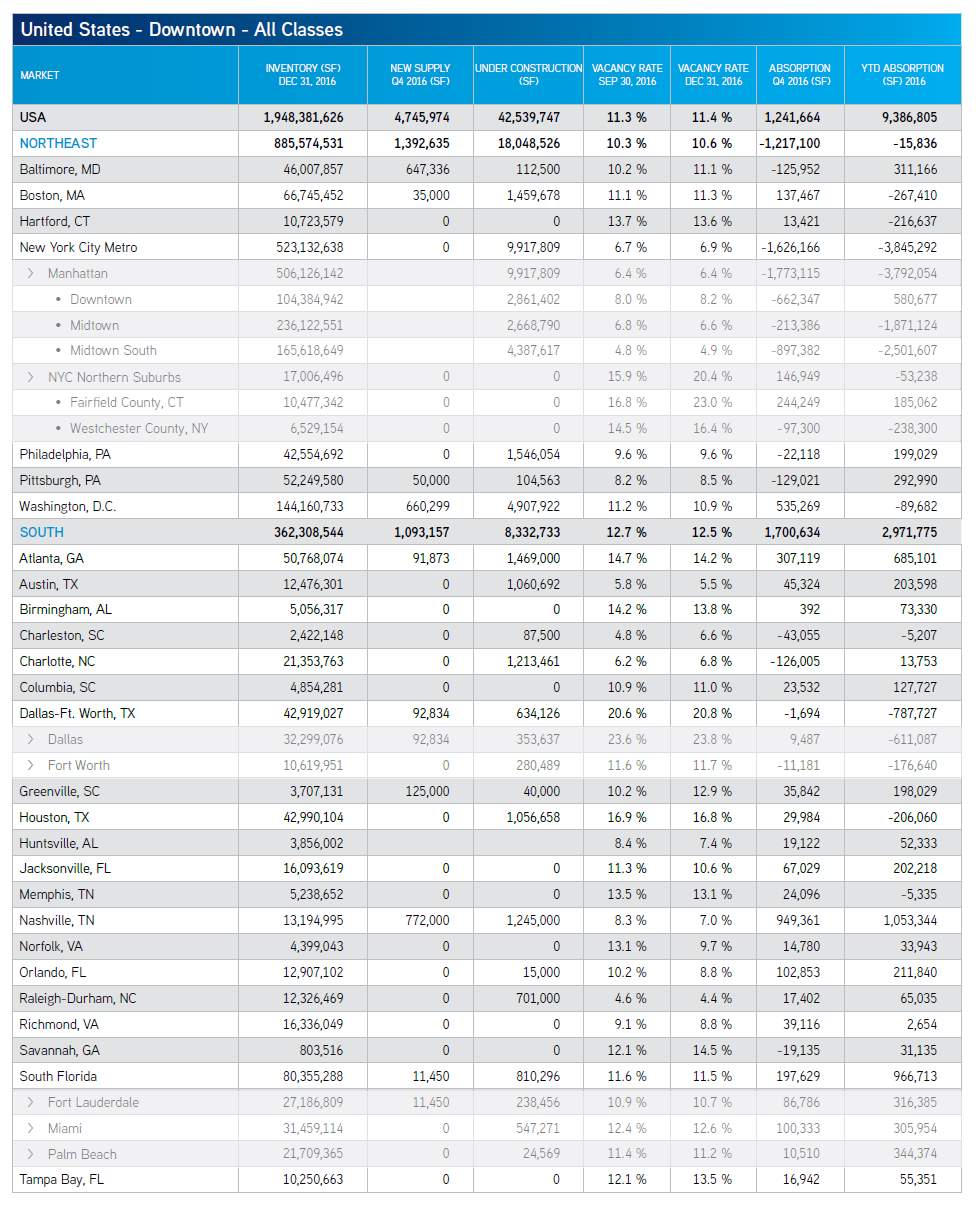
Construction volume is increasing but dominated by pre-leasing. The volume of office space under construction has risen to 110 million square feet, equivalent to 1.8 percent of the total US office inventory. Of this, 42.5 million square feet is underway in downtown markets and 67.5 million square feet is in the suburbs.
Four markets dominate the construction scene, accounting for almost half of the current activity: Dallas, Manhattan, the San Francisco Bay Area and Washington, D.C. The Bay Area leads with almost 16 million square feet underway, with the greatest volume in Silicon Valley. Dallas follows with 11 million square feet, while Manhattan and Washington, D.C. (including Northern Virginia and Maryland) are just below the 10-million-square-feet mark. (Colliers Intl, 2016)
Per Marcus & Millichap, “this year likely marks the high point in completions for the current cycle, as construction lenders maintain a conservative approach to underwriting office construction. Developers will complete 82 million square feet of space in 2017.?” (Marcus & Millichap, 2017)
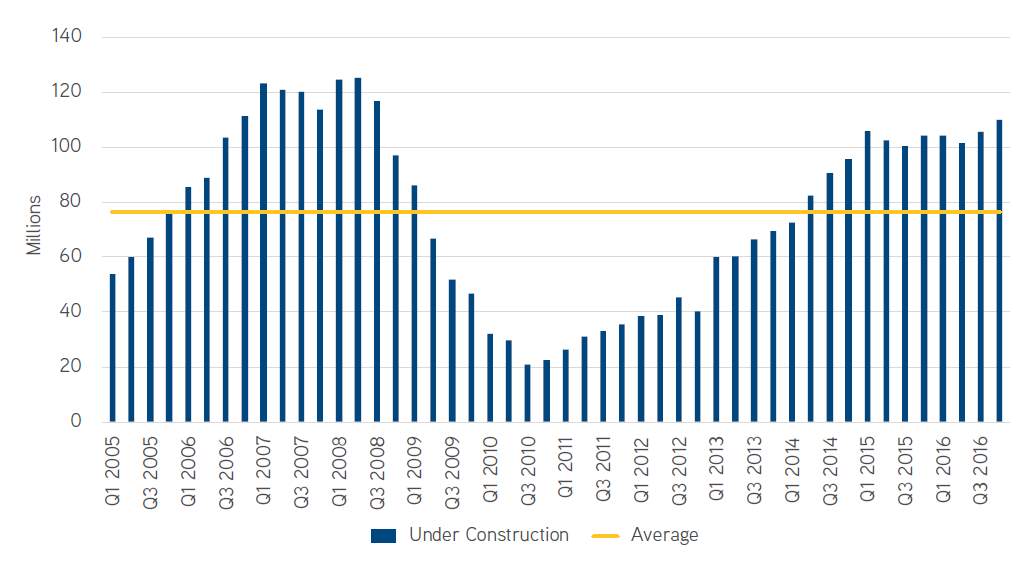
Figure 33 Quarterly Construction (Source: Colliers Intl)
Future deliveries are heavily front-loaded, with 68 percent of space underway set to deliver in 2017. In total, 62 percent of space underway is pre-leased, but more developers are now building speculative projects in select primary locations. For example, the nearly 1-million-square-foot 801 Broadway development in Los Angeles is 100 percent available and due to deliver in Q3 2017. By contrast, four office towers totaling 5.9 million square feet are being built in downtown Chicago and 70 percent is pre-leased — while there is no activity in the suburbs. (Colliers Intl, 2016)
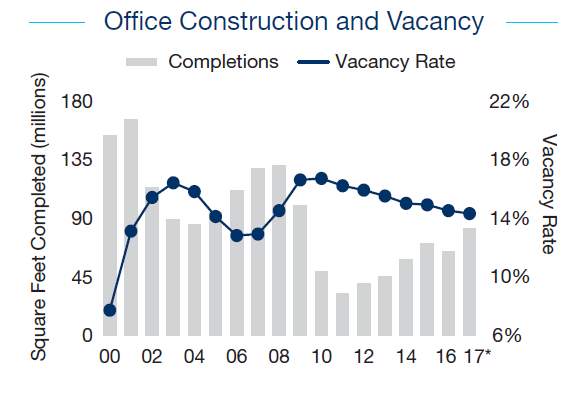
Figure 34 Office Construction vs. Vacancy 2017 (Source: Marcus & Millichap)
Per Marcus & Millichap, construction is modest by historical standards. Moderate construction continues to contribute to the performance of the office sector by diverting new space demand to existing properties. Property owners and investors rarely had to consider competition from new supply as a factor affecting asset performance throughout the current cycle, and supply pressures will only moderately intensify during 2017.
“Beyond 2017, construction will likely occur in select suburban locations with walkable central cores and access to major transportation routes and mass transit, factors that are becoming increasingly important to office tenants.” (Marcus & Millichap, 2017)
h. Investment Outlook
Current investor sentiment reflects a cautious outlook, as a widening bid-ask spread has slowed transaction speed. Highly amenitized CBD deals appear to generate less interest than in previous years, reflecting heavier construction volume in many downtowns and slowing CBD rent growth.
Heading into 2017, both the national average price per square foot and average cap rate are even with their 2007 benchmark, though vacancies have yet to reach previous lows. Pricing disparities persist. While downtown prices are 59 percent above the downturn trough, suburban prices have risen 35 percent.” (Marcus & Millichap, 2017)
Liquidity is good, but debt sources exercise caution. “Lenders continue to target urban properties with secure tenancies. Properties in the suburbs may be subject to tighter scrutiny and more conservative loan underwriting, but assets with solid long-term tenants and on-site amenities are favorable.” (Marcus & Millichap, 2017)
i. Capital Markets
Borrowers seek clarity on long-term interest rates. Low interest rates and competitive lenders propelled the debt markets throughout most of 2016, but several trends at the end of the year emerged that will affect capital markets in 2017.
The sharp rise in the yield on the 10-year US Treasury following the election prompted many borrowers to reassess pricing and potential returns. If the climb in the 10-year Treasury continues, it could pressure cap rates to go up, which may force a longer period of price discovery as expectations are realigned.
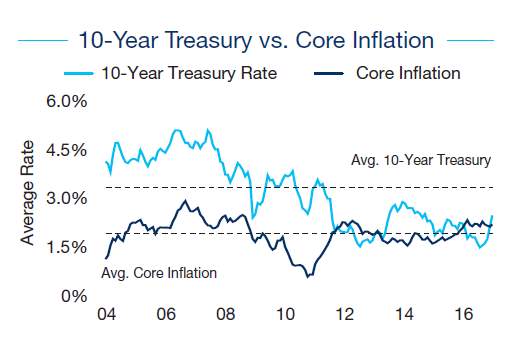
Figure 35 10 Year Treasure vs. Core Inflation (Source: Marcus & Millichap) |
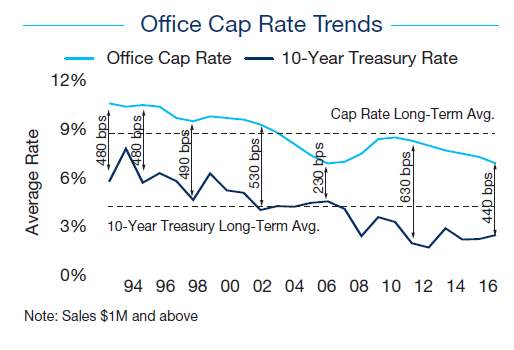
Figure 36 Cap Rate Vs. 10 Year Treasure (Source: Marcus & Millichap) |
Whether refinancing or providing acquisition debt, lenders will likely resist overextending leverage and will employ debt coverage ratios of around 1.35X. Urban properties with secure tenancies remain in favor, and debt providers will increasingly follow investors seeking higher yields to the suburbs. “Properties in the suburbs may be subject to tighter scrutiny and more conservative loan underwriting, but assets with solid long-term tenant rosters and that are close to amenities will likely be viewed favorably.” (Marcus & Millichap, 2017)
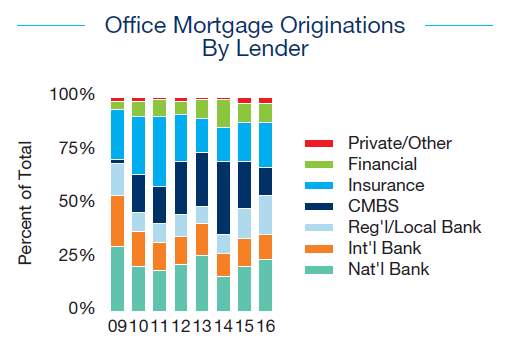
Figure 37 Office Mortgage Originators (Source: Marcus & Millichap) |
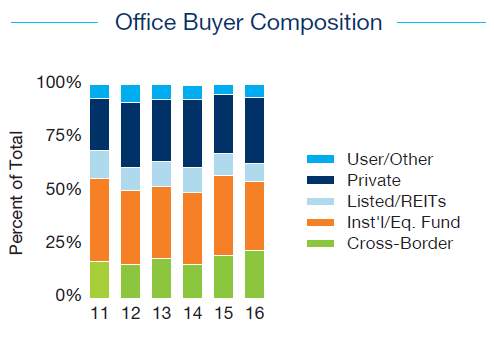
Figure 38 Office Buyer Composition (Source: Marcus & Millichap) |
Disciplined lending practices persist. Acquisition debt remained plentiful
throughout 2016, but borrowers’ rates rose late in the year in conjunction with higher Treasury yields. Loan-to-value ratios compressed slightly, with 65 percent leverage marking the upper limit for office property loans. The combination of higher rates and tighter lender underwriting created some investor caution that slowed deal from happening in late 2016, a trend that will likely carry over into early 2017. A potential easing of Dodd-Frank regulations on financial institutions, though, could create additional lending capacity for other capital sources, and higher interest rates may also encourage additional lenders to participate this year. (Marcus & Millichap, 2017)
j. Cross Border Investment
While institutional and private investors remain the most active buyers, accounting for 31 percent and 36 percent of 2016 office sales volume respectively, acquisitions by cross-border investors continue to rise. Cross-border investment totaled $29.8 billion in 2016 with EMEA-based buyers representing half of that sum and 40 percent from Asia Pacific sources. The three most active countries in 2016 in terms of US office investment were China, Germany and Canada. (Colliers Intl, 2016)
Although traditionally institutional foreign capital has favored primary market CBD deals, some foreign investors are increasingly looking toward suburban properties in secondary markets to satisfy investment growth needs. The increase in suburban property income growth should invigorate this trend. (Marcus & Millichap, 2017)
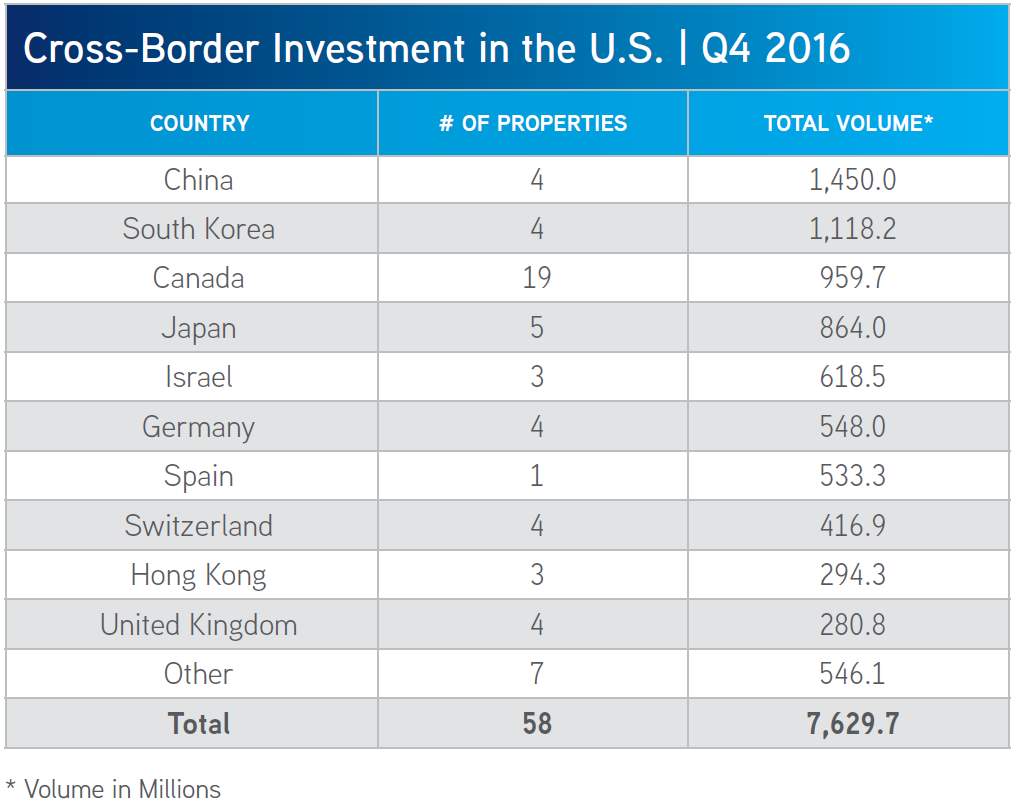
Figure 39 Cross-Border Investments
(Source: Colliers Intl | REI Analytics)
k. High Yield Markets
Investors are seeking high yield by actively pursuing office assets in secondary and tertiary markets as competitive bidding keeps cap rates compressed in many of the nation’s premier metro areas. Improving fundamentals in many of these markets will offer opportunities for net operating income (NOI) improvements. When considering investing in higher-yielding properties, buyers must consider their timing and exit strategies as market liquidity may not align with investment horizons. (Marcus & Millichap, 2017)
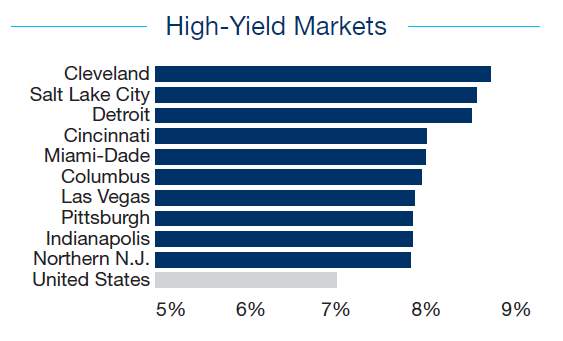
Figure 40 High-Yield Office Markets Rank 2017 (Source: Marcus & Millichap)
As benchmark rates have risen, investors are looking for opportunities to preserve spreads. The higher cap rates in secondary and tertiary markets have enticed a growing number of investors. The cap rate spread between primary and tertiary markets stands at 80 basis points, down 30 basis points from 2015, and reflects the shift in momentum from classic trophy assets in primary CBDs.
The Midwest markets of Cleveland, Detroit, Cincinnati, Columbus and Indianapolis dominate this year’s list of high-yielding markets. In this business cycle,
these metros have had limited construction pipelines, providing value-add opportunities in older Class B/C properties. As construction moderates in the majority of these cities, healthy levels of absorption will place pressure to lower vacancy rates in 2017, generating additional buyer attention.
Asking rents in Miami-Dade, Northern New Jersey and Columbus are each expected to rise at or above 5 percent this year. Many investors will be motivated by growing cash flows to inject capital into office assets. Though Miami is considered a primary market, it ranks in the top ten of the High-Yield Index as its Class A institutional assets seldom trade, causing the high volume of Class B/C properties to skew their average yield.
Investors seeking low-entry costs with potential for high first-year returns target Detroit and Cleveland as each have a three-year average price per square
foot at or under $100. (Marcus & Millichap, 2017)
l. Inventory Demand Trends
Metros with the largest vacancy improvement combined with slower inventory
growth as a percentage of total office space in 2017 rank at the top of the Marcus Millichap’s Improving Occupancy Index. The lack of new office space in these metros will restrict companies in expansion mode to leasing existing space, further tightening vacancies. The markets in the Index vary as to their placement in the real estate cycle. In later-recovering metros, still-high vacancy has not yet warranted new development, while employment gains in others place absorption ahead of the construction pipeline. Investors seeking properties in metros where the threat of new competition is lowest this year will likely find opportunities in these markets but need to remain mindful of longer-term construction pipelines. For a complete list of metros with breakdown of inventory, vacancy rate, CAP rate and refer to Annex 1 on the last few pages of this document.
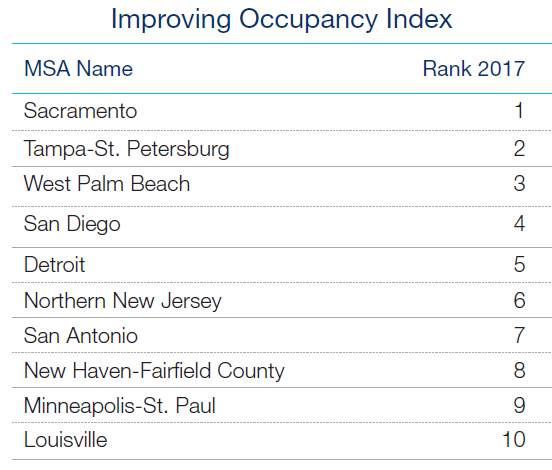
Figure 41 Office Markets Highest Rank in Occupancy 2017 (Source: Marcus & Millichap) |
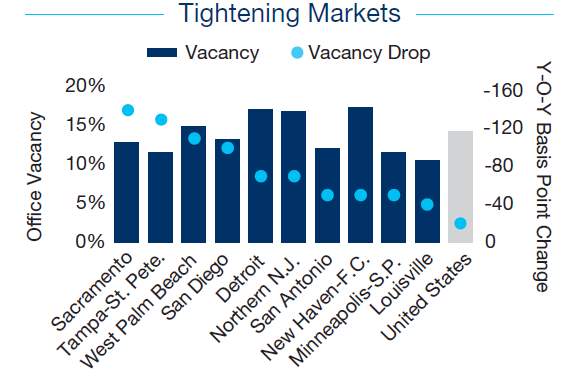
Figure 42 Office Markets w/ Highest Vacancy Point Drop (Source: Marcus & Millichap) |
Steady job gains have boosted office space demand in Sacramento, Tampa-
St. Petersburg and San Diego. The increased need for space and low inventory growth will tighten vacancy in existing buildings. These factors will combine to push rents higher this year.
In the later-recovery markets of Detroit, Northern New Jersey and New Haven-
Fairfield County, vacancy remains above the national average, restraining
inventory expansion. The renovation and repurposing of vacant buildings
in these metros contribute to improving market conditions.
After corporate expansions prompted a wave of office development in prior
years, construction activity in Minneapolis-St. Paul and San Antonio will plummet
in 2017, lowering vacancy further. Tightening rates amongst office-using job
growth could prompt some projects in the pipeline to move forward. (Marcus & Millichap, 2017)
m. Rent and NOI Growth
Investors are searching for cash flow as heavy cap rate compression in other property types and low-yield government debt limit the landscape of investment alternatives. The Metro areas below highlights markets that have a strong office-using employment outlook and outsize NOI growth potential.
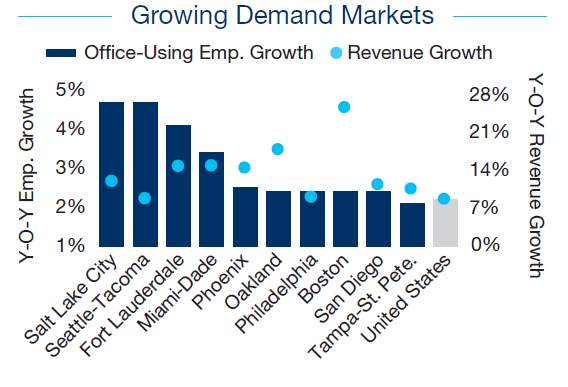
Figure 43 Growing Demand Market (Source: Marcus & Millichap) |
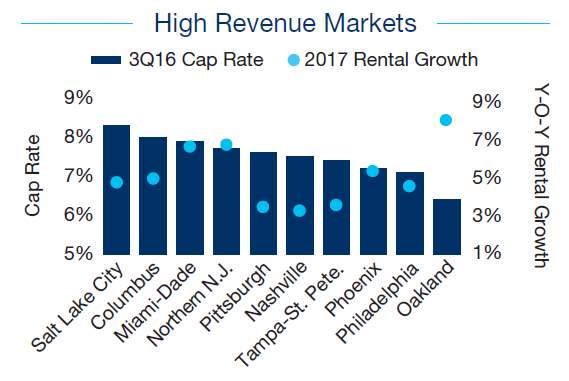
Figure 44 Highest Revenue Markets (Source: Marcus & Millichap) |
These metros offer investors a rising revenue climate while mitigating the exposure to risk. Vacancy is on a sharp decline in many featured markets, allowing investors opportunities to re-position underperforming assets and maximize cash flow.
- Tech hubs dominate the ranking as expansions from IT-related firms sustain space demand. Salt Lake City, Seattle-Tacoma and Oakland all feature startup cultures as well as established corporate tech centers. Investors may turn to these tech destinations for security and NOI growth potential.
- The Florida markets are well represented as ongoing economic prosperity drives office demand. Office-using employment growth in Fort Lauderdale and
Miami-Dade is among the highest in the country.
- The northeastern metros of Philadelphia and Boston fill the seventh and eighth
spots on the Marcus & Millichap’s Secured Growth Index. These areas have a well-established office market with key drivers of space demand. Biomedical and healthcare companies are highly active in both markets, acting as a stabilizing force for office demand.
n. Top US Office Deals Q4, 2016
2016 deal volume was flat year-over-year in the suburbs while falling by 13 percent in CBD markets. Transaction activity in the suburbs reached $83.3 billion in 2016, compared with $58.3 billion in CBD markets. Investors willing to take on some risk are being enticed by the 130-basis-point yield gap between suburban and CBD assets. (Colliers Intl, 2016)
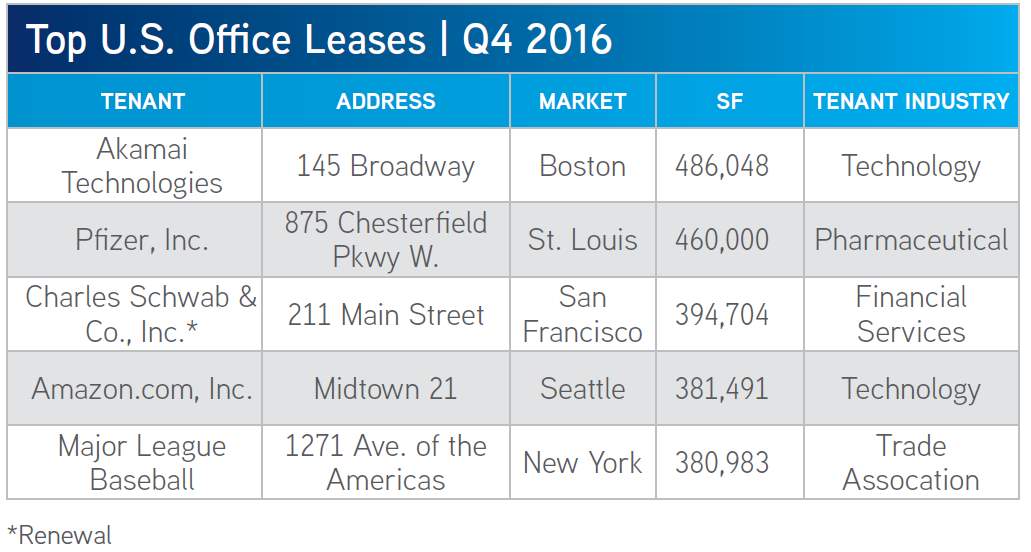
Figure 45 Top US Leases | Q4 2016 (Source: Colliers Intl | CoStar) |
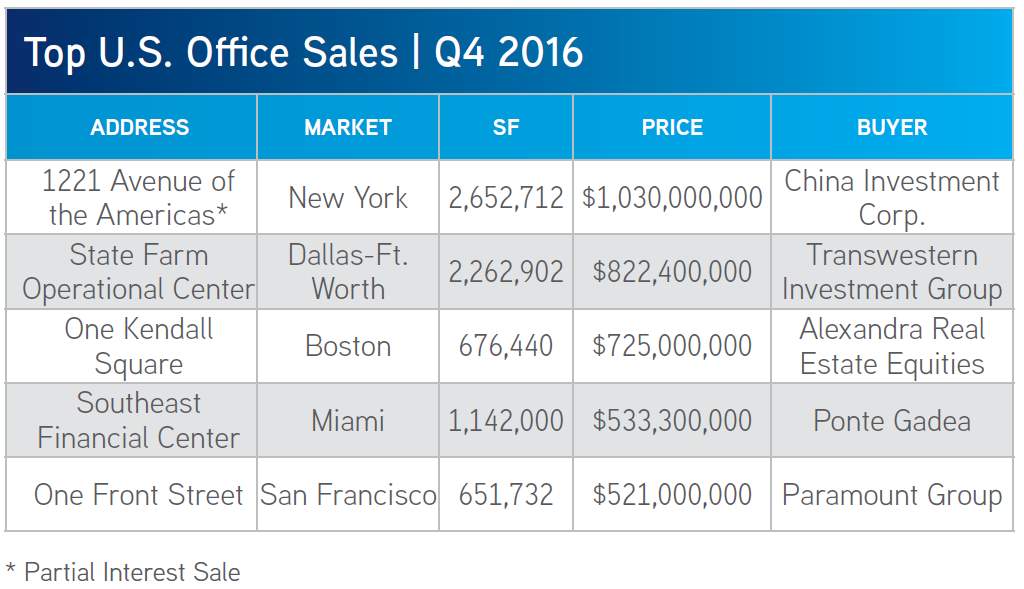
Figure 46 Top US Sales| Q4 2016 (Source: Colliers Intl | CoStar) |
6. South Florida Office Market Trends
In analyzing the South Florida Office Market, CoStar was used as the primary source of market analytics due to its high acceptance within the Commercial Real Estate Brokerage community.
The South Florida Office market ended the fourth quarter 2016 with a vacancy rate of 10.0 percent. The vacancy rate was down over the previous quarter, with net absorption totaling positive 673,514 square feet in the fourth quarter. Vacant sublease space increased in the quarter, ending the quarter at 587,195 square feet. Rental rates ended the fourth quarter at $29.68, an increase over the previous quarter.” (CoStar, n.d.)
A total of four buildings delivered to the market in the quarter totaling 91,450 square feet, with 2,760,943 square feet still under construction at the end of the quarter. (CoStar, n.d.)
a. Absorption Trends: Suburbs vs. CBD
Net absorption for the overall South Florida office market was positive 673,514 square feet in the fourth quarter 2016. That compares to positive 996,891 square feet in the third quarter 2016, positive 984,144 square feet in the second quarter 2016, and positive 316,959 square feet in the first quarter 2016.
Net absorption for South Florida’s central business district was positive 126,335 square feet in the fourth quarter 2016. That compares to positive 38,632 square feet in the third quarter 2016, positive 74,864 in the second quarter 2016, and negative (85,316) in the first quarter 2016.
Net absorption for the suburban markets was positive 547,179 square feet in the fourth quarter 2016. That compares to positive 958,259 square feet in third quarter 2016, positive 909,280 in the second quarter 2016, and positive 402,275 in the first quarter 2016. (CoStar, n.d.)
b. Absorption Trends: By Building Class
The Class-A office market recorded net absorption of positive 167,521 square feet in the fourth quarter 2016, compared to positive 391,511 square feet in the third quarter 2016, positive 77,084 in the second quarter 2016, and positive 257,279 in the first quarter 2016.
The Class-B office market recorded net absorption of positive 301,310 square feet in the fourth quarter 2016, compared to positive 448,681 square feet in the third quarter 2016, positive 545,647 in the second quarter 2016, and positive 163,431 in the first quarter 2016.
The Class-C office market recorded net absorption of positive 204,683 square feet in the fourth quarter 2016 compared to positive 156,699 square feet in the third quarter 2016, positive 361,413 in the second quarter 2016, and negative (103,751) in the first quarter 2016. (CoStar, n.d.)
c. Vacancy Trends
The office vacancy rate in the South Florida market area decreased to 10.0 percent at the end of the fourth quarter 2016. The vacancy rate was 10.3 percent at the end of the third quarter 2016, 10.8 percent at the end of the second quarter 2016, and 11.1 percent at the end of the first quarter 2016. (CoStar, n.d.)
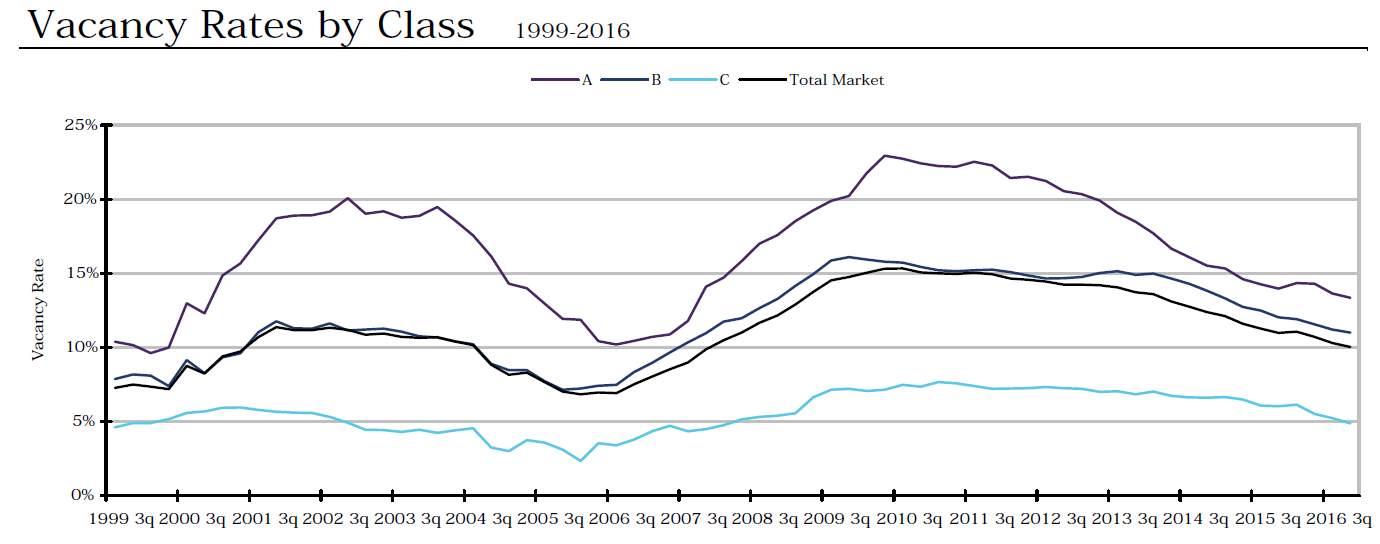
Figure 47 South Florida Vacancy Rates by Class (Source: CoStar)
Class-A projects reported a vacancy rate of 13.4 percent at the end of the fourth quarter 2016, 13.6 percent at the end of the third quarter 2016, 14.3 percent at the end of the second quarter 2016, and 14.3 percent at the end of the first quarter 2016.
Class-B projects reported a vacancy rate of 11.0 percent at the end of the fourth quarter 2016, 11.2 percent at the end of the third quarter 2016, 11.6 percent at the end of the second quarter 2016, and 11.9 percent at the end of the first quarter 2016.
Class-C projects reported a vacancy rate of 4.9 percent at the end of the fourth quarter 2016, 5.2 percent at the end of third quarter 2016, 5.5 percent at the end of the second quarter 2016, and 6.1 percent at the end of the first quarter 2016.
The overall vacancy rate in South Florida’s central business district at the end of the fourth quarter 2016 decreased to 13.0 percent. The vacancy rate was 13.3 percent at the end of the third quarter 2016, 13.3 percent at the end of the second quarter 2016, and
13.5 percent at the end of the first quarter 2016.
The vacancy rate in the suburban markets decreased to 9.4 percent in the fourth quarter 2016. The vacancy rate was 9.7 percent at the end of the third quarter 2016, 10.2 percent at the end of the second quarter 2016, and 10.6 percent at the end of the first quarter 2016. (CoStar, n.d.)
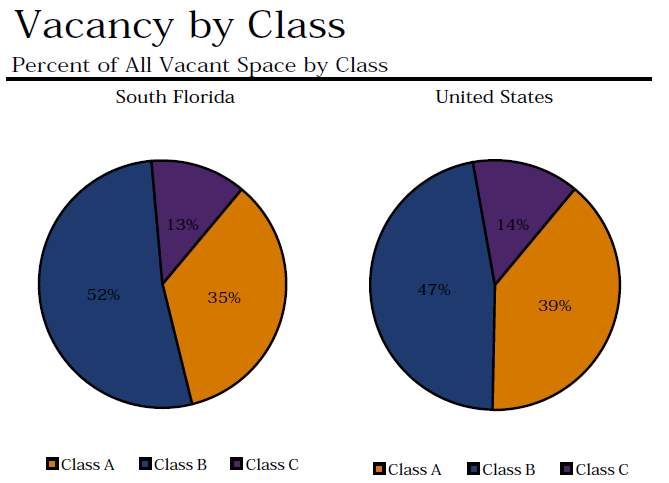
Figure 48 South Florida vs. US Vacancy by Class (Source: CoStar)
d. Rental Rate Trends
“The average quoted asking rental rate for available office space, all classes, was $29.68 per square foot per year at the end of the fourth quarter 2016 in the South Florida market area. This represented a 1.6 percent increase in quoted rental rates from the end of the third quarter 2016, when rents were reported at $29.21 per square foot.” (CoStar, n.d.)
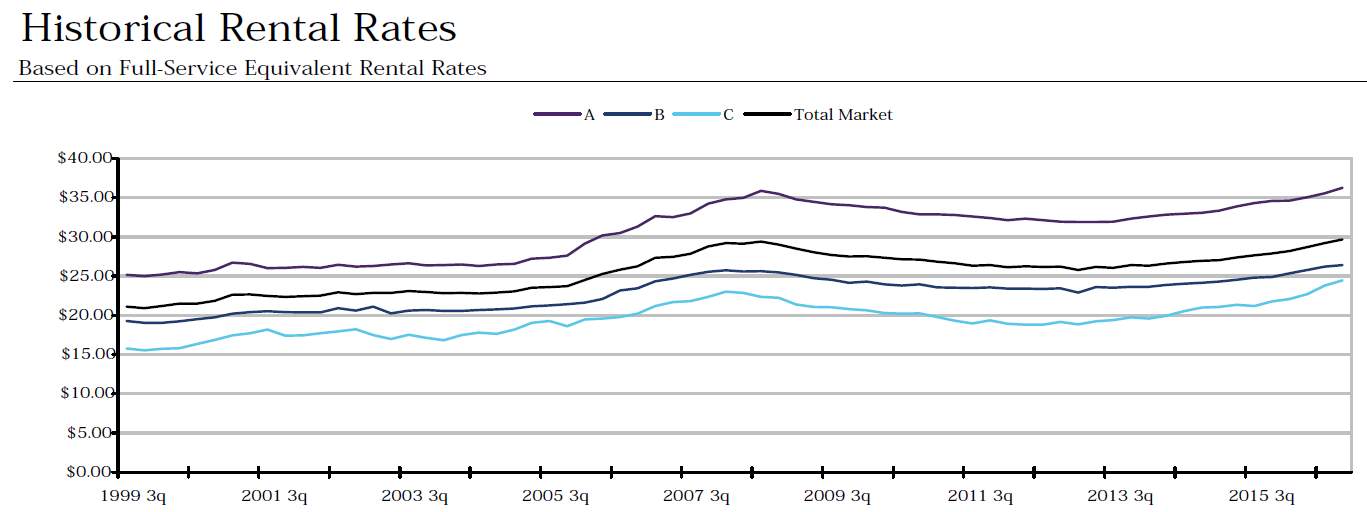
Figure 49 South Florida Office Market Historical Rental Rates (Source: CoStar)
The average quoted rate within the Class-A sector was $36.28 at the end of the fourth quarter 2016, while Class-B rates stood at $26.42, and Class-C rates at $24.44. At the end of the third quarter 2016, Class-A rates were $35.55 per square foot, Class-B rates were $26.21, and Class-C rates were $23.81.
The average quoted asking rental rate in South Florida’s CBD was $36.84 at the end of the fourth quarter 2016, and $27.72 in the suburban markets. In the third quarter 2016, quoted rates were $36.30 in the CBD and $27.42 in the suburbs. (CoStar, n.d.)
e. Office Construction Trends
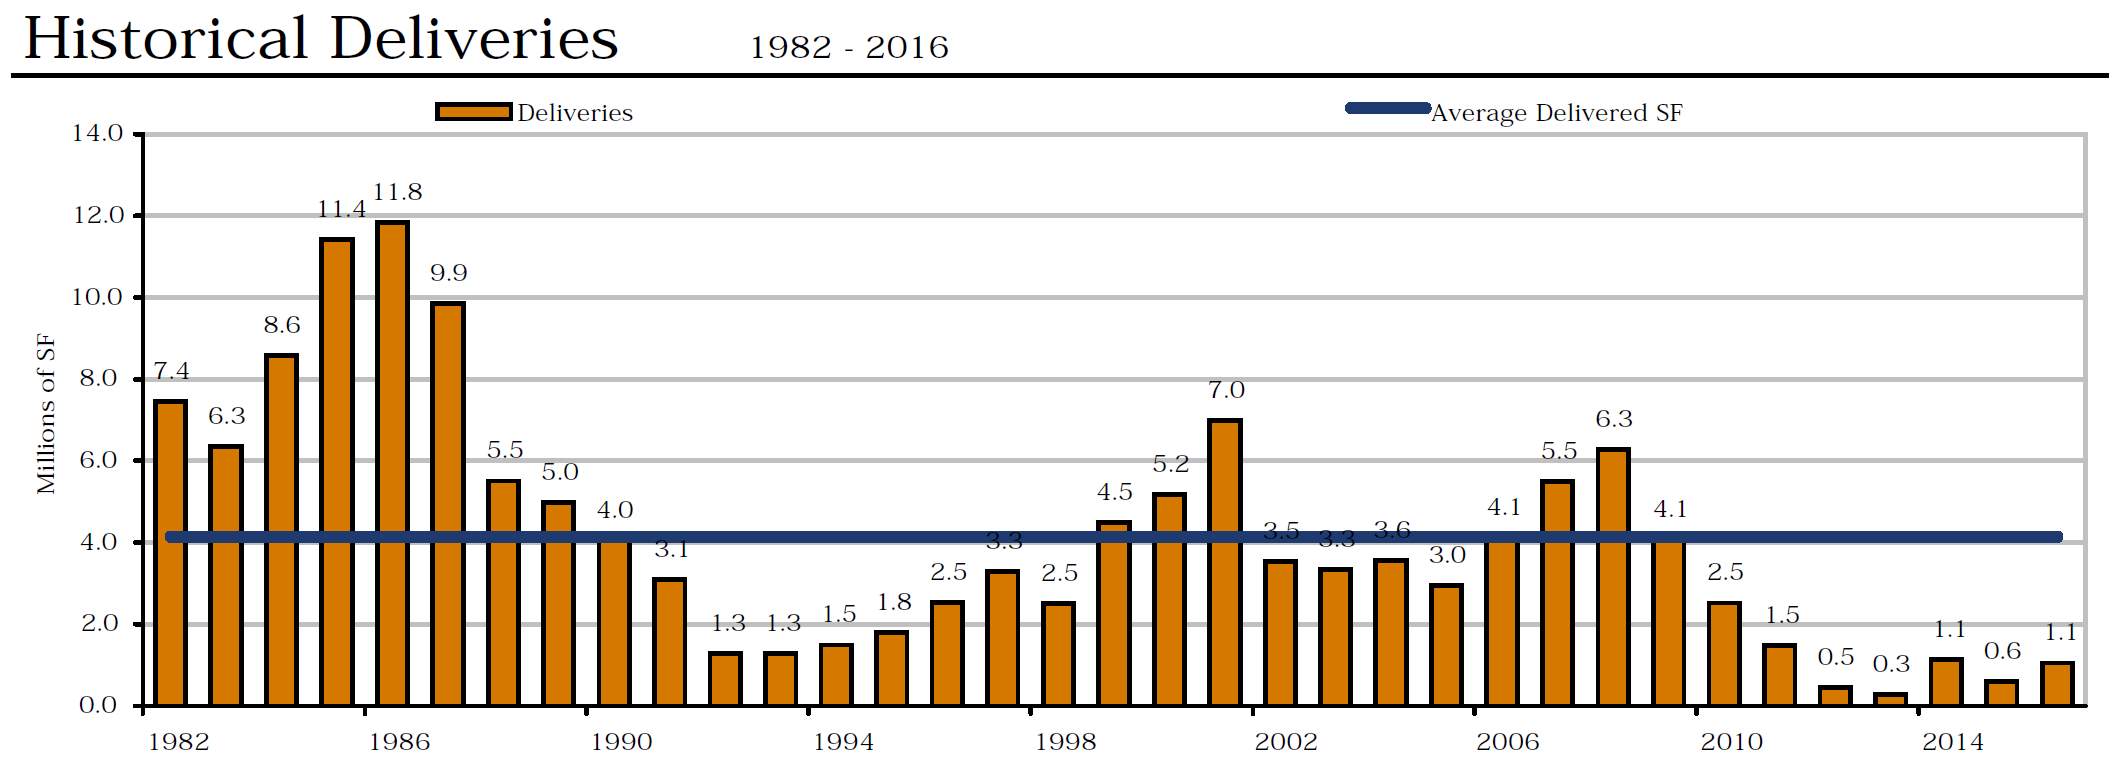
Figure 50 South Florida Office Historical Deliveries (Source: CoStar)
During the fourth quarter 2016, four buildings totaling 91,450 square feet were completed in the South Florida market area. This compares to six buildings totaling 87,704 square feet that were completed in the third quarter 2016, six buildings totaling 257,741 square feet completed in the second quarter 2016, and 621,751 square feet in nine buildings completed in the first quarter 2016. (CoStar, n.d.)
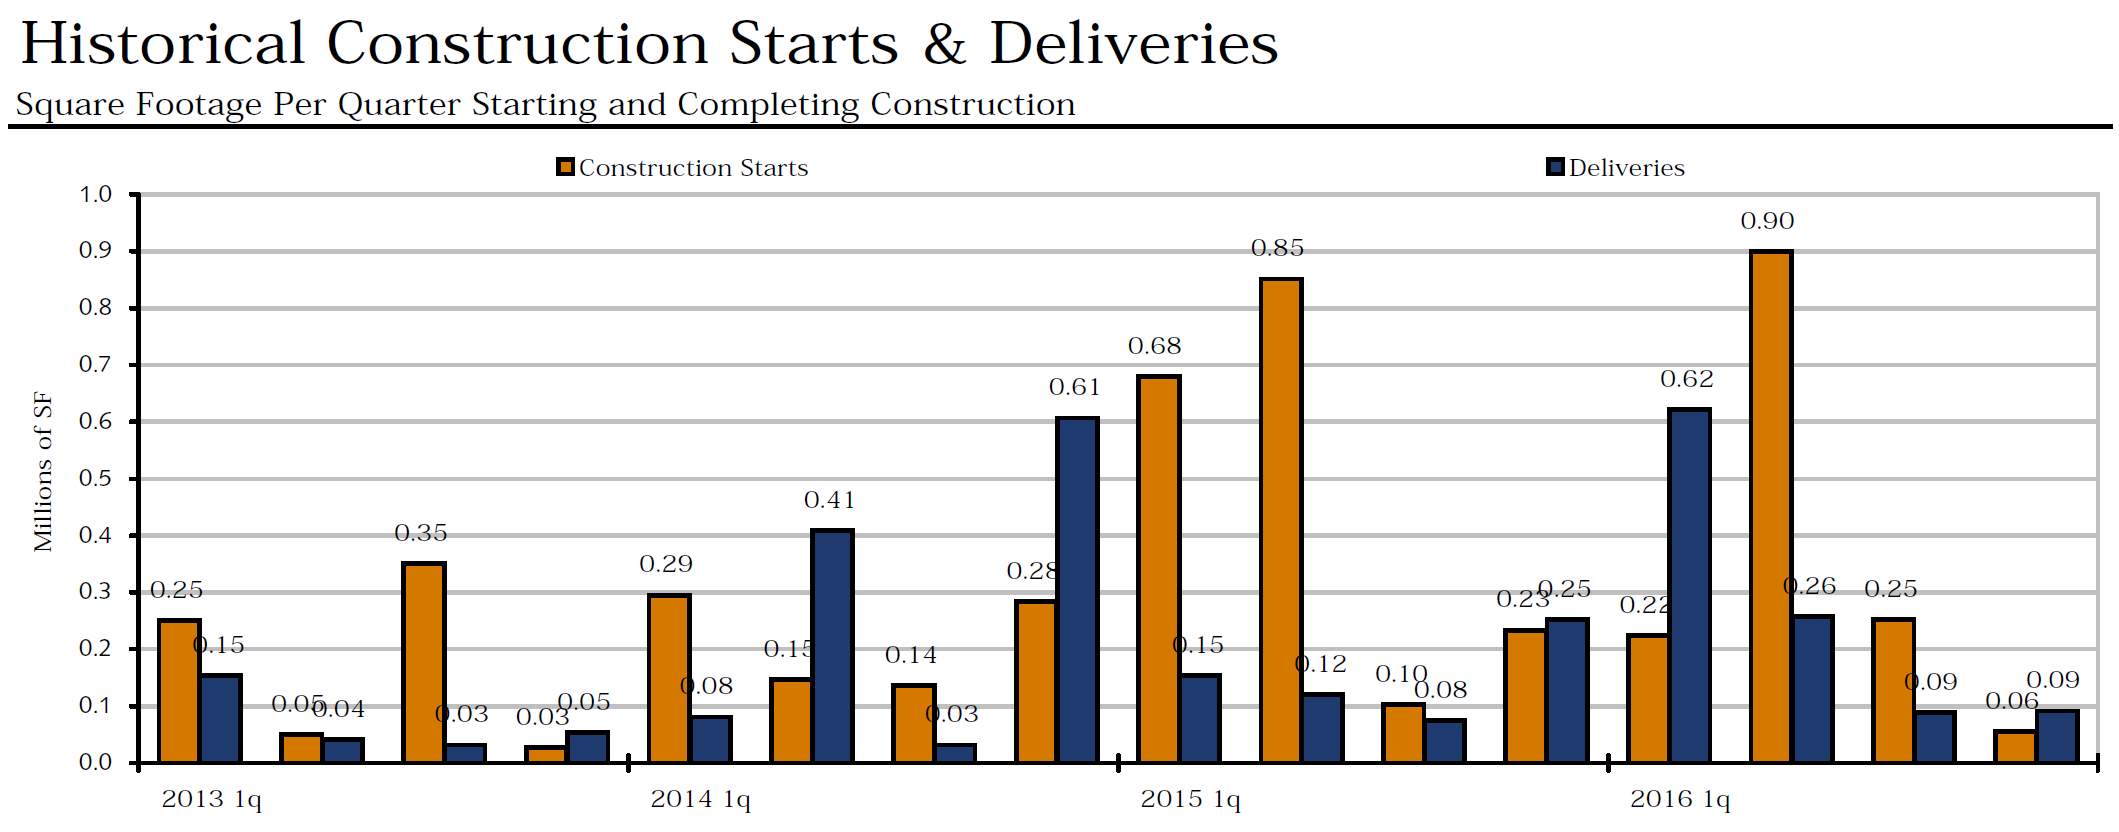
Figure 51 South Florida Office Construction Starts & Deliveries (Source: CoStar)
There were 2,760,943 square feet of office space under construction at the end of the fourth quarter 2016. Some of the notable 2016 deliveries include: NSU Center
for Collaborative Research, a 215,000-square-foot facility that delivered in first quarter 2016 and is now 72 percent occupied, and Three Brickell City Centre, a 134,552-square-foot building that delivered in first quarter 2016 and is now 100 percent occupied.
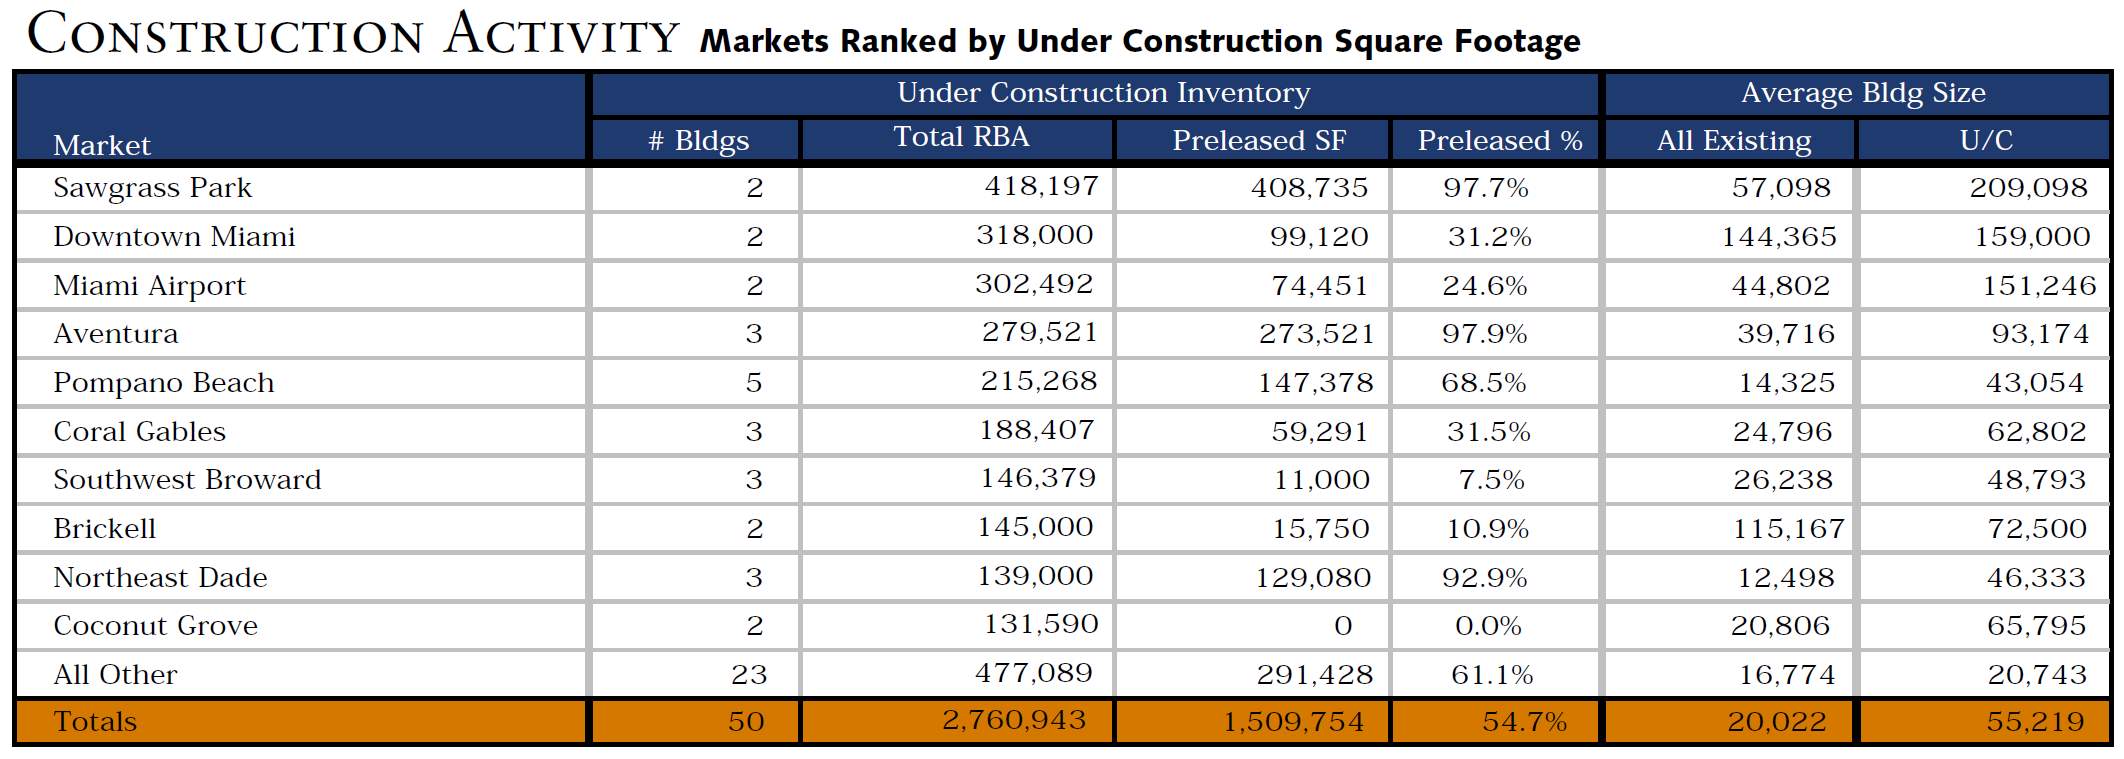
Figure 52 South Florida Office Construction Activity (Source: CoStar)
The largest projects underway at the end of fourth quarter 2016 were American Express, a 400,000-square-foot building with 100 percent of its space pre-leased, and 800 Waterford, a 246,085-square-foot facility that is 11 percent pre-leased.
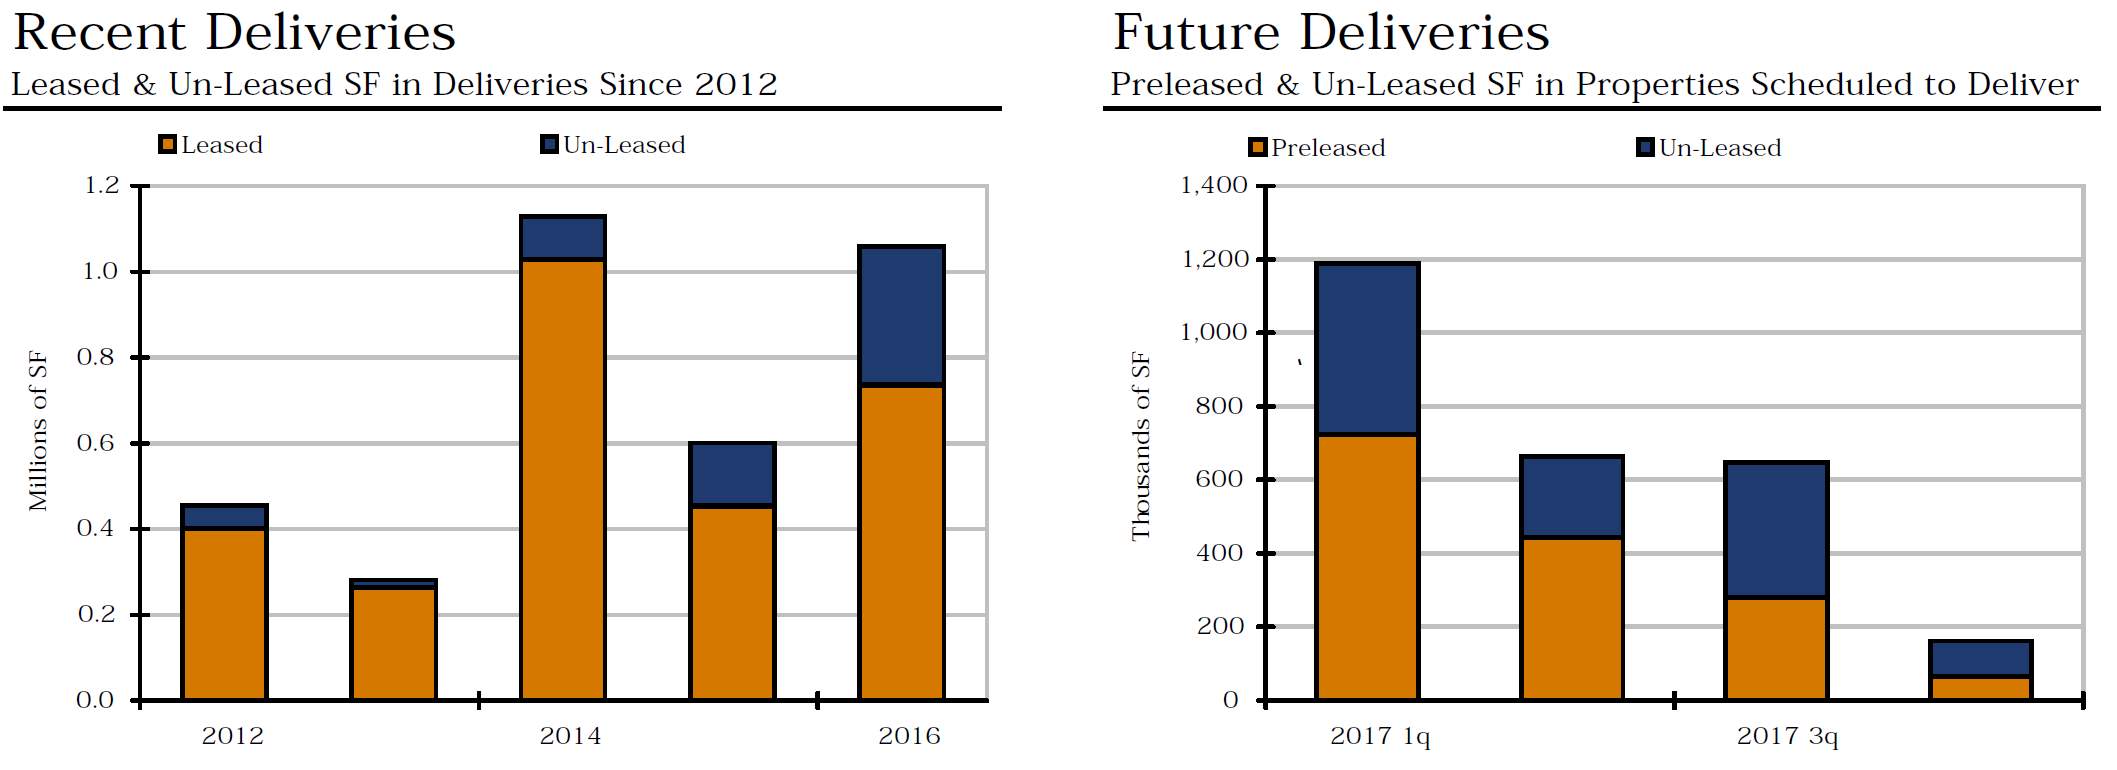
Figure 53 South Florida Office Construction Recent & Future Deliveries (Source: CoStar)

Figure 54 South Florida Office Recent Deliveries by Project Size (Source: CoStar)
f. Inventory Demand Trends
Total office inventory in the South Florida market area amounted to 224,608,406 square feet in 11,218 buildings as of the end of the fourth quarter 2016.
The Class-A office sector consisted of 58,929,775 square feet in 415 projects. There were 3,463 Class-B buildings totaling 107,596,773 square feet, and the Class-C sector consisted of 58,081,858 square feet in 7,340 buildings.
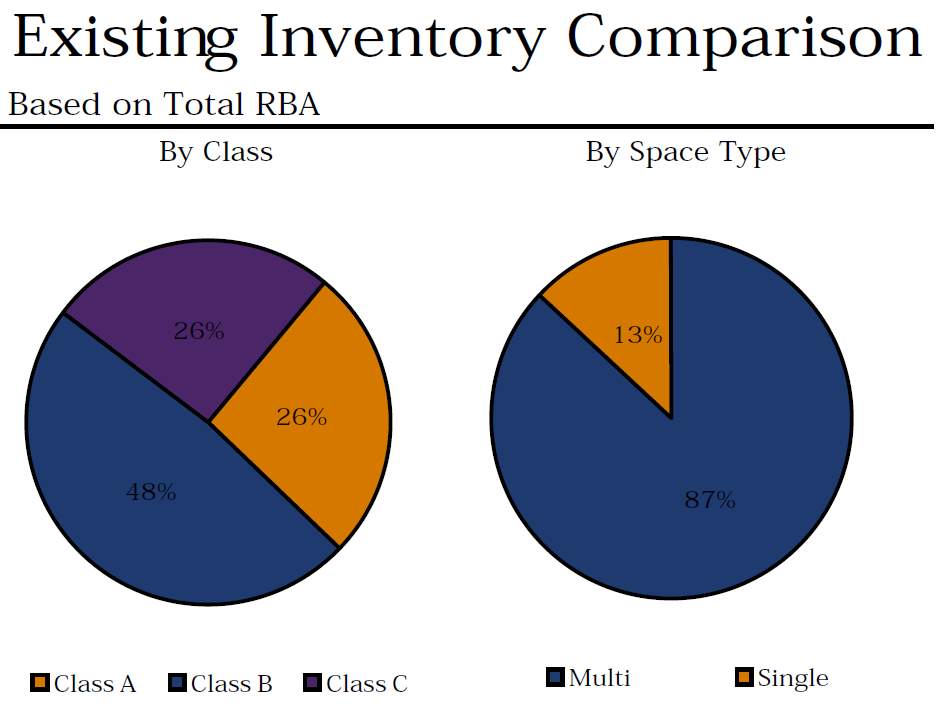
Figure 55 South Florida Office Existing Inventory (Source: CoStar)
Within the Office market there were 419 owner-occupied buildings accounting for 12,414,286 square feet of office space.
g. Sales Activity
“Tallying office building sales of 15,000 square feet or larger, South Florida office sales figures fell during the third quarter 2016 in terms of dollar volume compared to the second quarter of 2016.” (CoStar, n.d.)
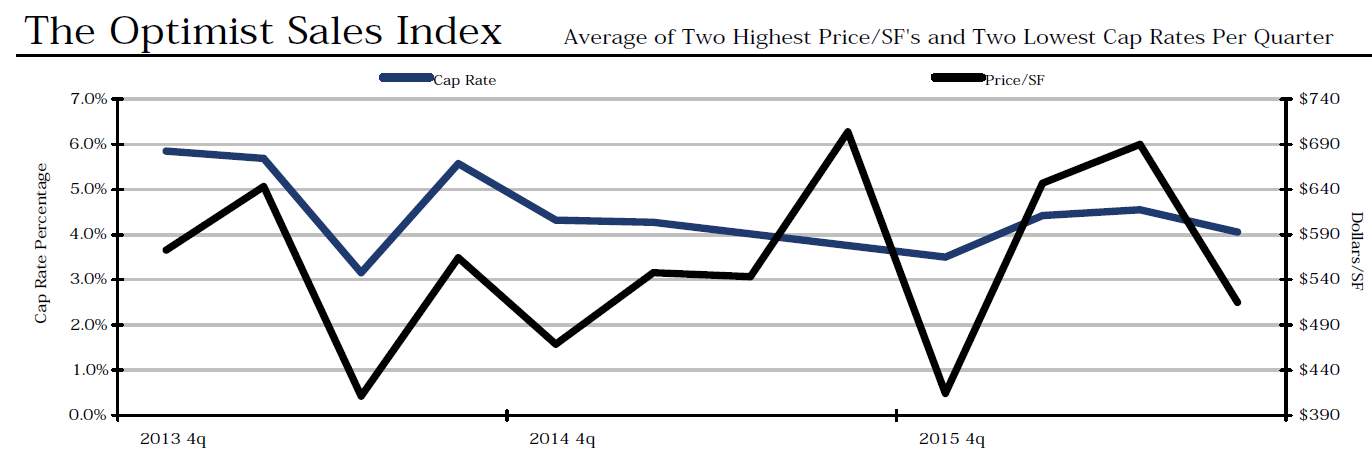
Figure 56 South Florida Office Sales Price/SQF vs. CAP Rate (Source: CoStar)
In the third quarter, 34 office transactions closed with a total volume of $773,607,800. The 34 buildings totaled 3,256,551 square feet and the average price per square foot equated to $237.55 per square foot. That compares to 34 transactions totaling $867,547,525 in the second quarter 2016. The total square footage in the second quarter was 3,434,148 square feet for an average price per square foot of $252.62.
Total office building sales activity in 2016 was up compared to 2015. In the first nine months of 2016, the market saw 102 office sales transactions with a total volume of $2,207,855,357.
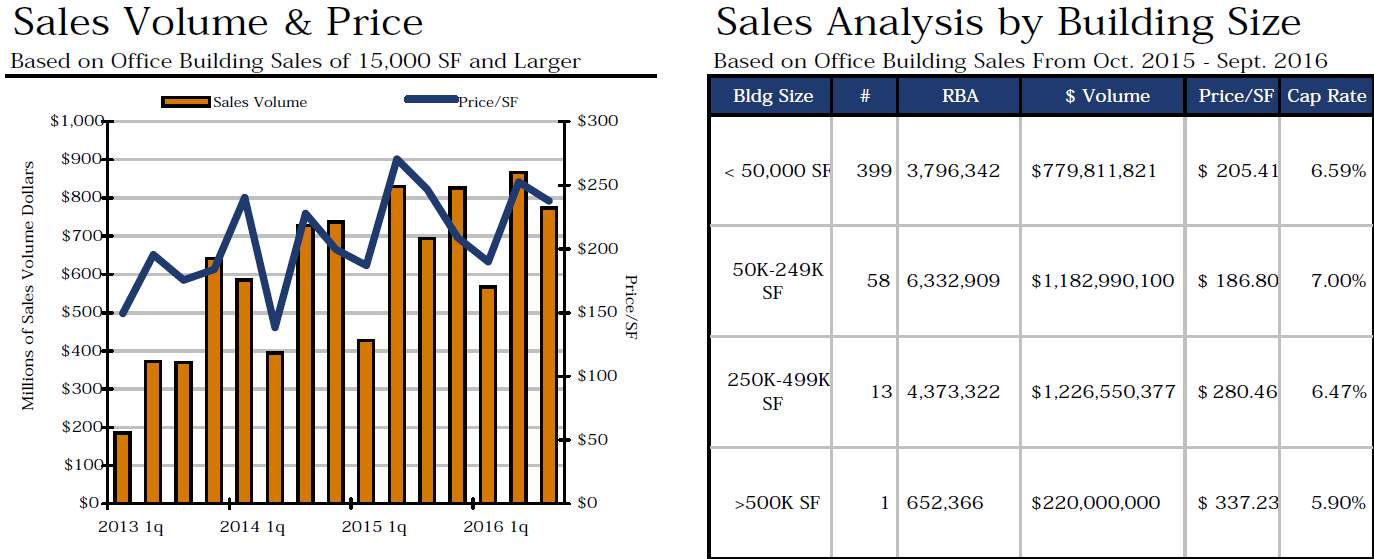
Figure 57 South Florida Office Market Sales Analysis (Source: CoStar)
The price per square foot averaged $228.21. In the same first nine months of 2015, the market posted 142 transactions with a total volume of $1,952,168,415. The price per square foot averaged $238.93.
h. Cap Rates
Cap rates have been higher in 2016, averaging 6.53 percent compared to the same period in 2015 when they averaged 6.41 percent. One of the largest transactions that has occurred within the last four quarters in the South Florida market is the sale of Southeast Financial Center in Miami. This 1,225,000-squarefoot office building sold for $516,600,000, or $421.71 per square foot. The property sold on 12/2/2016.”
i. South Florida Office – Select Deliveries FY 2010
Please refer to Annex 5
j. South Florida Office – Under Construction Projects
Please refer to Annex 5
k. Top South Florida Office Deals FY2016
Please refer to Annex 6
7. Financing
The local equity investment partnerships are dwarfed by commercial mortgage-backed securities (CMBSs), national and global real estate investment trusts (REITs), pension funds, foreign investors, municipal bonds, and property trust companies. The most common form of securitized commercial real estate debt is CBSs put together by banks, mortgage companies, insurance companies, and investment banks.
In the last 10-12 years, the financial equation used by developers on new office construction was about 65 percent construction loan, 20 percent mezzanine, and 15 percent equity. Currently, mezzanine loans are no longer available and developers might receive construction loans of between 50 and 60 percent, leaving them with 40 percent leverage which requires 20 to25 percent return on equity, therefore significantly limiting the return for developers. (Peiser, 261)
The lack of financing and the limited interests among equity investors leave a financial void that banks are not inclined to fill without significant risk-limit guarantees.
a. Construction Loans
Construction lenders, typically concerned with lease, “typically require 40 to 50 percent of space to be preleased in normal markets, 50 to 70 percent in soft markets, and more than 70 percent, along with personal guarantees during the Great Recession.” As we’ve seen earlier, Construction activity remains elevated but most space under construction is pre-committed. The current administration has signaled plans to energize domestic economic growth via infrastructure and defense spending, comprehensive tax reform and deregulation but we don’t know exactly how quickly this is going to remove of gridlock that could result in higher debt limit. The due diligence performed for construction loans is detailed, and lenders require concrete proof of rent expectation. The equity requirements can increase from 25 to 50 percent, or greater, depending on factors such as pre-leasing and developers’ creditworthiness.
“The terms of construction loans can range from six months to four years with higher interest rates than permanent loans due to the higher risk. Construction loan rates are based on LIBOR for major lenders, while smaller community banks offer rates based on the prime rate. Obviously, the final rates depend on market conditions and the bank’s assessment of the credit risk. Upfront loan points are common in construction loans. Most construction loans call for interest to accrue through the construction period. When construction is complete and the building is leased up, the developer gets a permanent loan or sell the project and pay off the total loan amount.”
There are a series of problems that developers can face. Amongst them include: “a) failure to leave enough cushion for cost overruns and slower than expected leasing; b) lack of understand of the covenants in the loan document that may allow the lender to increase reserve requirements and adjust the terms accordingly; c) an exit strategy; will there be buyers for the asset if the developer does not want to hold it after construction?” (Peiser, 262)
b. Permanent Loans
The permanent mortgage is funded once the building reaches a negotiated level of occupancy (usually, about 70 – 80 percent) a level that is sufficient to cover debt service on the mortgage. When the commitment provides for funding the mortgage before the building is fully leased, usually the developer must post a letter of credit for the difference between the amount that the lease will carry and the full loan amount. Alternatively, the lender may fund the mortgage in stages as the building as the building is leased. Lenders will focus on the effective rather than the market rent, using the lower of the two to underwrite the permanent loan, and they may deduct amounts from the cash flow to cover capital costs and leasing reserves (in case of tenant default).
“In periods of low CAP rate, developers can face financial challenges with the loan covenant and the L/V ratio when the exit assumptions don’t materialize. For example, in 2008, L/V was 60 to 70 percent with value decreases of 25 to 30 percent due to cap rate increases. When a short fall is created, the lenders can request that developers cover the difference. If developers can’t cover the difference by either adding equity or negotiating agreement with the lender, here is expectation of dispositions driven either by banks or by landlords who are trying to reduce the erosion in their equity.” (Peiser, 263)
c. Mortgage Options
Standards 30-years self-amortizing mortgages with a 10-year call are common form of permanent financing. Interest rates are usually lower for short term mortgages because of the lower interest rate risk to the lender over time. Occasionally, when inflation and long term interest rates are expected to fall, interest rates are higher for short term mortgages than for long term ones. Other forms of financing are participating mortgages, convertible mortgages, and sale-leasebacks, all of which are forms of joint ventures with lenders. (Peiser, 264)
d. Lease Requirements
Developers must execute leases that satisfy the construction and permanent lender’s requirements with experienced attorneys while avoiding standard lease forms. Proper building maintenance and tenant services are essential to protect the interests of the lenders. Lenders require assignable leases allowing them to take assignment of the rent in the event of a default. Lenders prefer clauses that require tenant to pay rent even if the building gets destroyed but sophisticated tenants will not accept this.
Lenders dislike rental rates being offset against increases in pass-through expenses. For example, most leases require tenants to pay increases in operating costs over some base figure. They also object to exclusions for increases in operating costs over base figures. (Peiser, 263)
e. Standby and Forward Commitments
Standby commitments are open-ended construction financing without the permanent take-out. They essentially represent permanent loan commitments from credit companies and REITs that are sufficient to secure construction financing but are very expensive if they are used. Standby loans may run three or more points above prime, thus increasing the default risk during recessions. Ideally, Standby commitments are never funded because they get replaced by another type of mortgage.
A forward commitment is when the developer borrows against proceeds from the sale for the construction loan. The presale price is determined based on market capitalization rates. A forward commitment often includes an earnout provision where the developer is paid part of the purchase price and the balance is paid as the leasing is completed. (Peiser, 264)
f. Equity
Lenders normally require 20-30 percent of the developers cost to be funded by equity sources but it can be higher depending on the credit worthiness of the development team, the market, the preleasing and or overall strength of the lending industry. Joint venture with lenders can sometimes can be a solution for the equity requirements. Lenders that participate in JVs have preferred participating loans, which gives them a share of the cash flows during operations and profits from sale. (Peiser, 264)
g. Loan Workouts
All mortgages include lender imposed covenants. One of the major covenants is a predetermined Debt Coverage Ratio (DCR) requirement (typically 1.3-1.5). Some banks also require a Debt Yield Ratio (DYR – NOI divided by loan amount), which does not account for the interest rate. The loan covenants could outline the following:
- DCR and DYR testing frequency – usually one or twice a year;
- Completion benchmarks and repercussions in case of costs overruns noncompliance- for example: If the building is expected to be completed in four months and it doesn’t even after running over the cushion provide by the lender;
- The time frame in which the loan will be repaid;
(Peiser, 264)
h. Capex (Implication for ROI)
Before we review income and operating expenses, it is important that we understand the differences between capital expenditures and operating expenses.
In the world of office assets, “a capital expenditure (CAPEX) is defined as an expenditure contributing value to the property and equipment of a business. It is an expenditure toward capital assets, as contrasted with spending that covers operating expenses (OPEX) or purchase of investments unrelated to the company’s primary business.”
“At the top of the budget hierarchy in most companies and organizations stand two major kinds of budgets, a capital budget and an operating budget. These two kinds of budgets do not overlap: they handle distinctly different spending categories. Capital and operating budgets, moreover, are built through different budgeting processes, by different managers, and they use different criteria for prioritizing and deciding spending.
If an expenditure qualifies as a capital expenditure CAPEX or as an operating expense OPEX depends on what is purchased, what it will be used for, and upon the country’s tax laws. Companies and organizations normally designate specific criteria that must be met for an acquisition to qualify as “capital,” such as a minimum useful life (e.g., one year or more) and a minimum purchase price (e.g., $1,000).”
“The tax authorities also have a say in what may be considered a capital expense because capital items go onto the company’s balance sheet as assets, and on the income statement they create a depreciation expense for each year of the asset’s depreciable life.”
“This is very important for the investor or building owner because this depreciation expense lowers reported income (profit), thereby creating a tax savings for each of these years. Spending on operating expenses, by contrast, impacts reported profit and taxes on earnings only in the single reporting period they are incurred. Deciding what can and what cannot be called a capital expenditure, therefore, often requires knowledge of local policy and local tax laws.”
Acquisitions that typically meet company and government criteria as “capital assets” typically include such things as purchased:
- Vehicles
- Building Expansion
- Large IT systems (Hardware and/or Software)
- Large mechanical items such as an elevator
- Office Furniture and Office Equipment
“Operating budgets, by contrast, address spending on predictable, repeatable costs for items or services that are not registered as capital assets and are not depreciated. That means the company charges the full amount against income during that reporting period, and takes all tax consequences for it during that period.” (CAPEX, 2017)
i. National Income & Expense Trends
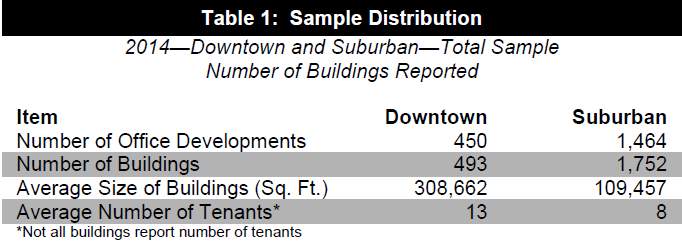
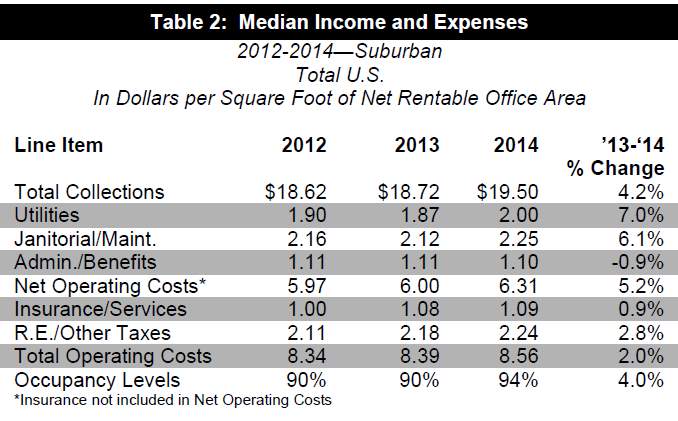
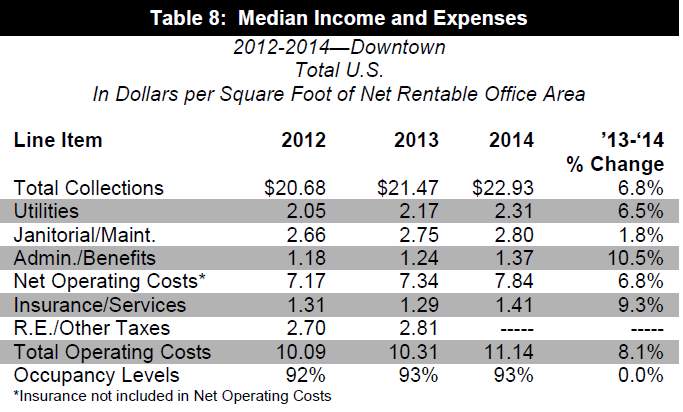
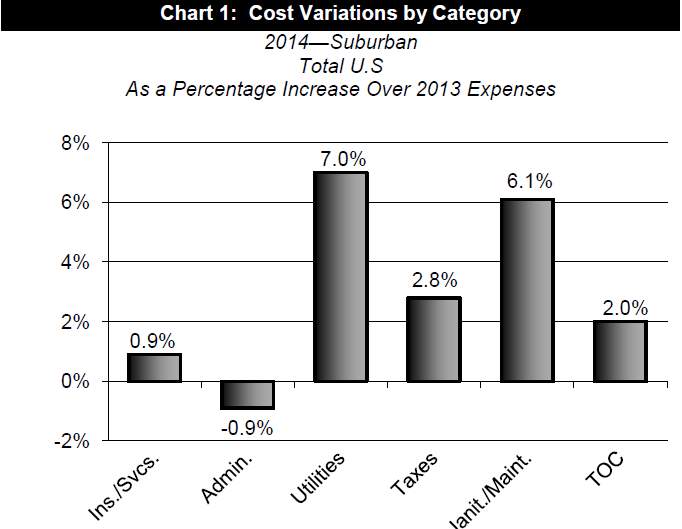
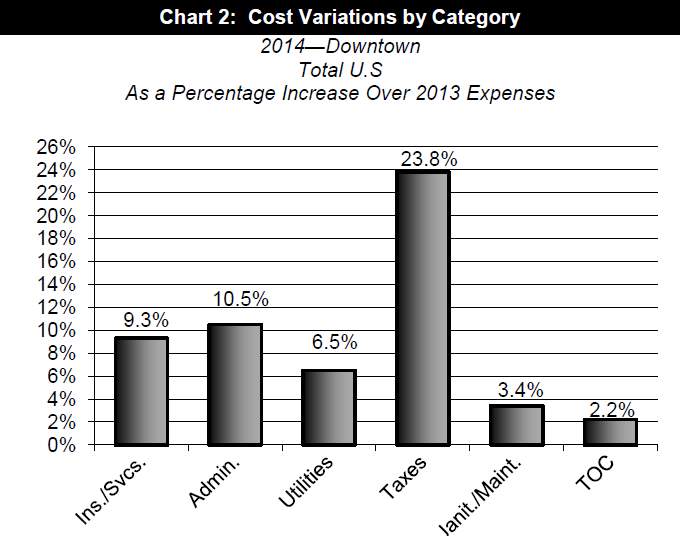
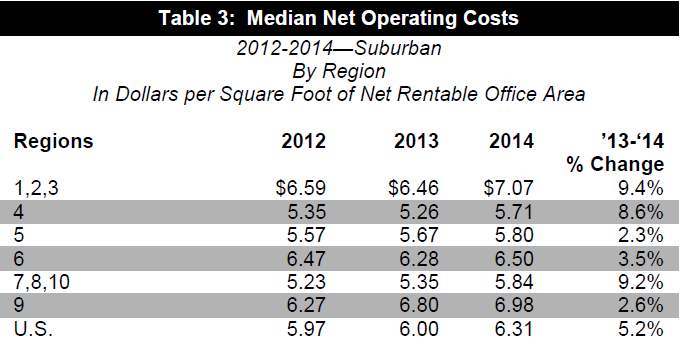
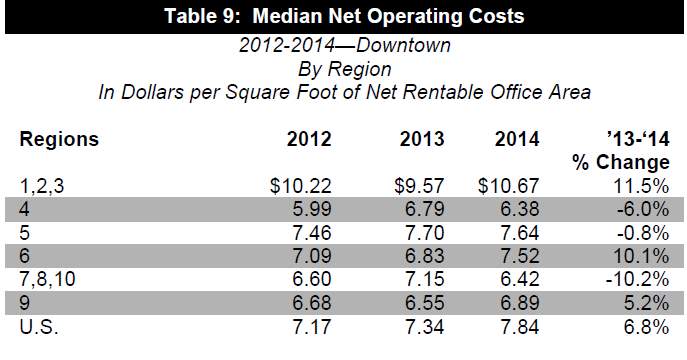
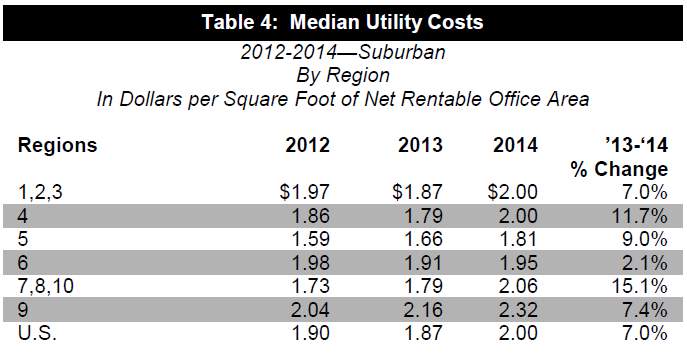
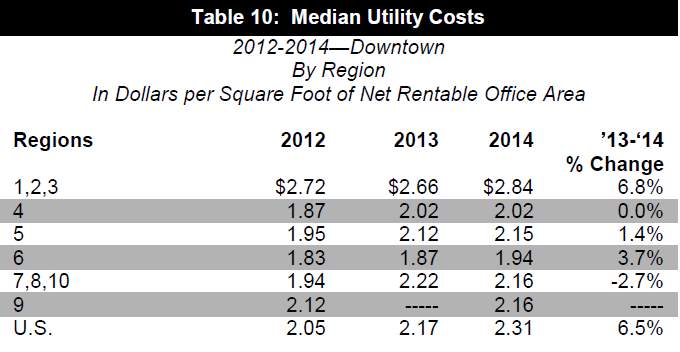
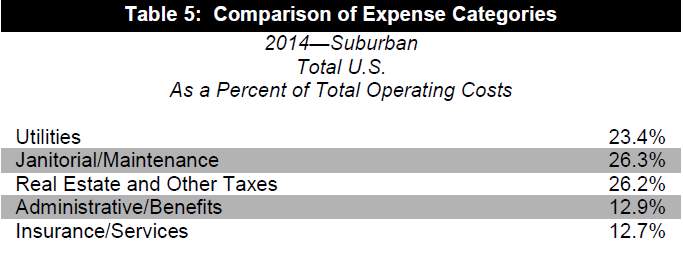
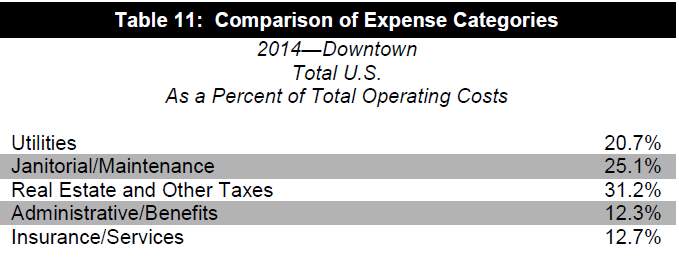
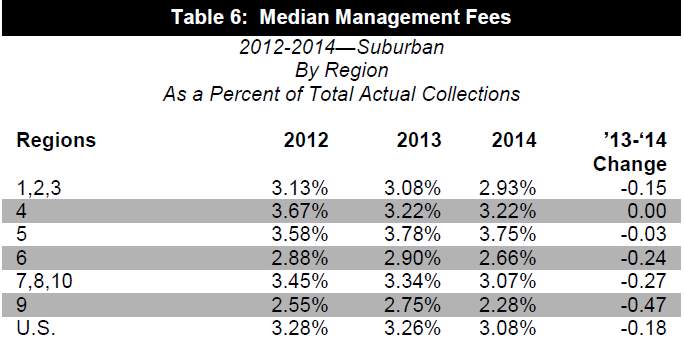
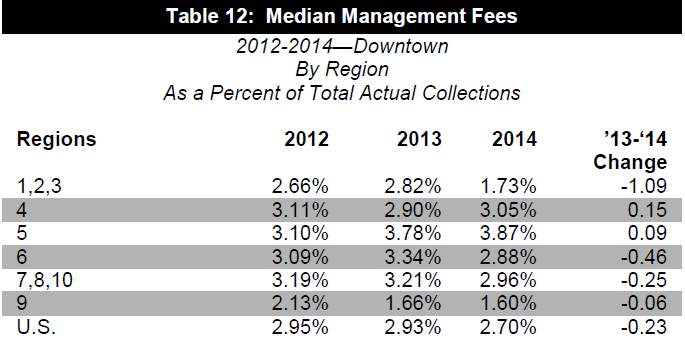
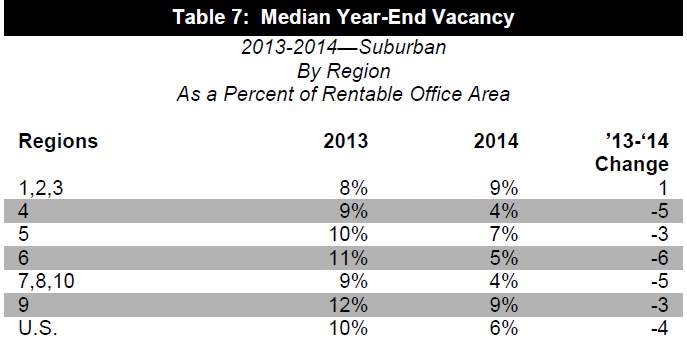
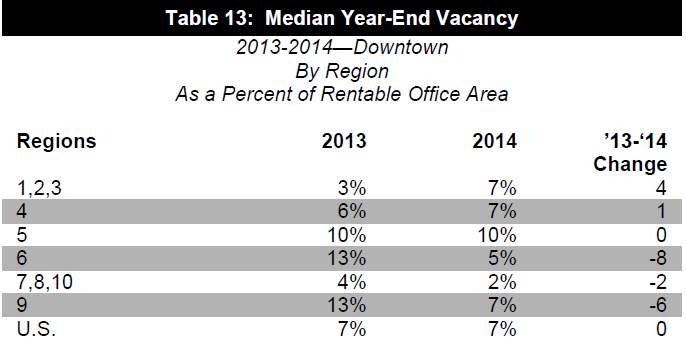
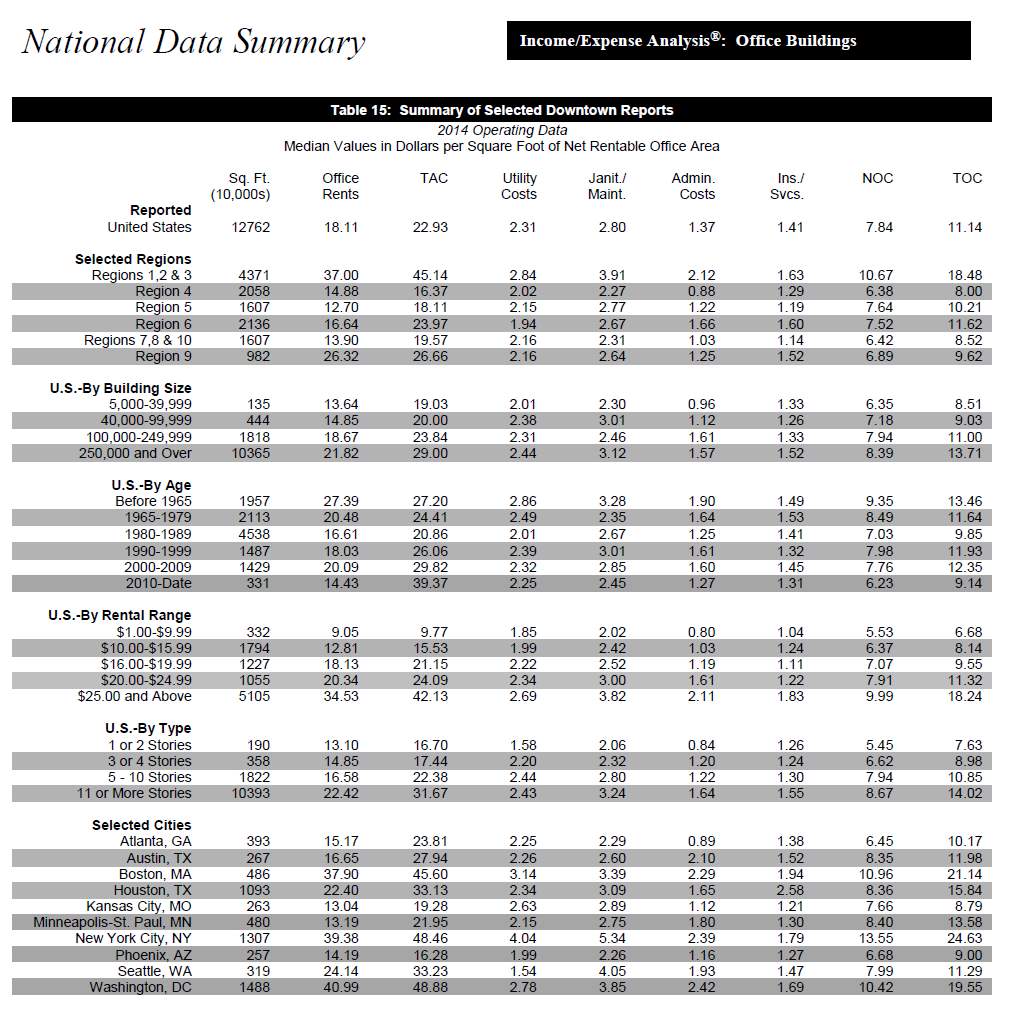
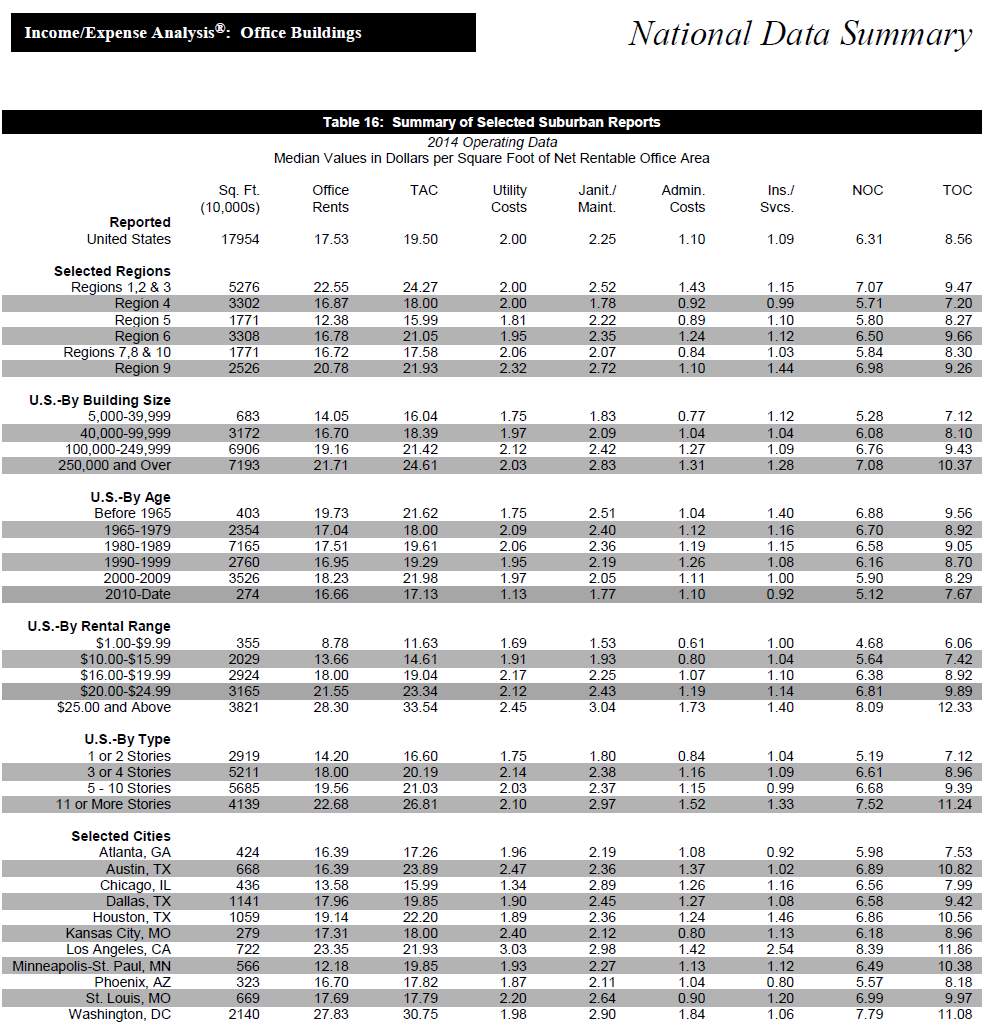
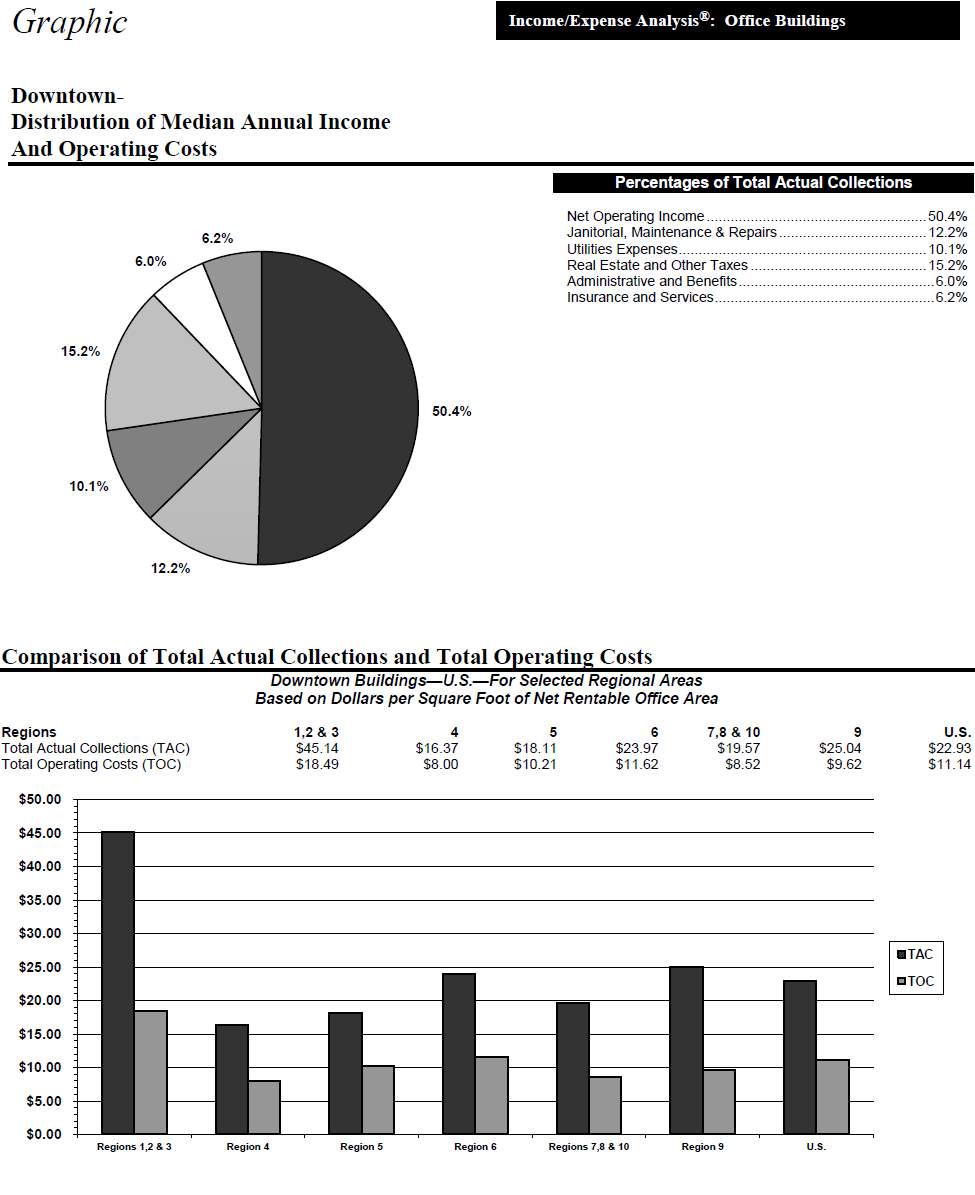
The institute of Real of Real Estate Management conducts research and captures Trends in Income an Operating Expenses of Office properties at a national, regional, state, and local level. The following tables provide a side by side assessment of the Office Asset Class typical income and operating expense in the suburbs vs. downtown areas in the US. For a breakdown of regions and its composing states please see Annex 4 at the end of this document. (IREM, 2015)
| Suburban Office Development | Downtown Office Development |
 |
 |
 |
 |
 |
 |
 |
 |
 |
 |
 |
 |
 |
 |
j. National Income & Expense Summary by Region, Size, Age, Rental Range in Select Cities
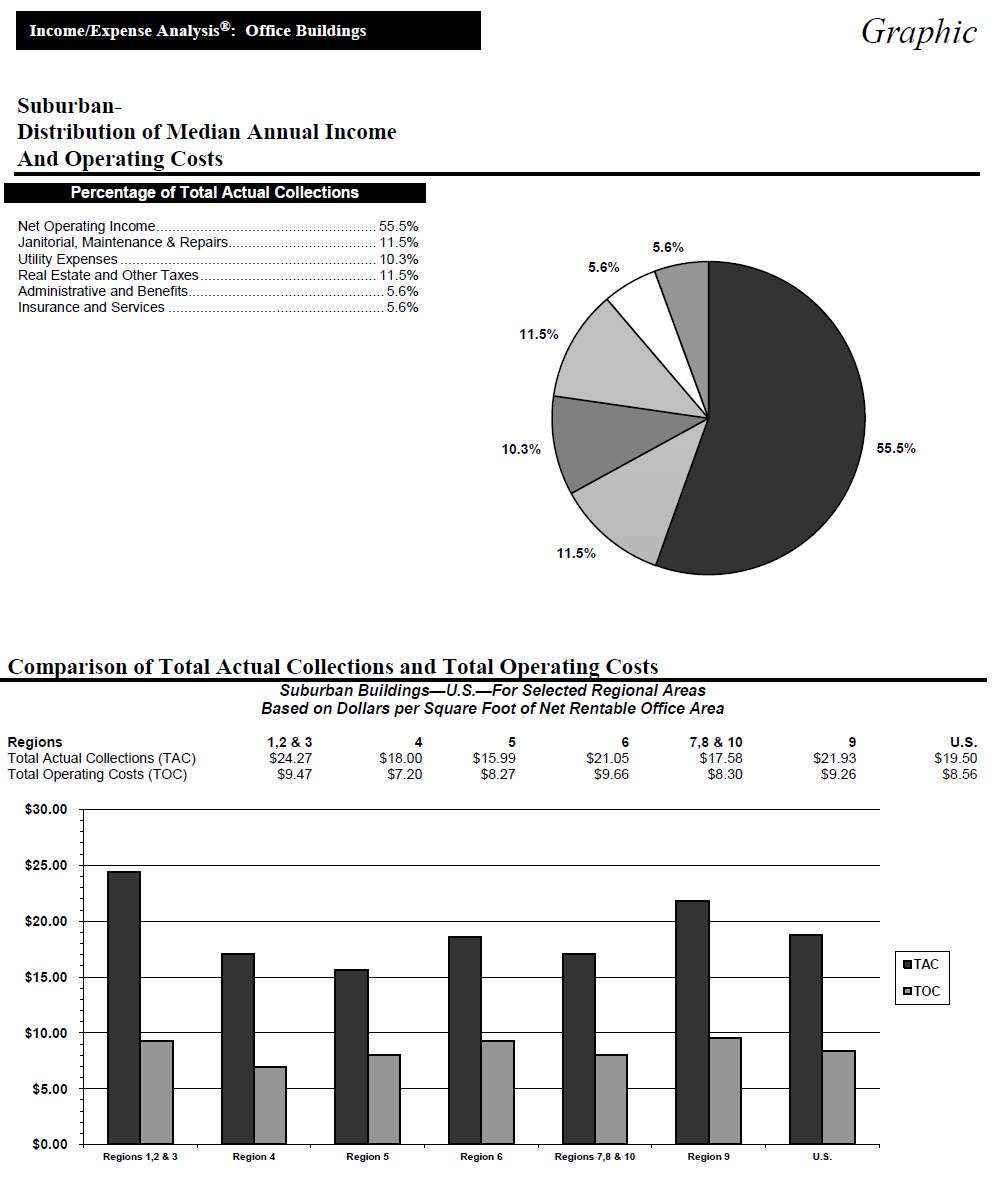
The Tables on the following pages provide an Income and expense statistics generated from the IREM surveys. The first column of each page describes the size of the sample in multiples of 10,000 per square feet. Key income items and expense subtotals follow across the page. All dollar figures are based on net rentable office area.
k. National Income & Expense Trends in Graphical Format
l. National Income & Expense Breakdown
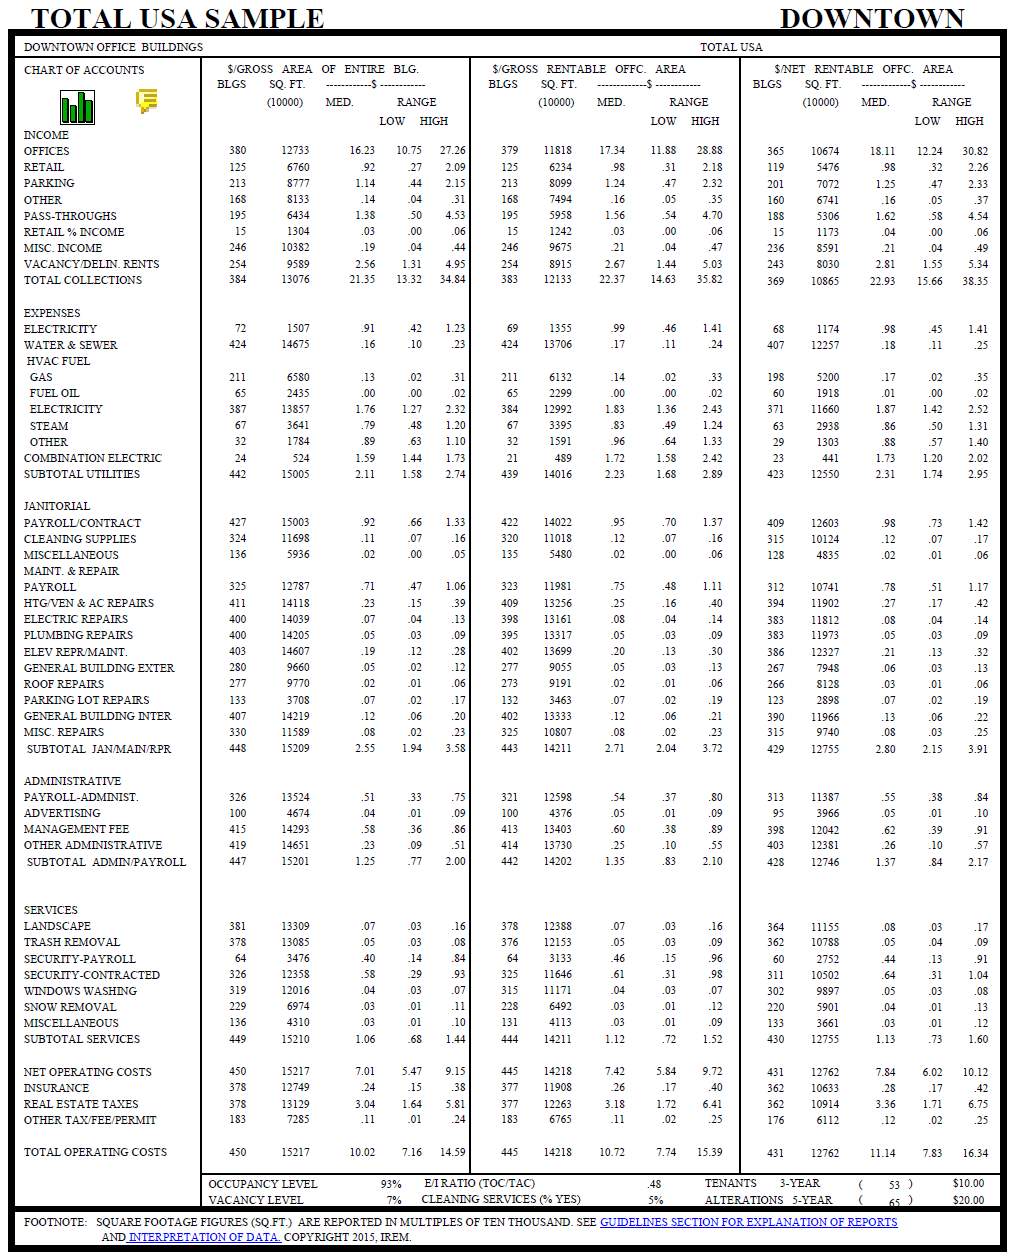
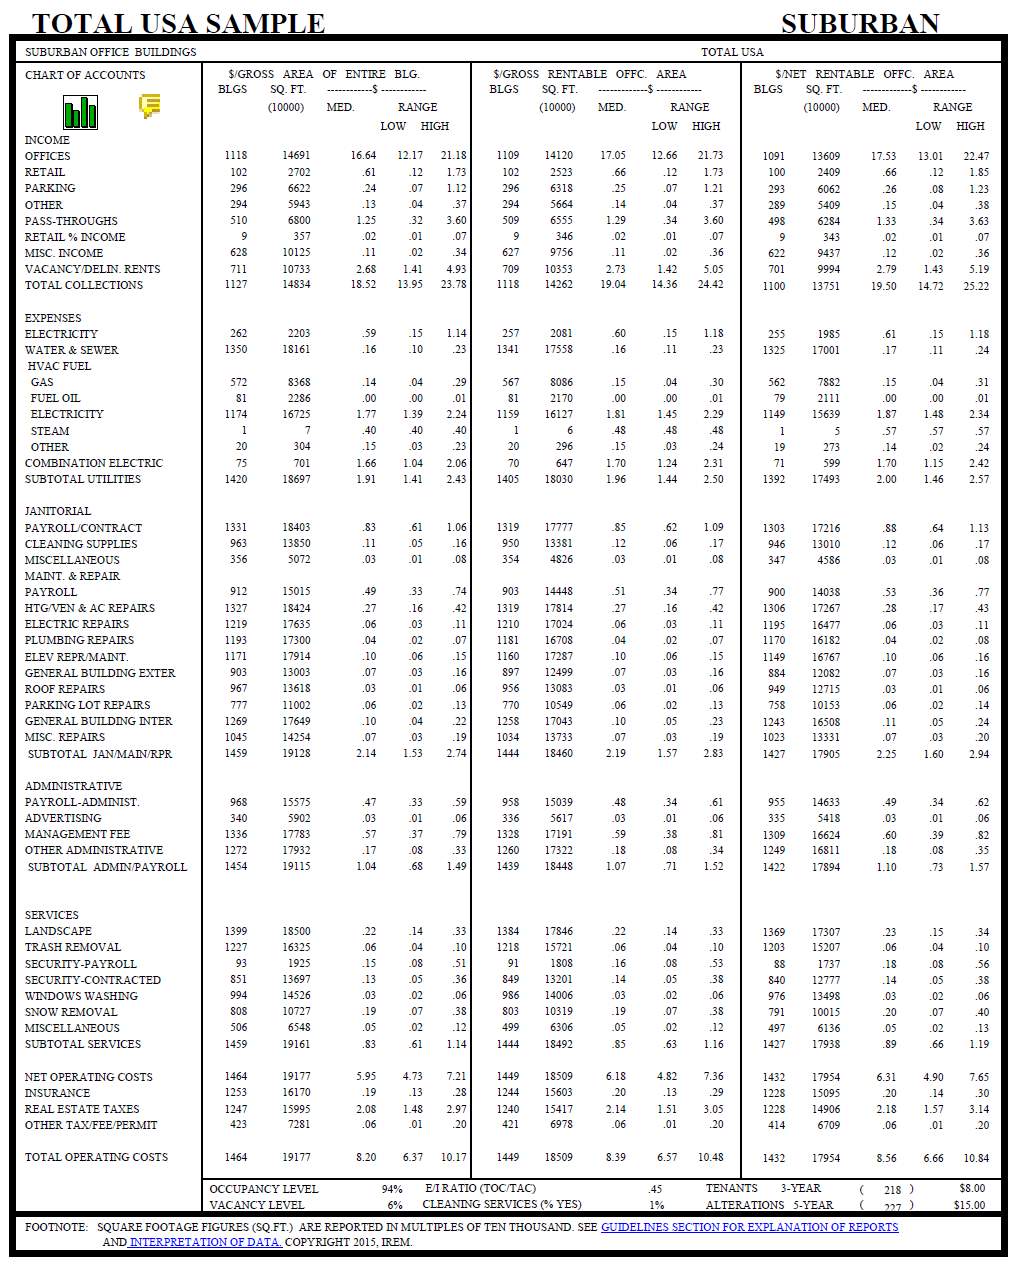
m. Metropolitan Miami Income & Expense Breakdown
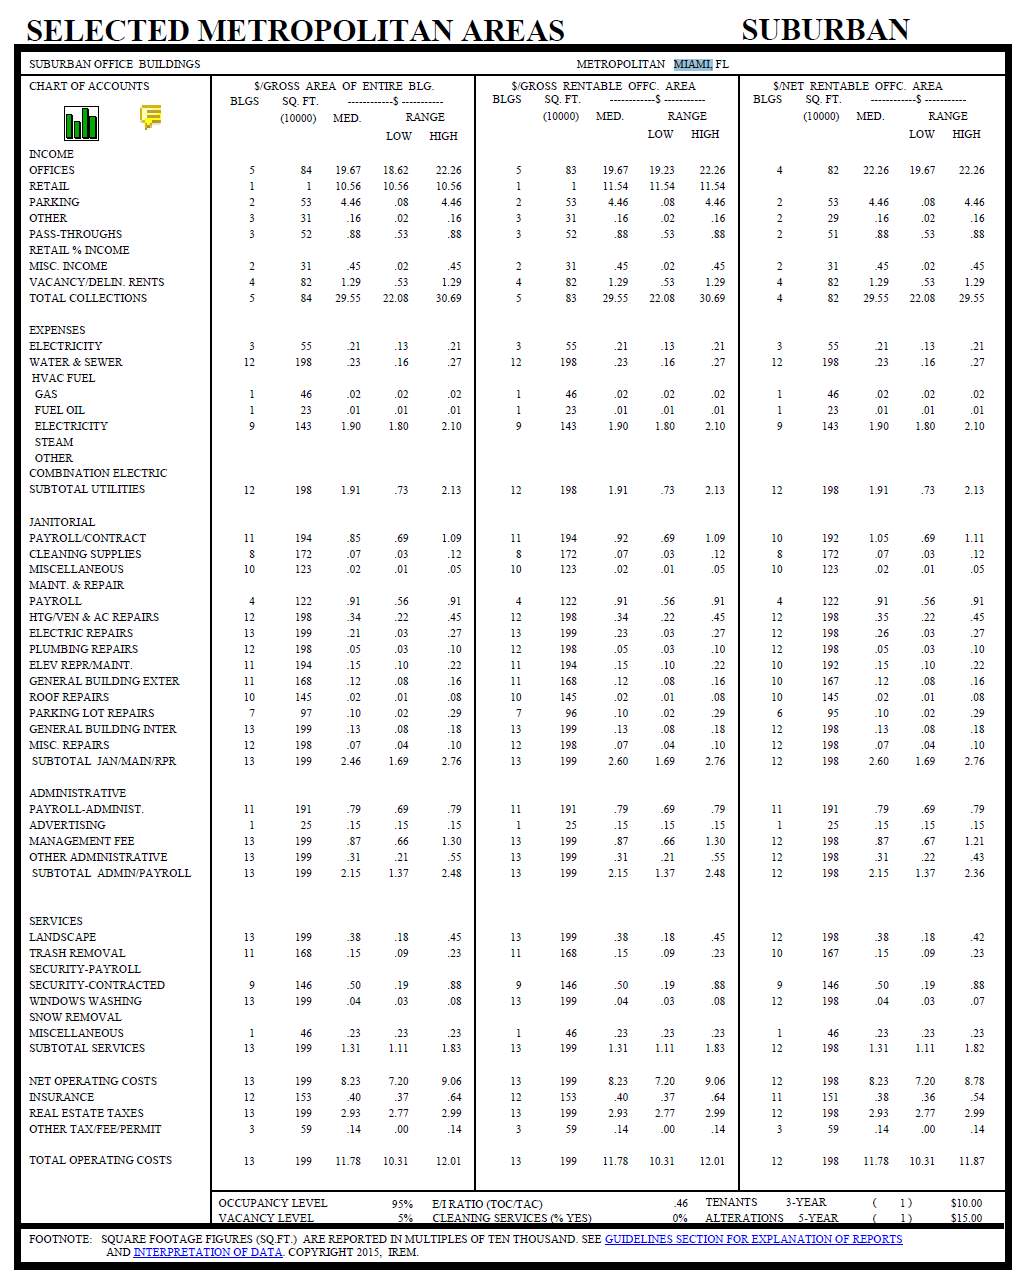

n. National Office Building Type of Ownership Analysis
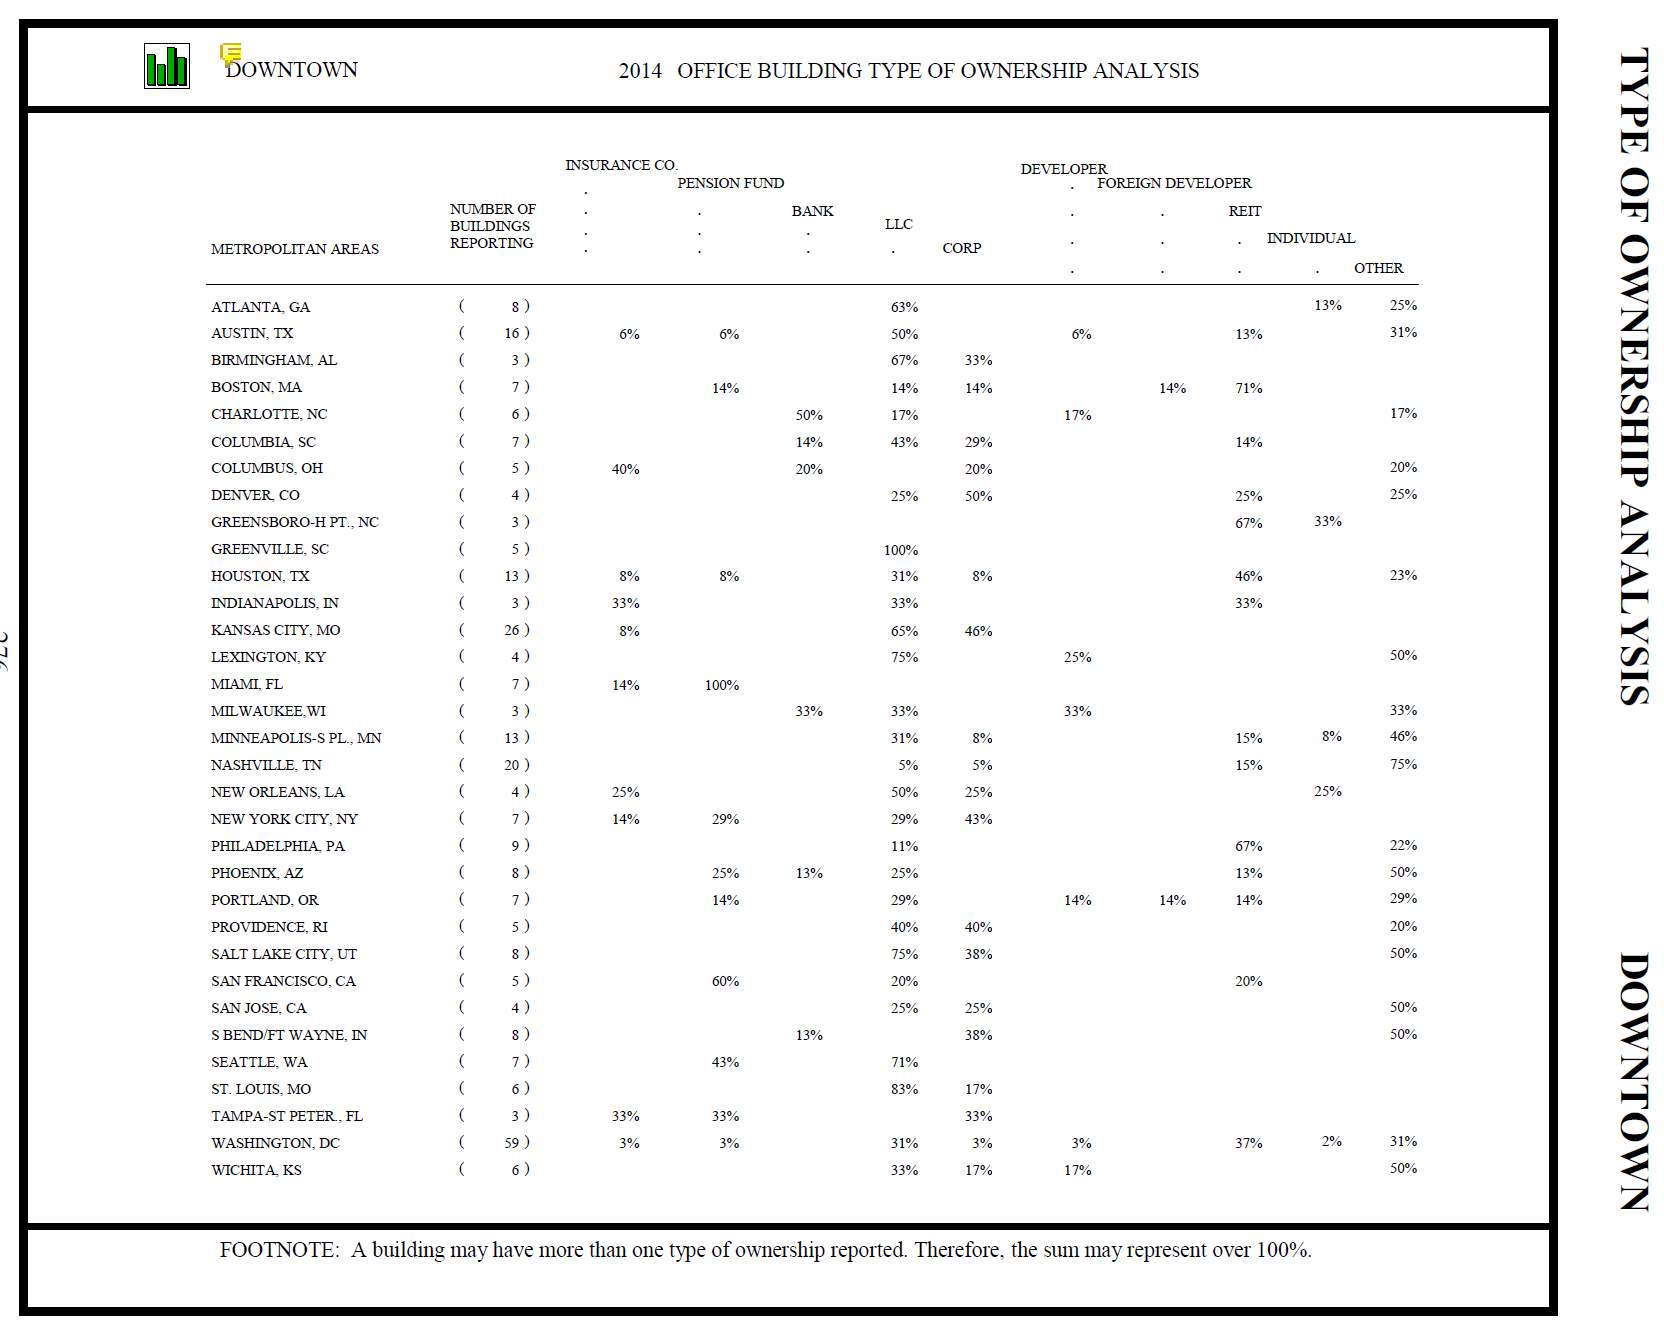
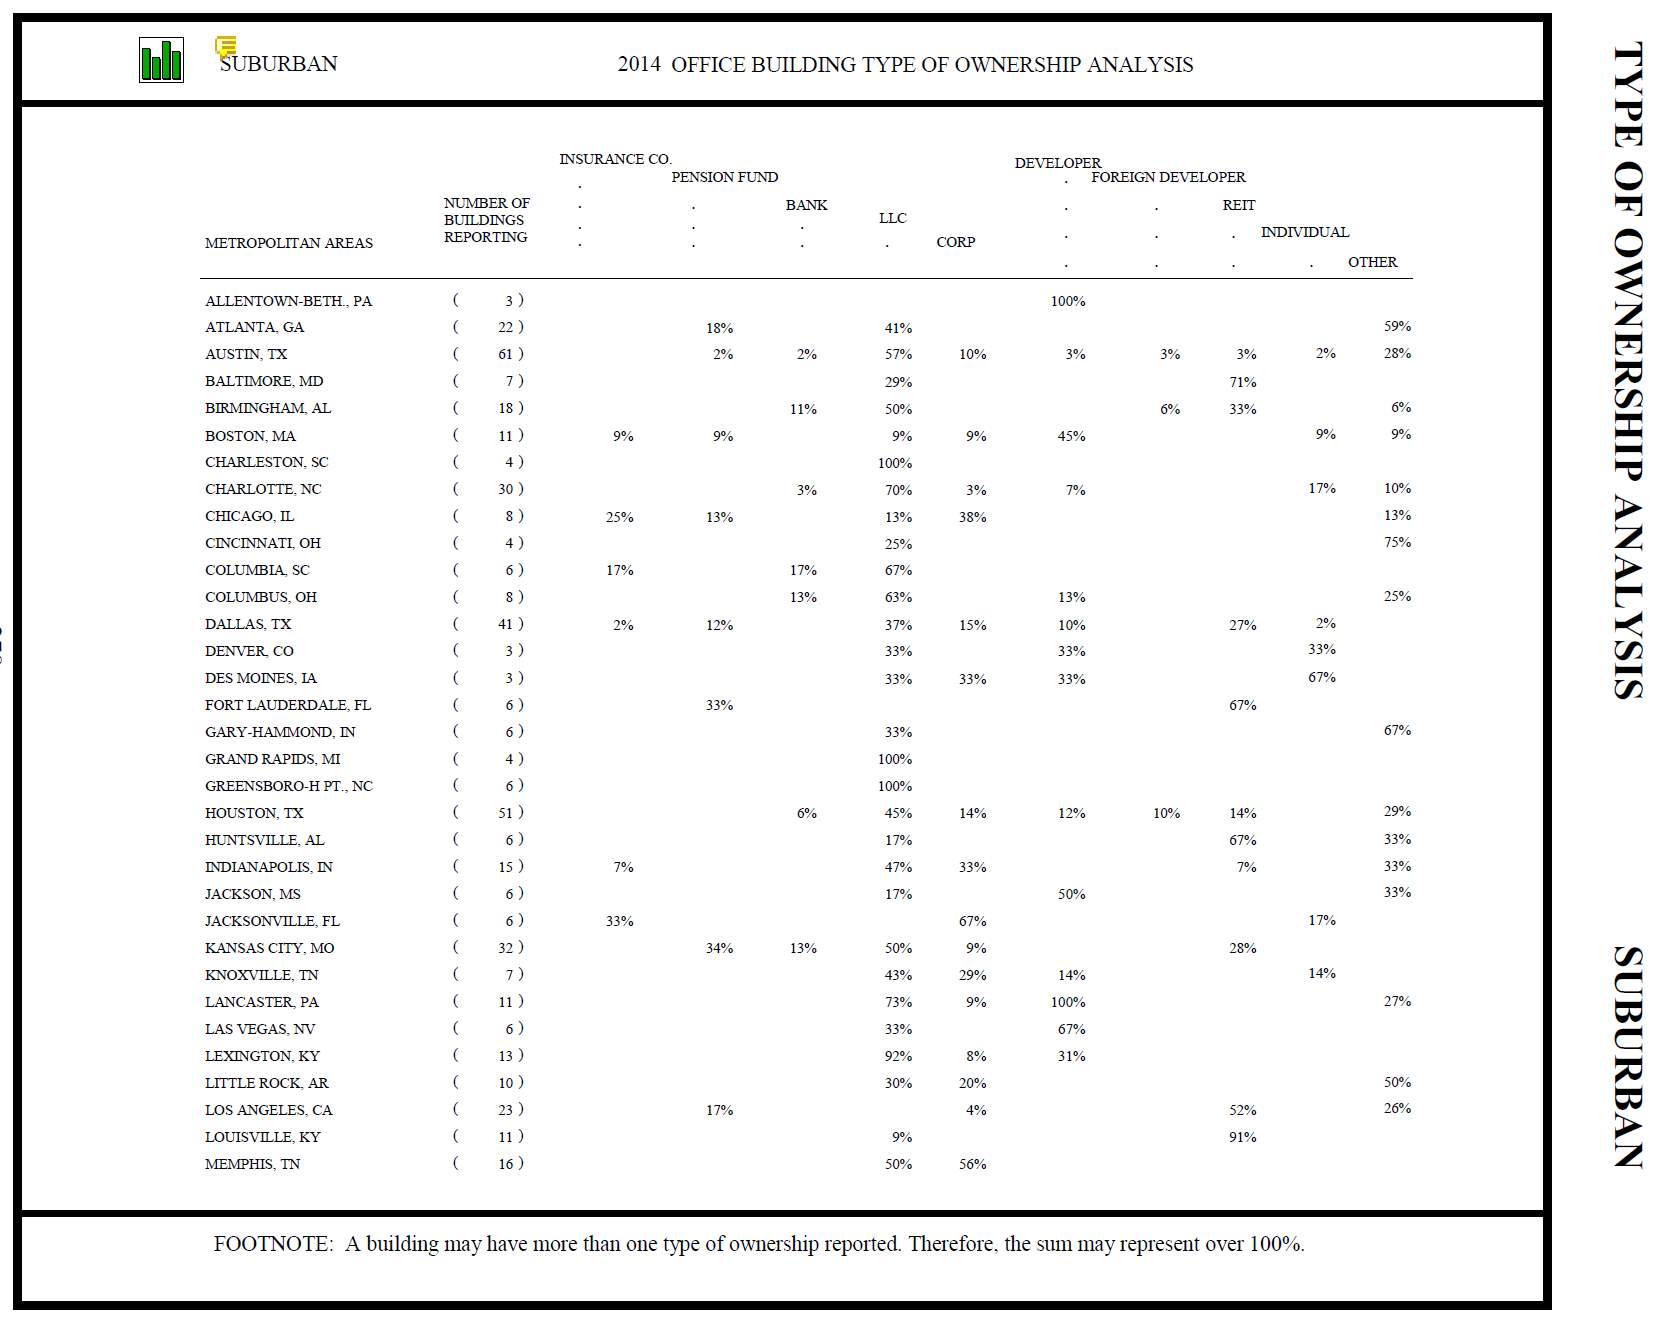
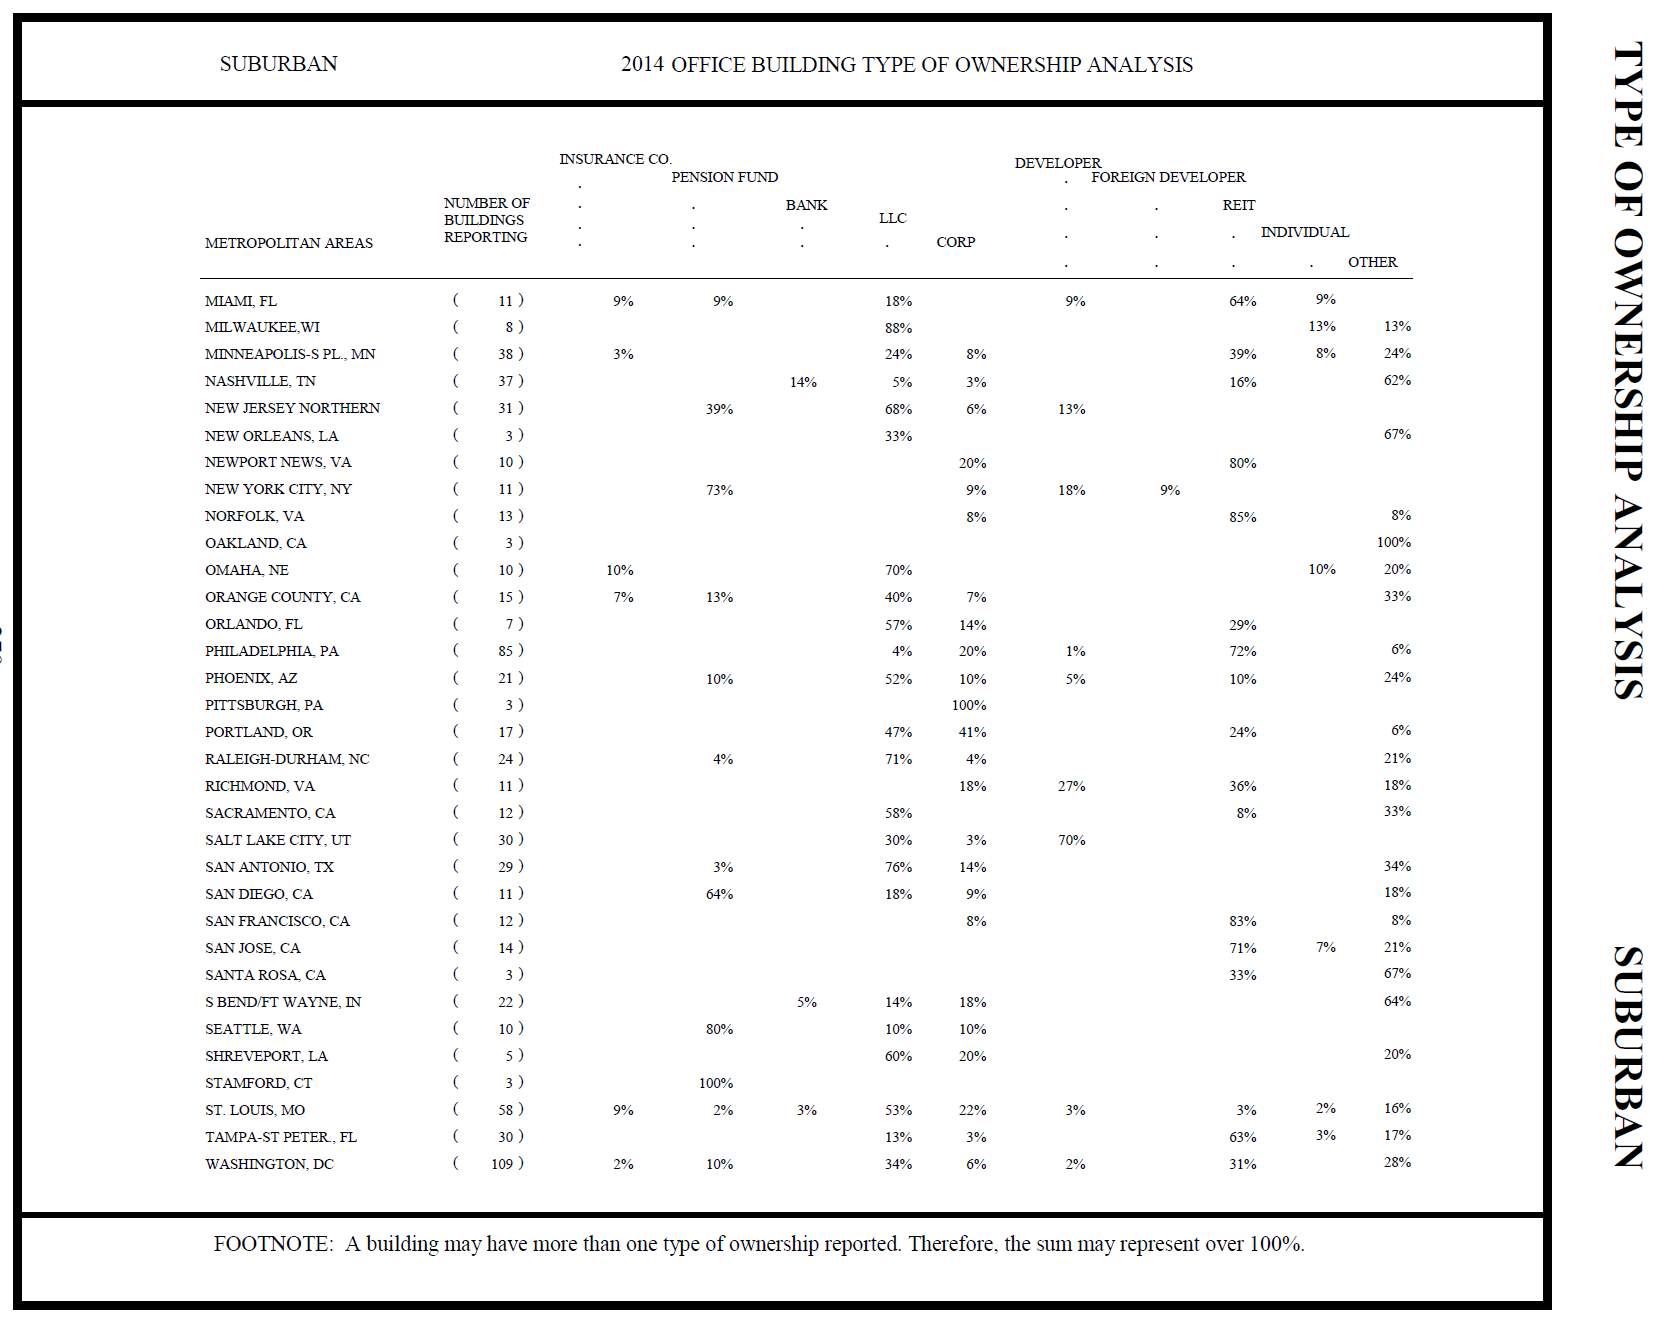
Figure 58 US Office Market (All Classes) Key Metrics by Major Metropolitan Area (Source: Colliers Intl)
Annex 1 (Continued)
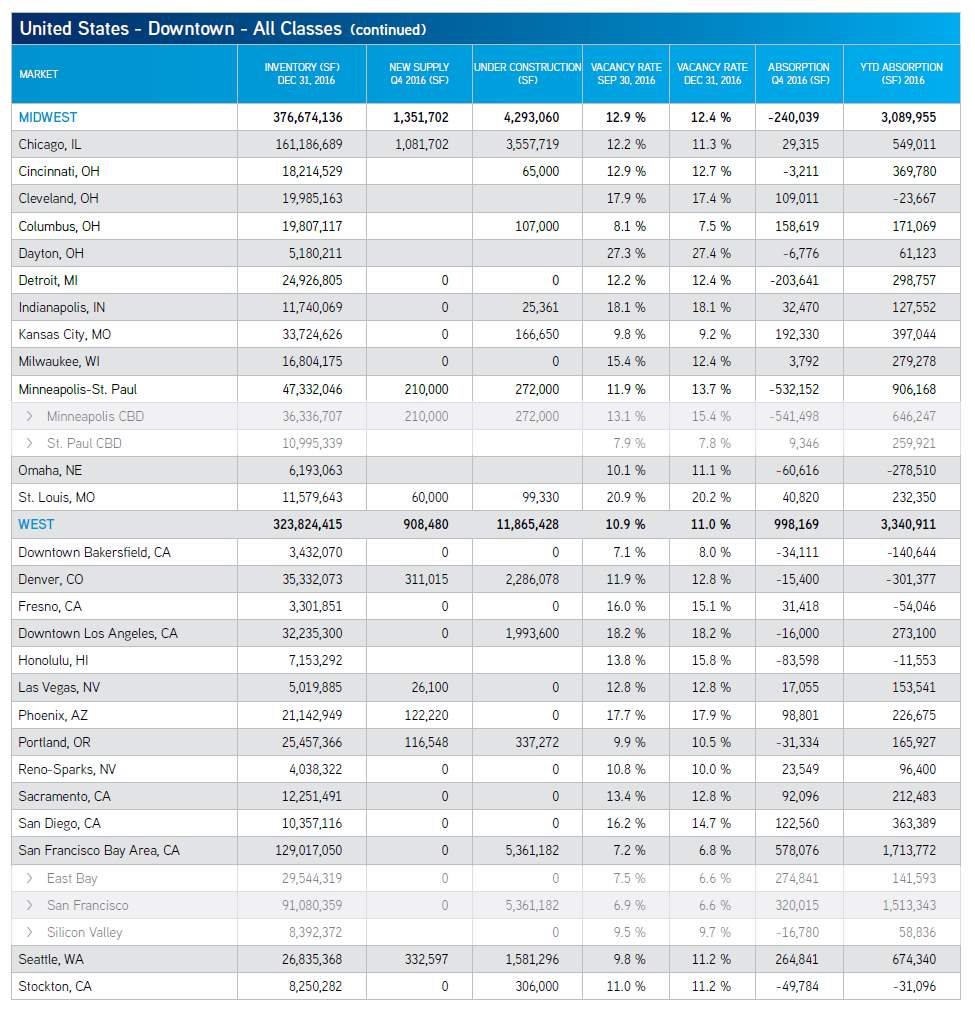
Figure 59 US Office Market Downtown (All Classes) Key Metrics by Major Metropolitan Area (Source: Colliers Intl)
Annex 1 (Continued)
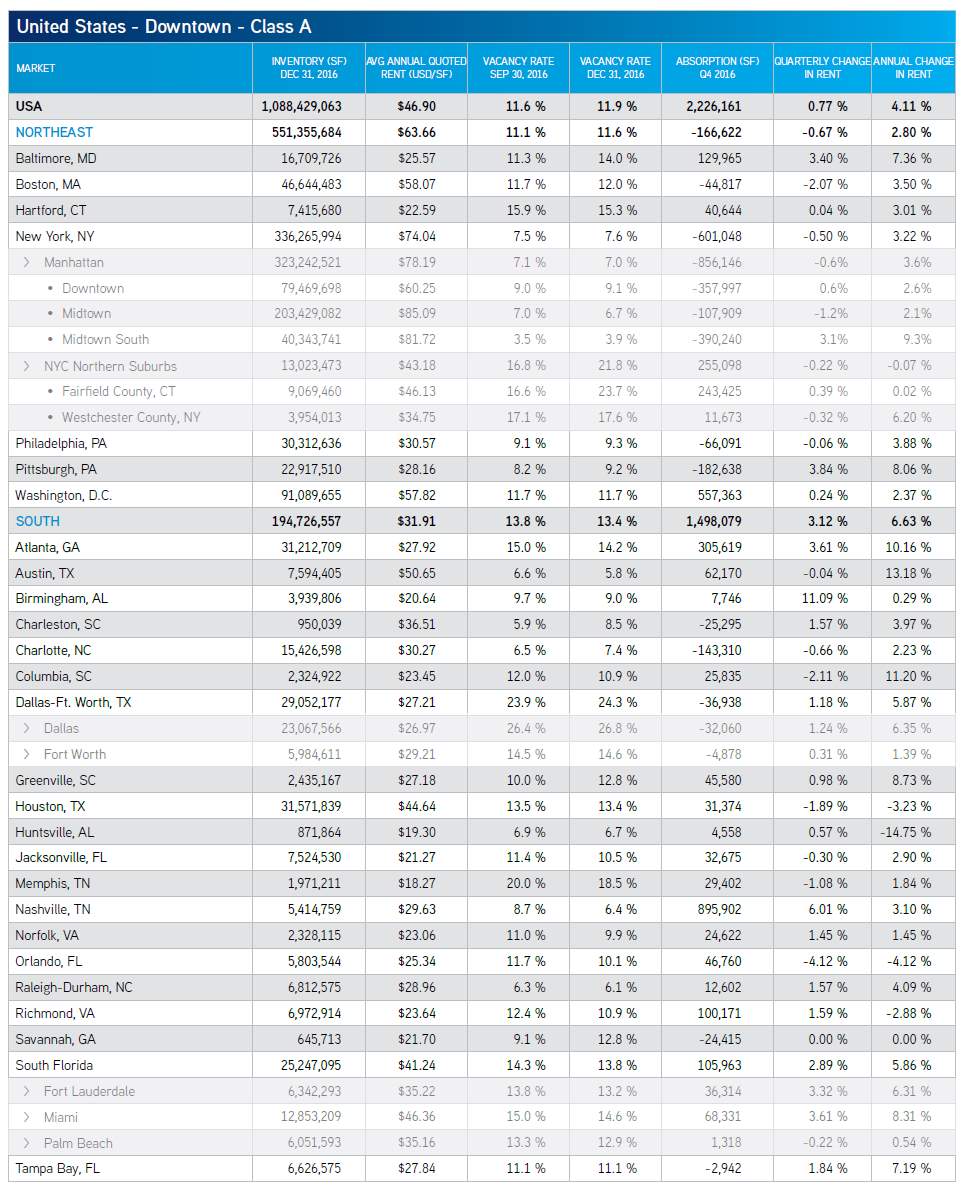
Figure 60 US Office Market Downtown (Class A) Key Metrics by Major Metropolitan Area (Source: Colliers Intl)
Annex 1 (Continued) 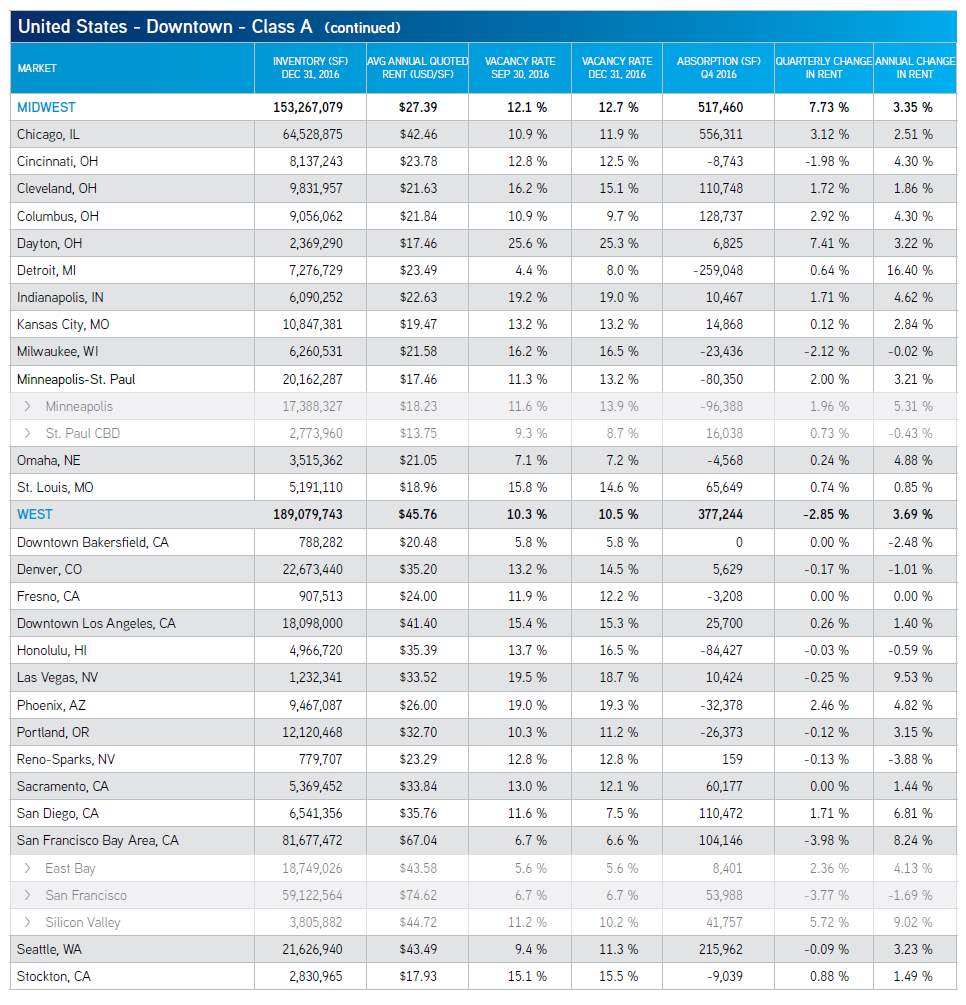
Figure 61 US Office Market Downtown (Class A) Key Metrics by Major Metropolitan Area (Source: Colliers Intl)
Annex 1 (Continued) 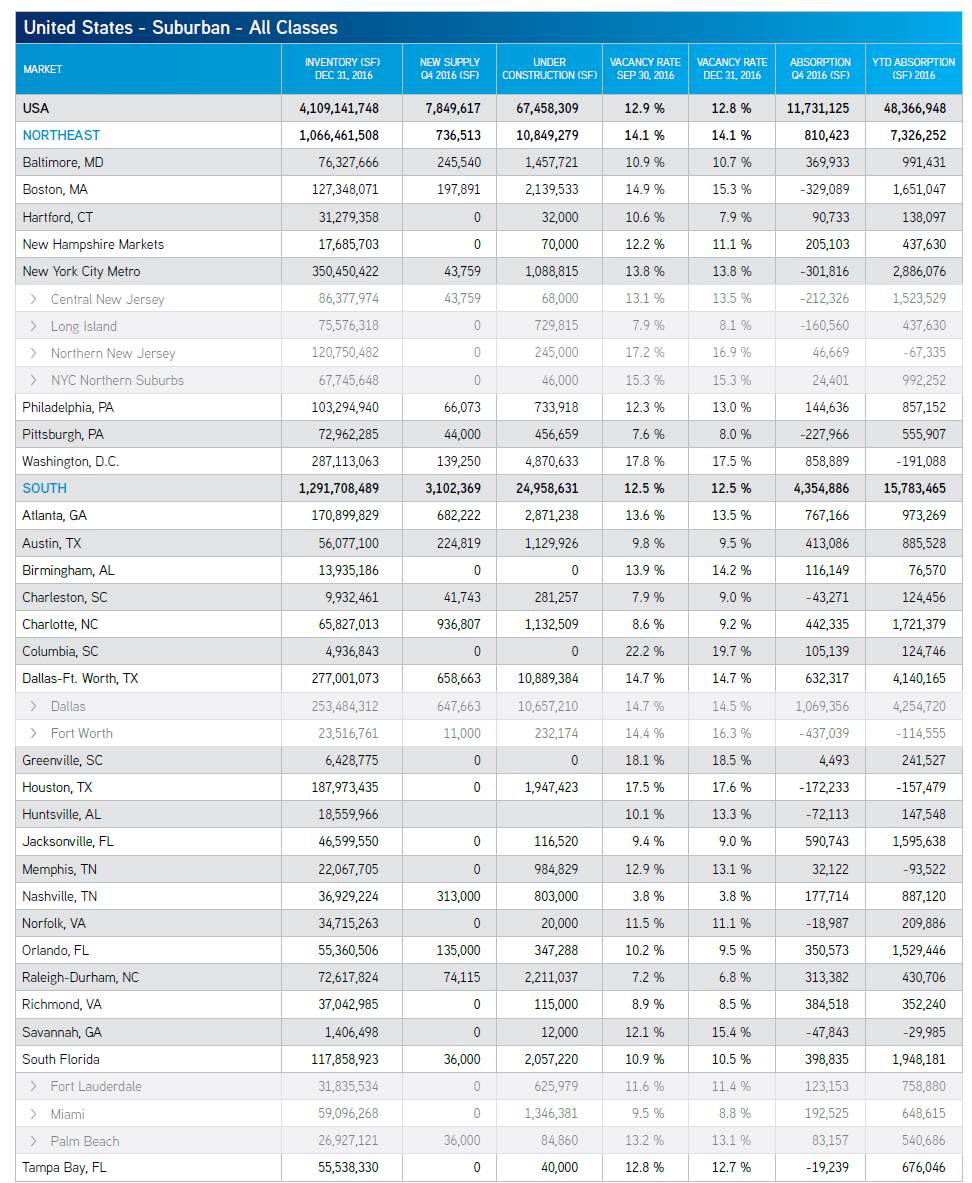
Figure 62 US Office Market Suburbs (All Classes) Key Metrics by Major Metropolitan Area (Source: Colliers Intl)
Annex 1 (Continued)
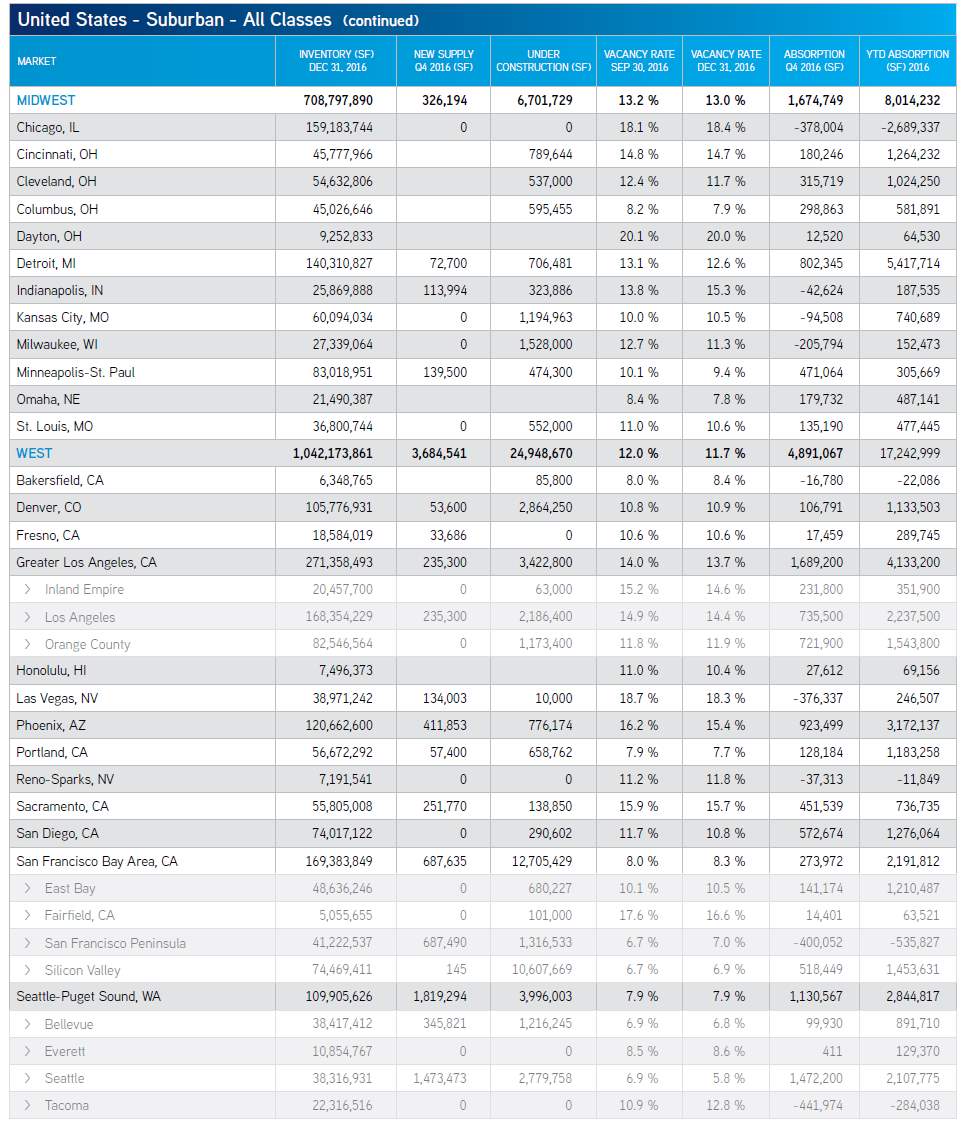
Figure 63 US Office Market Suburbs (All Classes) Key Metrics by Major Metropolitan Area (Source: Colliers Intl)
Annex 1 (Continued)
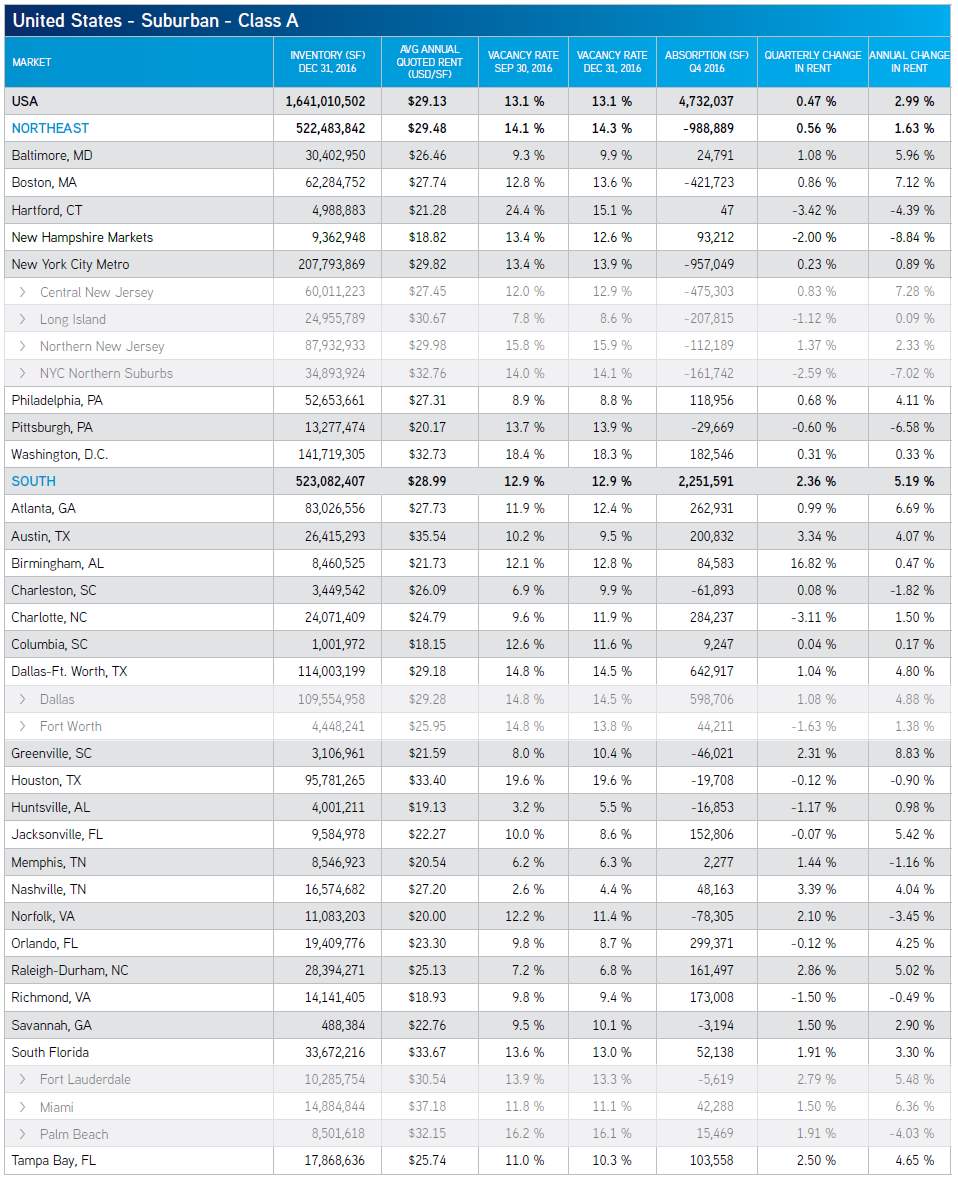
Figure 64 US Office Market Suburbs (Class A) Key Metrics by Major Metropolitan Area (Source: Colliers Intl)
Annex 1 (Continued)
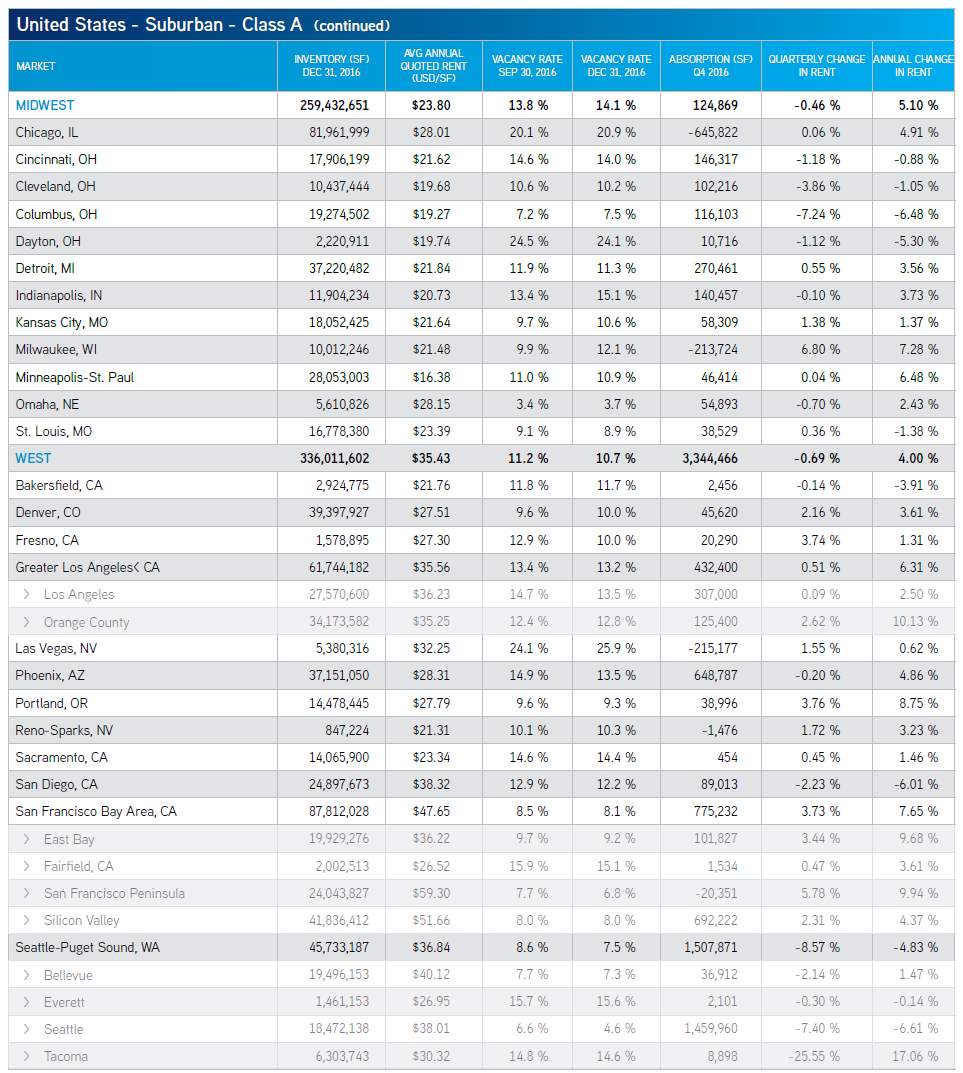
Figure 65 US Office Market Suburbs (Class A) Key Metrics by Major Metropolitan Area (Source: Colliers Intl)
Annex 2
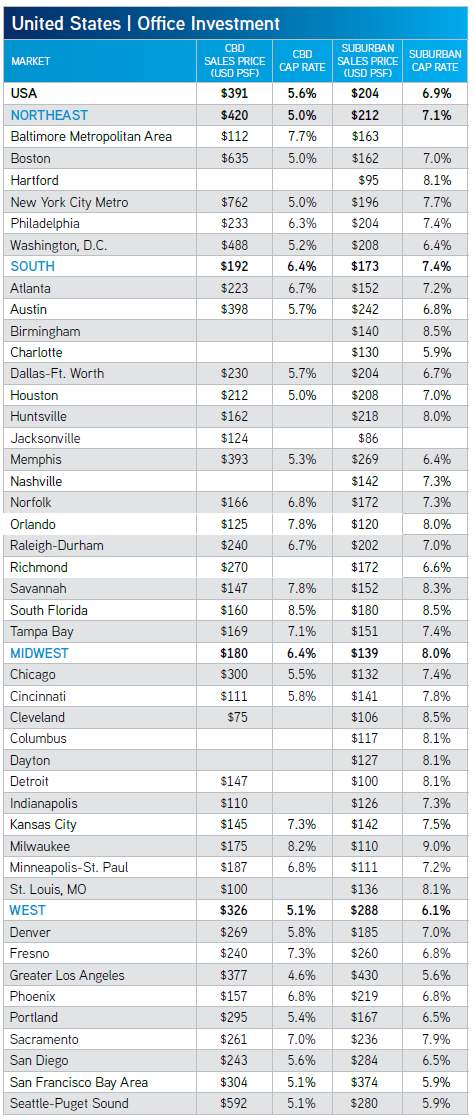
Figure 66 US Office Market Sales, Cap Rate, Downtown vs. Suburbs (Source: Colliers Intl)
Annex 3

Figure 67 Colliers International National Office Property Index
Annex 4
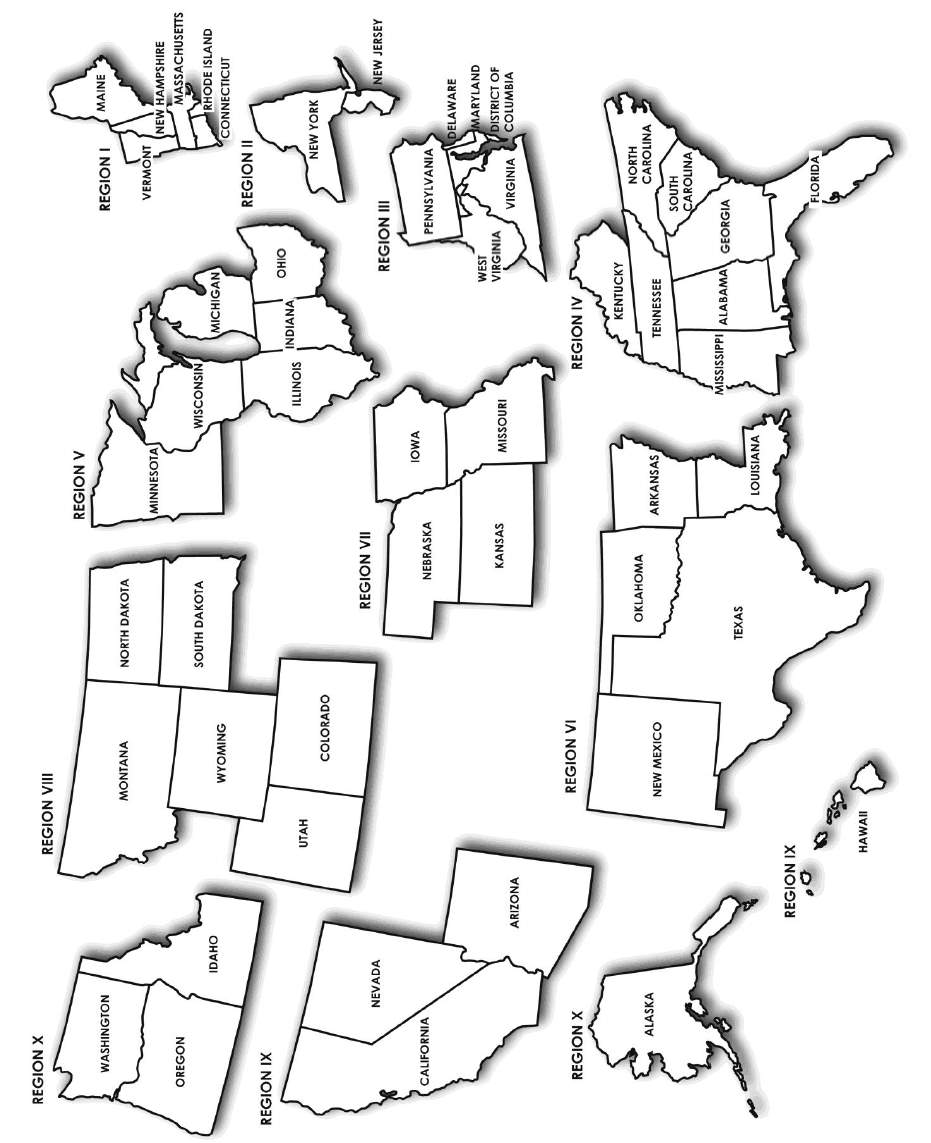
Figure 68 Institute of Real Estate Management Regional Breakdown (Source: IREM, 2015)
Annex 5
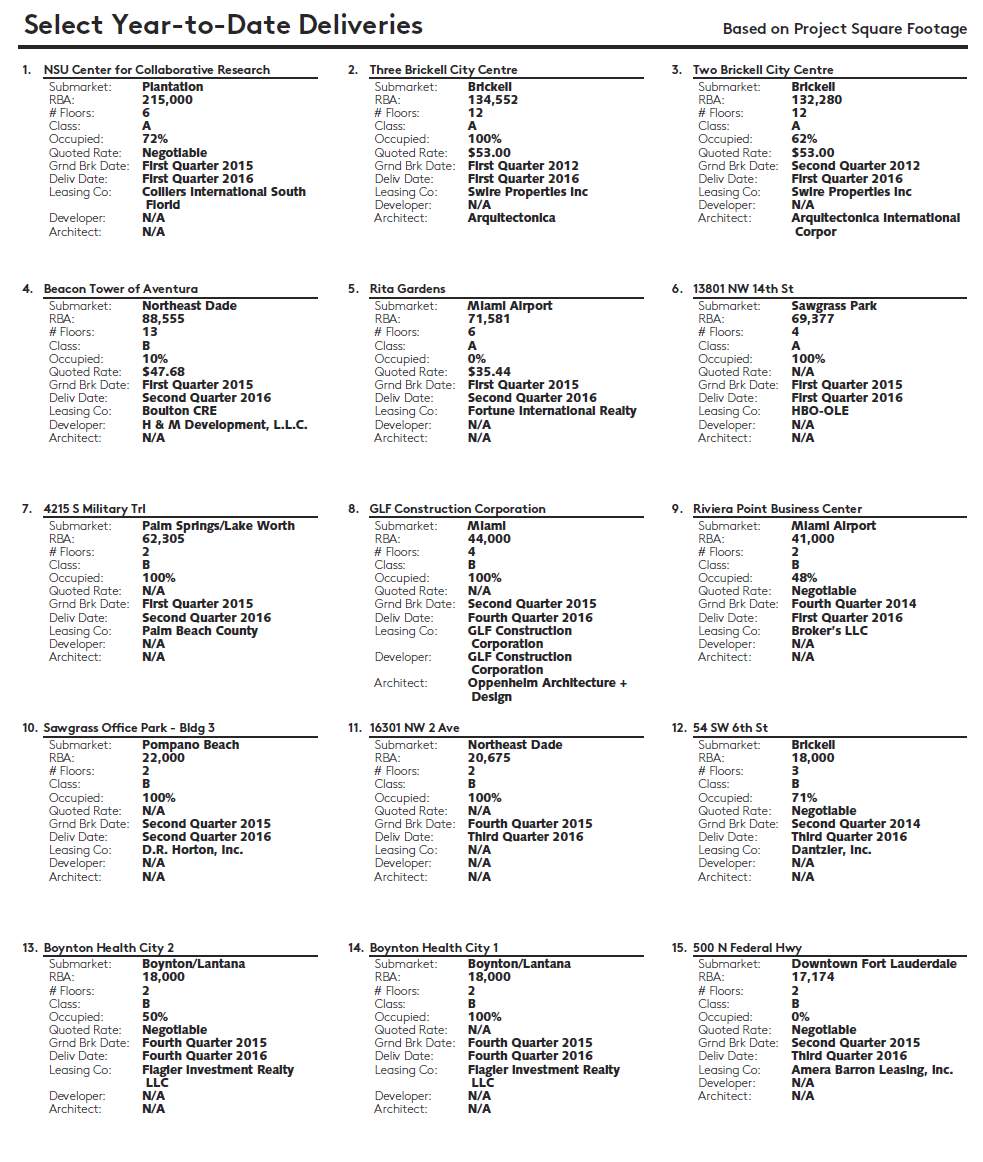
Figure 69 South Florida Office Select 2016 Deliveries (Source: CoStar)
Annex 5 (Continued)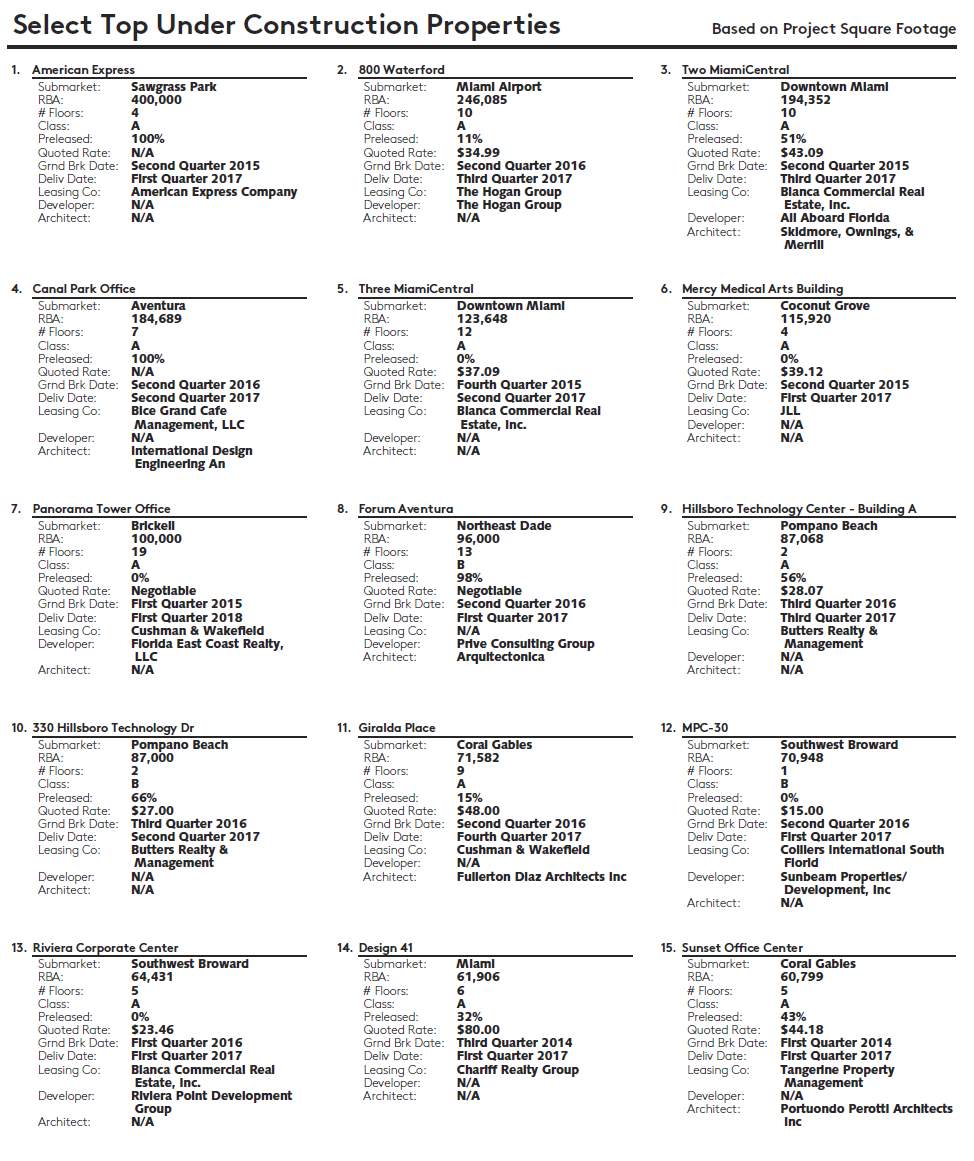
Figure 70 South Florida Office Under Construction Properties 2016 (Source: CoSttar)
Annex 6
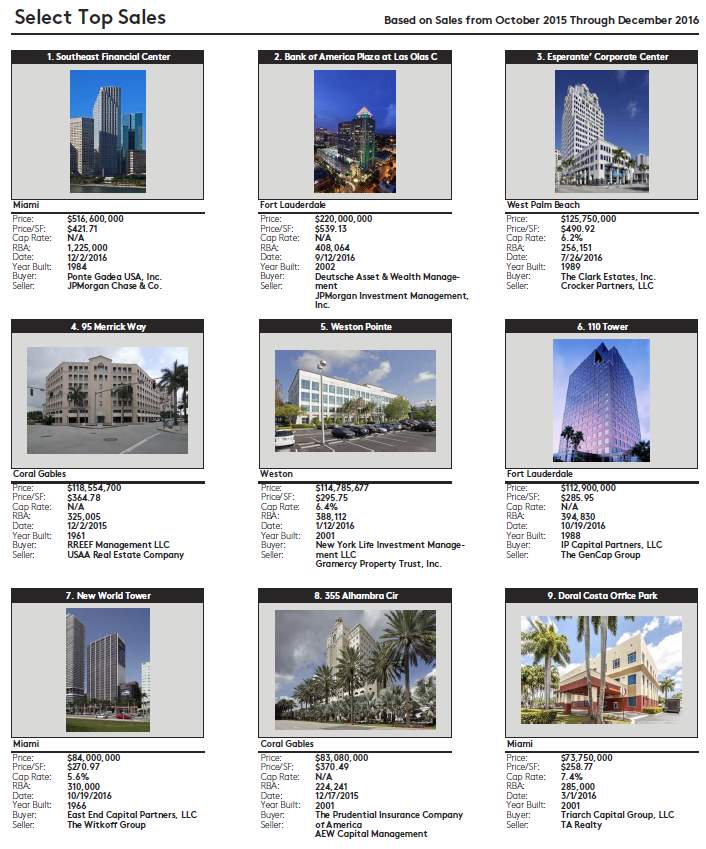
Figure 71 South Florida Office Market Select Top Sales of 2016 (Source: CoStar)
References
Amadeo, K. (n.d.). The Balance – Today’s Fed Funds Rate Is 1.0 Percent. Retrieved April 02, 2017, from https://www.thebalance.com/current-federal-reserve-interest-rates-3305694
BCNEWORK (2014) Workplace design trends: Make way for the Millennials. Retrieved April 04, 2017, from https://www.bdcnetwork.com/workplace-design-trends-make-way-millennials
BEA (n.d.) US Department of Commerce, BEA, Bureau of Economic Analysis. (n.d.). Bureau of Economic Analysis. Retrieved April 02, 2017, from https://www.bea.gov/newsreleases/glance.htm
BOMA (n.d.) Building Class Definitions. Retrieved April 03, 2017, from http://www.boma.org/research/pages/building-class-definitions.aspx
CAPEX (2017) Capital Expenditure CAPEX Defined Explained Compared to OPEX. M. S. (2017, April 01). Retrieved April 04, 2017, from https://www.business-case-analysis.com/capital-expenditure.html
Colliers Intl (2016) Despite Slowing Growth, Further Upside Remains for U.S. Office Market, & Fill out this short form and we’ll connect you right away. Q4 2016 U.S. Office Market Outlook Report. Retrieved April 02, 2017, from http://www.colliers.com/en-us/us/insights/marketnews/2016-q4-us-office-report
CoStar (n.d.) The Knowledge Market. Retrieved March 30, 2017, from http://property.CoStar.com/Property/Detail/Detail.aspx?ID=9530851&Results=0
FRED (n.d.) Federal Reserve Economic Data | FRED | St. Louis Fed. (n.d.). Retrieved April 02, 2017, from https://fred.stlouisfed.org/
Hussman, J. (2017) Hussman Funds – Weekly Market Comment: Expect the S&P 500 to Underperform Risk-Free T-Bills Over the Coming 10-12 Years – (n.d.). Retrieved April 02, 2017, from http://www.hussmanfunds.com/wmc/wmc170320.htm
IREM (2015) Income/ expense analysis 2015: Office Buildings. Place of publication not identified: Inst Of Real Estate Management.
Kiplinger (2017) – Business Spending to Break Out of Stall in 2017. Retrieved April 01, 2017, from http://www.kiplinger.com/article/business/T019-C000-S010-business-spending-forecast.html
Light, L. (2017). Why rising bond rates may be a threat to stocks. Retrieved April 02, 2017, from http://www.cbsnews.com/news/rising-bond-rates-threat-to-stocks/
Marcus & Millichap. (n.d.). Retrieved April 02, 2017, from http://www.marcusmillichap.com/research/researchreports/reports/2017/03/01/office-investment-forecast
Peiser & Hamilton (2012).Professional real estate development: the ULI guide to the business. Washington, DC: Urban Land Institute.
Russell, K. (2017). Why the Fed Raised Rates for the Third Time. Retrieved April 01, 2017, from https://www.nytimes.com/interactive/2017/03/15/business/federal-reserve-interest-rates.html
Short, D. (2017). February Real Median Household Income: Higher In February. Retrieved April 02, 2017, from https://seekingalpha.com/article/4059357-february-real-median-household-income-higher-february
Tradingeconomics (n.d.) United States Government Spending Forecast 2016-2020. Retrieved April 02, 2017, from http://www.tradingeconomics.com/united-states/government-spending/forecast
Tradingeconomics (n.d.) United States Inflation Rate | 1914-2017 | Data | Chart | Calendar. Retrieved April 02, 2017, from http://www.tradingeconomics.com/united-states/inflation-cpi
Cite This Work
To export a reference to this article please select a referencing stye below:
Related Services
View allRelated Content
All TagsContent relating to: "Real Estate"
Real estate consists of land and the buildings and natural features or resources upon it or attached to it, such as trees, water, bridges, fences etc.
Related Articles
DMCA / Removal Request
If you are the original writer of this dissertation and no longer wish to have your work published on the UKDiss.com website then please:

