Prevention of Erectile Dysfunction from Diabetes Mellitus
Info: 25558 words (102 pages) Dissertation
Published: 4th Feb 2022
Tagged: DiabetesBiomedical Science
Abbreviations
| ACH | Acetylcholine |
| AGEs | Advanced Glycation End Products |
| Ca2+ | Calcium |
| CAD | Coronary Artery Disease |
| cDNA | Complementary Deoxyribonucleic Acid |
| cGMP | Cyclic Guanosine Monophosphate |
| CGRP | Calcitonin-Gene-Related Peptide |
| CT | Threshold Cycle |
| CVOD | Corporal Veno-Occlusive Dysfunction |
| DAAH | Diamethylarginine Dimethylaminohydrolases |
| DM | Diabetes Mellitus |
| DNA | Deoxyribonucleic Acid |
| ECM | Extracellular Matrix |
| ED | Erection Dysfunction |
| EM | Electron Microscopy |
| eNOS | Endothelial Nitric Oxide Synthase |
| EPC | Endothelial Progenitor Cells |
| FDA | Food and Drug Administration |
| GAPDH | Glyceraldehyde 3-Phosphate Dehydrogenase |
| H&E | Hematoxylin and Eosin |
| HPF | High Power Field |
| HTN | Hypertension |
| Hz | Hertz |
| ICI | Intracorporeal Injection |
| ICP | Intracavernosal Pressure |
| IDF | International Diabetes Federation |
| IL | Interleukin |
| iNOS | Inducible Nitric Oxide Synthase |
| K+ | Potassium |
| LUTS | Lower Urinary Tract Symptoms |
| mA | Milliampere |
| MAP | Mean Arterial Blood Pressure |
| mm | Millimeter |
| MMP | Matrix Metalloproteinase |
| mRNA | Messenger Ribonucleic Acid |
| ms | Millisecond |
| NCD | Non-Communicable Diseases |
| nNOS | Neuronal Nitric Oxide Synthase |
| NO | Nitric Oxide |
| NOS | Nitric Oxide Synthase |
| NRC | National Research Council |
| O2− | Superoxide |
| PD | Peyronie’s Disease |
| PDE | Phosphodiesterase |
| PDE5I | Phosphodiesterase 5 Inhibitor |
| PG | Prostaglandin |
| PSV | Peak Systolic Velocity |
| qRT-PCR | Quantitative Real-Time Polymerase Chain Reaction |
| RNA | Ribonucleic Acid |
| ROS | Reactive Oxygen Species |
| RT | Reverse Transcription |
| RT-PCR | Reverse Transcription-Polymerase Chain Reaction |
| SEM | Standard Error of Mean |
| SM | Smooth Muscle |
| SMC | Smooth Muscle Cell |
| SOD | Superoxide Dismutase |
| SPSS | Statistical Package for the Social Sciences |
| STZ | Streptozotocin |
| T | Testosterone |
| TEM | Transmission Electron Microscopy |
| TGF-β | Transforming Growth Factor-Beta |
| TNF-α | Tumor Necrosis Factor-Alpha |
| UNG | Uracil-N Glycosylase |
| UV | Ultraviolet |
| VIP | Vasoactive Intestinal Polypeptide |
| VSM | Vascular Smooth Muscle |
| WHO | World Health Organization |
Table of Contents
Click to expand Table of Contents
Introduction and Rationale
Aim of the work
Review of Literature
I. Epidemiology of erectile dysfunction:
II. Physiology and Pathophysiology of erectile function:
1. Physiology of Penile Erection
2. Pathophysiology of Erectile Dysfunction
III. Diabetes mellitus and erectile dysfunction:
IV. Erectile pathophysiology in animal model of DM
V. Effect of PDE5I on animal model of DM:
VI. Effects of PDE5Is on endothelial function in diabetes-related ED
VII. Effect of chronic low dose PDE5I administration on ED-associated DM:
Materials and methods
I. Functional evaluation:
II. Histopathologic and ultrastructural examination:
o Histopathology:
o Transmission electron microscopy and ultrastructural assessment:
III. Molecular biology:
Sample size
Statistical analysis
Ethical considerations
Results
Discussion
Summary
Conclusion
Recommendations
References
Appendix
Appendix I: Endogenous control (GAPDH) amplification Plot
Appendix II: nNOS TaqMan® gene expression assay
Appendix III: iNOS TaqMan® gene expression assay
Appendix IV: eNOS TaqMan® gene expression assay
Appendix V: TGF-β1 TaqMan® gene expression assay
List of Tables
Table 1: differences in ICP measurements normalized to MAP
List of Figures
Figure 1: Results of ICP measurement
Figure 2: Histopathologic changes by light microscopy (H&E sections)
Figure 3:Histopathologic changes by light microscopy (Masson Trichrome sections)
Figure 4: SM to collagen ratio
Figure 5:Cavernosal SM ultrastructure by electron microscopy
Figure 6:Endothelial ultrastructure by electron microscopy
Figure 7: Neuronal ultrastructure by electron microscopy
Figure 8: GAPDH endogenous control gene expression
Figure 9: iNOS gene expression
Figure 10: nNOS gene expression
Figure 11: eNOS gene expression
Figure 12: TGF-β1 gene expression
Figure 13: NOS isoforms and TGF-β1 gene expression profile
Introduction and Rationale
Erection dysfunction (ED), the inability to achieve and/or maintain an erection sufficient to permit satisfactory sexual intercourse (NIH, 1993), is associated with specific comorbidities such as cardiovascular disease, hypertension, diabetes mellitus (DM), lower urinary tract symptoms (LUTS), prostate cancer, depression, and obesity. ED associated with diabetes was demonstrated to be strongly related to its severity, duration, and microvascular complications (El-Sakka et al., 1999; Levy, 2002; Malavige and Levy, 2009; Glina, 2013).
ED is a prevalent global clinical problem. Approximately thirty million men are affected in the USA, with an annual increase in the diagnosis of new cases estimated by tens of thousands. Overall, the incidence of ED in the 40-70 years of age population is 52% (Feldman et al., 1994). Nevertheless, DM patients are diagnosed with ED at an earlier age, with a 78% prevalence; 6, 36 and 36% for mild, moderate and severe ED (Hakim and Goldstein, 1996; Meena et al., 2009; Seid et al., 2017).
Recent regional study stated that 86.1% of patients with type II DM had variable degrees of ED, 7.7%, 29.4% and 49.1%. for mild, moderate and severe degrees of ED. Moreover, prolonged history of DM >10 years tripled the incidence of ED compared to those who have the disease for El-Sakka and Tayeb, 2003).
The pathophysiology of ED associated with DM is multifactorial; including neuropathy and arteriopathy, where impaired neural and endothelium-dependent mechanisms alter normal corporal smooth muscle relaxation. In addition, DM leads to abnormal endothelial function, decreased nitric oxide synthase (NOS) activity, oxidative stress-mediated neurovascular alterations, and increased cavernous tissue apoptosis (Neves, 2013). In the majority of these patients, abnormal smooth muscle responsiveness may be the underlying cause, leading to penile arterial insufficiency and venous leakage (Fuchs et al., 1989; Tamás and Kempler, 2014).
Penile erection is manifested by the transformation of erectile tissue and vasculature from a state of minimally perfused flaccidity into an engorged one and mediated by a multifaceted succession of neural and vascular components, coupled with hormonal and psychologic factors. Vascular smooth muscle relaxation vasodilates arterioles and trabecular smooth muscle sinusoids which increase penile blood flow that result in compression of subtunical venules against the tunica albuginea and occlude the venous outflow (Carson and Lue, 2005; Gratzke et al., 2010).
DM produces both abnormal corporal smooth muscle cell (SMC) relaxation and generalized fibrosis of arterial media; these processes seem to uniformly underlie corporal veno-occlusive dysfunction (CVOD) (El-Sakka and Yassin, 2010).
Many classifications have been proposed for ED; the classification that integrates the various causes of ED with erectile physiology and functional anatomy is the recommended one. (Carrier et al., 1993). Clinically, an older patient with a long history of DM and vascular disease is likely to have ED secondary to vascular and neuropathic disease (El-Sakka, 2012; Glina et al., 2013).
The nitric oxide (NO)-cyclic guanosine monophosphate (cGMP) signaling pathway plays a critical role in the physiology of penile erection and in the pharmacological management of ED. Thus, NO produced by constitutive neuronal and endothelial NOS is released from nerves (nNOS) and endothelium (eNOS) upon sexual stimulation and relaxes corpus cavernosum and arterial smooth muscle to increase blood flow to the cavernous sinusoids and elicit penile erection (Burnett et al., 1992; Prieto, 2008).
The role of transforming growth factor-beta (TGF-β) is involved in numerous vital processes including inflammation, stimulation of intercellular matrix formation, production of fibroblasts, and normal healing. While growing evidence implicates TGF-β as a cytokine, vital to tissue repair, its excessive action may be responsible for tissue damage caused by scarring in many serious diseases (Ul-Hasan et al., 1998; El-Sakka et al., 1999). The pathological consequences of the action of TGF-β have been referred to as the ‘dark side’ of tissue repair (Border and Ruoslahti, 1992). DM-associated ED is associated with increased extracellular matrix deposition that could be due to increase of cytokines such as TGF-β and reduced smooth muscle content in the corpus cavernosum. The mechanisms of these processes are not well-understood (El-Sakka et al., 1999; Zhou et al., 2012).
Phosphodiesterases (PDEs) are distributed throughout various tissues; primarily in the vascular, visceral and pulmonary smooth muscles. In the penis, PDE-5 causes breakdown of cGMP, where its inhibition increases its bioavailability facilitating NO-mediated relaxation of erectile smooth muscle with sexual stimulation. (Beavo, 1995).
Conventional Phosphodiesterase 5 inhibitors (PDE5Is) include sildenafil, vardenafil, tadalafil and avanafil. New PDE5Is include udenafil and mirodenafil. PDE5Is exhibit analogous modes of action. However, they vary in their pharmacodynamics and pharmacokinetics. Sildenafil was Food and Drug Administration (FDA)-approved in 1998, vardenafil and tadalafil in 2003 and avanafil in 2012. Vardenafil is the most potent of the three in inhibiting PDE5 activity while tadalafil was reported to have extended plasma half-life up to 18 h as compared to 3–4 h in the case of sildenafil and vardenafil (Wright, 2006; Ismail and El-Sakka, 2016, 2017).
Vardenafil was effective in treating DM-induced ED with the greatest effect achieved through chronic dosing; with no additive effect measured with the final acute dose (De Young et al., 2008). Changes noted in the histology and protein expression indicate that vardenafil may have a protective effect in this disease state. Furthermore, vardenafil is a candidate therapy for the rehabilitation of patients with DM (Ferrini et al., 2006). Furthermore, recent study investigated the functional and structural changes of penile cavernous tissue after administration of low-dose tadalafil. They concluded that low-dose chronic administration of tadalafil is associated with structural and functional improvement of erection (Mostafa et al., 2013).
Rationale: due to the inability to collect human samples to investigate the effect of early versus late administration of vardenafil in DM patients with ED, this fact prompted us to investigate this effect in a rat model.
Aim of the work
To determine the possible prevention of deleterious consequences of DM on erectile function with administration of PDE5 inhibitors.
Study Objectives
Primary objective
To investigate the effect of early versus late administration of vardenafil on erectile function in a rat model of diabetes.
Secondary objective
To identify Intracavernosal pressure (ICP), histopathological and ultrastructural changes, plus eNOS, nNOS, inducible (iNOS) and TGF-β1 genes expression in a rat model of diabetes after early versus late administration of vardenafil.
Study question
Does early administration of vardenafil prevent ED in a rat model of diabetes?
Study hypothesis
Early administration of vardenafil will prevent ED in a rat model of diabetes.
Review of Literature
I. Epidemiology of erectile dysfunction
ED is a prevalent worldwide clinical condition that will be escalated up to 322 million by 2025, compared to 152 million in 1995 (McKinlay, 2000; El-Sakka, 2017). ED is prevalent in the middle-east community and reach up to 92.6% in those individuals. In addition, about 50.8% of patients with sexual disorders presented with premature ejaculation and 7.6% presented with low sexual desire. Moreover, 80% had organic and 20% had psychogenic causes of ED. Mild, moderate and severe ED was diagnosed in 10%, 40% and 5% respectively (Brock, 2000; El-Sakka, 2004).
The prevalence rate of ED was reported 63.6%, in Egypt, 57.4% in Nigeria and 80.8% in Pakistan (Seyam et al., 2003; Shaeer et al., 2003). Consequently, There have been a phenomenal improvement in the diagnosis and treatment of ED in the last three decades (Ismail and El-Sakka, 2016, 2017; El-Sakka, 2017).
II. Physiology and Pathophysiology of erectile function:
1. Physiology of Penile Erection
The cornerstone of erectile function is an incorporated process of vascular and neural functions that promote trabecular smooth muscle relaxation, leading to distention of sinusoidal spaces and blood inflow into corpora cavernosa, facilitating penile erection. This process employs mechanical compression of emissary veins integrated in the tunica albuginea causing impedance of blood flow that eventually results in penile erection (El-Sakka and Lue, 2004). Autonomic nervous system delivers sympathetic (T12–L2) and parasympathetic (S2–S4) innervation to pelvic plexus, counting the cavernous nerves. Autonomic nerve fibers are responsible for NO delivery that results in trabecular smooth muscle (SM) relaxation (Andersson and Wagner, 1995; Burnett, 1997).
Acetylcholine (ACH) is essential for ganglionic transmission (via nicotinic receptors) and vascular SM relaxation (via muscarinic receptors). Cholinergic nerves were identified within cavernous SM and neighboring penile arteries. ACH stimulates NO release from endothelial cells and potentiates direct SM relaxation during erection (Sáenz de Tejada et al., 1988)
Vasoactive intestinal polypeptide VIP is one of the neurotransmitters involved in penile erection. Immune-reactive VIP nerve fibers were identified inside the cavernous trabeculae and surrounding cavernosal arteries. Cavernosal SM relaxation is blocked by VIP antagonists (Kim et al., 1995). Other neurotransmitters include calcitonin-gene-related peptide (CGRP) (Stief et al., 1990), histidine methionine peptide (Kirkeby et al., 1992), pituitary adenylate cyclase activating polypeptide (Hedlund et al., 1994) 32 and prostaglandins (PGs) (Saenz de Tejada et al., 1989). Density of prostaglandin E1 receptor is decreased in men with ED (Aboseif et al., 1993). Vascular tone’s neural-endothelial control and neuromodulators/neurotransmitters interactions at neuromuscular junction have been also investigated (Andersson and Holmquist, 1994).
NO stimulates guanylate cyclase production of cGMP; this reduces cytosolic calcium concentration and eventually facilitates trabecular SM relaxation and increase blood flow into sinusoidal spaces (Sáenz de Tejada, 2002). This pathway is reversed by PDE5 enzymes by cGMP inactivating, resulting in cytosolic calcium concentration and smooth-muscle contraction. Sacral spinal cord provides motor nerve supply through pudendal nerve innervation. Pudendal nerve fibers join the ischio-cavernosus and bulbo-cavernosus muscles (Stief et al., 1998).
Sympathetic stimulation results in detumescence via cavernous smooth-muscle contraction, while cholinergic stimulation may facilitate erection through sympathetic inhibition in addition to endothelial NO release (Sáenz de Tejada et al., 1988). Corporeal SM relaxation is essential for normal erectile function, and evidence implicated that nNOS and eNOS are the principal mediators of SM muscle relaxation (Hurt et al., 2002). NO is synthesized from the precursor, L-arginine substrate via the catalytic activity NOS enzyme (Rajfer et al., 1992).
Penile erection is essentially a neurovascular mechanism that primarily requires initiation followed by maintenance of tumescence through corporeal SM relaxation and increased blood flow to the penis. The production and release of NO (by endothelial cells and nitrergic nerves) are widely accepted to be the pacemaker of physiological erection; depending on NO-cGMP signaling transduction pathway. If any factor involved in this cascade is affected, ED ultimately will occurs (Burnett and Musicki, 2005).
cGMP upregulation facilitates SM relaxation, through cGMP-dependent protein kinase activation. Consequently, Potassium (K+) channel activity increase and intracellular calcium (Ca2+) concentrations decreases (Bivalacqua et al., 2003).
Lack of the number of NOS-containing nerve fibers, NOS activity and endothelial SM relaxation impairment are the major contributing factor to ED in DM patients. Some studies established that eNOS and nNOS downregulation of their protein and gene expression in DM animal models are the main factors of erectile function impairment (Bivalacqua et al., 2001)
Meanwhile, these researches recognized a possible mechanism for ED development in DM patients; that is a decrease in production of NO, through reduction in nNOS and eNOS in corporeal vasculature (Akingba and Burnett, 2001).
Genetic studies have successfully implicated methods of increasing the transduction of a desired gene through gene transfer technologies. Gene transfer enhances gene expression and the functional activity of the desired gene. nNOS and eNOS gene transfer into penile tissue, vehicle on adenovirus has effectively reversed age-related ED in a rat model (Thomas R Magee et al., 2002).
Previous studies showed that NOS isoforms gene transfer can enhance physiological profile of penile tumescence in vivo; thereby, NOS expression improved ED associated with NOS downregulation. The effects of eNOS gene transfer into the penis of STZ-induced DM rats was being investigated; and it was concluded that erectile function could be improved if NO expression is restored (T R Magee et al., 2002). eNOS is an essential element of erectile function; it has the capability of inducing vasodilation and inhibition of vasoconstriction (Montorsi et al., 2004).
On the other hand, testosterone (T) directly affects endothelial function. NO is the pacemaker of endothelial function; its bioavailability is markedly decreased with T deprivation. Therefore, T may possess direct influence on endothelial function and migrating endothelial progenitor cells (EPC) (El-Sakka, 2017).
TGF-β1 molecule is isolated from platelets, human placenta and bovine kidney. It has a (25kD) homodimer molecular composition (Sporn and Roberts, 1992).
TGF-β1 action in tissue repair process, involves a complexed sequences of cytokine production, monocyte chemoattraction, angiogenesis and additional inflammatory mediators (Border and Ruoslahti, 1992). Moreover, TGF-β1 triggers matrix components synthesis; including tenascin, proteoglycans, collagens and fibroactin (Balza et al., 1988). In the same time, it concomitantly blocks matrix degradation by blocking protease synthesis and stimulating proteases inhibitors leading to accumulation of extracellular matrix (ECM) deposition at tissue injury site, This results into fibrosis and scarring. Moreover, TGF-β has the ability to self-control its own production; this may be the key to persistence of fibrosis and scarring (Border and Ruoslahti, 1992).
Previous studies had demonstrated the role of TGF-β in a rat model of Peyronie’s disease. they found that TGF-β2 and TGF-β3 had no remarkable protein expression, while TGF-β1 gene expression in the cytomodulin-injected rats was noted after 2 weeks post-induction (El-Sakka et al., 1997a, 1997b; El-Sakka et al., 1998).
From a similar perspective, other authors investigated the role of TGF-β1 in a canine model of prolonged penile erection; they related an association between prolonged penile erection with a relatively increased TGF-β gene expression as a moderator of fibrosis; with a resultant structural and morphological changes in a short period of time, suggesting that early therapeutic intervention with agents that counteract TFG-β action may be a desirable treatment modality (El-Sakka et al., 1998).
Collectively, TGF-β1 Gene and its expression have been found to be elevated in animal models with fibrotic conditions in various tissues (e.g. lung and liver) (Balza et al., 1988; Castilla et al., 1991; El-Sakka et al., 1997); Nevertheless, some previous studies couldn’t elicit any difference in TGF-β1 gene expression in an animal model of diabetes compared to control. However, other growth factors may play a role in that perspective (El-Sakka et al., 1999).
2. Pathophysiology of Erectile Dysfunction
There was a previous thinking referred ED to psychogenic causes only, especially in younger population. However, with the advances of ED research, it is strongly believed now that there are other organic causes contribute to ED such as hormonal, neural, pharmacological and penile factors specifically in older patients (Fazio and Brock, 2004).
Some neurologic disorders are associated with ED, including multiple sclerosis (MS), stroke, epilepsy, Alzheimer’s disease, Parkinson’s disease, spinal cord injury and radical pelvic surgeries (e.g., radical prostatectomy) (Siddiqui et al., 2012).
Liver disease, prostate disease, LUTS, pelvic surgery and renal failure lead to exposure physical inactivity. Use of recreational drugs, caffeine consumption, drug addiction and pelvic surgery are also reported as risk factors associated with the pathophysiology of ED (El-Sakka, 2012a).
III. Diabetes mellitus and erectile dysfunction:
DM is a chronic disease characterized by absolute or relative deficiency of insulin, which consequentially lead to hyperglycemia. Prolonged hyperglycemia may lead to serious complications such as nephropathy, neuropathy and retinopathy and increased cardiovascular risk (Hyttinen et al., 2003).
A total of 4556 patients; 1494 from Egypt, 2162 from Saudi Arabia and 900 from the United Arab Emirates were observed for ED treatment with PDE5I. DM was the most frequent diagnosis in 76% of these patients, primarily type II DM (67.5 of all patients). Symptoms of peripheral neuropathy were the most commonly reported complications of DM. Hypertension was reported in 36.3% of patients, dyslipidemia in 66.7% and coronary heart disease in 15.7% of patients (El-Sakka et al., 2011)
Type II diabetes is associated with diminished beta cell compensation of insulin resistance that eventually lead to insulin deficiency. Lifestyle modification, exercise and weight reduction may improve Insulin resistance (Solomon et al., 2008). DM, dyslipidemia, arterial hypertension, depression and coronary artery disease (CAD) are the main risk factors for the development of ED (Glina, Sharlip and Hellstrom, 2013).
Latest estimates from the International Diabetes Federation (IDF) is that in 2015 there were 415 million people with DM worldwide. By 2040, this number is anticipated to rise to 642 million. World Health Organization (WHO) and non-communicable diseases (NCDs) risk factor collaboration provided a similar estimation of 422 million cases in 2014 (Zimmet et al., 2016)
Prevalence of both diagnosed and undiagnosed DM in Egyptian population aged more than 20 years is estimated to be 9.3% (Herman et al., 1995). Recent studies estimated the prevalence of type II DM in the Egyptian population approximately 15.6% of all adults (20-79) years of age (Hegazi et al., 2015). Several studies in the Middle East disclosed a more than 40% prevalence of ED. At least 5 Arab countries were counted in the worldwide top 10 countries with a high prevalence of DM (El-Sakka, 2012a).
ED is an independent risk factor for reduced quality of life in diabetic patients. The association between DM and ED was addressed as high as 75% in some populations with an increased incidence of ED in diabetic patients by 68 cases/1000 patients per year (Malavige et al., 2014).
El-Sakka and Tayeb stated that 86.1% of Type II diabetic patients had some degrees of ED; including 7.7%, 29.4% and 49.1%. for mild, moderate and severe ED respectively. Twenty five percent of DM patients below 50 years of age had ED, escalated to 75% in those >50 years of age. Seventy percent of whom without ED were 50 years (El-Sakka and Tayeb, 2003).
Prolonged history of DM >10 years was associated with a triple increase in the risk of ED development, this is less likely in those with a El-Sakka and Tayeb, 2003).
Penile doppler ultrasound changes were addressed in diabetic patients in the form of decreased peak systolic velocity (PSV) and poor response to intracorporeal injection (ICI) of vasoactive materials (El-Sakka, 2003).
Additional study evaluated the association between type II DM and Peyronie’s disease (PD) found an 8.1% prevalence of PD among a total of 1133 diabetic patients. Moreover, psychological disorders and dyslipidemia were associated with PD (El-Sakka and Tayeb, 2005). Another study concluded that type II DM and PD negatively affected the vascular status of erection, either solely and together (El-Sakka and Tayeb, 2009).
Pathogenesis of ED in diabetic patients is a multifactorial process associated with multiple endocrine, neuronal, hormonal, metabolic and vascular factors. Oxidative stress is also associated with endothelial and neuronal apoptosis leading to endothelial denudation and neuronal damage leading eventually to further depletion of NO (Russell et al., 2002). Moreover, superoxide employs calcium ion mobilization leading to direct vasoconstriction, possibly produce ED (Wan et al., 2010).
Dyslipidemia, obesity, metabolic syndrome, insulin resistance, hyperglycemia and other metabolic abnormalities are risk factors for development of ED with DM (Hidalgo-Tamola and Chitaley, 2009).
IV. Erectile pathophysiology in animal model of DM
El-Sakka and colleagues investigated structural and ultrastructural changes using rat model of DM. Their study addressed functional abnormalities using cavernous nerve electrostimulation. Electrostimulation was lower in diabetic rats compared to control group. DM rats had short-lived stimulation curve, as it initiated after a latency period with a short curve duration and premature decline in pressure curve before the end of stimulation. They also found significant down-regulation of NOS isoforms (nNOS and iNOS) in diabetic rats with normal expression of TGF-β1 in both diabetic and control rats and no eNOS expression was elicited in all groups (El-Sakka et al., 1999).
Diabetes-related ED was found to be associated with variable degrees of corporeal fibrosis and vascular smooth muscle (VSM) apoptosis (Kovanecz et al., 2009). Corporeal tissue, like any other tissue is exposed to overproduction of plasminogen-activator inhibitor 1, upregulation of reactive oxygen species (ROS) and TGF-β1 activation (Gonzalez-Cadavid and Rajfer, 2010). Vascular elasticity is jeopardized when fibrosis of arterial tunica media increases, eventually leading to plaque formation, an effect which could be postponed or reversed via PDE5Is administration (Kovanecz et al., 2009).
V. Effect of PDE5I on animal model of DM
PDE5Is are the standard drugs for ED treatment since sildenafil citrate was FDA-approved in 1998, consequently; other agents such as vardenafil, tadalafil, and avanafil have gained popularity as an effective ED oral treatment (Ismail and El-Sakka, 2017). PDE5Is have been rapidly considered as the patient-friendly ED treatment method and currently they are recommended as the first-line monotherapy (Lue T, 2006).
PDE5Is act by facilitation of cavernous SM relaxation via inhibition of cGMP, the catalytic enzyme involving NO degradation. PDE5Is are solely effective under the influence of sexual stimulation. Their effect is to potentiate rather than to initiate penile erection via NO release in the first place (Burnett, 2005). Overall, the satisfaction rate of PDE5 inhibitors administration is approximately 70% (Khera and Goldstein, 2011).
Vardenafil (Levitra, Bayer) is a super-selective and strong PDE5 inhibitor. Regardless of being similar in its chemical structure to sildenafil, it is more effective and selective than it. It’s recommended starting dose is 10 or 20 mg orally (Levitra®) or 10 mg sublingually (Staxyn®). Vardenafil exhibits a rapid onset of action, compared to other PDE5Is. AT 25 min, nearly 53% of patients can get erection sufficient for penetration. Vardenafil absorption, like other PDE5Is, is diminished after a fat meal (Rajagopalan et al., 2003). Dose-dependent adverse effects include dyspepsia (6%), headache (21%) and flushing (13%) (Montorsi et al., 2004).
PDE5Is increase NO synthesis and reduce insulin-resistance in endothelial cells. Tadalafil treatment in type II diabetic patients aggravates capillary employment and enhances skeletal muscle glycaemia (Jansso et al., 2010).
From a different perspective, PDE5Is were found to reduce glomerular hypertrophy and downregulates matrix metalloproteinase-2 (MMP-2), type I and II collagen and matrix metalloproteinases tissue inhibitor in the kidney of DM animal model (Kuno et al., 2011). PDE5Is also exhibited some blunting of mesangial cell fibrosis and proliferation and downregulates TGF-β signaling and activation proteins; p-smad-2/3 and TSP-1 (Hohenstein et al., 2008).
PDE5Is also diminish fibrotic changes in a cardiac hypertrophy animal model (Nagayama et al., 2009). Furthermore, in a model of insulin-resistance and diet-induced obesity, low-dose chronic administration of PDE5Is reduces collagen deposition and insulin resistance in skeletal muscles (Kang et al., 2011).
At the first to 8th week, progressive protein buildup occurs in the corpus cavernosum and vascular smooth muscle in a rat model of diabetes after STZ administration and induction of chemical hyperglycemia (Yohannes et al., 2010). These outlines may give some clues to the ameliorating effect of PDE5Is and their anti-fibrotic actions in diabetes-induced ED and further diseases.(Francis and Corbin, 2011)
Early administration of conventional PDE5Is is thought to be the first-line method to ameliorate the deleterious effect of DM in these patients (L. et al., 2012). Nevertheless, nearly half of these patients may not respond very well. The protective effect of PDE5Is in diabetic patients is achieved via interaction of PDE5Is with the its catalytic site, hence cGMP breakdown is blocked, leading to upregulation of cGMP in the corpora cavernosa (Choi et al., 2015).
VI. Effects of PDE5Is on endothelial function in diabetes-related ED
Endothelial dysfunction is the principal mechanism that lead to development of ED with DM, the use of PDE5Is improves basically this mechanism. This is likely to be a result of increased cavernosal blood flow in addition to changes in cellular functions, gene transcription, metabolic processes and calcium homeostasis. There’s a progressive decline in the VSM and endothelium of diabetic men’s cavernosa. Moreover, an amplification of endothelial dysfunction and pro-inflammatory processes ensues in diabetic patients with ED (Usta et al., 2006; Araña Rosaínz et al., 2011).
Increased circulating levels of endothelial dysfunction marker (E-selectin), and elevated inflammatory marker; Tumor necrosis factor-alpha (TNF-α) and low interleukin (IL-10) is encountered in diabetic patients with ED. There’s also positive correlation between cavernosal levels of advanced glycation end products (AGEs) and diabetes-related ED (Araña Rosaínz et al., 2011).
In hyperglycemic conditions, there’s a buildup of AGEs which by its role intermingle with receptor for AGE receptor (RAGE) leading to upregulation of monocyte chemo-attractant protein-1 (MCP-1), that is responsible for tissue damage that occurs with diabetes (Ramasamy, Yan and Schmidt, 2011; Neves, 2013).
In endothelial cells, vardenafil decreases AGE- mediated surge in RAGE and generation of ROS, so downregulates MCP-1 mRNA (Ishibashi, Matsui, Takeuchi and S. I. Yamagishi, 2011). This effect is mediated by NO/cGMP pathway. Moreover, in diabetic models, ED is reversed by inhibition of AGE formation (Usta et al., 2006).
eNOS is found to decrease in a rat model of obesity, where insulin resistance and inflammation occurs. This effect is ameliorated by PDE5Is administration, however, animals on low-fat diet seems to lack this effect (Rizzo et al., 2010).
Endothelial function is improved following continuous administration of low-dose PDE5I; an effect which is lasted for a significant period after cessation of treatment (Burnett et al., 2009). This effect is augmented by the addition of antioxidant therapy to PDE5I regimen; consequently, a maintained efficacy is encountered for at least 4 weeks post-treatment (Morano et al., 2007). This process is associated with downregulation of P-selectin, intercellular adhesion molecule-1 and other inflammatory markers. Daily administration of low-dose PDE5I for a month reduces enothelin-1 level in type II diabetic rats (Ritchie and Sullivan, 2011).
PDE5Is treatment in type II diabetic patients upregulates flow-mediated dilatation and downregulates endothelin-1 levels; enhances nitrite/nitrate levels and decreases vascular inflammatory markers (Aversa et al., 2008).
Previous studies demonstrated that insulin resistance reduces eNOS and AKT-1 activation which are restored via PDE5Is administration (Mammi et al., 2011). In an animal model of diabetes, PDE5Is were found to down-regulate oxidative stress, and inhibits p47phox (a NADPH oxidase active subunit, that mainly provides superoxide ions that abolish NO bioactivity and decreases PDE5 expression (Shukla et al., 2009).
VII. Effect of chronic low dose PDE5I administration on ED-associated DM
The once daily regimen of PDE5Is was reported as a valuable substitute to on-demand PDE5I treatment in ED patients (Hatzichristou et al., 2015; Kim et al., 2015). It was found that >68% of patients on once-daily regimen of PDE5Is could withstand this treatment plan for 6 months (Buvat et al., 2014).
In another perspective of PDE5Is use in treatment of DM-associated ED, amelioration of DM effect on potency was attained by chronic low-dose PDE5I administration mutually by strict control of blood sugar levels (Choi et al., 2015). Likewise, insulin sensitivity and endothelial function were boosted on a 3-months PDE5I regimen (Buvat et al., 2014). PDE5Is increase intracellular cGMP via enhancing NOS in a rat model of diabetes-induced ED in the cavernosal tissue via improvement of nNOS gene expression and increase NOS activity (Zhang et al., 2012).
Materials and methods
This study is a prospective experimental investigation. The study was carried-out at the animal house and research Lab., Faculty of Medicine, Suez Canal University, Egypt. This experimental work was carried out on a total of 60 adult male Albino Wistar rats; aged 60-80 days and weighed 150-200 grams each. Animals were brought from the national research center for experimental animals, Cairo.
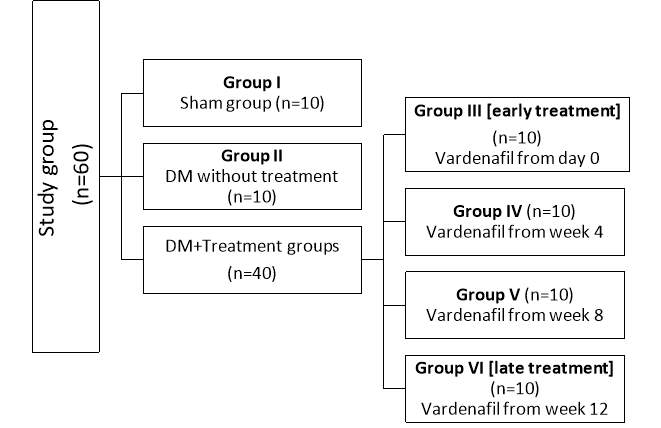
Environmental conditions were standardized for all animals. All rats were kept for at least one week prior to the experiment to be adapted. Each animal was assigned a unique identification number (foot tag). Animals were assigned to sham, DM without treatment and treated groups in a simple random manner; this helped to minimize bias and assure comparability of pertinent variables across groups. Rats were divided into six groups of 10 rats each:
- Group I (Sham group): only underwent surgical incision of the lower abdomen and dissection of the cavernosal nerve and then re-closure of the abdominal wall. No induction of DM nor treatment given.
- Group II (DM without treatment): induction of DM but did not receive any treatment till the date of euthenization.
- Group III (early treatment): induction of DM then received vardenafil treatment started at day 0 after the induction.
- Group IV: induction of DM then received vardenafil treatment started at 4 weeks after the induction.
- Group V: induction of DM then received vardenafil treatment started at 8 weeks after the induction.
- Group VI (late treatment): induction of DM then received vardenafil treatment started at 12 weeks after the induction.
DM was induced by two low-dose with two weeks interval of intraperitoneal injection of 25 mg/kg Streptozotocin (STZ; 2-deoxy-2-(3-(methyl-3-nitrosoureido)-D-glucopyranose; Sigma, St. Louis, MO) in a citrate buffer (pH 7.0, 100 mMol citric acid, 200 mMol di-sodium phosphate).
Three days after the second dose of STZ, blood samples from the tip of rat’s tail were obtained under aseptic conditions, for determination of blood glucose level. Candidate DM rats with blood glucose levels above 300 mg/dL were assigned as the sample of the study (Lukić et al., 1998).
Groups III, IV, V and VI were subjected to chronic vardenafil treatment (Levitra, Bayer Healthcare Pharmaceuticals Inc., Wayne, NJ 07470, Germany). Chronic vardenafil treatment was given by daily oral gavage according to the schedule in a dose of 0.5 mg/kg (equivalent to 0.1 mg/200 g) weight daily (De Young et al., 2008).
The sham group was euthanized at 12 weeks of start of the experiment. DM group without treatment was euthanized at 12 weeks after induction of DM. Each treatment group received chronic vardenafil treatment for 12 weeks before euthanization and tissue harvesting. Functional study assessment of all groups was performed before euthanization and tissue harvesting.
I. Functional evaluation
Intracavernosal pressure in response to cavernous nerve stimulation was measured and recorded using BIOPAC MP150® data acquisition system (TSD104A blood pressure transducer, STMISO nerve stimulation adapter, BIOPAC Systems Inc., 42 Aero Camino, Goleta, CA 93117, USA, 2011) connected to computer device using AcqKnowledge® software for data analysis version 4.1 (BIOPAC Systems Inc., 42 Aero Camino, Goleta, CA 93117, USA, 2009). Mean arterial blood pressure (MAP) was measured and recorded by means of tail-cuff measurement, following instructions supplied by the manufacturer (NIBP200A non-invasive Blood Pressure System, BIOPAC Systems Inc., 42 Aero Camino, Goleta, CA 93117, USA, 2011).
Rats of each group were surgically explored for direct electrostimulation of the cavernous nerve. Under general anesthesia using intra-peritoneal pentobarbital sodium (35 mg/kg), each rat was placed on a heating pad to maintain its body temperature at 37ο C. Through a lower abdominal midline incision, the area postero-lateral to the prostate was explored on both sides. Major pelvic ganglia, pelvic nerves and cavernous nerves were identified and exposed. The skin overlying the penis was incised and both penile crurae were exposed by removing part of the overlying ischio-cavernous muscle (El-Sakka et al., 1999).
A 23 Gauge butterfly cannula filled with 250 Unit/ml of heparin solution was connected to PE-50 tube and was inserted in the right crus for ICP measurement. Cavernous nerve electrostimulation was performed using a delicate stainless-steel bipolar hook electrode (each pole is 0.2 mm in diameter; the two poles were separated by 1 mm). Computer generated monophasic rectangular pulses with a custom-built constant current amplifier. Stimulus parameters were; current 1.5 mA, frequency 20 Hz, pulse width 0.2 ms, and duration 50 s.
After functional study is completed, a 2-mm penile segment was taken for histopathological examination of the cavernous tissue. The collected tissue was immediately placed in 10% formalin solution. Another 2-mm of cavernosal tissue was taken; fixed in 2.5% glutaraldehyde in 100 mM phosphate buffer at pH 7.0 at 4°C for 24 hours for transmission electron microscopy (TEM).
A different penile segment was taken and kept in -70ο C freezer until it was processed for real-time polymerase chain reaction (RT-PCR) and assessment of messenger ribonucleic acid (mRNA) expressions of eNOS, iNOS, nNOS and TGF-β1 genes. Blood sample from each rat was obtained by direct suction from the heart and sent for serum glucose estimation.
II. Histopathologic and ultrastructural examination:
Histopathology:
The 2-mm penile segments were preserved in 10% formalin solution and dehydrated in ascending grades of alcohol. After xylene treatment, the specimens were embedded in paraffin blocks. 5 µm thick sections were cut by microtome and stained with hematoxylin and eosin (H&E) and Masson trichrome staining. The stained sections were examined using light microscope (Bancroft et al., 2008).
H&E sections were examined for determination of trabecular smooth muscle architecture, mass and cavernosal spaces. Masson trichrome were examined for determination collagen matrix deposition, smooth muscle content, areas of fibrosis and smooth muscle to collagen ratio.
All histopathology images were captured using:
- Calibrated standard digital microscope camera (Tucsen® ISH1000 digital microscope camera) using Olympus® CX21 microscope, with resolution of 10 MP (megapixels) (3656 x 2740 pixel each image)
- “IS Capture” software for capture and image enhancements.
- All slides captured with High Power Field (HPF) of 400x and Intermediate power of 100x, UIS optical system (Universal Infinity System, Olympus®, Japan).
Quantitative image analysis
- Quantitative analysis of images was done via computer-assisted densitometry using the ImageJ® software (ImageJ 1.51n, Rasband WS, National Institutes of Health, US)
- Quantification was done by random selection of 8 images from each group. The selected images were submitted to the image analysis and quantification process. Assessment of cavernosal smooth muscle percentages in H&E sections and collagen matrix percentages in Masson Trichrome sections were performed. Smooth muscle to collagen ratios were quantified.
Transmission electron microscopy and ultrastructural assessment:
Two millimeters from the cavernosal tissue was selected for ultrastructural examination by TEM for demonstration of ultrastructural changes (e.g.; area of smooth muscles, elastic tissue, fibrous tissue, microfibrils, structure of the myelinated nerve fibers, endothelium, nuclear chromaticity, mitochondrial and cytoplasmic changes), post-fixed for 1 h in 1% osmium tetroxide dissolved in phosphate buffer, dehydrated in 30% ethyl alcohols and embedded in epoxy resin at 40-60o C.
Transmission electron microscope was used to examine the samples (JEOL Electron Microscope; JEM-2100, JEOL Ltd., 3-1-2 Musashino, Akishima, Tokyo 196-8558, JAPAN).
III. Molecular biology
Quantitative analysis of TGF-β1 and NOS isoforms (eNOS, nNOS, iNOS) gene expression was done in the following steps:
- Specimen collection and processing:
Samples were obtained from cavernous tissue of the rat to quantitatively measure the eNOS, nNOS, iNOS and TGF-β1 genes using quantitative Real-Time PCR (qRT-PCR) technology.
- Total ribonucleic acid (RNA) extraction:
by following the protocol supplied by the manufacturer (QIAGEN, RNeasy Mini Kit, Catalog no. 74104); by tissue disruption using a mortar and pestle. Freezing the animal tissue immediately in liquid nitrogen and grind to a fine powder under liquid nitrogen. Transfer the suspension (tissue powder and liquid nitrogen) into appropriately sized tube and allows the liquid nitrogen to evaporate without allowing the sample to thaw.
- RNA quality control:Concentration and purity of the extracted RNA of each sample were measured by NanoDrop ND-1000 spectrophotometer (NanoDrop Tech., Inc. Wilmington, DE, USA).
- Quantification of RNA:the wavelength-dependent extinction coefficient “33” was taken to represent the micro-component of all RNA in solution.
- Assessment of concentration and purity of the extracted RNA:
The ratio of the readings at 260 nm and 280 nm (A260/A280) was examined to provide an estimate of the purity of RNA with respect to contaminants that absorb in the ultraviolet (UV) spectrum. RNA with an absorbance ratio of 1.8 and 2.2 was very pure. Despite many of the RNA samples falling out of the range that would be considered a “pure” RNA sample, they all maintain the ability to amplify our target gene through RT-PCR.
- Quantitative real-time qRT-PCR
It is a two-step approach; reverse transcription (RT) to convert RNA to complementary deoxyribonucleic acid (cDNA) using RT primer and reverse transcriptase, followed by PCR analysis using TaqMan® assay (Applied Biosystems, assay ID 000397, catalogue no 4427975, Egypt); Taqman® Universal PCR master mix II, No Uracil-N glycosylase (UNG) (Applied Biosystems™, Catalogue number 4440038); Taqman® gene expression TM assay (20×); (Custom TaqMan® Gene Expression Assay Catalogue number 4331348) (Schmittgen and Livak, 2008).
TaqMan® Endogenous control assay, labeled with FAMTM as a reporter dye was used to normalize the expression levels of eNOS, iNOS, nNOS and TGF-β1 to correct any possible differences in RNA quantity or quality across samples.
- Data analysis
RT-PCR allows accumulating amplified cDNA to be detected and measured as the reaction progresses. The reaction consists of an exponential phase, in which the amount of amplified product, detected by incorporated fluorescently-labeled gene-specific probe in the reaction, approximately doubles during each cycle of denaturation, primer annealing and template extension, and a non-exponential or plateau phase in which reduced reagents limit the reaction. The point at which enough amplified product has accumulated to produce a detectable fluorescent signal is known as the threshold cycle or (CT) and the greater the amount of starting template, the lower the CT value. The threshold of different runs across samples for same experiments was adjusted to be the same for comparison.
Quantification of gene expression was estimated using relative quantification method to quantify differences in the expression level of gene between different samples. The expression levels of genes were normalized by the expression level of Glyceraldehyde 3-phosphate dehydrogenase (GAPDH). The mean and standard deviation values of the replicate sample results were calculated in Microsoft® Excel software. The fold changes in gene expression (ΔΔCT) were calculated by 2(-ΔΔCT) (Schmittgen and Livak, 2008).
Assessment of gene expression by gel electrophoresis:
The integrity of the extracted cDNA was assessed by performing DNA gel electrophoresis at 2% concentration of agarose (Cat #PMI080-011EVI, Biosciences (Axygen), Spain) in 1X Tris borate EDTA running buffer (TBE) (Cat #B5, Fermentas, Lithuania). Ethidium Bromide 10mg/ml (Cat # H5041, Promega Corporation, Madison, USA); Blue/Orange 6x Loading Dye (Cat# G1881, Promega Corporation, Madison, USA). With utilization of horizontal slab gel electrophoresis apparatus, Microwave oven and UV-Illuminator (San Gabriel, CA, USA).
DNA sample was loaded into a well of agarose gel and then exposed to an electric field. The negatively charged DNA backbone migrates to the anode. Since small DNA fragments migrate faster, the DNA is separated by size. The percentage of agarose in the gel determined what size range of DNA resolved with the greatest clarity. NOS isoforms (eNOS, iNOS and nNOS) and TGF-β1 Genes expression of sham, DM control and treatment groups; and the different base pairs length of different expressed genes were assessed.
Sample size
Sample size justification:
Sample size calculation using the equation of the difference between two means (Dawson and Trapp, 2004):
Sample size / group: n = 2σ2 (Zα + Zβ)2 / Δ2
Where:
| Zα
Zβ Δ σ |
The value of standard normal distribution for type І error probability for two-sided test (0.05/2) = 1.96
The value of the desired statistical power (90%) = 1.28 The study outcome difference between the first and second groups = 8 (Mostafa et al., 2013) The within group standard deviation = 4.6 (Mostafa et al., 2013) |
n= 2× (4.6)2× (1.96+1.28)2/64 = 7
n = 7 rats per group; 30% drop out rate was added. So, n = 10 rats per group.
Total sample: 10 rats (per group) × 6 groups = 60 rats
Statistical analysis
- Collected data throughout laboratory techniques and outcome measures were coded, entered and analyzed using Statistical Package for the Social Sciences (SPSS) software version 20 (IBM SPSS Statistics for Windows, Version 20, Armonk, NY: IBM Corp., 2011)
- Numeric data of TGF-β1, nNOS, iNOS and eNOS gene expression by fold change were not normally distributed, it was represented by Mean±Standard error of mean (SEM). Differences in gene expression between the study groups were tested using Mann-Whitney U and Kruskall-Wallis tests. Bar chart with error bars was used to graphically represent the inter-group differences of gene expression.
- Intracorporeal pressure and MAP were presented in Mean±SEM. The ICP difference between groups was tested byMann-Whitney U and Kruskall-Wallis tests
- Smooth muscle/Collagen ratio was presented in percentage and the difference between groups was assessed by Mann-Whitney U test.
- Significance level will be set at P-value
Ethical considerations
Animal experiments was carried out according to The National Research Council’s (NRC) Guide for the Care and Use of Laboratory Animals (NRC, 2011).
- A clear and justifiable scientific purpose to use animals was present.
- The number of animals did not exceed the requirements of research.
- The process did not provide unnecessary pain or discomfort.
- By the end of experiment, the animal was sacrificed using approved method of euthanasia.
- The care of animals kept for biomedical purposes was under the supervision of veterinarians.
- Animals received a supply of foodstuffs appropriate to their requirements.
- Disposal of sacrificed animals was consistent with health and environmental concerns.
Results
Study groups showed no significant difference in MAP (p=0.753). ICP showed significant difference between sham and DM with no treatment group (p=0.003), Sham vs early treatment (p=0.007), Sham vs late treatment (p=0.006), DM with no treatment vs early treatment (p=0.004), DM with no treatment vs late treatment (p=0.237), Early vs late treatment (p=0.011) and All groups (p=0.001).
Table 1: differences in ICP measurements normalized to MAP
| Groups | ICP | MAP | |
| Mean±SEM
mmHg |
Min./Max.
mmHg |
Mean±SEM
mmHg |
|
| Sham | 112.29±3.40 | 96/121 | 116.0±1.5 |
| DM with no treatment | 45.67±3.17 | 39/60 | 114.2±2.3 |
| Early treatment (0 day) | 94±2.18 | 88/102 | 115.7±2.7 |
| Week 4 treatment | 85±2.63 | 78/95 | 107.8±5.6 |
| Week 8 treatment | 67.2±3.37 | 59/75 | 110±5.8 |
| Late treatment (12 weeks) | 40.5±1.94 | 36/45 | 113±7.0 |
| Group Analysis | |||
| P value | |||
| All groups MAP** | 0.753 | ||
| Sham vs DM with no treatment ICP * | 0.003 | ||
| Sham vs early treatment ICP* | 0.007 | ||
| Sham vs late treatment ICP* | 0.006 | ||
| DM with no treatment vs early treatment ICP* | 0.004 | ||
| DM with no treatment vs late treatment ICP* | 0.237 | ||
| Early vs late treatment ICP* | 0.011 | ||
| DM Groups (with or without treatment) ICP** | 0.002 | ||
| All groups ICP** | 0.001 | ||
| ICP: Intracorporeal Pressure, MAP: Mean Arterial Pressure
*Mann Whitney U test, **Kruskal Wallis test |
|||
Comparison of ICP measurements between the study groups are shown in (Fig. 1):
There was statistically significant difference of (Mean±SEM) ICP between sham (112.29±8.99) mmHg compared to the DM with no treatment group (45.67±7.76) mmHg, P=0.003.
There was a significant difference of (Mean±SEM) ICP between DM with no treatment (45.67±7.76) mmHg compared to early treatment group (94±5.33) mmHg, P=0.004. While there was no significant difference of (Mean±SEM) ICP between DM with no treatment (45.67±7.76) compared to a late treatment diabetic group (40.5±3.87), P=0.237.
Comparison of Mean±SEM ICP between early, week 4, week 8 and late treatment groups (94±5.33), (85±6.45), (67.2±7.53) and (40.5±3.87) mmHg respectively showed significant difference between all groups (P=0.001. Early versus late treatment groups comparison showed significant difference (P=0.001).
|
(1) |
Sham |
|
|
(2) |
DM With no treatment |
|
|
(3) |
Early Treatment (0 day) |
|
|
(4) |
Week 4 treatment |
|
|
(5) |
Week 8 treatment |
|
|
(6) |
Late treatment (12th wk.) |
Figure 1: Results of ICP measurement
Figure 2 demonstrates comparison of H&E histopathologic sections between the study groups:
- In Sham group, H&E sections showed standard architecture of the cavernous tissue, with large collapsed cavernous spaces lined with endothelial cells surrounded by smooth muscle fibers arranged in bundles and numerous elastic fibers. High magnification showed intact flattened endothelial cell lining the vascular spaces.
- In DM with no treatment group, H&E sections showed distorted architecture of the cavernous tissue, smooth muscles showed few bundles which are shrunken and deeply stained with minimal elastic fibers, and increased fibrous tissue. At high magnification, vascular spaces showed shed endothelial cells with areas of regeneration and proliferation.
- In Early treatment group (0 day), H&E sections showed restored architecture of the cavernous tissue, with large collapsed cavernous spaces lined with endothelial cells surrounded by bundles of smooth muscle fibers and numerous elastic fibers. High magnification showed intact flattened endothelial cell lining the vascular spaces.
- In week 4 treatment group, H&E sections showed partially restored architecture of the cavernous tissue, with few partially collapsed cavernous spaces lined with endothelial cells surrounded by bundles of smooth muscle fibers, numerous elastic fibers, and moderate fibrous tissue. High magnification showed focally shed flattened endothelial cell lining the vascular spaces.
- In week 8 treatment group, H&E sections showed focally distorted cavernous tissue architecture, cavernous spaces lined with endothelial cells surrounded by smooth muscle fibers arranged in deeply stained shrunk bundles, numerous elastic fibers, and moderate fibrous tissue. High magnification showed shed endothelial cell lining the vascular spaces.
- In late treatment group (12th wk.), H&E sections showed distorted architecture of the cavernous tissue, smooth muscles showed few bundles which are shrunken and deeply stained with minimal elastic fibers, and increased fibrous tissue. At high magnification, vascular spaces showed shed endothelial cells with areas of regeneration and proliferation.
| H&E x100 | H&E x400 | H&E x100 | H&E x400 |
|
|
||
|
|
||
|
|
||
Figure 2: Histopathologic changes by light microscopy (H&E sections)
Figure 3 demonstrates comparison of Masson trichrome histopathologic sections between the study groups:
- In sham group, Masson trichrome sections showed minimal to absent fibrosis with elastic fibers and remarkable smooth muscle bundles.
- In DM with no treatment group, Masson trichrome sections showed increased fibrous tissue and deeply stained shrunken muscle bundles.
- In early treatment group (0 day), Masson trichrome sections showed minimal to absent fibrosis with elastic fibers and remarkable smooth muscle bundles.
- In week 4 treatment group, Masson trichrome sections showed moderate fibrosis with elastic fibers.
- In week 8 treatment group, Masson trichrome sections showed increased fibrous tissue and deeply stained shrunk muscle bundles.
- In late treatment group (12th wk.), Masson trichrome sections showed increased fibrous tissue and deeply stained shrunk muscle bundles
| Trichrome x100 | Trichrome x400 | Trichrome x100 | Trichrome x400 |
|
|
||
|
|
||
|
|
||
Figure 3: Histopathologic changes by light microscopy (Masson Trichrome sections)
Figure 4 shows comparison of SM to collagen ratios between study groups. There was significant difference between sham and DM group without treatment (p=0.0004). There was significant difference between DM with no treatment and early treatment groups (p=0.016). There was significant difference between early and late treatment groups (p=0.035). Nevertheless, there was no significant difference in SM to collagen ratio between sham and early treatment groups (p=0.285).
Figure 4: SM to collagen ratio
Figure 5 shows cavernosal SM ultrastructural differences between study groups:
- In sham group, TEM section shows regular contour of muscle cells (long arrow) and scanty collagen, euchromatic nucleus and preserved nucleolus (short arrow)
- In DM with no treatment group, TEM section shows smooth muscle atrophy (long arrow), extensive collagen deposition, cellular atrophy, myofilament loss, loss of gap junction and vacuolated cytoplasm (short arrow), with extensive peri-endothelial collagen deposition (arrow head).
- In early treatment group, TEM section shows moderately dense collagen around smooth muscle fibers, regular contour of muscle cells (arrow) and, preserved nuclear chromatin
- In week 4 treatment group shows, TEM section shows smooth muscle bundle of fibers moderately dense collagen around smooth muscle fibers (arrow), regular contour of muscle cells and, preserved nuclear chromatin
- In week 8 treatment group, TEM section shows wide cavernosal spaces (arrow) and dense collagen matrix around smooth muscle fibers (arrow head), less regular contour of muscle cells and, less preserved nuclear chromatin
- In late treatment group, TEM section shows atrophic smooth muscle fibers (long arrow), extensive collagen deposition (short arrow), cellular atrophy, distortion of smooth muscle fibers and loss of gap junction (arrow head),
|
|
|
  |
  |
|
|
|
|
 |
 |
 |
Figure 5: Cavernosal SM ultrastructure by electron microscopy
Figure 6 shows endothelial ultrastructural differences between study groups:
- In sham group, TEM section shows regularly preserves capillary basement membrane (long arrow), preserved nuclear chromatin (euchromatic) (short arrow) and preserved nucleolus and cytoplasm, less collagen fibers around capillaries.
- In DM with no treatment group, TEM section shows distorted capillary basement membrane (long arrow), hyper dense and heterochromatic nucleus (short arrow) and distorted nucleolus with extensive peri-endothelial collagen deposition.
- In early treatment group, TEM section shows intact capillary basement membrane (long arrow), euchromatic nucleus, preserved nucleolus and cytoplasm, moderately dense collagen fibers around capillaries (short arrow).
- In week 4 treatment group, TEM section shows sinusoidal space intermingled between cavernous muscle fibers with Intact capillary basement membrane, euchromatic nucleus, preserved nucleolus and cytoplasm (long arrow), moderately dense collagen fibers around capillaries (short arrow).
- In week 8 treatment group, TEM section shows less intact endothelial capillary basement membrane, heterochromatic nucleus, less preserved nucleolus and cytoplasm, moderately dense collagen fibers around capillaries (arrow).
- In late treatment group shows, TEM section shows extensive collagen deposition around endothelial capillary basement membranes (long arrow), disintegration of capillary basement membrane (short arrow), heterochromatic nucleus with lost nucleolus (arrow head)
|
|
|
  |
  |
  |
|
|
|
  |
|
   |
Figure 6: Endothelial ultrastructure by electron microscopy
Figure 7 shows neuronal ultrastructural differences between study groups:
- In sham group, TEM section shows preserved structure of myelinated nerve fibers and intact myelin sheath (arrow)
- In DM with no treatment group, TEM section shows distortion of Schwann sheath myelination (long arrow), Schwann cell nucleus hyperchromatism (arrow head) and vacuolated neuronal cytoplasm (short arrow),
- In early treatment group, TEM section shows less vacuolation of neuronal cytoplasm (short arrow), preserved myelin sheath (long arrow) and intact structure of myelinated nerve fibers,
- In week 4 treatment group, TEM section shows a nerve bundle with clear cytoplasm and minimal vacuolation (arrow), clear chromatin, preserved myelin sheath and intact structure of myelinated nerve fibers,
- In week 8 treatment group, TEM section shows dense vacuolation of neuronal cytoplasm, densely stuffed microfibrils of collagen (long arrow), some nerve cells partially lose myelin sheath (short arrow), other cells have intact structure of myelinated nerve fibers,
- In late treatment group, TEM section shows distortion of Schwann sheath myelination (short arrow), heterochromatic Schwann cell nucleus and dense vacuoles inside neuronal cytoplasm (arrow head) and around nerve bundles
|
|
|
  |
   |
 |
|
|
|
|
  |
  |
Figure 7: Neuronal ultrastructure by electron microscopy
Figure 8 shows GAPDH endogenous control gene expression. Fig.3A; Agarose gel electrophoresis exhibited equal expression of GAPDH endogenous control gene in all groups. Fig.3B; TaqMan® assay gene amplification plot showed early and equal expression of GAPDH endogenous control gene in all groups (cycle threshold; 22-36)
| (A) Agarose gel electrophoresis | |
|
GAPDH
|
|
| (1) Sham group. (2) DM with no treatment (3) Early treatment (0 day). (4) Week 4 treatment. (5) Week 8 treatment. (6) Late treatment (12weeks) | |
| (B) TaqMan® assay amplification plot | |
 bp
bpFigure 8: GAPDH endogenous control gene expression
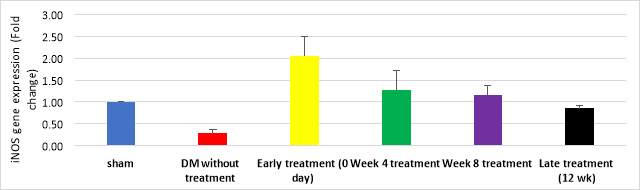
Figure 9 demonstrates quantitative assessment using TaqMan® assay showing upregulation of iNOS gene in early treatment group (2.05 folds, cycle 27) compared to DM without treatment group (0.28 fold, cycle39) (p=0.029) and compared to late treatment group (0.85 fold, cycle 41) (p=0.047). However, iNOS gene expression by gel electrophoresis exhibited expression of iNOS gene in sham and early treatment groups only
| (A) Agarose gel electrophoresis | |
|
iNOS
|
|
| (1) Sham group. (2) DM with no treatment (3) Early treatment (0 day). (4) Week 4 treatment. (5) Week 8 treatment. (6) Late treatment (12weeks) | |
| (B) | |
 |
|
| (C) TaqMan® assay amplification plot | |
Figure 9: iNOS gene expression
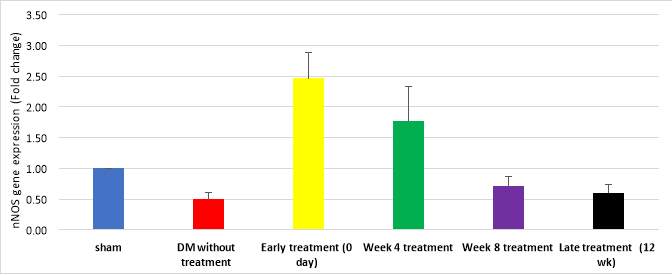
Figure 10 demonstrates quantitative assessment using TaqMan® assay showing upregulation of nNOS gene in early treatment group (2.46 folds, cycle 29) and week 4 treatment group (1.78 folds, cycle 31); compared to DM without treatment (0.49 fold, cycle 39) and late treatment groups (0.6 fold, cycle 36) (p=0.012). However, nNOS gene expression by gel electrophoresis exhibited expression of nNOS gene in sham, early treatment and 4 week treatment groups compared to lower expression in DM without treatment group
| (A) Agarose gel electrophoresis | |
| nNOS
|
|
| (1) Sham group. (2) DM with no treatment (3) Early treatment (0 day). (4) Week 4 treatment. (5) Week 8 treatment. (6) Late treatment (12weeks) | |
| B | |
 |
|
| (C) TaqMan® assay amplification plot | |
Figure 10: nNOS gene expression
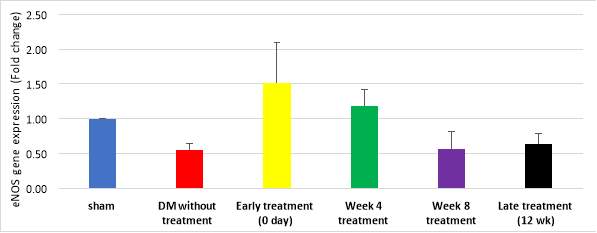
Figure 11 demonstrates quantitative assessment using TaqMan® assay showing upregulation of eNOS gene in early treatment group (1.51 folds, cycle 35) and week 4 treatment group (1.19 folds, cycle 37); compared to DM without treatment (0.55 fold, cycle 44) and late treatment groups (0.64 fold, cycle 40) but the difference was not significant (p=0.210). However, eNOS gene expression by gel electrophoresis exhibited no expression of eNOS gene could be detected with agarose gel electrophoresis in any of the study groups.
| (A) Agarose gel electrophoresis | |
| eNOS
|
|
| (1) Sham group. (2) DM with no treatment (3) Early treatment (0 day). (4) Week 4 treatment. (5) Week 8 treatment. (6) Late treatment (12weeks) | |
| B | |
 |
|
| (C) TaqMan® assay amplification plot | |
Figure 11: eNOS gene expression
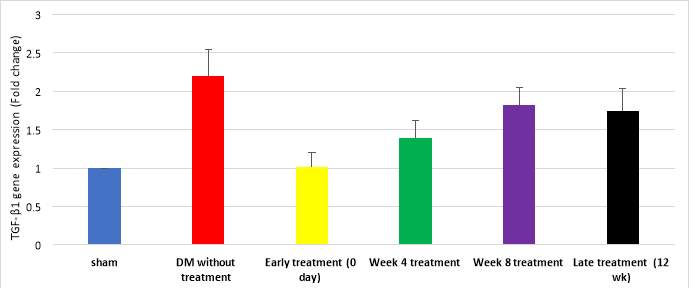
Figure 12 demonstrates quantitative assessment using TaqMan® assay showing upregulation of TGF-β1 gene in DM with no treatment (2.2±0.35 folds, cycle 24) week 8 treatment (1.82±0.22 folds, cycle 26), late treatment (1.74±0.30 folds, cycle 28), week 4 treatment (1.39±0.23 folds, cycle 32) groups. Downregulation of TGF-β1 was detected in early treatment (1.01±0.19 folds, cycle 35) and sham (1 fold, cycle 38) groups (P=0.043). However, TGF-β1 gene expression by gel electrophoresis exhibited nearly equal expression in all study groups
| (A) Agarose gel electrophoresis | |
|
TGF-β1
|
|
| (1) Sham group. (2) DM with no treatment (3) Early treatment (0 day). (4) Week 4 treatment. (5) Week 8 treatment. (6) Late treatment (12weeks) | |
| B | |
 |
|
| (C) TaqMan® assay amplification plot | |
Figure 12: TGF-β1 gene expression
Fig. 13 demonstrates significant down-regulation of nNOS (Mean±SEM, P value) (0.49±0.11, 0.029), iNOS (0.28±0.09, 0.03) and eNOS (0.55±0.09, 0.02) in DM with no treatment group in comparison to sham group. TGF-β1 gene was upregulated in DM without treatment group in comparison to sham group; Mean±SEM was (2.20±0.35), p=0.02. There was significant up-regulation of nNOS (Mean±SEM, P value) (2.46±0.43), iNOS (2.05±0.46) and eNOS (1.51±0.58) in early treatment group in comparison to late treatment group group (P=0.029).
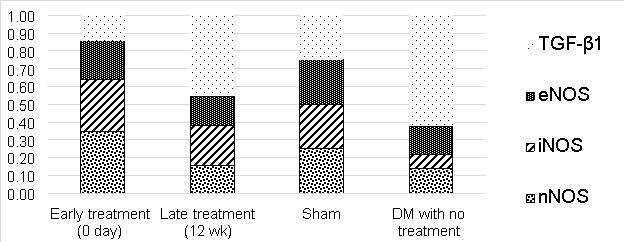
Figure 13: NOS isoforms and TGF-β1 gene expression profile
Discussion
Rendering the inability of human tissue-sampling to investigate the effect of early versus late administration of vardenafil in DM men with ED, this fact prompted us to investigate this effect in a rat model. To the best of our knowledge, no previous study had investigated the effect of early versus late administration of PDE5Is on erectile function of DM rats with its associated structural and ultrastructural abnormalities; in addition to addressing the associated gene expression profile of NOS isoforms (eNOS, nNOS and nNOS) and TGF-β1.
ED is a known drastic complication of DM. The prevalence of ED among DM men range from 35-90% (Cho et al., 2006). In the Massachusetts male aging study, incidence of ED was three times more in DM compared to non-DM men (Feldman et al., 1994) and the age-adjusted, annual incidence of ED in DM men was twice more than that in non-DM men (Johannes et al., 2000). Additionally, there is an earlier incidence of ED by 10-15 years in DM compared to no-DM men (Feldman et al., 1994). In a more recent study, prevalence of ED in the Middle-East countries was found to be >40%. At least 5 Arab countries were counted in the worldwide top 10 countries with a high prevalence of DM (El-Sakka, 2012a).
ED in DM patients is associated with poorer quality of life and more severe complications (Penson et al., 2003) and lower response to oral treatment than non-DM men with ED (Goldstein et al., 1998). Commonly, DM is associated with dyslipidemia, hypertension (HTN) and metabolic syndrome, which are known risk factors for ED. ED could be the presenting symptom of DM specially in elderly patients. Twelve percent of patients seeking ED treatment had undiagnosed DM, highlighting the growing need to ameliorate the effect DM in men who present with ED (Goldstein et al., 1998).
In the past few years, animal model of DM in erectile function research has been extensively investigated. Researchers addressed the variability of structural, functional and ultrastructural abnormalities in rat model of DM. Functional abnormalities were assessed using cavernous nerve electrostimulation and ICP measurement. It has been found that NOS isoforms (nNOS and iNOS) were downregulated and variable degrees of TGF-β1 expression has occurred in DM rats (El-Sakka et al., 1999; Ahn et al., 2009; Mostafa, et al., 2013; Bai and An, 2015).
The present study was conducted on STZ-induced DM Albino Wistar rats. The high tolerability and resistance to stresses and the similarity of its bodily reactions to human being made Albino Wistar rats the suitable model for this research work. In addition, life span of this kind of model is sufficient to investigate long-term effect of vardenafil treatment
A 60 adult male Albino Wistar rats were divided into six groups of 10 rats each were included in the study. Sham group only underwent surgical incision of the lower abdomen and dissection of the cavernosal nerve and then re-closure of the abdominal wall. No induction of DM nor treatment given. DM without treatment group underwent induction of DM but did not receive any treatment till the date of euthenization. Four Treatment groups underwent induction of DM then received vardenafil treatment started at day 0, week 4, week 8 and week 12 after the induction.
In the current study DM was induced by two low-dose with two weeks interval of intraperitoneal injection of 25 mg/kg STZ based on one of the original animal models in that perspective (El-Sakka et al., 1999). Induction of DM with single high dose of 60 mg/kg STZ injection (Elabbady et al., 1995; Lu et al., 2016; Zhang et al., 2016; Zhou et al., 2016) has shortcoming such as high rate of morbidity and/or mortality of rats. Moreover, this might necessitate insulin treatment to keep the rats for prolonged treatment periods as in our study.
In present study, cavernous nerve stimulation and ICP results showed significant difference between sham (112.29±8.99) mmHg and DM with no treatment group (45.67±7.76) mmHg (P=0.003), sham vs late treatment (40.5±3.87) (P=0.006), DM with no treatment vs early treatment (94±5.33) mmHg (P=0.004), Early vs late treatment (P=0.011) and All groups (p=0.001). Additionally, there was significant difference of ICP between early (94±5.33), week 4 (85±6.45), week 8 (67.2±7.53) and late (40.5±3.87) mmHg treatment groups; (P=0.001). However, there was no significant difference between DM with no treatment and late treatment groups (P=0.237).
PDE5Is are used in treatment of DM-associated ED, the effect of DM on ED could be prevented by blood sugar control and chronic low-dose PDE5I administration (Choi et al., 2015; Zhang et al., 2016). Similarly, a 3-months PDE5I regimen improved insulin sensitivity and endothelial function (Buvat et al., 2014). PDE5Is increase intracellular cGMP by enhancing cavernosal NOS activity and improvement of nNOS gene expression (Zhang et al., 2012; Bai and An, 2015). In a rat model of obesity, eNOS is found to be decreased in association with insulin resistance. However, rats on low-fat diet seems to lack this effect which could be ameliorated by PDE5Is administration (Schäfer et al., 2008; Rizzo et al., 2010).
PDE5Is treatment re-establish eNOS and AKT-1 activation, which is reduced by insulin resistance (Mammi et al., 2011). Moreover, PDE5Is down-regulate oxidative stress and inhibit superoxide ions formation (Shukla et al., 2009).
Chronic dosing of vardenafil achieves the best effect in treating DM-induced ED. Histologic changes and protein expression noted with vardenafil treatment suggest its protective effect in DM patients with ED (Ferrini et al., 2006; De Young et al., 2008; Malavige and Levy, 2009; Lee and Brock, 2013) Furthermore, low-dose chronic administration of tadalafil was associated with structural and functional improvement of erection in a rat model of DM or cavernous nerve injury with ED (Kovanecz et al., 2008; Mostafa, Rashed and Kotb, 2010; Mostafa et al., 2012, 2013; Choi et al., 2015; Zarifpour et al., 2015; Zhang et al., 2016).
DM-associated ED is essentially caused by endothelial dysfunction. PDE5Is improve endothelial function by increasing cavernosal blood flow, cellular functions, gene transcription, metabolic processes and calcium homeostasis. vascular smooth muscle and cavernosal endothelium progressively decline in DM men with ED. Furthermore, extensive endothelial dysfunction and inflammatory processes occur in DM men with ED (Usta et al., 2006; Araña Rosaínz et al., 2011; Zhang et al., 2016).
Diabetes-related ED is strongly correlated to cavernosal levels of AGEs, E-selectin endothelial dysfunction marker, TNF-α inflammatory marker and low IL-10 (Bivalacqua et al., 2003; Araña Rosaínz et al., 2011). In hyperglycemic conditions, Overexpression of AGEs interact with AGE receptor (RAGE) leading to MCP-1 chemo-attractant protein upregulation; consequently, tissue damage occurs and eventually endothelial dysfunction contributes to development of ED in DM patients (Ishibashi et al., 2011; Ramasamy et al., 2011; Neves, 2013).
With PDE5I administration; Activation of NO/cGMP pathway in endothelial cells decreases AGE-mediated surge in RAGE, blocks ROS formation and downregulates MCP-1 mRNA (Ishibashi et al., 2011; Veres et al., 2013). It is believed that ED could be reversed in DM models by inhibition of AGE formation (Usta et al., 2006; Neves, 2013).
Continuous low-dose PDE5I administration improves endothelial function. This effect could be potentiated by antioxidant/ PDE5I combination regimen; therefore, treatment efficacy is prolonged for at least 4 weeks post-treatment (Morano et al., 2007; Burnett et al., 2009). In DM rats, daily administration of low-dose PDE5I reduces enothelin-1 level, P-selectin, intercellular adhesion molecule-1 and other inflammatory markers (Ritchie and Sullivan, 2011). Additionally, PDE5Is treatment in type II diabetic patients upregulates flow-mediated dilatation and enhances nitrite/nitrate levels (Aversa et al., 2008).
Previous study conducted on animal model of diabetes for 16 weeks with repeated udenafil dosing they found significant increase in erectile response achieved with udenafil treatment (51.6% ± 9.8%) compared with the DM control group (P Ahn et al., 2009). Li et al., 2013 conducted similar study on DM rats and found significant difference of ICP/MAP between control, DM and DM with sildenafil treatment (P=0.01) (Li et al., 2013). Another study investigated vardenafil treatment in rats with arteriogenic ED induced by bilateral internal iliac artery ligation; they addressed significant improvement of ICP/MAP with vardenafil treatment compared to ligation-induced ED group (P Hotta et al., 2011). Usta et al., found significantly lower mean ICP values in DM Sprague–Dawley rats compared to treated DM rats for 6 weeks; with significant recovery of erectile function, leading to comparable ICP levels to control group (Usta et al., 2006).
Histopathologic changes in the current study demonstrates discrepancy of cavernosal SM architecture, elastic fibers and collagen matrix. In Sham group, H&E sections showed standard architecture of the cavernous tissue, with large collapsed cavernous spaces lined with endothelial cells surrounded by smooth muscle fibers arranged in bundles and numerous elastic fibers. High magnification showed intact flattened endothelial cell lining the vascular spaces. However, in DM with no treatment group, H&E sections showed distorted architecture of the cavernous tissue, smooth muscles showed few bundles which are shrunken and deeply stained with minimal elastic fibers and increased fibrous tissue. At high magnification, vascular spaces showed shed endothelial cells with areas of regeneration and proliferation. These results are consistent to the results of Mostafa et al., 2013 who demonstrated marked improvement in histologic architecture in chronic low-dose-tadalafil-treated group compared to DM group.
H&E sections in the current study showed restored architecture of the cavernous tissue in Early treatment group (0 day) as sham group. In contrast, Late treatment group showed distorted architecture of the cavernous tissue as DM group with no treatment. H&E sections of week 4 and 8 treatment groups showed focal architectural improvement. Masson Trichrome sections of sham and early treatment groups demonstrated minimal to absent fibrosis; while DM with no treatment and late treatment groups showed marked fibrosis.
Moreover, in our study, there was significant difference of SM/Collagen ratio between sham (76%/24%) and DM with no treatment (41%/59%) groups (P=0.0004). There was significant difference between DM with no treatment and early treatment (64%/36%) group (P=0.016). Nevertheless, there was no significant difference in SM/Collagen ratio between sham and early treatment groups (p=0.285). We also found significant difference of SM/Collagen ratio between early and late treatment (42%/58%) groups (P=0.035); Some authors found that SM/collagen ratio was significantly higher in vardenafil-treated Wistar rats compared to ED group in a vascular ligation-induced ED model (P Hotta et al., 2011) . In a rat model of cavernosal nerve injury, Kovanecz et al. found that tadalafil has normalized the increase in penile shaft collagen content and reduced corporeal SM content. They also found reduction of corporeal SMC/collagen ratio in bilateral cavernous nerve injury group than in vardenafil-treated group. (Kovanecz et al., 2008).
In this study, Ultrastructural changes of sham and early treatment groups showed scanty collagen microfibrils with preserved capillary basement membrane and intact myelinated nerve fibers. However, DM with no treatment and late treatment groups showed extensive collagen deposition, vacuolated cytoplasm, distorted Endothelial basement membrane and distorted Schwann sheath myelination. Week 4 and 8 treatment groups showed intermediate changes of cavernous ultrastructural components.
Ultrastructural changes in corpora cavernosa of DM rats after chronic low dose tadalafil treatment were elicited in the study of Mostafa et al., and it wasconsistent to our findings.They found areas of myelin sheath thickening, intra-axonal edema and degenerative nuclei with chromatin clumping. Tadalafil-treated group exhibited similar nerve fiber structure but with axoplasmic vacuolation. DM rats showed endothelial basement membrane thickening with heterochromatic nuclei of endothelial cells with peripheral chromatin condensation and indented nuclear membranes. (Mostafa, et al., 2013). Ultrastructural alterations in Peyronie’s model was investigated by El-Sakka and colleagues, they found condensation and clumping and loss of spaces between collagen bundles with fragmentation of Elastin. Also, there was marked gaping of inter-neuronal spaces by more deposition of collagen. They also found increase in collagen deposition surrounding blood vessels (El-Sakka et al., 1998).
Lack of the number of NOS-containing nerve fibers, NOS activity and endothelial SM relaxation impairment are the major contributing factor to ED in DM patients. Previous studies had established that eNOS and nNOS downregulation of their protein and gene expression in DM animal models are the main factors of erectile function impairment (Bivalacqua et al., 2001)
Other studies showed that NOS isoforms gene transfer can enhance physiological profile of penile tumescence in vivo; thereby, NOS expression improved ED associated with NOS downregulation. The effects of eNOS gene transfer into the penis of STZ-induced DM rats were investigated; and it was concluded that erectile function could be improved if NO expression is restored (T R Magee et al., 2002). eNOS is an essential element of erectile function; it has the capability of inducing vasodilation and inhibition of vasoconstriction (Montorsi et al., 2004).
In the current study, genes expression of eNOS, nNOS, iNOS and TGF-β1 were assessed using conventional gel electrophoresis and quantitative assay (TaqMan®). Quantitative assessment using TaqMan® assay showed upregulation of iNOS gene in early treatment group (2.05 folds, cycle 27) compared to DM without treatment group (0.28 fold, cycle39) (p=0.029) and compared to late treatment group (0.85 fold, cycle 41) (p=0.047). However, iNOS gene expression by gel electrophoresis exhibited expression of iNOS gene in sham and early treatment groups only. Similarly, iNOS was upregulated in Small activating RNA-guided iNOS group compared to DM rats in the study of (Wang et al., 2013).
In this study, Quantitative assessment using TaqMan® assay showed upregulation of nNOS gene in early treatment group (2.46 folds, cycle 29) and week 4 treatment group (1.78 folds, cycle 31); compared to DM without treatment (0.49 fold, cycle 39) and late treatment groups (0.6 fold, cycle 36) (p=0.012). However, nNOS gene expression by gel electrophoresis exhibited expression of nNOS gene in sham, early treatment and 4 week treatment groups compared to lower expression in DM without treatment group. El-Sakka et al. suggested the decrease in nNOS expression in DM rats may be responsible for neurogenic ED. However, they couldn’t obtain eNOS gene expression because they utilized gel electrophoresis to identify gene expression. Accordingly, they were not able to clearly explain NOS activity (El-Sakka et al., 1999).
In the current study, Quantitative assessment using TaqMan® assay showed upregulation of eNOS gene in early treatment group (1.51 folds, cycle 35) and week 4 treatment group (1.19 folds, cycle 37); compared to DM without treatment (0.55 fold, cycle 44) and late treatment groups (0.64 fold, cycle 40) but the difference was not significant (p=0.210). However, eNOS gene expression by gel electrophoresis exhibited no expression of eNOS gene could be detected with agarose gel electrophoresis in any of the study groups. El-Sakka et al. reported no expression of eNOS gene in either DM or control groups (El-Sakka et al., 1999), but this may be due to limited cDNA sample expression or decreased gel density and this could be overcome by quantitative gene expression assay as in our case.
Several studies investigated gene expression profile in DM rats compared to different treatment groups and concluded similar results of iNOS and nNOS upregulation in the treated rats and significant downregulation of all NOS isoforms in DM rats (Burnett et al., 1992; Rajfer et al., 1992; Elabbady et al., 1995; El-Sakka et al., 1999; T R Magee et al., 2002; Bivalacqua et al., 2004; Burnett and Musicki, 2005; Sohn et al., 2008; Sánchez et al., 2012).
TGF-β1 action in tissue repair process, involves a complexed sequences of cytokine production, monocyte chemoattraction, angiogenesis and additional inflammatory mediators (Border and Ruoslahti, 1992). Previous elegant studies had explored the role of TGF-β in a rat model of Peyronie’s disease. They found that TGF-β2 and TGF-β3 had no remarkable protein expression, while TGF-β1 gene expression in the cytomodulin-injected rats was noted after 2 weeks post-induction (El-Sakka et al., 1997a, 1997b; El-Sakka et al., 1998). Other authors related an association between priapism with increased TGF-β gene expression as a moderator of fibrosis, Elucidating that TFG-β antagonists may be a desirable treatment modality (Ul-Hasan et al., 1998). TGF-β1 gene expression have been found to be elevated in various fibrotic conditions such as; penis (Peyronie’s disease), eye (Graves ophthalmopathy), lung (pulmonary sarcoidosis), heart (cardiomyopathy), liver (cirrhosis), kidney (glomerulosclerosis), pancreas (fibrosing pancreatitis), skin (scleroderma), subcutaneous tissue (Dupytren’s contracture), bone (osteodystrophy) and muscle (polymyositis) (Branton and Kopp, 1999). Numerous events involve TGF-β occur in the process of tissue repair and induction of fibrosis. TGF is involved in vital processes including normal tissue healing, inflammation, intracellular matrix deposition and production of fibroblasts (Balza et al., 1988; Castilla et al., 1991; El-Sakka et al., 1997); However, some other authors found no difference in TGF-β gene expression profile in a rat model of diabetes (El-Sakka et al., 1999).
In this study, quantitative assessment using TaqMan® assay showed upregulation of TGF-β1 gene in DM with no treatment (2.2±0.35 folds, cycle 24) week 8 treatment (1.82±0.22 folds, cycle 26), late treatment (1.74±0.30 folds, cycle 28), week 4 treatment (1.39±0.23 folds, cycle 32) groups. Downregulation of TGF-β1 was detected in early treatment (1.01±0.19 folds, cycle 35) and sham (1 fold, cycle 38) groups (P=0.043). However, TGF-β1 gene expression by gel electrophoresis exhibited nearly equal expression in all study groups. Furthermore, El-Sakka et al. had found remarkable expression of TGF- β1 protein expression in cytomodulin-induced PD in rats (El-Sakka et al., 1997).
However, in some authors compared the efficacy of tadalafil versus sildenafil and vardenafil on TGF-β1 level in a rat model of cavernous nerve injury. They elicited no effect of tadalafil on TGF-β1 compared to other PDE5Is. They stated that TGF-β1 is not a pro-fibrotic factor in corpora cavernosa of cavernous nerve injury model, as seen in DM animal models (Kovanecz et al., 2008).
In a rat model of DM, there was significant restoration of erectile function and overexpression of cGMP concentrations, diamethylarginine dimethylaminohydrolases (DDAH), nNOS and Superoxide (O2−) dismutase (SOD) activity in anti-hyperlipidemic drug (probucol)-treated DM rats compared to untreated DM rats (Zhang et al., 2016)
The current study demonstrated significant down-regulation of nNOS (Mean±SEM, P value) (0.49±0.11, 0.029), iNOS (0.28±0.09, 0.03) and eNOS (0.55±0.09, 0.02) in DM with no treatment group in comparison to sham group. TGF-β1 gene was upregulated in DM without treatment group in comparison to sham group; Mean±SEM was (2.20±0.35), p=0.02.
One of the disadvantages of STZ-induced DM is that chemical toxicity to other body organs may be encountered during the research process. Distinguished findings, like changes in hepatic P450 isozymes, lung, intestines, kidney, brain and testes have been described after STZ or alloxan administration. Therefore, these changes have to be carefully considered when testing drugs in a chemically- induced diabetic animal model (Lee et al., 2010).
Limitations of current study include; although period of vardenafil treatment was equal in all groups, different period of diabetes status among study groups were not equal since late treatment group lived for a longer duration before euthanization.
Other limitation includes the lack of ICP measurement beyond vardenafil treatment period to demonstrate whether improvement of penile function is permanent or just a temporary process. Additionally, measurement of PDE5 activity and its expression level could add to this study.
In summary, there was up-regulation of nNOS (2.46±0.43), iNOS (2.05±0.46) and eNOS (1.51±0.58) in comparison to late treatment group that showed significant downregulation of nNOS (0.60±0.13) and iNOS (0.85±0.06) genes; P values were 0.029 and 0.04 respectively. There was no statistically significant difference of eNOS (P=0.486) and TGF-β1 (P=0.2) genes expression between the two groups. We found high index and threshold of gene detection using quantitative assessment compared to gel electrophoresis. Quantification of gene expression if would be used in future studies, our knowledge about molecular biology of erectile function may change completely.
We recommend early administration of PDE5I in DM-associated ED. This strategy might ameliorate the deleterious effect of DM on erectile function. In this perspective, further human studies on a large number of patients with DM-associated ED are recommended to clarify and prove the positive effect of early administration of PDE5I on male patients with DM-associated ED.
Summary
Pathophysiology of ED with DM is a multifactorial neural and endothelial mechanism that affects normal corporeal SM relaxation. ED associated with DM is strongly associated with decreased NO activity and upregulation of TGF-β action. Early administration of PDE5Is are thought to be an effective method to ameliorate the deleterious effect of DM.
In the current study, 60 adult male Albino Wistar rats were divided into six groups of 10 rats each; Sham group, DM without treatment group and four treatment groups which received vardenafil treatment started at day 0, week 4, week 8 and week 12 after the induction. Rats were subjected to cavernous nerve stimulation and ICP measurement. Penile segments were subjected to histopathologic, ultrastructural examination and assessment of NOS isoforms (iNOS, nNOS and eNOS) and TGF-β1 gene expression.
We found that ICP was significantly higher in sham and early treatment groups compared to DM with no treatment and late treatment groups. Histopathologically, Sham and early treatment groups showed normal cavernous tissue architecture with absent fibrosis. Conversely, DM with no treatment and late treatment groups showed distorted cavernous architecture and extensive fibrosis. SM to collagen ratio was significantly increased in sham and early treatment groups compared to DM with no treatment and late treatment groups. In the DM with no treatment and late treatment groups, we found significant downregulation of all NOS isoforms (iNOS, nNOS and eNOS) and upregulation of TGF-β1. Contrarily, in sham and early treatment groups, there was significant upregulation of all NOS isoforms and downregulation of TGF-β1.
According to the structural, ultrastructural and molecular biology findings of our study; we demonstrated that early administration of PDE5Is in DM men even if not presented with ED would prevent the upcoming deleterious effects of DM on erection in these patients. We recommend that early diagnosed DM men should receive chronic low-dose PDE5I as they are liable to develop ED sometime throughout their disease period. Nevertheless, there is still a long way to go in that multifactorial perspective and further research should be conducted on a large scale multicenter and long-term studies.
Conclusion
Early administration of PDE5I prevents the deleterious effects of DM on erection in a rat model of DM. Sham and early treated rats had preserved erection and keep normal structure, ultrastructure and molecular biology aspects. Non-treated rats had marked cavernosal fibrosis and disturbed neural/endothelial and molecular profiles. The association between DM and ED is a multifactorial ongoing process.
Recommendations
- We may consider early administration of PDE5Is in early diagnosed DM-associated ED men, this may prevent the upcoming deleterious effects of DM on erection in these patients.
- DM patient is very liable to develop ED sometime throughout his disease period; accordingly, DM should be strictly controlled to avoid future development of ED
- Further research should be considered on a larger scale multicenter and long-term study to reach a solid conclusion regarding the benefit of early administration of PDE5I in patients with DM-associated ED. Researchers should also consider running screening programs to diagnose and follow-up ED in patients with early diagnosis of DM
References
Aboseif, S. et al. (1993) .Quantification of prostaglandin E1 receptors in cavernous tissue of men, monkeys and dogs., Urologia internationalis, 50(3), p. 148–52.
Ahn, G. J. et al. (2009) .Increased expression of the nitric oxide synthase gene and protein in corpus cavernosum by repeated dosing of udenafil in a rat model of chemical diabetogenesis., Asian journal of andrology, 11(4), p. 435–42. Available at: http://www.ncbi.nlm.nih.gov/pubmed/19465935 (Accessed: 15 February 2016).
Akingba, A. G. and Burnett, A. L. (2001) .Endothelial nitric oxide synthase protein expression, localization, and activity in the penis of the alloxan-induced diabetic rat, Mol Urol, 5(4), p. 189–197.
Andersson, K. E. and Holmquist, F. (1994) .Regulation of tone in penile cavernous smooth muscle. Established concepts and new findings., World journal of urology, 12(5), p. 249–61.
Andersson, K. E. and Wagner, G. (1995) .Physiology of penile erection, Physiological Reviews, 75(1), p. 191–236.
Araña Rosaínz, M. de J. et al. (2011) .Imbalanced low-grade inflammation and endothelial activation in patients with type 2 diabetes mellitus and erectile dysfunction, Journal of Sexual Medicine, 8(7), p. 2017–2030. Available at: http://linkinghub.elsevier.com/retrieve/pii/S1743609515335992 (Accessed: 15 June 2017).
Aversa, A. et al. (2008) .Chronic administration of Sildenafil improves markers of endothelial function in men with Type 2 diabetes, Diabetic Medicine, 25(1), p. 37–44. Available at: http://www.ncbi.nlm.nih.gov/pubmed/18199130 (Accessed: 15 June 2017).
Bai, Y. and An, R. (2015) .Resveratrol and sildenafil synergistically improve diabetes-associated erectile dysfunction in streptozotocin-induced diabetic rats., Life sciences, 135, p. 43–8. Available at: http://www.ncbi.nlm.nih.gov/pubmed/26006044 (Accessed: 15 February 2016).
Balza, E. et al. (1988) .Transforming growth factor β regulates the levels of different fibronectin isoforms in normal human cultured fibroblasts, FEBS Letters, 228(1), p. 42–44.
Bancroft, J.D. and Gamble, M. (2008) Theory and practices of histological technique, Churchill Living stone. London. Edited by B. J. and G. M. Edinburg, London: Churchill Livingstone.
Beavo, J. a (1995) .Cyclic nucleotide phosphodiesterases: functional implications of multiple isoforms., Physiological reviews, 75(4), p. 725–748.
Bivalacqua, T. J. et al. (2001) .Increased Expression of Arginase II in Human Diabetic Corpus Cavernosum: In Diabetic-Associated Erectile Dysfunction, Biochemical and Biophysical Research Communications, 283(4), p. 923–927. Available at: http://linkinghub.elsevier.com/retrieve/pii/S0006291X01948740.
Bivalacqua, T. J. et al. (2003) .Gene transfer of endothelial nitric oxide synthase partially restores nitric oxide synthesis and erectile function in streptozotocin diabetic rats., The Journal of Urology, 169(5), p. 1911–1917. Available at: http://linkinghub.elsevier.com/retrieve/pii/S0022534705637135 (Accessed: 17 June 2017).
Bivalacqua, T. J. et al. (2004) .RhoA/Rho-kinase suppresses endothelial nitric oxide synthase in the penis: A mechanism for diabetes-associated erectile dysfunction, Proceedings of the National Academy of Sciences, 101(24), p. 9121–9126. Available at: http://www.pnas.org/cgi/doi/10.1073/pnas.0400520101.
Border, W. A. and Ruoslahti, E. (1992) .Transforming growth factor-beta in disease: the dark side of tissue repair., Journal of Clinical Investigation, 90(1), p. 1–7. Available at: http://www.jci.org/articles/view/115821 (Accessed: 15 June 2017).
Branton, M. H. and Kopp, J. B. (1999) .TGF-β and fibrosis, Microbes and Infection, 1(15), p. 1349–1365.
Brock, G. (2000) .Erectile dysfunction update education forum summary, The Canadian journal of urology, 8(6), p. 1416–8.
Burnett, A. L. et al. (1992) .Nitric oxide: a physiologic mediator of penile erection., Science (New York, N.Y.), 257(5068), p. 401–3.
Burnett, A. L. (1997) .Nitric Oxide in the Penis: Physiology and Pathology, The Journal of Urology, 157(1), p. 320–324. Available at: http://www.sciencedirect.com/science/article/pii/S0022534701653692.
Burnett, A. L. (2005) .Phosphodiesterase 5 mechanisms and therapeutic applications, Am J Cardiol, 96(12B), p. 29M–31M. Available at: http://www.ncbi.nlm.nih.gov/pubmed/16387563%5Cnhttp://www.ajconline.org/article/S0002-9149(05)01123-9/abstract.
Burnett, A. L. et al. (2009) .Serum Biomarker Measurements of Endothelial Function and Oxidative Stress After Daily Dosing of Sildenafil in Type 2 Diabetic Men With Erectile Dysfunction, Journal of Urology, 181(1), p. 245–251. Available at: http://linkinghub.elsevier.com/retrieve/pii/S0022534708024233 (Accessed: 15 June 2017).
Burnett, A. L. and Musicki, B. (2005) .The nitric oxide signaling pathway in the penis., Current pharmaceutical design, 11(31), p. 3987–3994.
Buvat, J. et al. (2014) .Continuation and effectiveness of tadalafil once daily during a 6-month observational study in erectile dysfunction: The EDATE study, International Journal of Clinical Practice, 68(9), p. 1087–1099. Available at: http://www.ncbi.nlm.nih.gov/pubmed/25123817 (Accessed: 17 June 2017).
Carrier, S. et al. (1993) .Pathophysiology of erectile dysfunction., Urology, 42(4), p. 468–81. Available at: http://www.ncbi.nlm.nih.gov/pubmed/8212453 (Accessed: 15 June 2017).
Carson, C. C. and Lue, T. F. (2005) .Phosphodiesterase type 5 inhibitors for erectile dysfunction, BJU International, 96(3), p. 257–280.
Castilla, A., Prieto, J. and Fausto, N. (1991) .Transforming Growth Factors β and α in Chronic Liver Disease Effects of Interferon Alfa Therapy, New England Journal of Medicine, 324(14), p. 933–940. Available at: http://www.nejm.org/doi/abs/10.1056/NEJM199104043241401 (Accessed: 16 June 2017).
Cho, N. H. et al. (2006) .Prevalence of erectile dysfunction in Korean men with Type 2 diabetes mellitus, Diabetic Medicine, 23(2), p. 198–203. Available at: http://www.ncbi.nlm.nih.gov/pubmed/16433719 (Accessed: 6 July 2017).
Choi, W. S. et al. (2015) .Effect of chronic administration of PDE5 combined with glycemic control on erectile function in streptozotocin-induced diabetic rats., The journal of sexual medicine, 12(3), p. 600–610. Available at: http://www.ncbi.nlm.nih.gov/pubmed/25411013 (Accessed: 15 February 2016).
Dawson, B. and Trapp, R. (2004) .Basic and clinical biostatistics. Edited by T. Dowson. USA: McGraw-Hill.
El-Sakka, A. et al. (1998) .Histological and ultrastructural alterations in an animal model of Peyronie’s disease, British Journal of Urology-Including Free CD ROM, 81(3), p. 445–452.
El-Sakka, A. et al. (2011) .Sildenafil for Erectile Dysfunction in the Middle East: Observational Analysis of Patients with Diabetes and/or Hypertension Treated in the Clinical Practice Setting, Journal of International Medical Research, 39(2), p. 558–568. Available at: http://journals.sagepub.com/doi/10.1177/147323001103900225.
El-Sakka, A. (2017) .Evaluation of Erectile Disorder, in IsHak, W. W. (ed.) The Textbook of Clinical Sexual Medicine. Springer International Publishing, p. 169–186.
El-Sakka, A. I., Hassoba, H. M., Chui, R. M., et al. (1997) .An animal model of Peyronie’s-like condition associated with an increase of transforming growth factor β mRNA and protein expression, J Urol, 158(6), p. 2284–2290. Available at: http://www.ncbi.nlm.nih.gov/entrez/query.fcgi?cmd=Retrieve&db=PubMed&dopt=Citation&list_uids=9366377 (Accessed: 15 June 2017).
El-Sakka, A. I., Hassoba, H. M., Pillarisetty, R. J., et al. (1997) .Peyronie’s disease is associated with an increase in transforming growth factor-beta protein expression., The Journal of urology, 158(4), p. 1391–1394. Available at: http://www.ncbi.nlm.nih.gov/pubmed/9302128 (Accessed: 15 June 2017).
El-Sakka, A. I. et al. (1999) .Effects of diabetes on nitric oxide synthase and growth factor genes and protein expression in an animal model., International journal of impotence research, 11(3), p. 123–132.
El-Sakka, A. I. (2003) .Penile axial rigidity and Doppler ultrasonography parameters in patients with erectile dysfunction: association with type 2 diabetes., Urology, 62(3), p. 525–531.
El-Sakka, A. I. (2004) .Characteristics of erectile dysfunction in Saudi patients., International journal of impotence research. Nature Publishing Group, 16(1), p. 13–20. Available at: http://www.ncbi.nlm.nih.gov/pubmed/14963466 (Accessed: 16 June 2017).
El-Sakka, A. I. (2012a) .Erectile dysfunction in Arab countries. Part I: Prevalence and correlates, Arab Journal of Urology. Arab Association of Urology, 10(2), p. 97–103. Available at: http://dx.doi.org/10.1016/j.aju.2012.01.004.
El-Sakka, A. I. (2012b) .Erectile dysfunction in Arab countries. Part II: Diagnosis and treatment, Arab Journal of Urology. Arab Association of Urology, 10(2), p. 104–109. Available at: http://dx.doi.org/10.1016/j.aju.2012.02.001.
El-Sakka, A. I. and Lue, T. F. (2004) .Physiology of Penile Erection, The Scientific World JOURNAL, 4(1), p. 128–134. Available at: http://www.hindawi.com/journals/tswj/2004/491269/abs/ (Accessed: 17 June 2017).
El-Sakka, A. I. and Tayeb, K. A. (2003) .Erectile dysfunction risk factors in noninsulin dependent diabetic Saudi patients, the Journal of Urology, 169(3), p. 1043–1047.
El-Sakka, A. I. and Tayeb, K. A. (2005) .Peyronie’S Disease in Diabetic Patients Being Screened for Erectile Dysfunction, The Journal of Urology, 174(3), p. 1026–30. Available at: http://linkinghub.elsevier.com/retrieve/pii/S0022534701684994 (Accessed: 17 June 2017).
El-Sakka, A. I. and Tayeb, K. A. (2009) .Vascular impairment of erection in patients with diabetes and Peyronie’s disease: Is that accumulative?, Journal of Sexual Medicine, 6(6), p. 1736–1742.
El-Sakka, A. I. and Yassin, A. a (2010) .Amelioration of penile fibrosis: myth or reality., Journal of andrology, 31(4), p. 324–35. Available at: http://www.ncbi.nlm.nih.gov/pubmed/19926883.
Elabbady, A. et al. (1995) .Diabetes mellitus increases nitric oxide synthase in penises but not in major pelvic ganglia of rats, British Journal of Urology, 76(2), p. 196–202.
Fazio, L. and Brock, G. (2004) .Erectile dysfunction: management update., CMAJ : Canadian Medical Association journal = journal de l’Association medicale canadienne, 170(9), p. 1429–1437.
Feldman, H. A. et al. (1994) .Impotence and its medical and psychosocial correlates: results of the Massachusetts Male Aging Study., The Journal of urology, 151(1), p. 54–61.
Ferrini, M. G. et al. (2006) .Vardenafil prevents fibrosis and loss of corporal smooth muscle that occurs after bilateral cavernosal nerve resection in the rat, Urology, 68(2), p. 429–435.
Francis, S. H. and Corbin, J. D. (2011) .PDE5 inhibitors: Targeting erectile dysfunction in diabetics, Current Opinion in Pharmacology. Elsevier Ltd, 11(6), p. 683–688. Available at: http://dx.doi.org/10.1016/j.coph.2011.08.004.
Fuchs, A. M., Mehringer, C. M. and Rajfer, J. (1989) .Anatomy of penile venous drainage in potent and impotent men during cavernosography., The Journal of urology, 141(6), p. 1353–6.
Glina, S., Sharlip, I. D. and Hellstrom, W. J. G. (2013) .Modifying Risk Factors to Prevent and Treat Erectile Dysfunction, Journal of Sexual Medicine, 10(1), p. 115–119.
Goldstein, I. et al. (1998) .Oral sildenafil in the treatment of erectile dysfunction. Sildenafil Study Group., The New England journal of medicine, 338(20), p. 1397–404. Available at: http://www.nejm.org/doi/abs/10.1056/NEJM199805143382001 (Accessed: 6 July 2017).
Gonzalez-Cadavid, N. F. and Rajfer, J. (2010) .Treatment of Peyronie’s disease with PDE5 inhibitors: an antifibrotic strategy, Nat Rev Urol, 7(4), p. 215–221.
Gratzke, C. et al. (2010) .Anatomy, Physiology, and Pathophysiology of Erectile Dysfunction, The Journal of Sexual Medicine, 7(1), p. 445–475. Available at: http://linkinghub.elsevier.com/retrieve/pii/S1743609515328563.
Hakim, L. S. and Goldstein, I. (1996) .Diabetic sexual dysfunction, Endocrinology and Metabolism Clinics of North America, p. 379–400.
Hatzichristou, D. et al. (2015) .Tadalafil 5 mg once daily for the treatment of erectile dysfunction during a 6-month observational study (EDATE): impact of patient characteristics and comorbidities, BMC Urology. BioMed Central, 15(1), p. 111. Available at: http://bmcurol.biomedcentral.com/articles/10.1186/s12894-015-0107-5 (Accessed: 17 June 2017).
Hedlund, P. et al. (1994) .Localization and effects of pituitary adenylate cyclase-activating polypeptide (PACAP) in human penile erectile tissue., Acta physiologica Scandinavica, 150(1), p. 103–4. Available at: http://doi.wiley.com/10.1111/j.1748-1716.1994.tb09665.x (Accessed: 5 July 2017).
Hegazi, R. et al. (2015) .Epidemiology of and Risk Factors for Type 2 Diabetes in Egypt, Annals of Global Health, 81(6), p. 814–820. Available at: http://www.ncbi.nlm.nih.gov/pubmed/27108148 (Accessed: 3 July 2017).
Herman, W. H. et al. (1995) .Diabetes mellitus in Egypt: Risk factors and prevalence, Diabetic Medicine, 12(12), p. 1126–1131.
Hidalgo-Tamola, J. and Chitaley, K. (2009) .Review type 2 diabetes mellitus and erectile dysfunction, J Sex Med, 6(4), p. 916–926. Available at: http://www.ncbi.nlm.nih.gov/entrez/query.fcgi?cmd=Retrieve&db=PubMed&dopt=Citation&list_uids=19067787.
Hohenstein, B. et al. (2008) .PDE-5 inhibition impedes TSP-1 expression, TGF-beta activation and matrix accumulation in experimental glomerulonephritis, Nephrology Dialysis Transplantation, 23(11), p. 3427–3436.
Hotta, Y. et al. (2011) .Chronic vardenafil treatment improves erectile function via structural maintenance of penile corpora cavernosa in rats with acute arteriogenic erectile dysfunction, Journal of Sexual Medicine, 8(3), p. 705–711.
Hurt, K. J. et al. (2002) .Akt-dependent phosphorylation of endothelial nitric-oxide synthase mediates penile erection., Proceedings of the National Academy of Sciences of the United States of America, 99(6), p. 4061–6. Available at: http://www.pubmedcentral.nih.gov/articlerender.fcgi?artid=122648&tool=pmcentrez&rendertype=abstract (Accessed: 17 June 2017).
Hyttinen, V. et al. (2003) .Genetic liability of type 1 diabetes and the onset age among 22, 650 young Finnish twin pairs: A nationwide follow-up study, Diabetes, 52(4), p. 1052–1055.
Ishibashi, Y., Matsui, T., Takeuchi, M. and Yamagishi, S. I. (2011) .Vardenafil, an inhibitor of phosphodiesterase-5, blocks advanced glycation end product (AGE)-induced up-regulation of monocyte chemoattractant protein-1 mRNA levels in endothelial cells by suppressing AGE receptor (RAGE) expression via elevation of cGMP, Clinical and Experimental Medicine, 11(2), p. 131–135. Available at: http://www.ncbi.nlm.nih.gov/pubmed/20803229 (Accessed: 15 June 2017).
Ishibashi, Y., Matsui, T., Takeuchi, M. and Yamagishi, S. (2011) .Vardenafil, an inhibitor of phosphodiesterase-5, blocks advanced glycation end product (AGE)-induced up-regulation of monocyte chemoattractant protein-1 mRNA levels in endothelial cells by suppressing AGE receptor (RAGE) expression via elevation of cGMP, Clinical and Experimental Medicine, 11(2), p. 131–135. Available at: http://link.springer.com/10.1007/s10238-010-0109-2 (Accessed: 15 June 2017).
Ismail, E. A. and El-Sakka, A. I. (2016) .Innovative trends and perspectives for erectile dysfunction treatment: A systematic review, Arab Journal of Urology, p. 84–93.
Ismail, E. A. and El-Sakka, A. I. (2017) .Treatment of Erectile Disorder, in IsHak, W. W. (ed.) The Textbook of Clinical Sexual Medicine. Cham: Springer International Publishing, p. 187–201.
Jansso, P. A. et al. (2010) .Tadalafil increases muscle capillary recruitment and forearm glucose uptake in women with type 2 diabetes, Diabetologia, 53(10), p. 2205–2208.
Johannes, C. B. et al. (2000) .Incidence of erectile dysfunction in men 40 to 69 years old: longitudinal results from the Massachusetts male aging study., The Journal of urology, 163(2), p. 460–3.
Kang, L. et al. (2011) .Diet-induced muscle insulin resistance is associated with extracellular matrix remodeling and interaction with integrin ??2?? 1in mice, Diabetes, 60(2), p. 416–426. Available at: http://www.ncbi.nlm.nih.gov/pubmed/21270253 (Accessed: 17 June 2017).
Khera, M. and Goldstein, I. (2011) .Clinical Evidence: Erectile Dysfunction, Men’s Health, 2011(August 2009), p. 1–38.
Kim, E. et al. (2015) .Comparative efficacy of tadalafil once daily in men with erectile dysfunction who demonstrated previous partial responses to as-needed sildenafil, tadalafil, or vardenafil, Current Medical Research and Opinion, 31(2), p. 379–389. Available at: http://www.tandfonline.com/doi/full/10.1185/03007995.2014.989317 (Accessed: 17 June 2017).
Kim, Y. C. et al. (1995) .Modulation of vasoactive intestinal polypeptide (VIP)-mediated relaxation by nitric oxide and prostanoids in the rabbit corpus cavernosum., The Journal of urology, 153(3 Pt 1), p. 807–10.
Kirkeby, H. J. et al. (1992) .Vasoactive intestinal polypeptide (VIP) and peptide histidine methionine (PHM) in human penile corpus cavernosum tissue and circumflex veins: localization and in vitro effects., European journal of clinical investigation, 22(1), p. 24–30.
Kovanecz, I. et al. (2008) .Chronic daily tadalafil prevents the corporal fibrosis and veno-occlusive dysfunction that occurs after cavernosal nerve resection, BJU International, 101(2), p. 203–210.
Kovanecz, I. et al. (2009) .Early onset of fibrosis within the arterial media in a rat model of type 2 diabetes mellitus with erectile dysfunction, BJU international, 103(10), p. 1396–1404. Available at: http://www.ncbi.nlm.nih.gov/entrez/query.fcgi?cmd=Retrieve&db=PubMed&dopt=Citation&list_uids=19154511.
Kuno, Y. et al. (2011) .Sildenafil, a phosphodiesterase type 5 inhibitor, attenuates diabetic nephropathy in non-insulin-dependent Otsuka Long-Evans Tokushima Fatty rats, British Journal of Pharmacology, 162(6), p. 1389–1400.
L., D. et al. (2012) .Daily use of sildenafil improves endothelial function in men with type 2 diabetes., Journal of andrology, 33(2), p. 176–180.
Lee, J. H. et al. (2010) .Pharmacokinetics of drugs in rats with diabetes mellitus induced by alloxan or streptozocin: comparison with those in patients with type I diabetes mellitus., The Journal of pharmacy and pharmacology, 62(1), p. 1–23. Available at: http://www.ncbi.nlm.nih.gov/pubmed/20722995 (Accessed: 17 June 2017).
Lee, K. C. J. and Brock, G. B. (2013) .Daily dosing of PDE5 inhibitors: Where does it fit in?, Current Urology Reports, 14(4), p. 269–278.
Levy, J. (2002) .Impotence and its medical and psychosocial correlates: results of the Massachusetts Male Aging Study, The British Journal of Diabetes & Vascular Disease, 2(4), p. 278–280. Available at: http://dvd.sagepub.com/cgi/doi/10.1177/14746514020020040801 (Accessed: 15 June 2017).
Li, W. J. et al. (2013) .P144, A TGF-β1 Antagonist Peptide, Synergizes with Sildenafil and Enhances Erectile Response via Amelioration of Cavernosal Fibrosis in Diabetic Rats, Journal of Sexual Medicine, 10(12), p. 2942–2951.
Lu, J. et al. (2016) .Beneficial effect of PEDF-transfected ADSCs on erectile dysfunction in a streptozotocin-diabetic rat model, Cell and Tissue Research. Cell and Tissue Research, 366(3), p. 623–637. Available at: http://dx.doi.org/10.1007/s00441-016-2494-7.
Lue T, B. G. (2006) .Evaluation and nonsurgical management of erectile dysfunction and premature ejaculation., in Walsh PC, Retik AB, Vaughan ED, W. A. (ed.) Campbell’s urology. 9th edn. Philadelphia, PA: WB Saunders, p. 750–87.
Lukić, M. L., Stosić-Grujicić, S. and Shahin, a (1998) .Effector mechanisms in low-dose streptozotocin-induced diabetes., Developmental immunology, 6(1–2), p. 119–28. Available at: http://www.ncbi.nlm.nih.gov/pubmed/23968688.
Magee, T. R. et al. (2002) .Gene therapy of erectile dysfunction in the rat with penile neuronal nitric oxide synthase, Biol Reprod, 67(1), p. 20–28.
Magee, T. R. et al. (2002) .Gene therapy of erectile dysfunction in the rat with penile neuronal nitric oxide synthase., Biology of reproduction, 67(3), p. 1033–1041.
Malavige, L. S. et al. (2014) .Erectile dysfunction is a strong predictor of poor quality of life in men with Type 2 diabetes mellitus, Diabetic Medicine, 31(6), p. 699–706. Available at: http://doi.wiley.com/10.1111/dme.12412 (Accessed: 17 June 2017).
Malavige, L. S. and Levy, J. C. (2009) .Erectile dysfunction in diabetes mellitus, Journal of Sexual Medicine, p. 1232–1247.
Mammi, C. et al. (2011) .Sildenafil reduces insulin-resistance in human endothelial cells, PLoS ONE, 6(1).
McKinlay, J. B. (2000) .The worldwide prevalence and epidemiology of erectile dysfunction., International journal of impotence research.
Meena, B. L. et al. (2009) .Association between erectile dysfunction and cardiovascular risk in individuals with type-2 diabetes without overt cardiovascular disease., International journal of diabetes in developing countries. Springer, 29(4), p. 150–4. Available at: http://www.ncbi.nlm.nih.gov/pubmed/20336196 (Accessed: 15 June 2017).
Montorsi, F. et al. (2004) .Earliest time to onset of action leading to successful intercourse with vardenafil determined in an at-home setting: A randomized, double-blind, placebo-controlled trial, Journal of Sexual Medicine, 1(2), p. 168–178. Available at: http://www.ncbi.nlm.nih.gov/pubmed/16422971 (Accessed: 17 June 2017).
Morano, S. et al. (2007) .Antioxidant Treatment Associated with Sildenafil Reduces Monocyte Activation and Markers of Endothelial Damage in Patients with Diabetic Erectile Dysfunction: A Double-Blind, Placebo-Controlled Study, European Urology, 52(6), p. 1768–1776. Available at: http://www.ncbi.nlm.nih.gov/pubmed/17478034 (Accessed: 15 June 2017).
Mostafa, M. E., Senbel, A. M. and Mostafa, T. (2013) .Effect of chronic low-dose tadalafil on penile cavernous tissues in diabetic rats, Urology. Elsevier Inc., 81(6), p. 1253–1259. Available at: http://dx.doi.org/10.1016/j.urology.2012.12.068 (Accessed: 6 July 2017).
Mostafa, T. et al. (2012) .Effect of testosterone and frequent low-dose sildenafil/tadalafil on cavernous tissue oxidative stress of aged diabetic rats, Andrologia, 44(6), p. 411–415.
Mostafa, T., Rashed, L. a and Kotb, K. (2010) .Testosterone and chronic sildenafil/tadalafil anti-apoptotic role in aged diabetic rats., International journal of impotence research. Nature Publishing Group, 22(4), p. 255–261. Available at: http://dx.doi.org/10.1038/ijir.2010.12.
Nagayama, T. et al. (2009) .Sildenafil Stops Progressive Chamber, Cellular, and Molecular Remodeling and Improves Calcium Handling and Function in Hearts With Pre-Existing Advanced Hypertrophy Caused by Pressure Overload, Journal of the American College of Cardiology, 53(2), p. 207–215.
Neves, D. (2013) .Advanced glycation end-products: a common pathway in diabetes and age-related erectile dysfunction., Free radical research, 47 Suppl 1(August), p. 49–69. Available at: http://www.ncbi.nlm.nih.gov/pubmed/23822116.
NIH (1993) .Consensus development conference statement. Impotence. December 7-9, 1992., International journal of impotence research, 5(4), p. 181–284.
NRC (2011) Guide, Guide for the Care and Use of Laboratory Animals. Available at: http://www.ncbi.nlm.nih.gov/pubmed/21595115.
Penson, D. F. et al. (2003) .Do impotent men with diabetes have more severe erectile dysfunction and worse quality of life than the general population of impotent patients? Results from the Exploratory Comprehensive Evaluation of Erectile Dysfunction (ExCEED) database., Diabetes care, 26(4), p. 1093–9.
Prieto, D. (2008) .Physiological regulation of penile arteries and veins., International journal of impotence research, 20(1), p. 17–29.
Rajagopalan, P. et al. (2003) .Effect of High-Fat Breakfast and Moderate-Fat Evening Meal on the Pharmacokinetics of Vardenafil, an Oral Phosphodiesterase-5 Inhibitor for the Treatment of Erectile Dysfunction, The Journal of Clinical Pharmacology, 43(3), p. 260–267. Available at: http://doi.wiley.com/10.1177/0091270002250604 (Accessed: 17 June 2017).
Rajfer, J. et al. (1992) .Nitric Oxide as a Mediator of Relaxation of the Corpus Cavernosum in Response to Nonadrenergic, Noncholinergic Neurotransmission, New England Journal of Medicine, 326(2), p. 90–94. Available at: http://www.nejm.org/doi/abs/10.1056/NEJM199201093260203 (Accessed: 17 June 2017).
Ramasamy, R., Yan, S. F. and Schmidt, A. M. (2011) .Receptor for AGE (RAGE): signaling mechanisms in the pathogenesis of diabetes and its complications., Annals of the New York Academy of Sciences. NIH Public Access, 1243, p. 88–102. Available at: http://www.ncbi.nlm.nih.gov/pubmed/22211895 (Accessed: 15 June 2017).
Ritchie, R. and Sullivan, M. (2011) .Endothelins & erectile dysfunction, Pharmacological Research, p. 496–501.
Rizzo, N. O. et al. (2010) .Reduced NO-cGMP signaling contributes to vascular inflammation and insulin resistance induced by high-fat feeding, Arteriosclerosis, Thrombosis, and Vascular Biology, 30(4), p. 758–765.
Russell, J. W. et al. (2002) .High glucose-induced oxidative stress and mitochondrial dysfunction in neurons, The FASEB Journal, 16(13), p. 1738–1748. Available at: http://www.ncbi.nlm.nih.gov/pubmed/12409316 (Accessed: 17 June 2017).
Saenz de Tejada, I. et al. (1989) .Regulation of adrenergic activity in penile corpus cavernosum., The Journal of urology, 142(4), p. 1117–21.
Sáenz de Tejada, I. et al. (1988) .Cholinergic neurotransmission in human corpus cavernosum. I. Responses of isolated tissue., The American journal of physiology, 254(3 Pt 2), p. H459-67.
Sáenz de Tejada, I. (2002) .Molecular mechanisms for the regulation of penile smooth muscle contractility, International Journal of Impotence Research, 14(s1), p. S6–S10. Available at: http://www.nature.com/doifinder/10.1038/sj.ijir.3900790.
Sánchez, A. et al. (2012) .Role of neural no synthase (NNOS) uncoupling in the dysfunctional nitrergic vasorelaxation of penile arteries from insulin-resistant obese zucker rats, PLoS ONE, 7(4).
Schäfer, A. et al. (2008) .Improvement of vascular function by acute and chronic treatment with the PDE-5 inhibitor sildenafil in experimental diabetes mellitus, Br.J.Pharmacol., 153(5), p. 886–893. Available at: http://www.ncbi.nlm.nih.gov/pmc/articles/PMC2267262/pdf/0707459a.pdf.
Schmittgen, T. D. and Livak, K. J. (2008) .Analyzing real-time PCR data by the comparative CT method, Nature Protocols, 3(6), p. 1101–1108. Available at: http://www.nature.com/doifinder/10.1038/nprot.2008.73.
Seid, A. et al. (2017) .Prevalence and determinants of erectile dysfunction among diabetic patients attending in hospitals of central and northwestern zone of Tigray, northern Ethiopia: a cross-sectional study, BMC Endocrine Disorders. BMC Endocrine Disorders, 17(1), p. 16. Available at: http://bmcendocrdisord.biomedcentral.com/articles/10.1186/s12902-017-0167-5.
Seyam, R. M. et al. (2003) .Prevalence of erectile dysfunction and its correlates in Egypt: a community-based study, International Journal of Impotence Research, 15(4), p. 237–245. Available at: http://www.nature.com/doifinder/10.1038/sj.ijir.3901000 (Accessed: 16 June 2017).
Shaeer, K. Z. M. et al. (2003) .Prevalence of erectile dysfunction and its correlates among men attending primary care clinics in three countries: Pakistan, Egypt, and Nigeria, International Journal of Impotence Research, 15(S1), p. S8–S14. Available at: http://www.nature.com/doifinder/10.1038/sj.ijir.3900971 (Accessed: 16 June 2017).
Shukla, N. et al. (2009) .Effect of hydrogen sulphide-donating sildenafil (ACS6) on erectile function and oxidative stress in rabbit isolated corpus cavernosum and in hypertensive rats, BJU International, 103(11), p. 1522–1529.
Siddiqui, M. A. et al. (2012) .Erectile dysfunction in young surgically treated patients with lumbar spine disease: a prospective follow-up study., Spine, 37(9), p. 797–801. Available at: http://content.wkhealth.com/linkback/openurl?sid=WKPTLP:landingpage&an=00007632-201204200-00013 (Accessed: 5 July 2017).
Sohn, D. W. et al. (2008) .Elevation of intracavernous pressure and NO-cGMP activity by a new herbal formula in penile tissues of spontaneous hypertensive male rats, Journal of Ethnopharmacology, 120(2), p. 176–180.
Solomon, T. P. J. et al. (2008) .Exercise and diet enhance fat oxidation and reduce insulin resistance in older obese adults, Journal of Applied Physiology, 104(5), p. 1313–1319. Available at: http://jap.physiology.org/cgi/doi/10.1152/japplphysiol.00890.2007 (Accessed: 17 June 2017).
Sporn, M. B. and Roberts, A. B. (1992) .Transforming growth factor-beta: recent progress and new challenges., The Journal of cell biology, 119(5), p. 1017–21. Available at: http://www.ncbi.nlm.nih.gov/pubmed/1332976%5Cnhttp://www.pubmedcentral.nih.gov/articlerender.fcgi?artid=PMC2289722.
Stief, C. G. et al. (1990) .A possible role for calcitonin-gene-related peptide in the regulation of the smooth muscle tone of the bladder and penis., The Journal of urology, 143(2), p. 392–7.
Stief, C. G. et al. (1998) .The effect of the specific phosphodiesterase (PDE) inhibitors on human and rabbit cavernous tissue in vitro and in vivo, Journal of Urology, 159(4), p. 1390–1393.
Tamás, V. and Kempler, P. (2014) .Sexual dysfunction in diabetes, in Handbook of Clinical Neurology, p. 223–232. Available at: http://www.ncbi.nlm.nih.gov/pubmed/25410225 (Accessed: 15 June 2017).
Ul-Hasan, M. et al. (1998) .Expression of TGF-beta-1 mRNA and ultrastructural alterations in pharmacologically induced prolonged penile erection in a canine model., The Journal of urology, 160(6 Pt 1), p. 2263–6.
Usta, M. F. et al. (2006) .The breakdown of preformed advanced glycation end products reverses erectile dysfunction in streptozotocin-induced diabetic rats: Preventive versus curative treatment, Journal of Sexual Medicine, 3(2), p. 242–252.
Veres, G. et al. (2013) .Addition of vardenafil into storage solution protects the endothelium in a hypoxia-reoxygenation model, European Journal of Vascular and Endovascular Surgery, 46(2), p. 242–248.
Wan, Z. H. et al. (2010) .Poly(ADP-Ribose) Polymerase Inhibition Improves Erectile Function in Diabetic Rats, J Sex Med, p. 1002–1014. Available at: http://www.ncbi.nlm.nih.gov/pubmed/20807334.
Wang, T. et al. (2013) .SaRNA guided iNOS Up-regulation improves erectile function of diabetic rats, Journal of Urology, 190(2), p. 790–798.
Wright, P. J. (2006) .Comparison of phosphodiesterase type 5 (PDE5) inhibitors, International Journal of Clinical Practice, 60(8), p. 967–975. Available at: http://www.ncbi.nlm.nih.gov/pubmed/16780568 (Accessed: 5 July 2017).
Yohannes, E. et al. (2010) .Molecular Targets for Diabetes Mellitus-associated Erectile Dysfunction, Molecular & Cellular Proteomics, 9(3), p. 565–578. Available at: http://www.mcponline.org/cgi/doi/10.1074/mcp.M900286-MCP200.
De Young, L. X. et al. (2008) .Endothelial Rehabilitation: The Impact of Chronic PDE5 Inhibitors on Erectile Function and Protein Alterations in Cavernous Tissue of Diabetic Rats, European Urology, 54(1), p. 213–220.
Zarifpour, M. et al. (2015) .Protective effect of tadalafil on the functional and structural changes of the rat ventral prostate caused by chronic pelvic ischemia, The Prostate, 75(3), p. 233–241. Available at: http://doi.wiley.com/10.1002/pros.22909.
Zhang, J. et al. (2012) .Icarisid II, a PDE5 inhibitor from Epimedium wanshanense, increases cellular cGMP by enhancing NOS in diabetic ED rats corpus cavernosum tissue, Andrologia, 44(SUPPL.1), p. 87–93.
Zhang, K. Q. et al. (2016) .Probucol Improves Erectile Function by Restoring Endothelial Function and Preventing Cavernous Fibrosis in Streptozotocin-induced Diabetic Rats, Urology, 91, p. 241e9-241e16.
Zhou, F. et al. (2012) .The TGF- 1/Smad/CTGF Pathway and Corpus Cavernosum Fibrous-Muscular Alterations in Rats With Streptozotocin-Induced Diabetes, Journal of Andrology, 33(4), p. 651–659. Available at: http://doi.wiley.com/10.2164/jandrol.111.014456.
Zhou, Z. Y. et al. (2016) .Short hairpin ribonucleic acid constructs targeting insulin-like growth factor binding protein-3 rehabilitated dyslipidaemia in diabetic rats, Andrologia, 48(1), p. 59–64.
Zimmet, P. et al. (2016) .Diabetes mellitus statistics on prevalence and mortality: facts and fallacies, Nature Reviews Endocrinology. Nature Publishing Group, 12(10), p. 616–622. Available at: http://www.nature.com/doifinder/10.1038/nrendo.2016.105.
Cite This Work
To export a reference to this article please select a referencing stye below:
Related Services
View all


Related Content
All TagsContent relating to: "Biomedical Science"
Biomedical Science focuses on how cells, organs and systems function in the human body and underpins much of modern medicine. Biomedical Science applies parts of natural and/or formal sciences to help develop advances in healthcare.
Related Articles

DMCA / Removal Request
If you are the original writer of this dissertation and no longer wish to have your work published on the UKDiss.com website then please: