Dynamic Risk-based Analysis of a Well Control System for Blowout Prevention
Info: 7678 words (31 pages) Dissertation
Published: 9th Dec 2019
Tagged: Risk Management
TABLE OF CONTENTS
SUMMARY TABLE OF CONTENTS LIST OF FIGURES LIST OF TABLES CHAPTER 1 INTRODUCTION 1.1 Background of the Study 1.2 Objectives of the Study 1.3 Scope of the Study CHAPTER 2 LITERATURE REVIEW 2.1 Risk Assessment and Management 2.1.1 Probability Risk Assessment (PRA) 2.1.1.1 Fault Tree Analysis (FTA) 2.1.1.2 Event Tree Analysis (ETA) 2.2 Bow-tie Approach 2.3 Bayesian Network. CHAPTER 3 METHODOLOGY 3.1 Risk Assessment Framework 3.1.1 Establishment of Risk Indicator 3.1.2 Primary Events and safety barrier Identification 3.1.3 Modelling Techniques CHAPTER 4 RESULTS AND DISCUSSION 4.1 Results 4.2 Discussion CHAPTER 5 CONCLUSIONS AND RECOMMENDATIONS 5.1 Conclusions 5.2 Recommendations REFERENCES Appendix A: Prior and Posterior Probability of the Primary Events Appendix B-I: GENIE Output of the Well Control System Failure Appendix B-II: GENIE Output of the Well Control System Failure with Set Evidence Appendix B-III: GENIE Output Safety Barriers FailureLIST OF FIGURES
Figure 2.2: Schematic of a Mud Circulating System (Oil and Gas Well Drilling and Servicing Tool, 2007) Figure 2.3: Bow–tie Logical Representation (Khakzad et al., 2012) Figure 3.1: Flowchart for Risk Assessment of Gulf of Mexico 2010 & 1978 Accidents Figure 3.2: Fault Tree for Well Head Hydrocarbon Discharge Occurrence for Gulf of Mexico 2010 & 1978 Accidents. Figure 3.2: Event Tree for Well Head Hydrocarbon Discharge Occurrence for Gulf of Mexico 2010 &1978 Event. Figure 4.1: Percentage Contribution of the Failure Modes for the Top EventLIST OF TABLES
Page Table 4.1: Safety Barriers and their Frequencies……………………………………………….14CHAPTER 1
INTRODUCTION
1.1 Background of the Study
Oil and gas exploitation operation is associated with a high degree of risk, especially in a harsh and remote environment. The well control mechanism is installed to technically control or minimize the associated risk. It also helps to minimize any compromise in course of well operation. Well control is crucial in every drilling activity, because such an operation is prompt to critical hazards and risk. NORSOK, (2010a) “described well control as an aggregate of all measures that can be applied to prevent uncontrolled release of wellbore effluents to the external environment or uncontrolled underground”. Well, control systems are of different types and application. It can be group into drilling control, completion control, workover control, production control and wireline operations control (Holand, 1997). Due to the complexity of the drilling process, the control system is divided into two stages, namely the primary and secondary well control barriers. The mud column function as the primary well barriers and it provide a range of hydrostatic pressure between the formation pore pressure and formation fracture pressure(Bergan, 2015). Safety Barriers are critical for the safe drilling operation, therefore if the mud column fails, there will an uncontrollable influx of formation fluid into the wellbore, which is described as kick (Fraser et al., 2014). The secondary barriers, in this case, is activated in response to the release due to the failure of the primary safety barrier. The blowout preventer (BOP) act in this regard as the secondary barrier and it consist of the combination of valves, four ran-type preventers and two annular- type preventers (Cai et al., 2012; Grace et al., 2003). Well control procedures are categories into four different sequential phases (Khakzad et al., 2013a). These are Kick prevention, Kick detection, Blowout prevention, and Killing operation. In an overbalanced drilling operation, kick prevention maintained the wellbore pressure at a higher level compared to the surrounding formation pressure. If a fracture occurs, there is a possibility of kick occurring due to the decrease in the hydrostatic pressure in the well, therefore kick prevention system is critical in safe well operation. The predominance conditions for a kick to occur in drilling operation includes (Grace et al., 2003):- Loss of circulation
- Mud cut
- Swabbing during tripping
- Formation pore pressure greater than the mud weight
- Hole is not kept full of mud while tripping
1.2 Objectives of the Study
- To conduct probability risk assessment on the British Petroleum (BP) Macondo Well blowout using Fault Tree Analysis (FTA), Event Tree Analysis (ETA) and Bow-tie (BT) approach.
- To identify technical aspects that could have been performed better to avoid the British Petroleum (BP) Macondo Well catastrophic incident.
1.3 Scope of the Study
- The study is limited to the dynamic risk assessment of the British Petroleum (BP) Macondo Well catastrophic incident of April 20, 2010, and the IXTOC-1 blowout on June 3, 1979.
- Detailed data on the IXTOC-1 blowout that occurred in the Gulf of Mexico on June 3, 1979, were not available. However, the event was assessed in the integrated risk tool system deployed in this study.
CHAPTER 2
LITERATURE REVIEW
Risk assessment has different approaches, especially in the oil and gas industry. Modarres, (2006) defined risk as a formal and systematic analysis to identify or quantify frequencies or probabilities and magnitude of losses to recipients due to exposure to hazards (physical, chemical, or microbial agents) from failures involving natural events and failures of hardware, software, and human systems. Risk management is a process that co-ordinates risk control, prevent and minimize losses on exposure. Its weighs alternatives, and select appropriate actions by assigning risk values, technology, and economic constraints, considering legal and political opinions (Modarres, 2006). Risk assessment in drilling operation involves the identification, estimation, evaluation, prevention, control, and minimization of losses incurred during the operation. Several studies and report (Abimbola et al., 2014; Bergan, 2015; Cai et al., 2012; Strand & Lundteigen, 2015) show the risks associated with well control operations by consequences analysis from different phases of the well control. Risk analysis from a dynamic perspective was presented by (Abimbola et al., 2014) for underbalanced drilling operations. Underbalanced and overbalanced drilling has their merits and demerits. In underbalanced drilling, it is either coiled tubing or jointed pipe drill string and when the hole size is less than 6-1/8”, coiled tubing is used otherwise, a jointed pipe drill string is employed(Abimbola et al., 2014). The gas generation equipment comprises the use of compressors for natural gas and nitrogen generation especially for offshore locations(Bergan, 2015). It also includes use of trucked tanks for the supply of cryogenic nitrogen for onshore rigs. The gas is used to achieve underbalanced situation by lightening or lifting the fluid in the column (drill string or annulus). The well control equipment includes the conventional (drilling) Blowout Preventer (BOP) stack, snubbing BOP, and the Emergency Shutdown (ESD) Valves. They also include part of the circulation equipment such as the primary and secondary flowlines, rotating diverters or rotating control head and snubbing unit(Bergan, 2015). These ensure that the well is put under control always during the drilling operation. The well control equipment schematic is as shown in Figure 2.1. and 2.2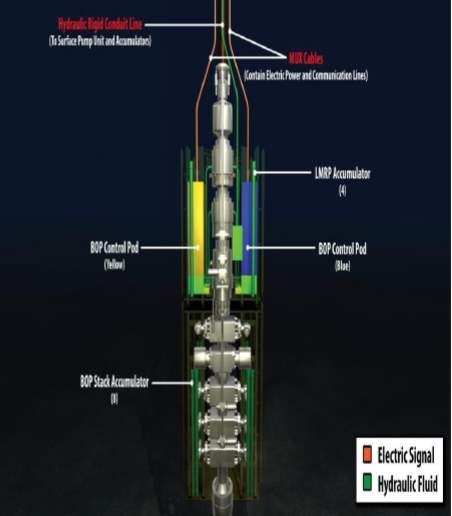 Figure 2.1: Deepwater Horizon BOP System (Chief Council, 2011)
In case of kick formation, the control system response by the circulation of the kill mud to push out the initial mud and regain the overbalanced condition with the BOP stack reopening the wellbore according. It is expected that the BOP control system must perform its desired function satisfactorily to safeguard operation. Strand & Lundteigen, (2015) presented a model that is recursive to implement automatically the BOP against any failure or kick initiation. They used a multiphase Markov model to predict the rate of failure and probability of failure on demand of the element of the BOP. This provides an efficient explicit trade-off to ensure BOP availability.
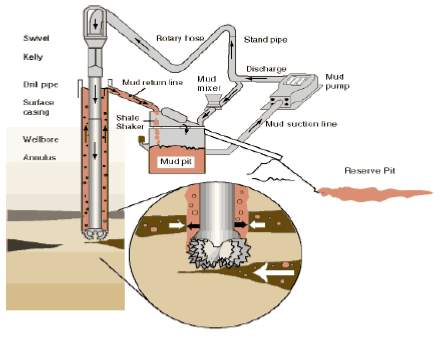
Figure 2.2: Schematic of a Mud Circulating System (Oil and Gas Well Drilling and Servicing Tool, 2007)
2.1 Risk Assessment and Management
Risk assessment and management is crucial for sustainable operation in the oil and gas industry. Risk management required a proactiveness to initial control, and minimize losses incurred due to a risk exposure, weighing alternatives, and selecting appropriate actions by considering risk values, economic and technology constraints, legal and political issues (Modarres, 2006). Risk assessment drilling operation involves the identification, estimation, evaluation, prevention, control, and minimization of losses incurred during the underbalanced drilling operation. Researchers have approach risk modeling from different perspectives and approaches(Abimbola, Khan, & Khakzad, 2014; Bergan, 2015; Khakzad et al., 2013; Strand & Lundteigen, 2015). Risk Management utilizes several formal techniques, methods, and tools including trade-off analysis, cost-benefit analysis, risk effectiveness, multi-attribute decision analysis and predictive failure analysis(Grace, Cudd, Carden, &Shursen, 2003; Modarres, 2006).2.1.1 Probability Risk Assessment (PRA)
This presents a systematic procedure for analyzing the complexity of the operating systems. It is an integrated model that factor human; software and hardware elements of a system interact with each other. It involves the use of Fault Tree (FT), Event Tree (ET) and Master Logic Diagram (MLD) analyses (Modarres, 2006)2.1.1.1 Fault Tree Analysis (FTA)
Fault Tree Analysis (FTA) present the primary events that occur which lead to the top event and are connected using logic gates. It is a deductive technique which the top event is the final outcomes which on the intermediate events at each stage leading to the top event occurrence. In AND gate analysis, the components interact in parallel structure and top event failure requires the simultaneous failure of all components under the gate(Adedigba, et. al 2016). The failure probability of the top event in parallel structure (AND gate) is calculated by equation 2.1. in OR gate analysis, the components interact in series structure and failure of any single components in series leads to failure of the top event. The failure probability of the top event in OR gate is calculated using equation 2.2. P=∏i=1nPi 2.1 P=∏i=1n1-Pi 2.22.1.1.2 Event Tree Analysis (ETA)
Event tree analysis (ETA) present a representation of mitigating event that may respond to the occurrence of an initiating event. ETA utilizes a visual logic tree structure known as an event tree (ET). It objectively uses an inductive procedure to determine whether the initiating event will develop into a serious mishap or if the event is sufficiently controlled by the safety systems and procedures implemented in the system design. The outcome probabilities of the event tree are calculated using equation 2.3. PCk=∏jϵSBkxiθi,k1-Xi1-θi,k 2.3 Where SBk denoted the safety barriers xiis the failure probabilities of the barriers.2.2 Bow-tie Approach
Bow-tie (BT) integrated framework combine the fault tree and event tree, to illustrate a comprehensive accident scenario. In this approach, the primary events that cause the accident in the fault tree) start the BT and the possible consequences of the event tree end the BT with the critical event representing both the top event of a fault tree and the initiating event of an event at the center as shown in Figure 2.3. From the BT diagram, it is clearly shown the logical relationship between the components of an accident scenario. Xu & Dugan, (2004) present a combination of the dynamic fault tree and event tree to illustrate a simple hypothetical example. Although, more research and application scenario need to be explored. The improved application is shown in (Khakzad et al., 2012).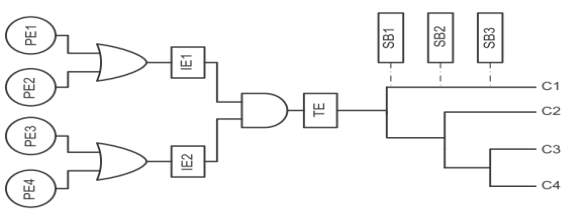
Figure 2.3: Bow–tie Logical Representation (Khakzad et al., 2012)
2.3 Bayesian Network.
The Bayesian network is a graphical tool that analyse the failure probability of a given scenario under uncertainty. BN is represented by what is called a direct acyclic graph with numerous nodes representing variables arcs signifying direct causal relationships among the linked nodes. The fault tree structure is transformed into a Bayesian network interface and the primary, intermediate and top event are denoted by nodes called root, intermediate and leaf nodes respectively(Khakzad, et al., 2013b). The Bayesian modelling is dynamic with the ability to accommodate various kinds of conditional dependency that FTA, ETA and Bow-tie cannot represent(Adedigba et al., 2016). The Bayesian network represents the joint probability distribution and its utilizes the Bayes’ theorem to update prior probability of basic event and the respective consequences. This form the posterior probability. Equation 2.3 is the Bayes’ theorem that is used to estimate the posterior probability in the Bayesian network structure. PUE=PU, E∑UPU,E 2.3CHAPTER 3
METHODOLOGY
3.1 Risk Assessment Framework
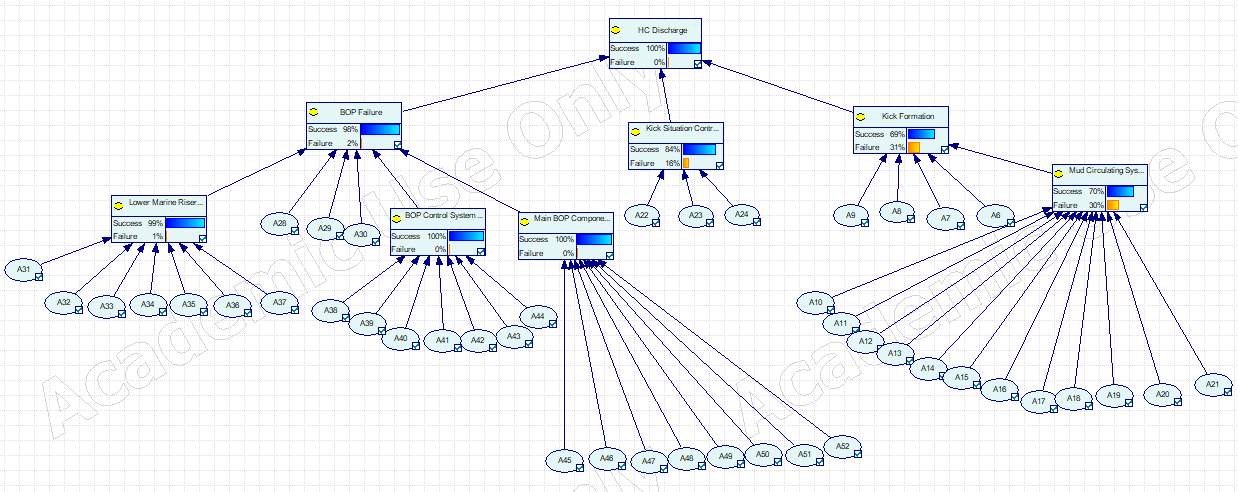
The method adopted involve the risk assessment of the Macondo accident by identifying the basic events, the intermediate events that resulted to the hydrocarbon release. The methods take into consideration the likelihood of occurrence and severity of the consequences. The model considered the safety barrier performance with rated probability on demand. In this research the identified causative events were presented using fault tree and the top event probability evaluated. The event was used to present estimate the likelihood occurrence based on the historical data of the safety barriers. The Bow-tie was used to incorporate the fault and event tree for the accident scenario. The methodology is outlined in Figure 3.1 and is given further explanation.3.1.1 Establishment of Risk Indicator
The assessment of the prevailing risk associated with the case study help us to identify critical risk indicators that resulted to the accident. This information was gathered from expert, report and relevant literature on the accident was used to established. We identified kick formation, Shut-in control system failure and blowout prevention failure as critical risk indicators.3.1.2 Primary Events and safety barrier Identification
The assessment further revealed the basic contributing factors or components that make up the critical risk indicators. This identification helps up to group them based on their critical ranking to the failure mode of the critical risk indicator. Historical data (relevant literatures) and expert opinion provide the detail on the probabilities of the basic events. This also considered the safety measures (safety barriers) intended to reduce the risk for individual steps upon the occurrence of the top event.3.1.3 Modelling Techniques
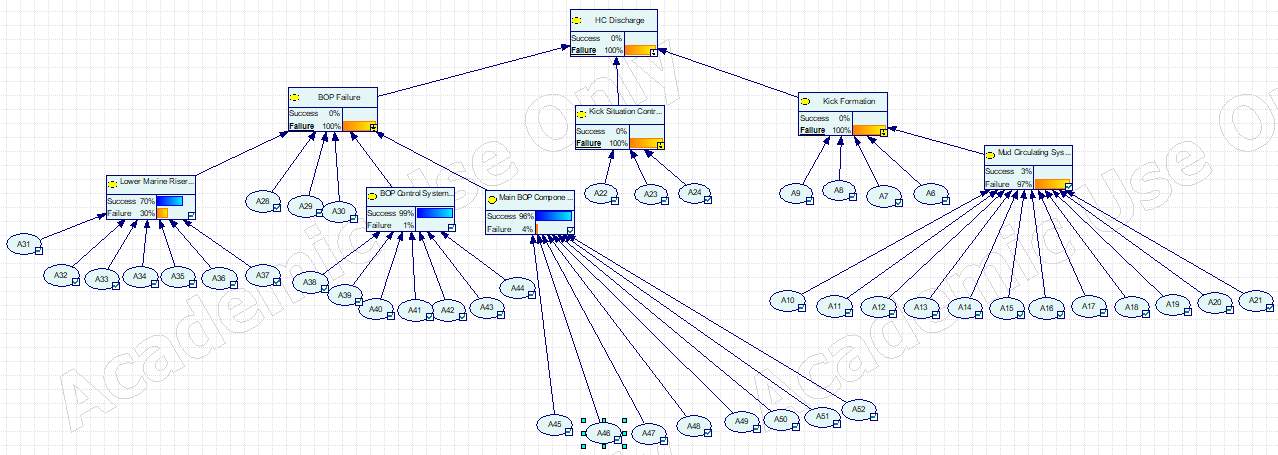
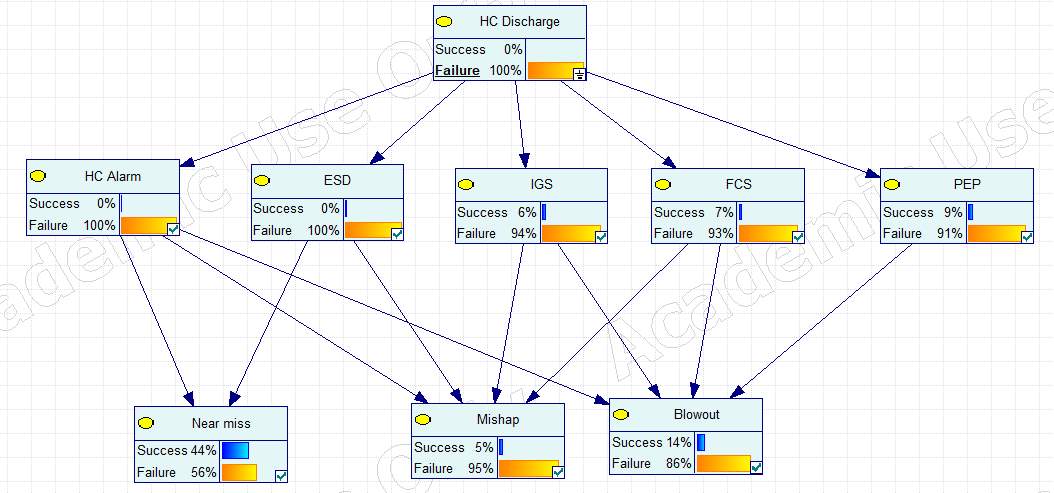
The probability of the top event is evaluated using the historical data for the basics using a fault tree and the severity and consequences are presented on the event tree. See Figure 3.2 and 3.3. The Bow-tie combined the fault and event tree into a single structure and uses the top event of the fault tree as initiating event for the event tree model. The various safety barriers likelihood is evaluated according. The bow-tie is transformed into the Bayesian network structure for dynamic(updating) analysis and the posterior probability of the primary events and barriers were evaluated. Further sensitivity inference can be based on the critical basic events effect on the top event and the resulting consequences.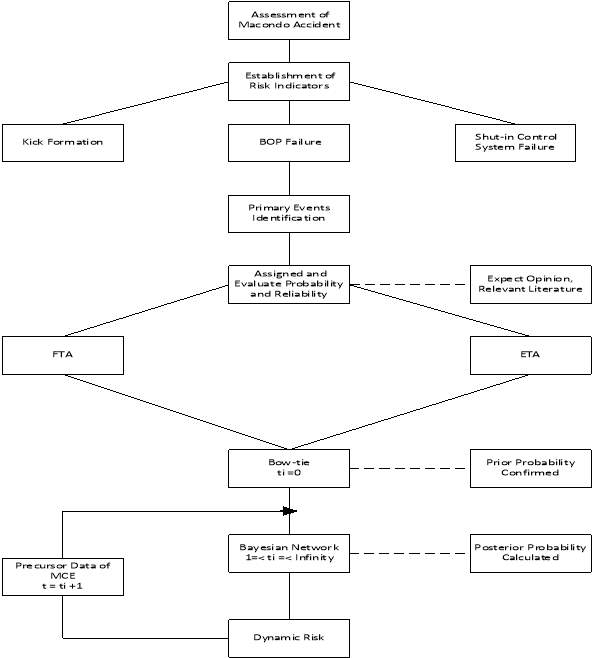
Figure 3.1: Flowchart for Risk Assessment of Gulf of Mexico 2010 & 1978 Accidents
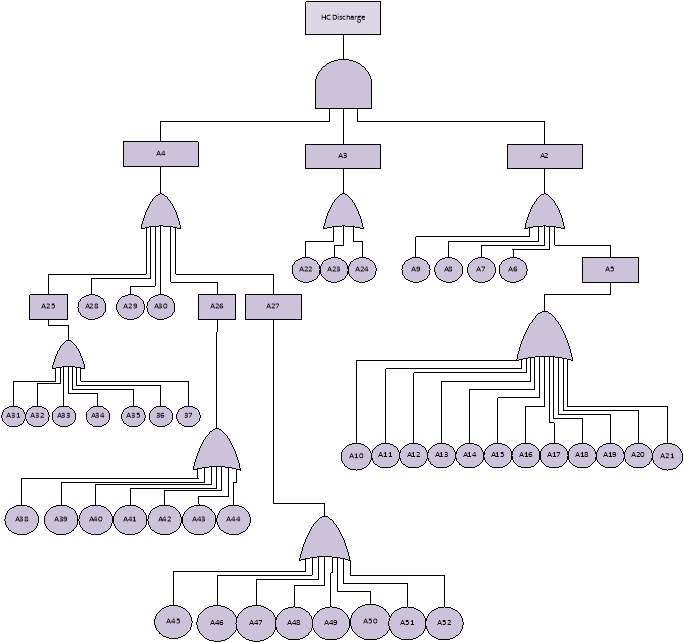
Figure 3.2: Fault Tree for Well Head Hydrocarbon Discharge Occurrence for Gulf of Mexico 2010 & 1978 Accidents.
| HC Discharge Auto-Alarm | Auto-ESD System | Auto-Ignition Control System | Fire Control System | Evacuation Plan | Outcomes | ||
| Near miss | |||||||
| Near miss | |||||||
| Mishap | |||||||
| Blowout | |||||||
| I E | Blowout | ||||||
| Near miss | |||||||
| Near miss | |||||||
| Mishap | |||||||
| Blowout | |||||||
| Blowout | |||||||
Figure 3.2: Event Tree for Well Head Hydrocarbon Discharge Occurrence for Gulf of Mexico 2010 &1978 Event.
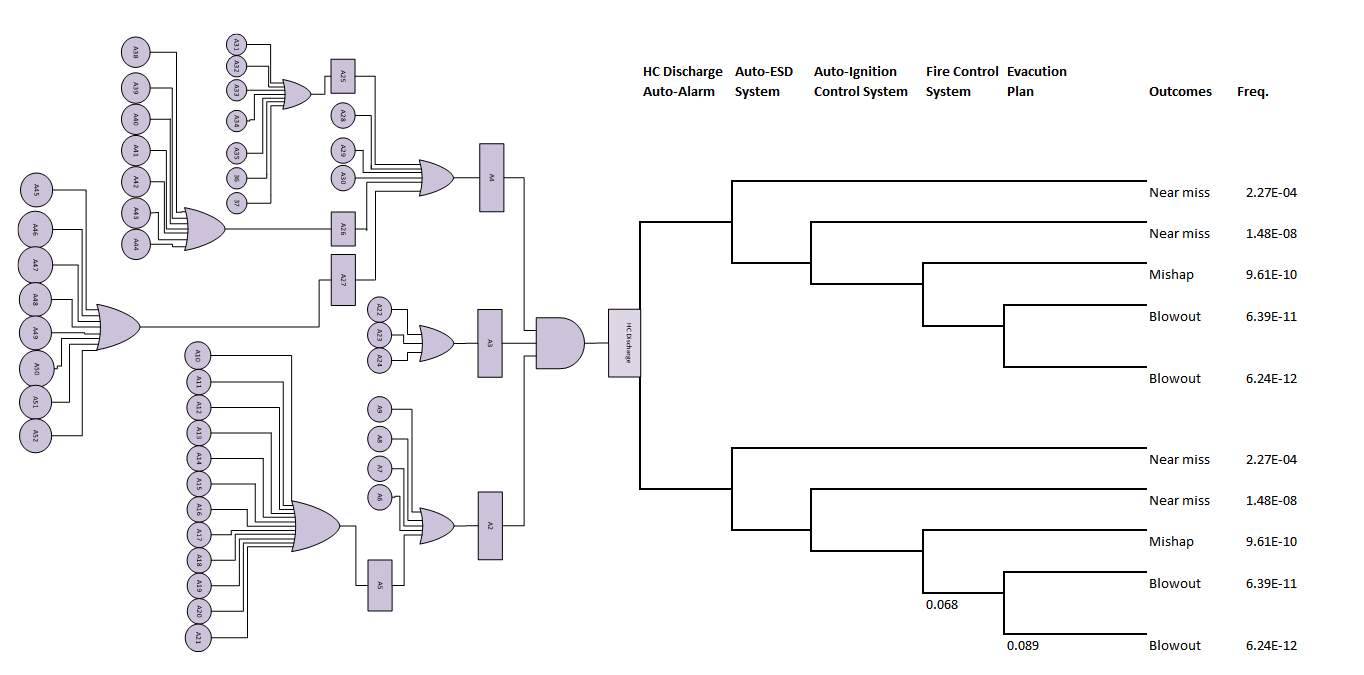 Figure 3.3: Bow-tie of Well Control System Failure for the Gulf of Mexico 2010 &1978 Events
CHAPTER 4
RESULTS AND DISCUSSION
4.1 Results
The result of the analysis using the assigned probability is presented in Table 4.1. Excel spreadsheet was used to predict the various outcomes of the events resulted from the failures of various safety barriers. This shows the various near misses, Mishaps, and blowout resulted from the different degree of hydrocarbon discharge and release control safety barrier failures. The top event probability was determined using the prior probability of the primary events as shown in Appendix A, and was gotten from relevant literatures(Imran, & Submitted 2013; Khakzad et al., 2013; Strand & Lundteigen, 2015; BP, 2010) and the bow-tie outcome was based on the failure probability of the assigned safety barriers as shown in Table 4.1. Table 4.1: Safety Barriers and their Frequencies| Barriers | Frequency (Probability) |
| HC Discharge Alarm | 1.100E-04 |
| Emergency Shutdown System | 7.000E-05 |
| Ignition Control System | 6.500E-02 |
| Fire (Escalation) Control System | 6.800E-02 |
| Personnel Evacuation Plan | 8.900E-02 |
4.2 Discussion
Sensitivity analysis was carried out on each gate using the prior probability to predict their degree of contribution to the intermediate and top event for the case study (See Appendix A). It was observed that critical kick formation occurs for this case study due to human failure to act promptly. The result represents a 95% contribution in comparison with the primary causative event under the same gate. In mud circulating system failure, the analysis shows that mud pump failure, snubbing unit failure and gas supply system failure is the most contributor. Their percentage contribution is 24.6% each in comparison with the other basic events under the same gate. The shut-in control system values hinge more on the shut-in valve mechanical failure, which represent 92% contribution in view of other events contributions. The BOP is a critical and highly sensitivity well control system. In most cases, BOP failure occurs when these integral critical components (lower marine riser control failure, BOP control system and its components) fails. The sensitivity analysis of the case study shows that the BOP failure occurs due to the power failure at the point of emergency, which resulted in the BSR activation failure and emergency disconnect system failure. It was revealed that the power failure contributed about 88.5% to the BOP failure in this case study. The emergency disconnect system is a critical component of the lower marine riser that response abruptly in case of emergency. It was observed that the hydrocarbon release rate was critically very high and causes damage to the power line within minutes of release. These factors are key to hydrocarbon (HC) discharge from the wellhead and on frequencies of the major fatal accident (Blowout) with high property damage (consequence) and death. Figure 4.1 presents the summary of the various top contributing primary events under the gates as shown in the Bow-tie plot.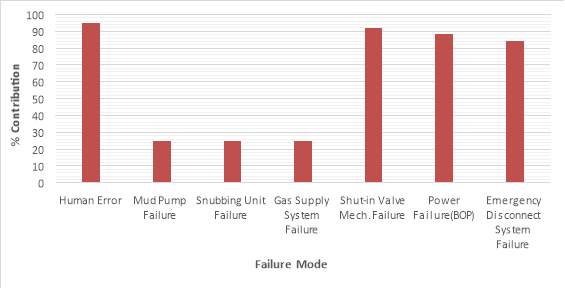
Figure 4.1: Percentage Contribution of the Failure Modes for the Top Event
Further analysis was done using the Bayesian network where the critical primary events were updated based on the AND gate and OR gate binary condition and the resulting probabilities (see Appendix B-I). The updating technique helps us to predict the failure trend of the top event at any time if the prior condition of the primary event changes. Setting evidence on hydrocarbon release as shown in Appendix B-II, gave the posterior probabilities of the primary events. Further analysis was done using ± 25%on the probability of eight critical events that resulted in the accident and the result shows ±76.8%effects on the top event probability and the overall outcomes frequencies. Similarly, from Appendix A, human error show high percentage difference between the prior and posterior probabilities. The effect of the evidence set on the safety barrier probabilities and consequences is shown in Appendix B-II. There is a significant increase in the safety barrier probabilities and that of the consequences. This result from the model provides a technical insight into risk analysis and safety management in deep-sea drilling operations and revealed the common causative failure in the Macondo accidents. Effective condition monitoring and safety barrier will provide a check on these critical events to mitigate the future occurrence of such catastrophic accident.CHAPTER 5
CONCLUSIONS AND RECOMMENDATIONS
5.1 Conclusions
Having carried out a dynamic risk-based analysis of the well control system for blowout prevention in the selected case studies; the following significant conclusions were drawn.- The critical kick formation in the British Petroleum (BP) Macondo Well occurs due to human failure. This represents 95% contribution in comparison with the primary causative events under the same logic gate.
- The BOP failure occurs due to the power failure at the point of emergency, which resulted in BSR activation failure and emergency disconnect system failures.
- The overall result revealed that human error, shut-in mechanical valve, power failure and emergency disconnect system failure play key roles in the catastrophic accident in the Gulf of Mexico.
- The event could have been managed by reducing the failure probabilities of the human error, pump failure, emergency disconnect system and power failure. This could be done by providing redundancy in this equipment replacing them with more sophisticated ones and improved training of drilling personnel.
- The sensitivity analysis showed that swabbing and lost circulation event contributed most to the IXTOC-1 blowout.
- In mud circulating system failure, the analysis showed that mud pump failure, snubbing unit failure and gas supply system failure are the most contributors. Their percentage contribution is 24.6%.
- The shut-in control system values hinge more on the shut-in valve mechanical failure, which represent 92% contribution in view of other events contributions.
- The BOP failure occurs due to the power failure at the point of emergency, which resulted in BSR activation failure and emergency disconnect system failures.
5.2 Recommendations
- Safety and environmental integrity should not be compromised during oil and gas well operations.
- There should never be a failure in adhering to the designed drilling plan to save cost or shorten the duration of project completion.
- High-pressure auto-activation function should be installed as part of the BOP system to automatically activate the BSR to seal the well in the event of any abnormal pressure.
- The rig crew should shut-in the well as soon as the kick is recognized without any delay and all the equipment should be regularly checked.
- There should be a proper plan in place in the event of rig power loss during drilling operations.
- Further work can be done by integrating BT updating techniques into the Bayesian Network structure and do a comparative review.
- Further work can be done using Fuzzy BN technique for conditional probability validation (evidential reasoning).
REFERENCES
Abimbola, M. Khan, F & Khakzad, N. (2014). Dynamic safety risk analysis of offshore drilling. Journal of Loss Prevention in the Process Industries, 30, 74–85. Adedigba, S. A., Khan, F., & Yang, M. (2016). Dynamic safety analysis of process systems using nonlinear and non-sequential accident model. Chemical Engineering Research and Design, 111, 169–183. https://doi.org/10.1016/j.cherd.2016.04.013 Bergan, H. (2015). Risk Analysis of Well Control Operations Considering Arctic Environmental Conditions, (June). BP. (2010). Deepwater Horizon accident investigation report September 2010. Retrieved from: http://www.bp.com/liveassets/bp_internet/globalbp/globalbp_uk_english/incident_response/STAGING/local_assets/downloads_pdfs/Deepwater_Horizon_Accident_Investigation_Report.pdf. Cai, B., Liu, Y., Liu, Z., Tian, X., Dong, X., & Yu, S. (2012). Using bayesian networks in reliability evaluation for subsea blowout preventer control system. . . Reliability Engineering and System Safety, 108, 32–41. Fraser, D., Lindley, R., Moore, D., & Staak, M. . (2014). Early kick detection methods and technologies. . In SPE Annual technical conference and exhibition,. Glen. (2011). Oil Spill by the Oil Rig “Deepwater Horizon” in the Gulf of Mexico on April 20, 2010. Grace, R., Cudd, D., Carden, R. S, &Shursen, J. L. (2003). Blowout and well control handbook. Elsevier, 2003. Holand, P. (1997). Offshore Blowouts. Elsevier Science and Technology,. Imran, M., & Submitted, B. (2013). a Critical Review of an Improved Well Control Procedure for the Prevention of Blowouts. Retrieved from https://cdn.dal.ca/content/dam/dalhousie/pdf/faculty/engineering/peas/MEngProjects/2013MEngProjects/Muhammad Imran%2C CRITICAL REVIEW OF AN IMPROVED WELL CONTROL PROCEDURE FOR THE PREVENTION OF BLOWOUTS.pdf Khakzad, N., Khan, F., & Amyotte, P. (2012). Dynamic risk analysis using bow-tie approach. Reliability Engineering and System Safety, 104, 36–44. https://doi.org/10.1016/j.ress.2012.04.003 Khakzad, N., Khan, F., & Amyotte, P. (2013a). Quantitative risk analysis of offshore drilling operations: A Bayesian approach. Safety Science, 57(August), 108–117. https://doi.org/10.1016/j.ssci.2013.01.022 Khakzad, N., Khan, F., & Amyotte, P. (2013b). Quantitative risk analysis of offshore drilling operations: A Bayesian approach. Safety Science, 57(August 2016), 108–117. https://doi.org/10.1016/j.ssci.2013.01.022 Mexico, I.-1. (1979). The IXTOC-I Well Blowout: The Gulf of Mexico 1979, Retrieved. Modarres, M. (2006). Risk Analysis in Engineering: Techniques, Tools, and Trends. CRC Press, Taylor & Francis Group, Boca Raton. . NORSOK. (n.d.). NORSOK Standard D-010-Well integrity in drilling and well opera- tions. Standards Norway, 2010a. Pui, G., Bhandari, J., Arzaghi, E., Abbassi, R., & Garaniya, V. (2017). Risk-based maintenance of offshore managed pressure drilling (MPD) operation. Journal of Petroleum Science and Engineering, 159(September), 513–521. https://doi.org/10.1016/j.petrol.2017.09.066 Strand, G., & Lundteigen, M. (2015). Risk control in the well drilling phase: BOP system reliability assessment. Safety and Reliability of Complex Engineered Systems, (Noga), 753–760. https://doi.org/10.1201/b19094-101 Xu, H. X. H., & Dugan, J. B. (2004). Combining dynamic fault trees and event trees for probabilistic risk assessment. Annual Symposium Reliability and Maintainability, 2004 - RAMS, 214–219. https://doi.org/10.1109/RAMS.2004.1285450Appendix A: Prior and Posterior Probability of the Primary Events
| SYMBOL (Ai) | COMPONENT | PRIOR PROBABILITY | POSTERIOR PROBABILITY | DIFFERENCE |
| A6 | Swabbing failure | 1.25E-05 | 4.05E-05 | 2.80E-05 |
| A7 | Abnormal reservoir occurrence | 3.15E-05 | 1.02E-04 | 7.05E-05 |
| A8 | Annulus cement failure | 1.50E-04 | 4.86E-04 | 3.36E-04 |
| A9 | Human error in adhering to the designed drilling procedure. | 1.02E-02 | 4.13E-02 | 3.11E-02 |
| A10 | Deep water horizon diverter | 1.10E-04 | 3.57E-04 | 2.47E-04 |
| A11 | Mud suction line failure, | 1.20E-06 | 3.89E-06 | 2.69E-06 |
| A12 | Mud Pump failure | 7.20E-02 | 2.92E-01 | 2.20E-01 |
| A13 | Mud return line failure | 1.10E-05 | 3.57E-05 | 2.47E-05 |
| A14 | Snubbing unit failure | 7.20E-02 | 2.92E-01 | 2.20E-01 |
| A15 | Mud failure | 7.00E-02 | 2.27E-01 | 1.57E-01 |
| A16 | Rotary hose failure | 3.10E-06 | 1.01E-05 | 7.00E-06 |
| A17 | stand pipe failure | 2.50E-06 | 8.11E-06 | 5.61E-06 |
| A18 | Power failure | 1.50E-05 | 6.08E-05 | 4.58E-05 |
| A19 | Choke valve failure | 1.10E-04 | 3.57E-04 | 2.47E-04 |
| A20 | Gas supply system failure | 7.20E-02 | 2.92E-01 | 2.20E-01 |
| A21 | Mud suction line failure, | 2.00E-07 | 6.49E-07 | 4.49E-07 |
| A22 | Human error in operating the shut-in valve. | 1.50E-03 | 7.93E-02 | 7.78E-02 |
| A23 | Shut in valve mechanical failure | 1.20E-01 | 9.33E-01 | 8.13E-01 |
| A24 | Rig Power failure | 1.50E-05 | 1.17E-04 | 1.02E-04 |
| A28 | Power failure, | 1.50E-05 | 9.51E-04 | 9.36E-04 |
| A29 | Human error in activating the BSR close button | 2.00E-05 | 6.47E-01 | 6.47E-01 |
| A30 | Natural disaster. | 2.70E-04 | 1.37E-02 | 1.34E-02 |
| A31 | Annular Preventers | 5.40E-03 | 2.74E-01 | 2.69E-01 |
| A32 | Blue and yellow Pods | 8.40E-05 | 4.26E-03 | 4.18E-03 |
| A33 | Multiplex Connector | 8.40E-05 | 4.26E-03 | 4.18E-03 |
| A34 | ROV Hot Stab Panels | 8.40E-05 | 4.26E-03 | 4.18E-03 |
| A35 | Accumulator Bottles | 8.40E-05 | 4.26E-03 | 4.18E-03 |
| A36 | Rime Type Preventers | 8.40E-05 | 4.26E-03 | 4.18E-03 |
| A37 | Drilling Spools | 8.40E-05 | 4.26E-03 | 4.18E-03 |
| A38 | Elector hydraulic/Multiplex Control System (MUX) | 1.90E-05 | 9.64E-03 | 9.62E-03 |
| A39 | Emergency Disconnect System (EDS) | 1.90E-05 | 1.20E-03 | 1.18E-03 |
| A40 | ROV Intervention Panel | 1.90E-05 | 9.64E-04 | 9.45E-04 |
| A41 | Auto-Shear Function | 1.90E-05 | 9.64E-04 | 9.45E-04 |
| A42 | Automatic Mode Function (AMF) | 1.90E-05 | 9.64E-04 | 9.45E-04 |
| A43 | Elector hydraulic/Multiplex Control System (MUX) | 1.90E-05 | 9.64E-04 | 9.45E-04 |
| A44 | Emergency Disconnect System (EDS) | 1.90E-05 | 1.21E-03 | 1.19E-03 |
| A45 | Well Head Connector | 9.10E-05 | 4.62E-03 | 4.53E-03 |
| A46 | Variable Bore Rams (VBRs) | 9.10E-05 | 4.62E-03 | 4.53E-03 |
| A47 | Test Ram | 9.10E-05 | 4.62E-03 | 4.53E-03 |
| A48 | Casing Shear Ram (CSR) | 9.10E-05 | 4.62E-03 | 4.53E-03 |
| A49 | Blind Shear Ram (BSR) | 9.10E-05 | 4.62E-03 | 4.53E-03 |
| A50 | Choke and Kill lines | 9.10E-05 | 4.62E-03 | 4.53E-03 |
| A51 | Remotely Operated Vehicle (ROV) Panels, | 9.10E-05 | 4.62E-03 | 4.53E-03 |
| A52 | Accumulator Bottles | 9.10E-05 | 4.62E-03 | 4.53E-03 |
Cite This Work
To export a reference to this article please select a referencing stye below:
Related Services
View allRelated Content
All TagsContent relating to: "Risk Management"
Risk Management is a process for identifying, understanding and mitigating any risks that are associated with a particular task or event. Individuals and organisations implement Risk Management to provide a layer of protection, allowing them to minimise risk in their operations.
Related Articles
DMCA / Removal Request
If you are the original writer of this dissertation and no longer wish to have your work published on the UKDiss.com website then please:

