Alienware 17 Gaming Laptop Analysis
Info: 11413 words (46 pages) Dissertation
Published: 10th Dec 2019
Tagged: Video GamesComputing
 Assignment 1
ALIENWARE 17 GAMING LAPTOP
Table of Contents
2.3 Customer Needs Analysis (Kano Analysis)
3.1 Translating Customer Needs into Design Requirements (QFD)
3.2 Design Risk Analysis (FMEA)
4 Supplier selection and evaluation
4.1 Identifying Major Components:-
4.2 Developing the supplier Selection Criteria
4.3 Constructing and Using a supplier selection system
5.2 Constructing and using a SPC Chart
6.1 Identifying Problems and Using Problem-Solving Tools
6.2 Constructing and Using Problem Solving Tools
b Check sheet and Pareto Diagram
1. Introduction
The laptop is the ultimate instrument extensively used by students to the researchers. The power and speed of the laptops are governing factor of the use. Despite the use of a laptop for only educational and business purpose, it has grown its scope to a newer and broader field of gaming. The current trend of the gaming consoles including PS, Xbox and the powerful gaming laptop is the increase in efficiency, less lag and more FPS with decreased size, less heating and portability (Miller 2000).
Gaming was considered as the method of recreation and time pass, but with the investment of millions of dollars for the development of games, increased broadband of internet and online servers, the phenomenon has become careers for many people with the worldwide gaming competition as grand as world cups(Lenhart et al. 2008). With the development of technologies and increased manufacturers, there are gaming laptops for basic gameplay to the high-end gaming experience.
With the vast number of manufacturers, companies are reluctant to design a gaming laptop that provides great experience and in-depth engagement with the gameplay. Alienware 17, developed by DELL is the groundbreaking flagship killer laptop with high performance and better gaming experience.
The key feature of the Alienware 17 is the customizability. It has incorporated the Intel® Core™ i7-7820HK which is fortified with the Tobii eye-tracking technology that helps in RPG for aiming at the point of vision, teammates signalling and quick surround navigation which is the first in gaming laptop series for unparalleled immersion in the game. The significant software characteristics that separates the laptop from other laptops are system intelligence for the navigation, storage of the information about the degree of attention and position of the player in front of the laptop, gaming coaching with Alienware Overwolf apps that assist in the re-examination of gaze pattern thus developing concise idea of gaming mistake of ownself. Furthermore, HD camera with Windows Hello fitted with IR sensor and recognition of face feature helps to maintain proper privacy and safe login.
With the advantages of highly engineered dimensions and low weights, the significant hardware features include Killer™ Wireless, for best wireless network connections, Alienware Graphics Amplifier support to integrated dual-wide video graphics for the UHD display. One of the key features, all the users verify before the purchase of any types of laptops is the battery life. Alienware 17 contains a 68Whr battery which can be further expanded to the 99Whr Lithium-Ion battery and can last up to 10 hrs. For easy loading of the games and prevent unusual vibration that can be disturbing during the gameplay.
Alienware is provided with realistic virtual reality experience with a VR-ready system that is powered by NVIDIA VR works technology. It helps the player to incorporate into the game and feel the presence of own self in the game. Along with the lightweight and portability feature, magnesium alloy, anodized aluminium and steel body provides the tactility and mobility with strength from drop and shock.
Eight dimensions of quality characteristics described by DA Garvin, and those eight qualities to be addressed by the Alienware 17 are performance, features, reliability, conformance, durability, serviceability, aesthetics and perceived quality that should be incorporated in the components like processor, display, hard-drive, graphics card, lightweight, RAM and battery(Garvin 1984). Alienware 17 covers all the mentioned characters and is thus a perfect value for money for the gamers and new experience in the gaming arena.
2. Customer Satisfaction
2.1 Stakeholder Analysis
Stakeholders are the bodies- individuals, organisations or power groups, directly and indirectly, involved in the decision making the process for the facilitation of implementation of the policies, to produce a service or product based on their intentions, behaviours, agendas, interrelations and interests(Brugha & Varvasovszky 2000). Stakeholders of gaming laptops are:-
| S.No | Stakeholder | Expectations |
| 1 | Customer |
|
| 2 | Staffs |
|
| 3 | Shareholders |
|
| 4 | Competitors |
|
| 5 | Server Developer |
|
| 6 | Supplier |
|
| 7 | Developers and publishers
Of games |
|
| 8 | Government |
|
| 9 | Retailers |
|
| 10 | Engineering Department |
|
| 11 | Standard Bodies (ISO, IEC, ANSI) |
|
2.2 Capturing Customer Needs
Every service or product developed is based on the value to the customer. From the cost to the level of design rendered is affected by the anticipation of the customer. To produce any product, the value of the product to the customer in conjunction with the cost is considered, and thus four dimensions of requirements arise as per the SWOT analysis.
 Value to Customer
Good for both the producer Challenge for producer.
and customer Customers like to have it.
 Cost/ Price
Basic requirements Waste of time/money and is not
Standard features appreciated by the customer
From above diagram, it can be noted that for the profit and success of any product, the utmost requirement is the knowledge of what the customer needs. So in order to capture the needs of the customer 4 phase model can be used in addition with the SWOT analysis. The 4 phase model includes following processes(Rees 2014) :-
- Identity
All the persons that can be involved might not be of use to the product. Identification of customers that are enthusiast towards the particular product is required.
- Capture
Various methods are available to capture the customer need. Some of them are (Akpolat 2004):-
- Customer Interviews:–
Customer interview is the most accessible method for understanding the need of the customer. It is easy in the sense that face to face interaction with the direct questions of what a customer needs, expectation from the products and useless features that might have been misunderstood for essential can be understood and analysed. However, the primary consideration while doing the interview is that the customer should know about the products either of the same or from the competitor’s products. It should include a particular set of questions, and the meaningful answer should be perceived by the customer.
- Customer survey questionnaires
It is a method in which a fixed set of questions are prepared and supplied to the customers for the recognition of the needs more precisely. One of the popular methods of these survey questionnaires is Google Form, which extensively used anonymity that leads the customer to express more openly as compared to customer face to face interviews. Furthermore, the scale of ratings and the numeric grading can be easily provided which makes the understanding easier.
- Brainstorming
Brainstorming is a method of capturing ideas of a large quantity for the given sets of questions within the time frame. Responses are in the form of recorded verbatim, and the judgement is not provided for the generated ideas until the response time period. Deferring the judgement and attainment of bulk and broader ideas is the central concept of this method(Helms & Nixon 2010).
- Market trend analysis
A market trend analysis is the research of the past trend of the market, behaviour of the customer and picking of the dominant relationship between the market and customer for the prediction of the need of the customer. It helps to plan the future of the product and manufacture the right product and the correct time. As in the case of gaming laptop, the observation of market trend shows significant changes from 2000 to 2015, at the beginning single gaming at home was predominant, followed by local LAN and finally a worldwide server for playing games with different people from the different part of the world (Webber 2017). Thus, it can be deciphered that there was need of gaming laptops with significant storage capacity but with the development of online server better connectivity was found more dominant.
- Warranty claims
Warranty claims provide the precise knowledge of the quality of the product. Higher the number of warranty claims and grievance from the customer signifies that there is the compulsion for the improvement of the product. It should be understood that the higher warranty claims don’t signify the whole product to be of lower quality but a component or the functional malfunction may be present which can be rectified. For instance, Note 7 launched by Samsung has had many claims in regards to the battery but doesn’t signify that the note 7 was a less qualitative product. The rectification of battery and improvisation in Note 7 model has given rise to landmark android phones which are Galaxy s8 and Note 8. Thus, customer grievance can be used as the productive feedback, but the care should be given that the goodwill of the company does not degrade.
- Analyse
Quantitative and qualitative analysis of the captured need is the process done to understand the value of the needs. SIPOC method is the tool for the analysis of the data collected. SIPOC include
Suppliers:- Stakeholders that undergoes the process inputs
Inputs:- Includes the required data and materials needed for the operation of the process
Process:- It is the definition of the beginning and end or the boundaries of the process
Outputs:- the final products delivered
Customers:- Final consumer of the end product
- Translate
Translation of the data is the conversion of needs and requirements into the understandable and meaningful data for the planning purpose. Kano analysis is used for this purpose which is further elaborated in 2.3 section.
2.3 Customer Needs Analysis (Xu et al.)
All the features that are included might not be of same importance to the customer. Some features that are included might be the basic standards to be provided whereas some might be the extra asset for the product. To differentiate the significance of the features Kano Analysis can be done that differentiate the needs into three categories viz MUSTs, WANTs and DESIRABLEs. MUSTs are the credentials that are expected to be present without any compromise whereas WANTs are the items desired by the customers(Xu et al. 2009). Whereas DESIRABLEs are the complimentary assets provided as extras for the excitement of the customer. Based on the methods, in 2.2 I have selected Customer Interviews and Customer survey questionnaires that researched three gaming groups namely UTS Gaming society, National DOTA League and FIFA Enthusiasts which are focused on three different types of games. Each question was focused on each attribute, and the customers further answered the question in the form of ranking 1 to 5 or YES, NO or NEUTRAL.
Following is the form of questions I have prepared as google form and survey questions:-
| GAMING LAPTOP. WHAT DO YOU WANT IN IT?
Dear fellow gamers, as a part of the research for the university I have prepared the questionnaires related to the gaming laptop. Please give the anonymous and honest answer to these questions:-
|
Based on the above questions and following face to face survey with the gaming groups and Kano analysis of the information obtained, followings are the needs that are required for a gaming laptop.
| S.N | Attributes | Questions | Ratings | Needs |
| 1 | Processor speed | Should it be fast? | 10 |
Basic Needs (MUSTs) |
| 2 | Graphics card | Is better fps required? | 9 | |
| 3 | Storage | Do you want huge storage? | 9 | |
| 4 | Connectivity | Do you want better connectivity? | 8 | |
| 5 | Battery life | Does the battery life affect? | 8 | |
| 6 | Warranty | Is the warranty required? | 9 | |
| 7 | Keyboard layout | Do you want better keyboard layout than
Normal laptop? |
8 | |
| 8 | Cooling system | Does the heating of your laptop affect your game play? | 9 | |
| 9 | Display | Do you want better resolution? | 8 | |
| 10 | Customizability | Do you want customisation easiness in gaming laptop? | 9 | |
| 11 | Monitor size | Do you want large screen? | 5 |
Performance Needs (WANTs) |
| 12 | Customer service | Is good customer service expected? | 6 | |
| 13 | Weight | Does the weight of laptop matter? | 4 | |
| 14 | Appearance | Is the aesthetics of the laptop important? | 6 | |
| 15 | Sound quality | What kind of sound output you want during gameplay? | 7 | |
| 16 | Expansion bays | Do you want extra ports? | 6 | |
| 17 | Anti-virus | Is your laptop regularly affected by antivirus? | 6 | |
| 18 | Games | Do you want extra games and server points? | 5 | |
| 19 | Insurance | Is insurance required? | 4 | |
| 20 | Extra connectivity | Do you want window sharing with external monitors? | 6 | |
| 21 | Affordable price | Does the price of the device matter? | 2 |
Desirables (EXTRAs) |
| 22 | Joypad/joysticks | Do you want joystick with your device? | 3 | |
| 23 | Discounts | Do you want discounts? | 2 | |
| 24 | Software updates | Is regular softwares required? | 3 | |
| 25 | Touch screen | Do you want touch screen? | 2 |
Thus the needs are tabulated below:-
| MUSTs | WANTs | EXTRAs |
|
|
|
3 Design Requirements
3.1 Translating Customer Needs into Design Requirements (QFD)
After the compilation of 25 needs, following table is generated with the 10 design requirements using the QFD below:-
  Design Requirements Design Requirements
Customer Requirements |
Standards of parts used |
Hardware development |
Software development |
Size, weight and dimension |
Cooling system |
External Connectivity |
Skilled development |
Replaceable hardware |
Online server compatibility |
|||
|
Musts |
Powerful processor | 10 | 9 | 9 | 9 | 1 | 9 | 9 | 1 | 3 | ||
| Powerful graphics card | 9 | 9 | 9 | 3 | 9 | 1 | 9 | 9 | 1 | 3 | ||
| Sufficient storage | 9 | 9 | 9 | 9 | 3 | 1 | 3 | 9 | ||||
| Better modem for connectivity | 8 | 9 | 9 | 3 | 9 | 5 | 9 | |||||
| Longer Battery life | 8 | 9 | 9 | 9 | 9 | 9 | 9 | |||||
| Soft key Keyboard | 9 | 3 | 9 | 3 | ||||||||
| Minimum 1 year warranty | 8 | 9 | 3 | 3 | ||||||||
| Better cooling system | 9 | 9 | 9 | 9 | 9 | 9 | 9 | |||||
| 4K Display | 8 | 9 | 3 | 3 | 3 | 1 | ||||||
| Personal customizability in hardware | 9 | 3 | 1 | 3 | 1 | 3 | ||||||
|
Wants |
17 inch screen | 5 | 9 | 1 | 1 | 9 | ||||||
| Good customer service | 6 | 3 | ||||||||||
| Light weight | 4 | 3 | 3 | 9 | ||||||||
| Robust sound | 6 | 9 | 3 | 1 | 3 | |||||||
| Extra ports for device | 7 | 1 | 1 | 3 | 5 | 3 | ||||||
| Free Antivirus | 6 | 9 | 3 | |||||||||
| Free games | 6 | 9 | ||||||||||
| Insurance | 5 | 9 | ||||||||||
| External connectivity with other monitors | 4 | 9 | 3 | 1 | 3 | 5 | 9 | 1 | ||||
| Appearance | 6 | 1 | 1 | 9 | 3 | |||||||
|
Desirables |
Affordable price | 2 | 1 | 3 | ||||||||
| Extra joypads | 3 | 1 | 1 | |||||||||
| Discounts | 2 | 3 | 3 | 1 | ||||||||
| Regular software updates | 3 | 9 | 9 | 3 | ||||||||
| Touch screen | 2 | 1 | 3 | 3 | ||||||||
| Target Values |
Best standard parts |
Competent development |
2017 standard gameplay base |
99 Whr Li-ion battery |
17 inch 4k display,3.78 kg |
Thermatake Core P100 efficeint cool |
Multiple ports for HDMI, joystick and VR |
Qualified with skilled developers |
Plug and play |
100% stability |
||
| Absolute score (total) | 884 | 666 | 190 | 470 | 346 | 359 | 154 | 418 | 163 | 333 | ||
3.2 Design Risk Analysis (FMEA)
Using the highest scoring design requirements, risk analysis has been done using the FMEA :-
| Part or function | Potential failure
|
Effect on system | Root Cause
of failure |
Risk before Action taken | Action to reduce risk | Risk after action taken | ||||
| P | S | R | P | S | R | |||||
| Standard of parts used | Flawed device | Stop working | No proper inspection | 5 | 5 | 25 | Continuous inspection and tally of parts with guidelines from standard bodies | 2 | 4 | 8 |
| Hardware development | Laptop not working | No smooth gaming | No proper assemblage and compatible hardware | 4 | 5 | 20 | Compatibility check and monitoring during assemblage | 1 | 3 | 3 |
| Power consumption/management | Excess drainage of battery | Damage of battery | Charger defect | 2 | 4 | 8 | Use of prescribed standard charger | 1 | 4 | 4 |
| Skilled development | No updated and competitive product in market | Unable to compete | Hiring of inefficient staffs | 3 | 4 | 12 | Proper assessment of staff before hiring | 1 | 2 | 2 |
| Cooling system | Overheat | Motherboard damage | Malfunction of the cooling system | 3 | 5 | 15 | Testing of cooling system before installation | 2 | 3 | 6 |
| 1 | 2 | 3 | 4 | 5 | ||
| P | Probability (chance) of occurrence | Low | Low to moderate | Moderate | Moderate to high | High |
| S | Seriousness of (Covey) failure | Minor | Minor to serious | Serious | Serious to critical | Critical |
4 Supplier selection and evaluation
4.1 Identifying Major Components:-
The major components that are required for the assemblage of a gaming laptop are:-
- Processor
- Graphics Card
- Hard drive
- Battery
- Screen
- Keyboard
- Cooling fan
- Speaker
- Charger
- Touch pad
- Modem
4.2 Developing the supplier Selection Criteria
Graphics card is the backbone for the gaming laptop. From rendering of proper visual to the realistic fps development graphics card plays the vital role. For the Alienware 17, due to its customisability, numerous options of graphics card is available, The criteria for the selection of graphics card are:-
- Brand and company reputation
- Cost
- Warranty claims
- FPS generation
- Production capacity
- Reliability
- Refund policy
- Compliance with standards
- Heating during operation
- Quality of material
- Shipment and delivery
4.3 Constructing and Using a supplier selection system
Three major companies are present that provide the graphics cards. The selection of appropriate selection has been done
Rating range 1: Lowest score 10: Highest Score
| SN | Selection and Evaluation criteria | List of Suppliers | |||
| Importance Rating | Intel | AMD | Nvidia | ||
| 1. | Brand and company reputation | 8 | 8/64 | 8/64 | 9/72 |
| 2. | Cost | 9 | 9/81 | 8/72 | 8/72 |
| 3. | Warranty Claims | 9 | 6/54 | 7/63 | 9/81 |
| 4. | FPS generation | 10 | 8/80 | 8/80 | 10/100 |
| 5. | Production Capacity | 7 | 10/70 | 9/63 | 9/63 |
| 6. | Reliability | 9 | 7/63 | 9/81 | 9/81 |
| 7. | Refund Policy | 6 | 9/54 | 6/36 | 8/48 |
| 8. | Compliance with standards | 9 | 7/63 | 9/81 | 10/90 |
| 9. | Heating during operation | 10 | 6/60 | 7/70 | 9/90 |
| 10. | Quality of materials | 9 | 8/72 | 9/81 | 9/81 |
| 11. | Shipment and delivery | 8 | 10/80 | 9/72 | 8/64 |
| Total | 741 | 763 | 842 | ||
4.4 Conclusion
The supplier selection for three companies Intel, AMD and Nvidia is done based on 11 selection criteria. Graphics card has significant importance in the laptop and the compatible graphics card are manufactured by these three companies. All the companies are reputed and produce quality materials but based on the different criterias Nvidia graphics card holds the top position with the highest point. For instance, Intel graphics card fails under following citeria
- Numerous warranty claims have been observed from the customers
- Failure during the operation questions the reliability of the intel graphics card
- Intel graphics card has the heating problem during the operation.
AMD fails under the refund policy and heating during the operation. Likewise, the superiorty of Nvidia graphics card over other graphics card can be observed in following criteria:-
- Greater FPS generation is observed thus rendering realistic visuals during game play
- It meets the standards set by the regulating bodies
- Despite of its shipment and delivery time, other factors make it superior
Thus from above analyses, the NVIDIA graphics card is selected.
5 STATISTICAL PROCESS CONTROL
5.1 Identifying the process
The development of Alienware 17 requires multiple processes in order to make it ready for the end users. There are basically 10 processes involved throughout the system of making the product ready, these processes are explained below:-
Market Research
It is the first and foremost task that is done to identify the need of the customer and thus labelling the different needs into MUSTs, WANTs and EXTRAs. It not only identifies the needs but also distinguish the target group of customers and helps to determine the future market scenario, cost of production, policies involved and the standards to be maintained.
Recruitment Process
Producing the latest and competitive gadget like Alienware 17 requires the certain sets of knowledge and ideas. Alienware 17 contains some innovative ideas like NVIDIA VR and TObii eye ball tracking system, which can be developed and compiled only by the certain professionals. Thus, for the future development of the technology, rectification of any unforeseen errors and for the routine functions workforce is required, and this can be done by the fair recruitment system.
Design Process
The technologies to be incorporated, appearance, dimensions and all other seen and unseen features are involved in design process. This process produces the virtual representation of the gaming laptop being developed.
Supplier selection
Gaming laptop is the manufactured by the assemblage of parts and accessories that are manufactured within the company and imported from the market. As the manufacturing of all the parts is not possible within a single company, the requirement of supplier of parts is required. Supplier selection is done using the supplier selection and evaluation process and thus the supplier with highest scale is selected for the supply of each part.
Hardware procurement and assemblage
After the supplier selection, the parts are then procured. The hardware and technologies exclusive to the company are then manufactured. After all the hardware are available then the assemblage is done by the expert team in order to provide the flawless assembly of the parts.
Software Installation
After the assembly of the laptop, all the operating systems -basically Windows 10 is installed. The required drivers for the hardware like graphics card, processor, sound and other devices are installed.
Test, Inspection and Verification
This process involves the testing of the hardware, inspection of software and hardware and thus verify if the standard of these components are working as per the guidelines set by the regulating bodies. Here, the different softwares are run that gives load to the processor and graphics cards. The heating of these components are the biggest challenge to any gaming laptop developer. Thus, if these hardware heat to a prerscribed temperature then they are accepted.
Packaging, Storing and Supplying
All the compling Alienware 17 are then packed with shock absorber casing and other cushion in order to prevent the damage during the shipment. Untill, the order for the device are obtained, the final products are stored in dust free and safe warehouses. After, the order is obtained by retailers or distributors or sometimes from the end user through online sales, the product is then dispatched with all the accessories in a transporting safe boxes.
Adversting and Marketing Process
Current generation sales is based on the advertisement of the products and good marketing. Advesting can be done online on social medias like Facebook and Youtube. Furthermore, gameplay competitions and expos are the good ground for the product, provided that new discounts and offers are provided. Free games, softwares and extended warranties can be provided or advertised during the marketing.
5.2 Constructing and using a SPC Chart
Statistical Control Charts:
Statistical Process Control (SPC) is a method to control the quality by using the statistical means in which first the methods for the process are established, followed by the examination of the product or services in regards to failure or loss. It ensures the early detection of the problem and limit it within the prescribed range and thus ensure the standard quality production. According to (Oakland 2007) , every process can be understood that there exist the variation which can be controlled using the statistical measures provided that the process driving body has the capability to do the improvement and rectification. SPC is not merely a tool that gives the pin point reason but a guide that helps to understand the deviation in the quality and thus helps the organisation to prevent and rectify before its too late. It is based on the lab testing, inspection, simulation running or the external feedbacks. (Oakland 2007) states that every process is not under the jurisdiction of control. So these three questions should have positive response in order to apply the SPC
- Has the process been done correctly?
- Can the process be controlled by the manufacturer?
- Is the controlling possible to rectify the error?
SPC involves different limits like Upper Control Limit (UPC), Lower Control Limit (LCL), Upper Specification Limit (USL), Lower specification Limit (LSL) and a center line. Specification limit are the prescribed values with control limits as the values obtained from the deviation with the center line values.
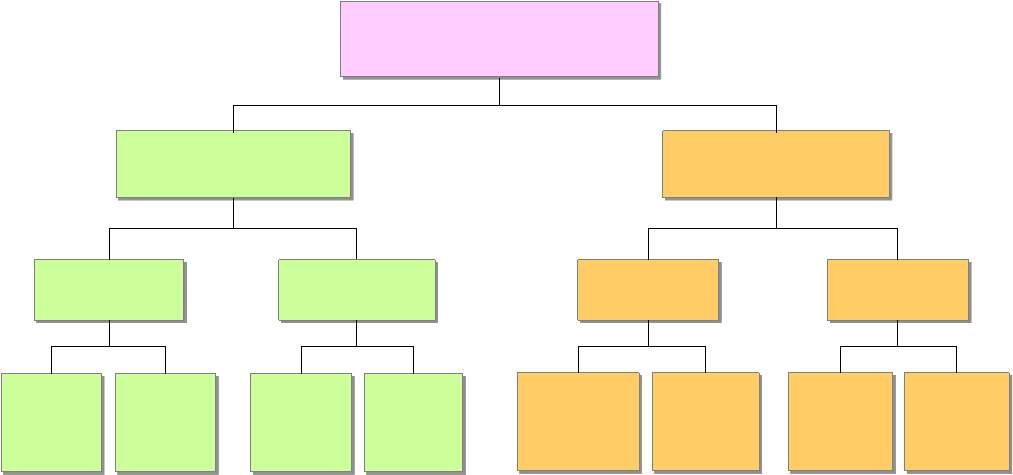
For the SPC, statistical control charts are developed, and the selection of the type of charts to be used is dependent upon the types of data or variables used. Following is the flow chart for the selection of control charts:-
TypesofData
Proportion (Varying or constant n)
(Constant n)
Proportion (Varying or constant n)
(Constant n)
Use Standard Deviation (Aschermann & Klenzan) to calculate UCL and LCL
| p-Chart | np-Chart | u-Chart | c-Chart | x-Chart | IMR-Chart | X-bar and | X-bar and | |||||||
| Source: Lecture Notes | R-Chart | s-Chart |
Use Moving Range (Mrayyan) to calculate UCL and LCL
n>9
The charts to be used are based on the types of data. The type of data to be used and the elaboration of each chart can be explained as :-
- P-chart
P-chart is used when the defective items are counted, or the number of discarded items are present in terms of proportion in the varying sample size n. The assumption of the p-chart is based on the fact that the p is same for the individual unit, independent of the failure and success of the previous and following item and the test process is identical to each item (Montgomery 2007) (Montgomery 2007).
For example, in case of Alienware 17 (battery life analysis which will be done in the assignment) p chart is plotted with varying number of samples each day about non-conforming batteries proportion.
- Np chart
Np-chart is the extension of p chart where, the sample size n is constant, and the interpretation is done on the basis of exact number.
For example, for regular analysis of 5 batteries that fails in each day is the data required for the np-chart.
- U-chart
U-chart is the control chart that analyses the data collected in the subgroups of varying sizes. It not only gives the defect analysis for the whole population but also provides the non-conformities in each subgroup.
For example, a large volume of batteries are obtained from the supplier. Then the batteries are grouped in subgroups and the non-confirmities in each subgroup is analysed which overall gives the defects analysis in the entire population.
- C- chart
C-chart is the type of control chart where the subgroups formed are of same sample size and used to measure the nonconformities in single item or group of the same number of items.
For example:- heating problems, low battery lives and numerous problems are present in a single battery. Thus a number of defects shown by a single battery over the different cycles of charging can be used as the data type.
- X-bar R-bar chart
The control chart with n ranging from 2-9 in subgroups determining the process to be stable and predictable. Here X chart shows the average changes over time and R chart show the subgroups range change in time. X-bar R-bar chart is used in the SPC chart construction of assignment.
In the manufacturing of laptop, battery life plays a vital role, Alienware 17 use battery that can last upto 12 hours. Due to varying requirements and needs sample size is changed, so 5% of the batteries are tested. Thus SPC chart using X-bar and R-chart is obtained. 17 units of times are used with maximum battery life as 12 hours so the USL and LSL are 12 and 8 hours respectively for X, whereas 5 hours and 1 hours for USL and LSL of R respectively.
UCL (xbar)=(xbar) bar + (Rbar)*A2
LCL (xbar)= (xbar) bar – (Rbar)*A2
UCL (Akpolat) = (Boireau, Dufour & Praud)* D4
LCL (Akpolat) = (Boireau, Dufour & Praud) * D3
| USL x= | 12 hours | ||||
| LSL x = | 8 hours | ||||
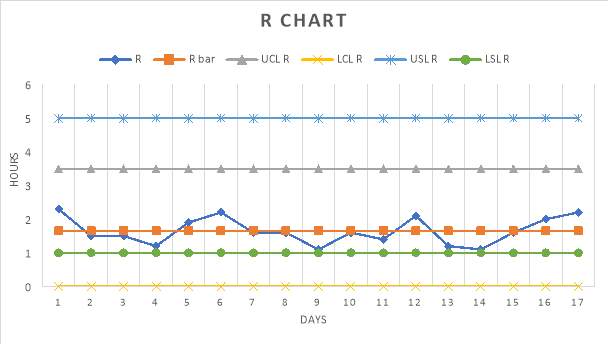
| USL R= | 5 hours | ||||
| LSL R | =1 hours | ||||
| A2 = | 0.577 | k=5 | |||
| D3 = | 0 | ||||
| D4 = | 2.1140 |
| Days | x bar bar | UCL x | LCL x | USL x | LSL x |
| 1 | 10.25 | 11.21 | 9.30 | 12.00 | 8.00 |
| 2 | 10.25 | 11.21 | 9.30 | 12.00 | 8.00 |
| 3 | 10.25 | 11.21 | 9.30 | 12.00 | 8.00 |
| 4 | 10.25 | 11.21 | 9.30 | 12.00 | 8.00 |
| 5 | 10.25 | 11.21 | 9.30 | 12.00 | 8.00 |
| 6 | 10.25 | 11.21 | 9.30 | 12.00 | 8.00 |
| 7 | 10.25 | 11.21 | 9.30 | 12.00 | 8.00 |
| 8 | 10.25 | 11.21 | 9.30 | 12.00 | 8.00 |
| 9 | 10.25 | 11.21 | 9.30 | 12.00 | 8.00 |
| 10 | 10.25 | 11.21 | 9.30 | 12.00 | 8.00 |
| 11 | 10.25 | 11.21 | 9.30 | 12.00 | 8.00 |
| 12 | 10.25 | 11.21 | 9.30 | 12.00 | 8.00 |
| 13 | 10.25 | 11.21 | 9.30 | 12.00 | 8.00 |
| 14 | 10.25 | 11.21 | 9.30 | 12.00 | 8.00 |
| 15 | 10.25 | 11.21 | 9.30 | 12.00 | 8.00 |
| 16 | 10.25 | 11.21 | 9.30 | 12.00 | 8.00 |
| 17 | 10.25 | 11.21 | 9.30 | 12.00 | 8.00 |
| Days | R bar | UCL R | LCL R | USL R | LSL R |
| 1 | 1.65 | 3.49 | 0.00 | 5.00 | 1.00 |
| 2 | 1.65 | 3.49 | 0.00 | 5.00 | 1.00 |
| 3 | 1.65 | 3.49 | 0.00 | 5.00 | 1.00 |
| 4 | 1.65 | 3.49 | 0.00 | 5.00 | 1.00 |
| 5 | 1.65 | 3.49 | 0.00 | 5.00 | 1.00 |
| 6 | 1.65 | 3.49 | 0.00 | 5.00 | 1.00 |
| 7 | 1.65 | 3.49 | 0.00 | 5.00 | 1.00 |
| 8 | 1.65 | 3.49 | 0.00 | 5.00 | 1.00 |
| 9 | 1.65 | 3.49 | 0.00 | 5.00 | 1.00 |
| 10 | 1.65 | 3.49 | 0.00 | 5.00 | 1.00 |
| 11 | 1.65 | 3.49 | 0.00 | 5.00 | 1.00 |
| 12 | 1.65 | 3.49 | 0.00 | 5.00 | 1.00 |
| 13 | 1.65 | 3.49 | 0.00 | 5.00 | 1.00 |
| 14 | 1.65 | 3.49 | 0.00 | 5.00 | 1.00 |
| 15 | 1.65 | 3.49 | 0.00 | 5.00 | 1.00 |
| 16 | 1.65 | 3.49 | 0.00 | 5.00 | 1.00 |
| 17 | 1.65 | 3.49 | 0.00 | 5.00 | 1.00 |
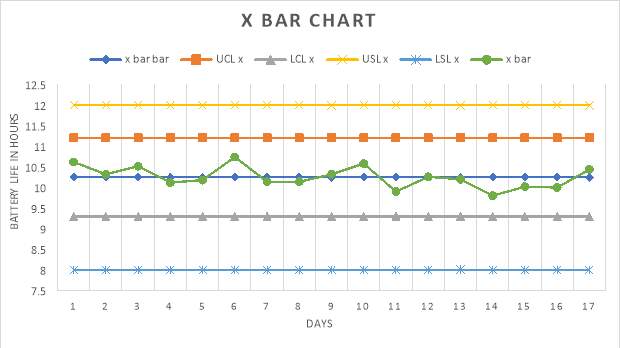
From the X-bar chart, it can be inferred that battery life is satisfactory as x-bar is within the limit and the maximum variation is observed on the 6th day of the test. Furthermore, minor variations are observed and the lower control limits and upper control limits are within the USL and LSL defining the process to be under control. Additionally, after the numerous cycle on the latter days from 13th day, the life of the battery starts degrading.
Despite the fact that, only 5 batteries are tested in a company where thousands of batteries are used it shows the basic idea if the battery supplier selected is practically correct or not. R chart signifies the effectiveness in the manufacturing in which on 4th and 14th day, the variation is high compared to other days. Overall, the process is under control as no points go beyond the LCL or UCL.
6 Problem Solving
6.1 Identifying Problems and Using Problem-Solving Tools
The problems that could occur during the use of the gaming laptop are:-
- Overheating of the device
- Poor connectivity
- Game lag/ slow functionality
- High battery drainage
- System Crash
6.2 Constructing and Using Problem Solving Tools
Various types of tools are present that can be used to solve the problems(Akpolat 2004):-
- Problem-solving form
- Whys
- Check sheet and Pareto Diagram
- Brainstorming
- Fish bone diagram
- Gantt Chart
Two types of problem-solving tools can be used for the problem-solving. One of the five problems that has been chosen for the problem-solving tools is over heating of the device.
a Fish bone diagram
Fish bone diagram is also known as Ishikawa diagram or cause and effect diagram based on its describer
Kaoru Ishikawa, explaining the cause of the particular event. Fishbone diagram identifies all the underlying
factors responsible for the particular defect and thus helps to minimise the overall effects(Ishikawa 1982). The process focuses on 5 Ms that cumulatively causes the single problem. The 5 Ms are :- Manpower, Method, Menvironment, Materials and Machine. The problems and 5Ms for the Overheating of the device are shown below:-


Materials
Menvironment
Battery
Processor
High Voltage
Overheating of device
Lack of experience
Lack of Technology
Negligence
Salary satisfaction
Machine
Method
Manpower
Working room temperature
Laptop placement surface
Graphics Card
Cooling system malfunction
Continuous use over long time
High performance games

Outdated machine
b Check sheet and Pareto Diagram
Check sheet is used to find the weightage of the particular source to a particular cause followed by Pareto chart in which the length of the bars representing the frequency of the incidence of the source. Pareto chart has its best functionality when there are many problems, and the focus is on the most significant. Check sheet comprises of root cause, the frequency of occurrence, absolute percentage and the accumulative percentage.
| Root Cause | Occurrence | Absolute Percentage | Accumulative Percentage |
| Working room temperature | 14 | 17.95 | 17.95 |
| Cooling system malfunction | 21 | 26.92 | 44.87 |
| Lack of experience | 7 | 8.97 | 53.84 |
| High performance games | 12 | 15.38 | 69.22 |
| Lack of technology | 6 | 7.69 | 76.91 |
| Continuous use over long time | 18 | 23.07 | 100 |
| 78 |
From the above data, a Pareto chart is developed.
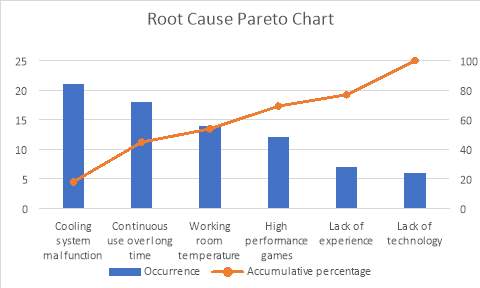 Thus from the above analyses, it can be concluded that the overheating of the device is mainly caused due to the cooling system malfunction. Thus for solving the problem of overheating, the cooling system should be adequately tested and addressed.
Bibliography:-
Akpolat, H. 2004, Six sigma in transactional and service environments, Gower Publishing, Ltd.
Aschermann, E. & Klenzan, J. 2015, ‘Collaborative Learning Processes in Teacher Training: Benefits and Costs’, Integral Review: A Transdisciplinary & Transcultural Journal for New Thought, Research, & Praxis, vol. 11, no. 3.
Boireau, C., Dufour, B. & Praud, A. 2017, ‘The importance of communication in promoting voluntary participation in an experimental trial: A qualitative study based on the assessment of the gamma-interferon test for the diagnosis of bovine tuberculosis in France’, PloS one, vol. 12, no. 10,p. e0185799.
Brugha, R. & Varvasovszky, Z. 2000, ‘Stakeholder analysis: a review’, Health Policy and Planning, vol. 15, no. 3,pp. 239-46.
Covey, S.R., ‘The Seven Habits of Highly Effective People’, New York: Fireside personality dimensions: A replication among English adults. Journal of Genetic Psychology, vol. 162, pp. 119-23.
Garvin, D.A. 1984, ‘What Does “hltoduct Quality” Really Mean?’, Sloan management review, p. 25.
Helms, M.M. & Nixon, J. 2010, ‘Exploring SWOT analysis–where are we now? A review of academic research from the last decade’, Journal of strategy and management, vol. 3, no. 3,pp. 215-51.
Ishikawa, K. 1982, Guide to quality control.
Lenhart, A., Kahne, J., Middaugh, E., Macgill, A.R., Evans, C. & Vitak, J. 2008, ‘Teens, Video Games, and Civics: Teens’ Gaming Experiences Are Diverse and Include Significant Social Interaction and Civic Engagement’, Pew internet & American life project.
Miller, P. 2000, ‘Gaming console’, Google Patents.
Montgomery, D.C. 2007, Introduction to statistical quality control, John Wiley & Sons.
Mrayyan, M.T. 2012, ‘Reported incidence, causes, and reporting of medication errors in teaching hospitals in Jordan: A comparative study’, Contemporary nurse, vol. 41, no. 2,pp. 216-32.
Oakland, J.S. 2007, Statistical process control, Routledge.
Rees, C. 2014, A Four Step Approach to Capturing Customer Requirements, Bussiness2community, viewed September 28 2017, <http://www.business2community.com/strategy/four-step-approach-capturing-customer-requirements-0959078#twyiWcOD6whGReko.97>.
Webber, K.S.J.E. 2017, 16 trends that will define the future of video games, Guardian News and Media Limited viewed September 23 2017, <https://www.theguardian.com/technology/2015/jul/23/16-trends-that-will-change-the-games-industry>.
Xu, Q., Jiao, R.J., Yang, X., Helander, M., Khalid, H.M. & Opperud, A. 2009, ‘An analytical Kano model for customer need analysis’, Design Studies, vol. 30, no. 1,pp. 87-110.
Cite This Work
To export a reference to this article please select a referencing stye below:
Related Services
View all


Related Content
All TagsContent relating to: "Computing"
Computing is a term that describes the use of computers to process information. Key aspects of Computing are hardware, software, and processing through algorithms.
Related Articles

DMCA / Removal Request
If you are the original writer of this dissertation and no longer wish to have your work published on the UKDiss.com website then please: