Dynamics of Asymmetrical Configurations of Catamaran Hull Forms
Info: 11858 words (47 pages) Dissertation
Published: 12th Jan 2022
Tagged: Engineering
Abstract
It is important to have an understanding of the vessels motions since it will influence the loads and also the comfort of the passengers and crew. Even though considerable amount of research has been carried out in this area, very little has been done when it comes to motions prediction of asymmetrical catamaran hull forms. Studies carried out so far have been for motions characteristics of the conventional catamaran hull forms.
This thesis attempts to undertake a comparative analysis of motion characteristics between newly developed unconventional catamaran hull forms of different configurations derived from existing conventional NPL series of round bilge catamaran hull forms, Molland et el., (1994). For this a set of catamaran hull forms with the main hull length of 40 m, and with a different separation ratios (s/L) generated by using standard modelling software. MAXSURF, a strip theory based seakeeping calculation package which uses slender body strip theory method is used to carry out motion analysis. The hulls are tested at Froude numbers 0.2, 0.5 and 0.8, also at different separation ratios (s/L) of 0.2 and 0.4.
The objective of the study is to perform a comparative heave and pitch response comparison along with added resistance analysis between unconventional hull configurations against conventional hull forms. This study will help the designer to make batter power requirement calculations, motion sickness index prediction during the early design stage. Finally, the results will attempt to conclude whether unconventional and unsymmetrical catamaran hull forms are more efficient than the conventional hull forms. This study will help provide a pathway for a better understanding of unconventional catamaran hull forms.
Nomenclature
Acronyms
CAD Computer Aided Drafting
CFD Computational Fluid Dynamics
DOF Degree of Freedom
IGES Initial Graphics Exchange Speciation
IITC International Towing Tank Conference
ISSC International Ship and Offshore Structure Committee
JONSWAP Joint North Sea Wave Project
LCB Longitudinal center of buoyancy
MT Metric tonne
NPL National Physics Laboratory
NURBS Non-uniform rational B-spline
P-M Pierson-Moskowitz Sea Spectrum
ROA Response Amplitude Operator
VOF Volume of Fluid
WSA Wetted surface area.
Chapter 1
Introduction
High speed catamarans have been popular when it comes to recreational boats and border patrol vessels. It is likely that the popularity of catamarans will grow in years to come and become more mainstream hulls used as high-speed transport vehicles. It is crucial that the high-speed vessels address some important issues such as, rising fuel cost and being environmental friendly. So, to achieve that, efficient performance plays a prime role as it has direct impact on the operational costs.
The key factor associated with sea keeping performance are
a) Relative motion between waves and vessel.
b) Hull form geometry.
In order to predict a catamaran performance, it is essential to calculate the ship motions. There are several options when choosing which method to use to calculate the ship motions. There are simplified methods such as strip theory using potential theory, and more advanced methods such as computational fluid dynamics (CFD). In strip theory, the length of the ship is divided into vertical two dimensional (2D) strips or sections and the forces and moments and hydrodynamic coefficients on are calculated on each strip each strip. In panel method, the ship hull is divided into small panels instead of vertical sections. When the Navier-Stokes equations are solved, as done in many CFD packages, it is possible to include some of the viscous effects and also some non-linear effects such as green water on deck and bottom slamming. Nowadays CFD is slowly gaining popularity, Faltinsen and Timokha (2009). But strip theory is still commonly used as it is employed in most commercial software such as MAXSURF and SEAWAY can be used due to its speed and fairly good accuracy. CPU-time and computer costs are some of the disadvantages of CFD.
1.2 Scope of Work
This research makes an attempt to predict motion characteristics of an asymmetrical high-speed catamaran hull form configuration by making a significant change in the hull geometry. These new designed asymmetrical catamarans are different from the conventional ones, as slicing of each demi hull of the catamaran into half which makes the hull displacement of a catamaran to be half of the conventional catamaran hull form.
The steps in this thesis would comprise of:
- Develop catamaran hull form using the existing S-NPL series round bilge model 4b.
- Perform seakeeping analysis of generated catamaran hull form and compare it to existing data, thus validating the software.
- Create two new asymmetrical catamaran hull forms, using the S-NPL series round bilge catamaran hull forms.
- Conduct seakeeping analysis on two new created asymmetrical catamaran hull forms for Froude number for Froude number 0.2, 0.5 and 0.8.
- Investigate the results.
Chapter 2
Background
The basic theory of motions of a ship in waves was first established by Froude (1861) and by Krylov (1896), assuming the waves are not disturbed by the existence of body. Froude-Krylov forces are the wave forces acting on the submerged body due to incident waves.
The concept of high-speed ships evolved in 1870 when naval forces started using the torpedo boats. These torpedo boats were developed as a result of the invention of torpedo by Giovanni Luppis of Austria-Hungary in 1860 as indicated by De Jong (2011). During those periods where navies mostly relied on heavily armored battleships, naval forces started using torpedo boats because they were cheap, faster than the battleship and can be easily maneuvered. In the early 20th century ships were able to move at higher speeds, thanks to the invention of steam turbine and internal combustion engines at the beginning of 20th century numerous studies were carried out and papers were published on the planning characteristics of prismatic hulls and systematic hull form series, Sottorf (1934); Savitsky (1964); Clement and Blount (1963). Till 1960s, the research on hydrodynamics of high-speed hull forms mostly focused on the calm water resistance and stability, Savitsky (1968). Fridsma (1969), carried out a systematic study on a series of constant dead rise models of varying length and investigated the effects of trim, load, speed and length-to-beam ratio. His study showed the importance of heave-pitch motions and impact accelerations on the rough water performance of planning hulls. He carried out his experiments on both regular and irregular waves. He also observed a significant nonlinear relation between motion responses and wave height.
The initial efforts on the hydrodynamic problems associated with catamarans were to minimize the resistance in the calm water (e.g. interference effects of demi hulls in proximity of one hull on the other Molland, 1994). Since then, there has been a significant growth of interest in the concept of multi-hull ships. Hadler et al., (1974) presented the full and model scale experimental program conducted with Hayes catamaran. Compared to the motion problems of twin-hull ships, there has been a limited amount of research and development efforts. The following are some recent development in the motions of catamarans.
Sahoo and Doctors (2004) performed a study on seakeeping characteristics for a range of high-speed catamaran hull forms based on a typical geometry used in practice by Australian high-speed ferry industry. Their study involved investigation of models with chine hull forms (CH) Semi-SWATH (SS) and round bilge (RB). The below table shows parameters of the models used in the experiment.
They conducted computer simulations on these hull forms with a separation ratio of s/L 0.2 and 0.3 and at Froude numbers 0.35, 0.55 And 0.85. They found that the chine hull form catamaran had somewhat better performance in heaving and pitching response compared to other two hull forms.
 |
 |
 |
| Chine catamaran demi hull (m6-ch) | Round-Bilge catamaran demi hull (M1-RB) | Semi-SWATH catamaran demi hull (M2-SS) |
Figure 2.1 Catamaran hull forms [Sahoo and Doctors (2004)]
Table 2.1 Test models details [Sahoo and Doctors (2004)]
| Model | M1-RB | M2-SS | M3-SS | M4-SS | M5-CH | M6-CH | M7-CH |
| Draft (m) | 1.5 | 1.7 | 1.8 | 1.8 | 1.4 | 1.3 | 1.3 |
| Lwl (m) | 47.7 | 47.7 | 47.6 | 47.5 | 47.5 | 45.8 | 45.8 |
| Bwl (m) | 3.2 | 3.1 | 3.2 | 3.2 | 3.1 | 3.1 | 3.1 |
| CB | 0.55 | 0.49 | 0.46 | 0.46 | 0.6 | 0.66 | 0.66 |
| Δ (t) | 127.5 | 127.5 | 127.5 | 127.5 | 127.5 | 127.5 | 127.5 |
| LB | 15 | 15.2 | 15.1 | 15.1 | 15.2 | 14.8 | 14.8 |
| BT | 2.1 | 1.8 | 1.8 | 1.8 | 2.2 | 2.3 | 2.3 |
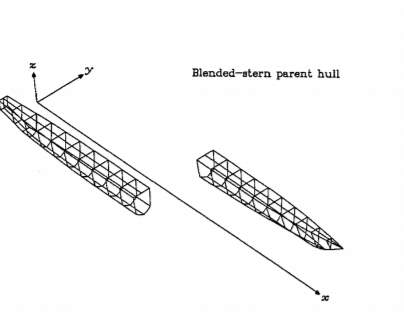
Doctors (2000) using the three parent catamaran hull forms to generate 48 transformed catamaran models. The following are the parameters of the parent catamarans used in his experiments.
Table 2.2 Parent hull model parameters [Doctors (2000)]
| Parameters | symbol | unit | values | ||
| Parent model | – | – | 1 | 2 | 3 |
| Stern type | – | – | Pointed | Blended | Transom |
| Waterline length | L | m | 100 | 100 | 100 |
| Waterline Beam | B | m | 4.899 | 4.899 | 4.899 |
| Draft | T | m | 3.996 | 3.740 | 3.315 |
| Displacement mass | Δ | t | 1000 | 1000 | 1000 |
| Block coefficient | CB | – | 0.4984 | 0.5325 | 0.6011 |
| Prismatic coefficient | CP | – | 0.6174 | 0.6671 | 0.763 |
| Slenderness ratio | L∇1/3 | – | 10.08 | 10.08 | 10.08 |
| Length to beam ratio | LB | – | 20.41 | 20.41 | 20.41 |
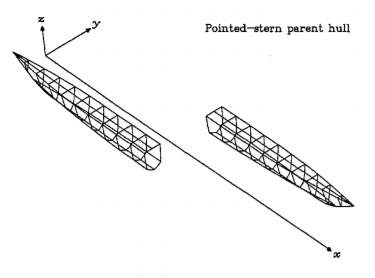
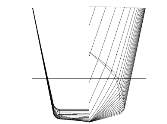
Figure 2.2: Pointed stern hull parent hull [Doctors (2000)]
 :
:
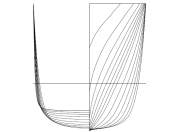
Figure 2.3: Bent stern parent hull [Doctors (2000)]
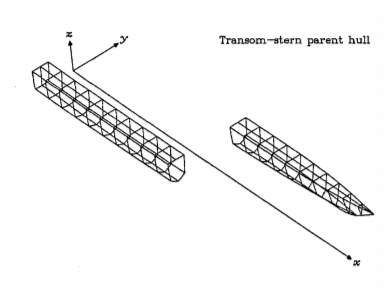
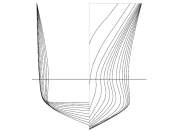
Figure 2.4: Transom stern parent hull [Doctors (2000)]
The three parent catamaran hulls nearly had similar dimensions, such as displacement, length, slenderness ratio and draft. In transformation process, they were changed accordingly for a reasonable comparison. The result of this work illustrated that seakeeping performance of a catamaran improves by doubling the hull length.
Centeno et al., (2000) presented an approach to calculate catamaran motions in regular waves. The approach was two-dimensional potential flow theory based. The study did not consider the viscous effects resulting in over prediction of response amplitude operator at resonance frequencies. The authors presented a theoretical approach for hydrodynamic forces and induced motions. To check the validity of the mathematical model, researchers used the calculations on twin cylinder and simple catamaran hull forms and compared the results with already published experimental results. The research concluded that influence of viscous effect is more at high forward speed. In the case of the catamarans, the results showed that chance in viscous forces had little effect on motion response in comparison to effect it had on drag and lift coefficients. Below are the main the parameters of catamarans used in the study.
Table 2.3 catamaran parameters [Centeno et al., (2000)]
| Parameters | Unit | Value |
| Length Overall | m | 84 |
| Length between perpendiculars | m | 80 |
| Breadth | m | 20.80 |
| Demi hull breadth | m | 5 |
| Draught | m | 2 |
| Displacement | MT | 1,000 |
The study concluded that, three-dimensional source distribution method was not much different than strip theory method. Both the methods did not give accurate results at higher Froude number.
The authors Subramanian and Gururajan (2004) conducted an experimental investigation of motions on a series of three chine planning catamarans hull forms. Each of the three hulls had a parametric variation in L/B ratio and s/L ratio. The authors compared experimental results with analytical prediction based on program SEDOS, Söding (1988). The experiment was confined to forward speed in regular head seas in a towing tank. The research concluded that slender body hulls gave a subdued response, compared with a wider hull. Authors noted that beyond a thrust hold limit an extremely slender body doses not give any extra benefit.
Beck and Reed (2000)compared various seakeeping methods used, such as strip theory, RANS (Reynolds-averaged Navier–Stokes equations) Potential flow methods along with experimental data. They concluded, Due to fast solutions of strip theory method, 80% of all seakeeping computations used it. Strip theory has an advantage of being applicable to most conventional ship geometries. Strip theory is still the most popular in the industry. Yet, in many situations, it does not give adequate results and needs more advanced techniques. Some weakness of strip theory includes, its inability to account for three-dimensional effects, inability to account for the above-water hull form, lack of forward speed corrections and the lack of viscous effects. Potential flow methods have shown improvement over strip theory predictions. In theory, advanced potential flow methods have shown marked improvement over strip theory predictions, and can account for mentioned weakness of Strip theory, but it needs more computational power and few results were available. They also concluded that there is need for more data validation. Experimental data, both model, and full scale, useful for validation studies are time-consuming and costly. For extreme sea states in which the responses are in general random, so a there should be a proper form of data.
Table 2.4 Catamaran hull parameters [Subramanian, Gururajan (2004)]
| Particulars | Prototype -I | Prototype -II | Prototype -III |
| Length L [m] | 50 | 50 | 50 |
| Demi-hull breadth b [m] | 3.33 | 5 | 7.5 |
| Displacement ∆ [t] | 250 | 500 | 1000 |
| Design draught d [m] | 1.27 | 1.92 | 2.88 |
| Depth D [m] | 3.33 | 5 | 7.5 |
| L/b ratio | 15.15 | 10 | 6.66 |
| L/(∇)^1/3 | 19.84 | 15.75 | 12.5 |
| Block coefficient
CB |
0.452 | 0.4 | 0.255 |
| Area at mid ship section [m2] | 4.11 | 8.75 | 21.36 |
| Prismatic coefficients Cp | 0.608 | 0.571 | 0.468 |
| Type of hull | Single chine planning hull form | ||
| Model scale | 1:25 | ||
Fang (1996) examined an analytical technique based on the two-dimensional Green function method associated with a cross flow approach for taking viscous effect into account to estimate motion response of a catamaran in frequency domain. In order to validate this method, the numerical results were compared with experimental values obtained for two different catamarans. The study concluded that the two-dimensional method calculations provided a reasonable predictions of motion response of catamarans at low forward speeds. There were discrepancies observed in the prediction of pitch motion in the low wave frequency region.
Journée (1992)conducted a study on strip theory based calculation method for ship design purposes, which delivered information on ship motions and added resistance within a very short computation time. The program SEAQUICK, was used to perform ship motion calculations, on several types of ship which included a container ship, a crude oil tanker, a trawler and a series of transformed container ships. The calculated data were compared with those of the parent program SEAWAY, of which the calculations have been carried out with high demands on the accuracy of the calculated data. For the container ships and the crude oil tanker, the calculations were carried out in open ocean areas and for the trawler in North Sea areas. The wave spectra in the open ocean areas are defined by a Bretschneider wave spectrum. The wave spectra in the North Sea areas are defined by a mean JONSWAP wave spectrum.
The study concluded that for high-speed vessels, for ships with length to breadth ratios lower than 3.0 and for ships with a significant influence of submerged cross-sections or bulbous bows, more or less results were inaccurate. Because of use of linear theory, less accurate results were found for large motions in extreme sea conditions. While calculating vertical motions relative to the waves or calculating probabilities on shipping water or bow slamming, the static and dynamical swell-up were not accounted for in this study. The Ikeda method was used to estimate the viscous roll damping was found to be less suitable for an unusual ship form, very full ships or ships with a large breadth to draught ratio. The calculation method used in this study were for an infinite water depth. Restricted water depth effects were not considered.
Sen and Negi (2014) computed wave-induced motions and loads on catamaran hulls with forward speed. For this study a basic 2D strip theory approach was used in which the sectional hydrodynamic properties were determined using source-distribution method. Two alternative schemes were used to solve double-hull problem and compute the sectional properties. In one the demi hulls were treated to be hydrodynamically independent of each other. In the other approach, both demi hulls were considered simultaneously as part of the section, and thus the demi hulls can be considered hydrodynamically interacting. The computational results were compared to existing experimental data.
Table 2.5 Catamaran hull parameters [Sen and Negi (2014)]
| Parameter | Symbol | Value | Unit |
| Length between perpendiculars | L | 3 | m |
| Beam overall | B | 0.94 | m |
| distance between center of demi- hulls | b | 0.24 | m |
| Draught | T | 0.15 | m |
| Volume displacement | ∇ | 0.08707 | m3 |
The study concluded that while computed predictions roughly follow the general trend of experimental data, there were large differences particularly in the load predictions, but it was found that, motions predictions were better compared to load prediction. This study indicated that simplified 2D based schemes were able to provide a reasonable indication of motions during preliminary design stages, but in case of load design this simplified approached appeared incapable of providing any reasonable prediction for twin hulls.
Chapter 3
SEAKEEPING THEORY
The motion characteristics of vessel are very importance for smooth operation. A ship is a complex elastic structure exerting forces on its environment with its propeller and hull, and forces are exerted on it by wind and wave. The interaction of ship and environment causes complex motion, which can be generally translated into three translational components which are, Lloyd (1998).
Table 3.1: Axis and ship motion definition
| Motion | Unit | Positive |
| Surge | meters | forward |
| Sway | meters | to starboard |
| Heave | meters | down |
| Roll | Degrees | port |
| Pitch | Degrees | Bow up |
| Yaw | Degrees | port |
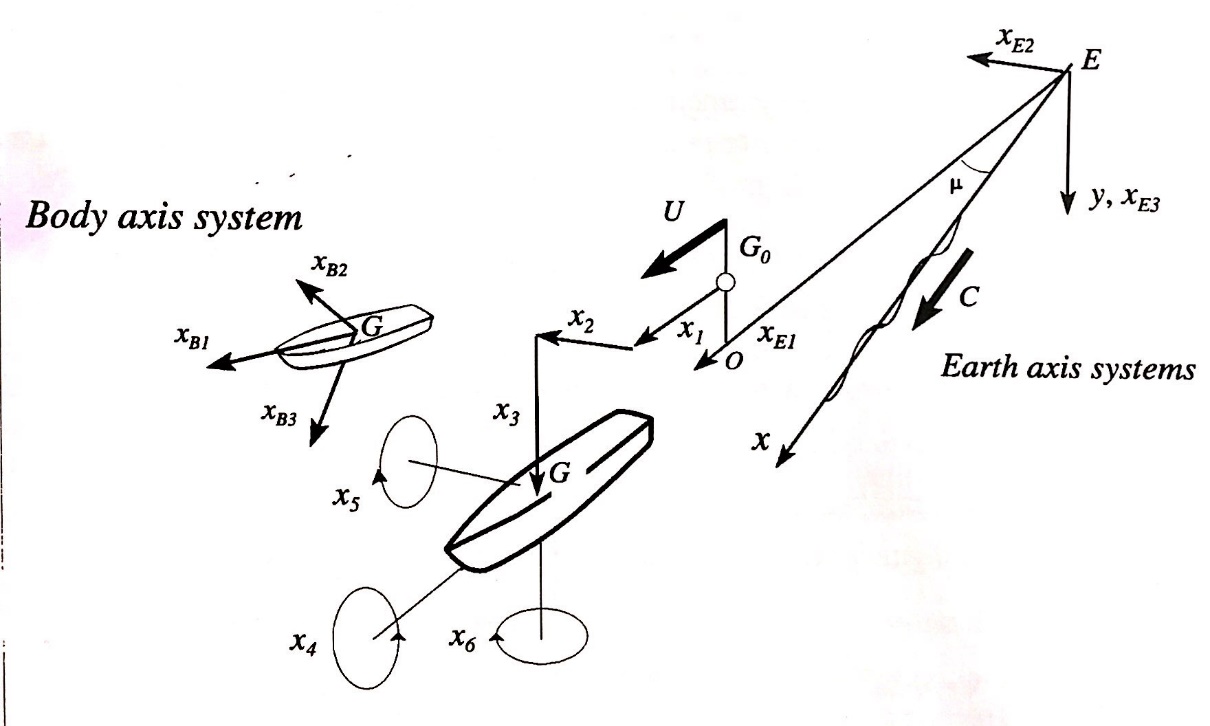
Figure 3.1 Six degrees of freedom of a ship, Lloyd (1998)
Most ships have port/starboard symmetry and so, surge heave and pitch, which lie in the plane of symmetry
Mass moment of inertia
Ship may be regarded as being composed of a large number of very small masses
δmin kilo grams.
Figure shows one of the masses lactated at (
xB1, xB2, xB3)relative to the center of gravity of the ship. If the ship has linear acceleration
x1̈ x2̈ ẍ3m/sec2 and angular acceleration
x4̈ x5̈ ẍ6rad/sec2 the mass
δmwill have linear accelerations, Lloyd (1998).
x1̈’= x1̈+xB3 x5̈-XB2 x6̈
m/sec forward (3.1)
x2̈’= x2̈+xB3 x4̈-XB1 x6̈
m/sec to Starboard (3.2)
x3̈’= x3̈+xB2 x4̈-XB1 x5̈
m/sec downwards (3.3)
From newton’s second law of motion, the force and moment necessary to sustain these accelerations are
δF1= δm x1̈’
N surge force forward (3.4)
δF2= δm x2̈’
N Sway force to starboard (3.5)
δF3= δm x3̈’ N
Heave force downwards (3.6)
δF4= δm xB2 x3̈’
–
δm xB3 x2̈’N m roll moment to starboard (3.7)
δF5= δm xB3 x1̈’
–
δm xB1 x3̈’N m Pitch moment bow up (3.8)
δF6= δm xB1 x2̈’
–
δm xB2 x1̈’N m Yaw moment to starboard (3.9)
Moment of inertia is the name given to rotational inertia, the rotational analog of mass for linear motion. It appears in the relationships for the dynamics of rotational motion. The moment of inertia must be specified with respect to a chosen axis of rotation, Lloyd, (1998).
For practical engineering purposes the following formulas are used calculate moments of inertia
I44=m k42 kg m2
(3.10)
I55=m k52 kg m2
(3.11)
I66=m k62 kg m2
(3.12)
Where
I44, I55 and I66are roll pitch and yaw moments of inertia of the ship. M is mass of the ship in kilograms and k is radii of gyration.
Here the radii of gyration of an area about a given axis is a distance k from the axis. At this distance an equivalent area is thought of as a line area parallel to the original axis. The moment of inertia of this Line Area about the original axis is unchanged, Lloyd (1998).
k4 ≈0.3 B m
(3.13)
k5 ≈0.225 L m
(3.14)
k6 ≈0.225 L m
(3.15)
Where B is the maximum waterline beam and L is the Waterline length.
Heave and pitch motions of a vessel in a seaway
The motions of ship response to waves maybe considered as a forced damped spring mass system. The two coupled equations of motions for heave and pitch, respectively are shown below, Lloyd (1998).
m+A33 ẍ3+B33 x3̇+C x3 +A35 x5 ̈+B35 x5̇+C35 x5=F3eiωet
(3.16)
I55+A55x5̈+ B55 x5̇+C55x5+ A53 x3̈+B53 x3̇+c53x3 =F5eiωet
(3.17)
Transfer Functions
The motion amplitude and the phase are function of speed, heading angle and encounter frequency. The amplitudes are assumed to be proportional to the wave amplitude and it is usual to express them in non-dimensional form. Heave amplitude is made non-dimensional by dividing wave amplitude, the pitch amplitude is made non-dimensional by diving pitch amplitude by wave slope amplitude, Lloyd (1998).
Heave transfer function= Heave Amplitude RMS Wave amplitude RMS
(3.18)
Pitch transfer function= Pitch Amplitude RMS [rad]Wave amplitude RMS [m] X g ms-2ωe2 rads-1
(3.19)
The encounter frequency
ωeis related to wave frequency
ω0as shown in below equation,
ωe=ω0-cosμ ω02 ug
(3.2
Where,
u
= The ship speed in m/sec.
μ
= The ship heading angle
In the case of head seas, the heading angle is taken as
μ=π.
Response Amplitude Operator
Known by the acronym of RAO, response amplitude operators are nothing but square of transfer functions. In the field of ship design and design of other floating structures, a response amplitude operator (RAO) is an engineering statistic, or set of such statistics, that are used to determine the likely behavior of a ship when operating at sea.
The following equations gives the RAOs for Pitching and Heaving motion, Bhattacharyya (1978).
Pitch RAO =
x50akζ02 (3.21)
Heave RAO=
x30aζ0 2 (3.22)
Where,
x30a
–Amplitude of pitching motion (rad)
x50a
– Amplitude of heaving motion (m)
ζ0
– Amplitude of wave height (m)
k – Wave number
Chapter 4
Definition of seaway
Regular waves seldom occur in seas. The natural seaway, which is highly irregular, in which a ship operates can only be described my means of a statistical model. The spectral density of an irregular sea state is the primary means for representing the seaway and the oscillatory response of the vessel to the sways.
A sea is a train of waves driven by the prevailing local wind field. The waves are short-crested with the lengths of the crests only a few (2-3) times the apparent wave length. Also, sea waves are highly irregular; high amplitude waves are followed unpredictably by low amplitude waves and vice versa. Individual wave crests seem to propagate in different directions with several degrees of deviation from the mean direction. The crests are fairly sharp and sometimes even small waves can be observed on these crests or there are dents in the larger wave crests or troughs, Bhattacharyya (1978).
Wave Spectra
Irregular ocean waves are often characterized by a “wave spectrum”, this describes the distribution of wave energy (height) with frequency.
Ocean waves are often characterized by statistical analysis of the time history of the irregular waves. Typical parameters used to classify irregular wave spectra are listed below.
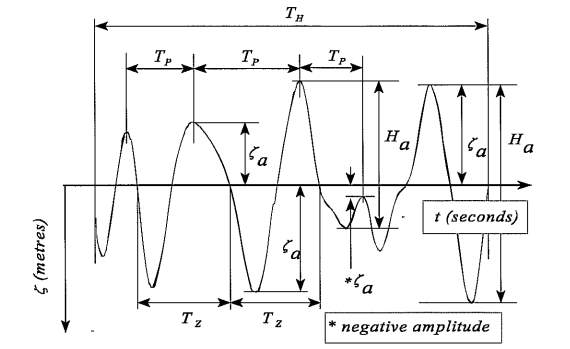
Figure 4.1- Typical wave record [Lloyds (1998)]
ζa̅
– Mean wave amplitude in meters
Ha̅
– Mean wave height. In meters
Tp̅
– Mean period of the peaks in seconds
Tz ̅
– Mean zero crossing period in seconds.
H̅13
= Significant wave height
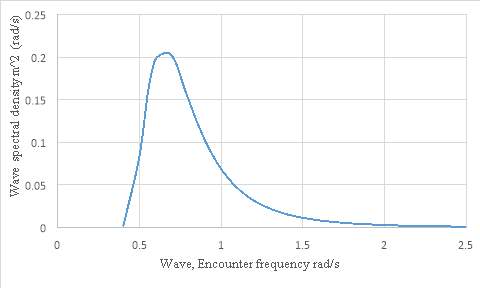
Figure 4.1- Typical wave spectrum generated using MAXSURF
The key to calculating characteristics is the spectral moment
mn the nth spectral moment is calculated using the equation below; n may be taken as any positive integer (n=0, 1, 2,).
mn=∫0∞ωn sωdω
(4.1)
From these spectral moments, it is possible to calculate many of the time series characteristics. Of particular importance is zeroth spectral moment, m0, this is equivalent to the area under the wave spectrum curve.
m0=∫0∞ sωdω
(4.2)
The RMS or standard deviation, is given by
σ:
σ= m0
(4.3)
The average period,
T̅may be found by calculating the “center of area” of the energy Spectrum; thus, the average period is given by:
T̅=2πm0m1
(4.4)
It may be shown that the mean period of the peaks
Tp̅ is given by:
Tp̅ =2πm2m4
(4.5)
And the mean zero crossing period,
Tzis given by:
Tz̅ =2πm0m2
(4.6)
And that the significant wave height is given by:
H̅13=4 m0
(4.7)
Sea Spectrum Models
In order to fit wave data, numerous spectrum types are proposed. Six commonly used model spectrums are:
1) Neumann Spectrum
The first and the simplest analytical model of ocean wave spectrum is the Neumann Spectrum (1953). It is single parameter based spectrum based on wind speed, Uw, which can be defined as, Bhattacharyya, (1978):
S ω=1.466Hs2 ω05ω6 e[-3 ωω0 2]
(4.8)
Where,
Hs=Significant wave height
ω0= 23 gUw
2) Pierson- Moskowitz Spectrum
Proposed by Pierson-Moskowitz in 1964. Often referred as P-M spectrum. It is defined as a single parameter spectrum and can be used to describe a fully developed sea, meaning waves are developing from all directions, Bhattacharyya (1978):
S ω= αg2ω5 e[-0.74 ωUω 19.5g -4]
(4.9)
Where,
α=0.0081
3) JONSWAP Spectrum
Proposed by Hasselman et al., (1973). JONSWAP is an acronym for Joint North Sea Wave Project. The wave data used in this were collected over a large area extending from the North Sea from Sylt Island. This is a two-parameter spectrum based on P-M spectrum. In reality there are five parameters that define JONSWAP spectrum, these are
γ, τ , ω0 , X and Uw and the last two variables
X and Uw are considered variables, Bhattacharyya (1978):
S ω= αg2ω5 e-0.74 ωUω 19.5g -4 γeω-ω02τ2ω02
(4.10)
τ=Peakedness paramater
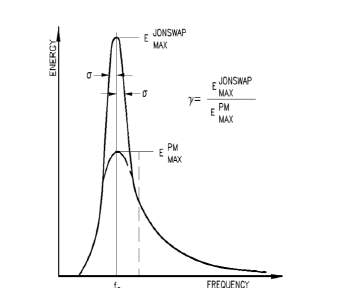
Figure 4.3: Peakedness parameter, Bhattacharyya, (1978)
Ratio between the peak frequencies of the JONSWAP and P-M spectrum and can range between 1 and 7. However it is more commonly given as
γ=3.3
Where,
τ=Shape paramater
, Which varies from
τ=0.07 for
ω≤ω0and
τ=0.09
ω>ω0
X = Fetch. Variable parameter determined by the operator.
α=0.076 X0-0.22
If fetch is unknown, then
α=0.0081
ω0=2πgUw X-0.33
X0= gUw
4) Bretschneider Spectrum
This is also an example of two parameters spectra, its parameter relates to wave height and period. It can be applied to fully developed seas which are 90% developed or sea that are 80% developed. Bhattacharyya, (1978):
S ω=0.1687Hs2 ωs5ω5 e-0.675 ωsω 2
(4.11)
Where,
ωs= 2πTs
Ts=
Significant wave period, defined as the average period of the significant waves.
5) ISSC Spectrum
Proposed during the International Ship Structures Congress (1964). It is a modification to Bretschneider spectrum. Bhattacharyya, (1978):
S ω=0.1107Hs2 ω4̅ω5 e-0.4427 ω̅ω 4
(4.12)
Where,
ω̅=1.296 ω0
6) ITTC Spectrum
Proposed as a modification cation to the P-M spectrum at the International Towing Tank conference (1966, 1969, and 1972) for fully developed seas in terms of significant wave height and zero crossing frequency, Bhattacharyya (1978):
S ω= αg2ω5 e-4αg2ω-4Hs2
(4.13)
Where,
α= 0.0081k4
k=gσ3.54 ωz
σ= m0= Hs4
ω0= m2m0
Chapter 5
MAXSURF motions strip theory and model preparation
Strip theory
Solving the equations of motion requires the evaluation of equations and the extraction of amplitudes and phases. These may be determined by experiment but this matter is laborious and hardly practical for routine calculation.
Considerable effort has therefore been developing characters for determination the coefficient excitation to allow ship motions to be calculated without recourse to experiment. Various researchers, including Tasai (1959), Gerritsma and Beukelman (1967), Salvensen, Tuck and Faltinsen (1970) and Schmitke (1978), have made significant contributions. The theories are generally similar, differing only in details and mathematical rigors.
Strip theory is a frequency-domain method. This means that the problem is formulated as a function of frequency. The main advantage of this method its simplicity and time saved due to low computational power requirement, and it gives fairly accurate results.
The following are the assumptions made in this strip theory, Lloyd (1998).
- The ship is Slender, that is length is much greater than beam or draft and beam is much less than the wavelength.
- Hull is rigid.
- Speed is moderate with no lift from forward speed.
- Motions are small and linear with respect to wave amplitude.
- Hull sections are wall-sided.
- Water depth is much greater than wavelength so that deep-water wave approximations may be applied.
- The hull has no effect on the incident waves (so called Froude- Krylov hypothesis).
The vessels underwater hull is split into a number of transverse sections as shown in the figure below. Each of these sections is then treated as a two-dimensional section in order to compute its hydrodynamic characteristics. The coefficients for the sections are then integrated along the length of the hull to obtain the global coefficients of the equations of motion of the whole vessel.
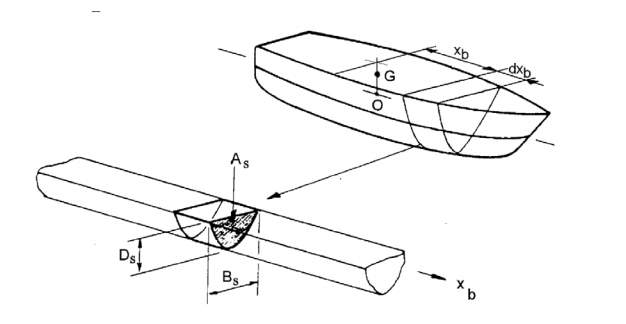
Figure 5.1 -Representation of underwater hull section [Lloyd (1998)]
Each strip is of delta XB1meters (assumed to be small). Each strip has associated local hydrodynamic properties (added mass, damping and stiffness) which contribute to the coefficients for the complete hull in the equations of motion. Similarly wave excitation experienced by the hull are composed of contributions from all the strips. Strip theory assumes that these local hydrodynamic properties are the same as would be experienced if the strip were part of an infinitely long cylinder of the same cross sectional shape as shown in figure above. In other words, the three-dimensional effects, such as mutual interference between the strips, flow leakage around the ends of ship and effects due to changes in the shape of strip over the length delta XB1are ignored, Lloyd (1998).
The forces and moments acting on a slender hull are a result of integrating pressures over the wetted hull surface. In particular, heaving forces and pitching moments can be obtained by integrating the vertical components of pressure over the hull, Bhattacharyya (1978).
Solution of coupled heave and pitch motions
The solutions to the coupled heave and pitch equations are found using the method described by, Bhattacharyya (1978). Which is outlined below:
P=C33-m+A33 ωe2+iB33 ωe
(5.1)
Q=C35-A35 ωe2+iB35 ωe
(5.2)
R=C53-A53 ωe2+ iB53 ωe
(5.3)
S=C55-(I55+A55 )ωe2+ iB55 ωe
(5.4)
Using P, Q, R and S one can solve for final solutions of motion equations for heave and pitch. These are, respectively, Bhattacharyya (1978):
Z3=F5 Q-F3 SQR-PS=Z30eiϵ3
(5.5)
Z5=F3 Q-F5 SQR-PS=Z50eiϵ5
(5.6)
Model Preparation
In this thesis, an attempt was made to undertake seakeeping analysis of asymmetric catamaran hull forms. A catamaran comprises of two demi hulls usually with each demi hull having the same waterline length and breadth. Both demi hulls are usually positioned parallel to each other with a certain distance between the center lines of each hull which is termed as separation ratio (s/L).
This thesis deals with the comparison of seakeeping characteristics of asymmetrical catamaran hull forms and those with existing NPL series round bilge catamaran hull forms. The mono hull model 4b was initially chosen from the NPL series of round bilge hull forms and converted to a catamaran hull form. The parent hull model used here is 4b in creating different configurations of asymmetrical catamarans, as shown in Figure below.
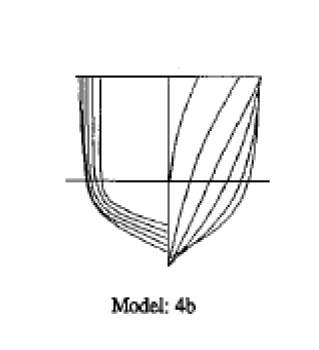
Figure 5.2 Model 4b body plan [Molland et al., (1994)]
Wellicome et al., (1995) conducted an experimental investigation into seakeeping characteristics of catamarans. Their experiments used three geometrically similar hull forms covering a range of L/1/3 ratio from 7.4 to 9.5. All the three hull were based on NPL round bilge series. A number of hull configurations including mono hull and catamaran with two demi hull spacing were tested at three different Froude numbers (
Fn= 0.2, 0.53, 0.8). All the experiments were conducted in head seas. Table 5.1 depicts the hull form parameters of the NPL series 4b hull.
The Configurations of Asymmetrical Catamaran models
Two models of asymmetrical catamarans namely Inboard Asymmetric and Outboard Asymmetric catamaran hull forms were created from the existing S-NPL series mono hull model 4b with two different separation ratios (s/L) of 0.2 and 0.4. The asymmetrical demi hull were arranged such that the hull width is a half of the symmetrical hull with the flat sides facing inwards and outwards. For this study the length of asymmetrical catamarans and regular catamaran was changed to 40m, it was made sure that parameters such as displacement and draft amid ship were kept constant for fair comparison.
Table 5.1 Main parameters of NPL hull models [Wellicome et al., (1995)]
| Model | 4b | 5b | 6b |
| Length | 1.6 m | 1.6 m | 2.1 m |
| L/B | 9.00 | 11.00 | 13.10 |
| B/T | 2 | 2 | 2 |
| CB | 0.397 | 0.397 | 0.397 |
| Cp | 0.693 | 0.693 | 0.693 |
| CM | 0.565 | 0.565 | 0.565 |
| WSA | 0.338 | 0.276 | 0.401 |
| LCB | -6.40% | -6.40% | -6.40% |
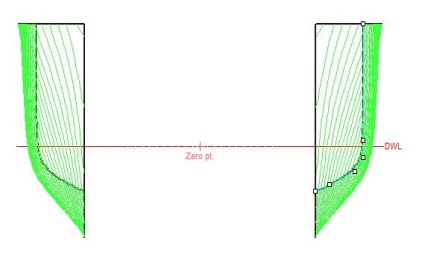
Figure 5.3: Body plan view of an Outboard Asymmetrical Catamaran (s/L-0.4)
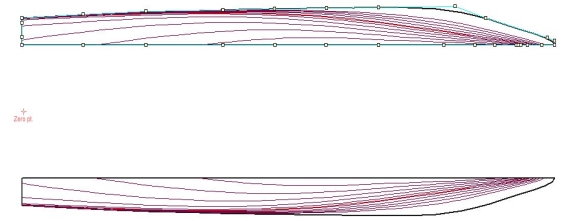
Figure 5.4: Plan view of an Outboard Asymmetric Catamaran (s/L-0.4)
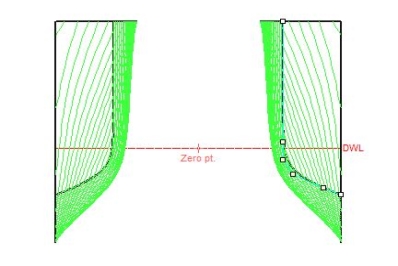
Figure 5.5: Body plan view of an inboard Asymmetrical Catamaran (s/L-0.2)
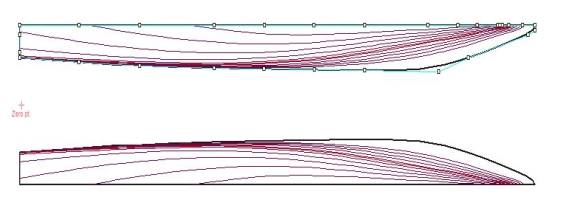
Figure 5.6: Plan view of an inboard Asymmetrical Catamaran (s/L-0.2)
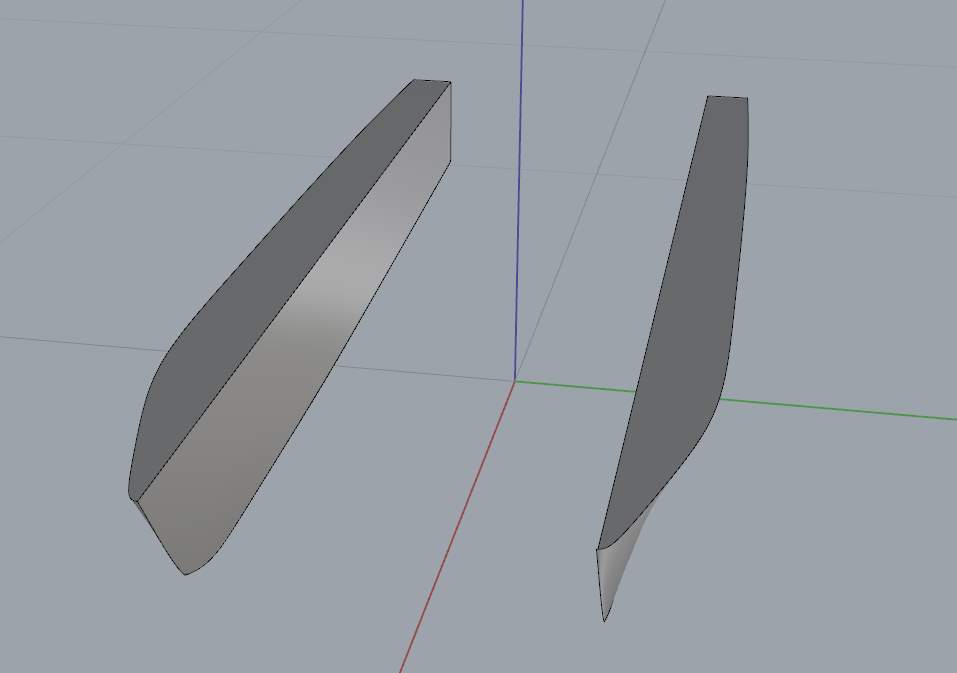
Figure 5.7 Three-dimensional rendered view of outboard asymmetrical catamaran hull
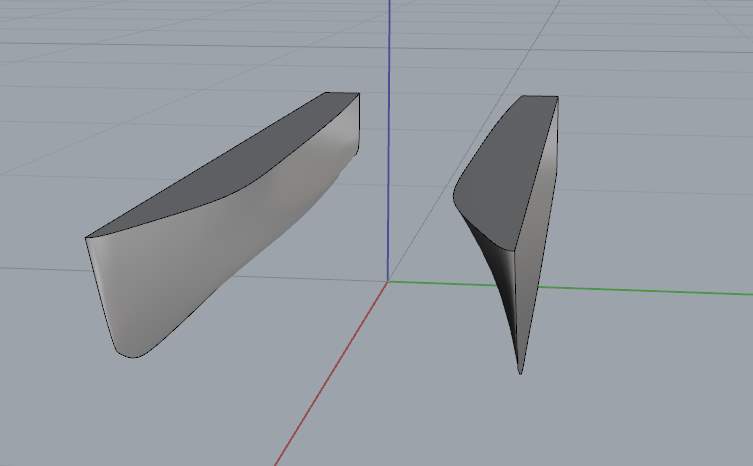
Figure 5.8 Three-dimensional rendered view of inboard asymmetrical catamaran hull
Table 5.2: Main parameters of 4b catamaran Models
| Catamaran | Inboard Catamaran | Outboard Catamaran | ||
| Parameter | Value | Value | Value | Units |
| Displacement | 349705 | 349705 | 349705 | Kg |
| Draft Amidships | 2.457 | 2.457 | 2.457 | m |
| Wetted Surface Area | 499.612 | 499.612 | 499.612 | m2 |
| CB | 0.439 | 0.432 | 0.432 | – |
| L/B | 5.239 | 5.239 | 5.239 | – |
| B/T | 2.471 | 2.471 | 2.471 | – |
| L/1/3 | 5.395 | 5.395 | 5.395 | – |
Based on S-NPL systematic series, the models were generated by using MAXSURF modular, a surface modeling software, which is a standard modelling software. The hulls were transformed into closed poly surface, a solid body with the help of Rhinoceros 5, a CAD software before performing the motion analysis using MAXSURF motions.
Chapter 6
Added resistance
The capability to sustain speed in a seaway is one of the primary objectives in the design of marine vehicles. Traditionally the power required to attend a certain speed in a seaway have been determined from the Stillwater performance of the vessel after making an allowance of 15 – 30% for wind and waves. However, in progress made in seakeeping in both analytical method and experimental techniques makes it possible to determine added resistance in a seaway with sufficient accuracy for design purpose. The added seaway resistance is often represented by either an additional of power to sustain the speed or speed loss to maintain the same amount of power as is used in calm water, Bhattacharyya (1978).
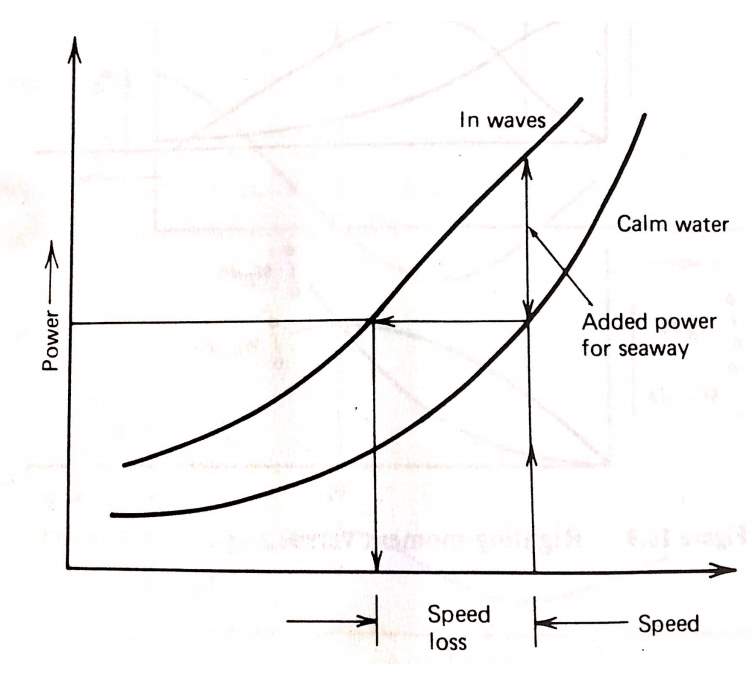
Figure 6.1- Speed loss or added power in a seaway [Bhattacharyya (1978)]
Loss of speed of a vessel in a seaway is not always due to the added resistance in waves; the speed is often voluntarily reduced in order to decrease the violent heaving and pitching motions of the vessel. The various factors responsible for loss of speed in a seaway are as follows, Bhattacharyya (1978).
- Added Resistance due to wind and on the vehicles, hull and superstructure.
- Increase in resistance due to motions- Heaving and pitching motions have greater influence than rolling.
- Added resistance due to wave reflection on the hull.
Added resistance in a seaway can be predicted either by model experiment of numerical analytical methods. MAXSURFuses, Salvesen’s formula for added resistance calculation, Salvesen (1978)
RAW=ik2 x3 F3̂+x5 F5̂ +R7
(6.1)
Where,
F3̂= ζ∫L.e-ikζ e-kzc ξ – ω0 ωeA33 ξ-iB33ξ dξ
(6.2)
F5̂= ζ∫L.e-ikζ e-kzc ξ – ω0 ξ+iUωe ωeA33 ξ-iB33ξ dξ
(6.3)
And,
R7= ξ2kω022ωe ∫L.e-2kz B33∫L.e-ikζ dξ
(6.4)
Where,
x3
And
x5are complex heave and pitch amplitudes containing both phase and amplitude information.
F3̂Is the complex conjugate of the Froude-Krylov part of the exciting force and moment and
F5 ̂is the same as the diffraction part of the exciting force. Furthermore, k is the wave number, d is the sectional draft.
Chapter 7
MAXSURF Validation
Experimental results are presented for a standard series of catamaran forms tested at the University of Southampton (Molland et al., 1994, Wellicome et al., 1995). The results from MAXSURF Motions were compared with those from towing tank measurements for the same Length: Displacement ratios, with demi hull separation of 0.2 for three different speeds i.e. Fn = 0.2, 0.53 and 0.8. The hull form tested (4b) was based on the NPL round bilge series (Bailey 1976); the monohull was transformed into catamaran using MAXSURF modeler.
The MAXSURF Motions analysis was carried out using 41 equally spaced sections to define the hull and 3 parameter Lewis mappings were used to compute the section hydrodynamic properties. In all cases the basic inviscid Salvesen et al., (1970) Strip Theory formulation was used with no additional damping terms; for the high Froude numbers. Below is the hydrostatics of the hull and Seakeeping spectra used for comparison.
Table 7.1: Main particulars of 4b catamaran with s/L=0.2 [Wellicome et al., (1995)]
| Parameter | Value | Units |
| Displacement | 349781 | Kg |
| Draft Amidships | 2.456 | m |
| Wetted Surface Area | 427.426 | m2 |
| CB | 0.436 | – |
| L/B | 4.4 | – |
| B/T | 3.5 | – |
| L/
∇1/3 |
5.4 | – |
Table 7.2: Seakeeping spectra [Wellicome et al., (1995)]
| Sea spectra | Wave height (m) | Modal period (s) | Average period (s) |
| ITTC (2 Param. Pierson MoskowitzBretschneider) | 6 | 6.470 | 4.999 |
The computed RAOs (magnitude and phase) were compared with those from the tank tests. In all cases, heave was non-dimensionalised against wave height and pitch against wave slope.
The motions of the catamaran where been predicted by computing the motions of a single demi hull in isolation. For all but the lowest speeds the interaction between the demi hulls was small, particularly for the wider spacing of, Separation: Length ratio, s/L = 0.4.
MAXSURF Motions predictions showed a good correlation with the experiment results for the two catamaran configurations.
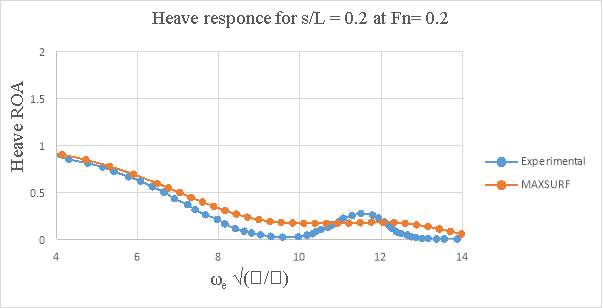
Figure 7.1- Experimental v/s MAXSURF heave response of 4b conventional catamarans
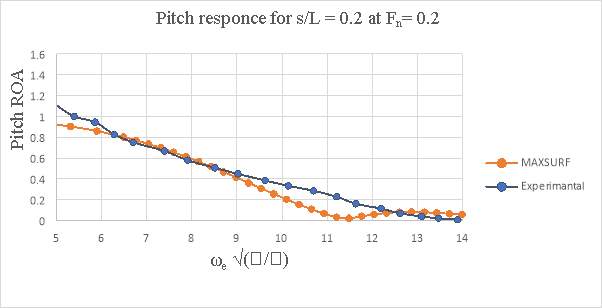
Figure 7.2- Experimental v/s MAXSURF pitch response of 4b conventional catamarans
Chapter 8
Results and Discussion
Heave and Pitch response comparison
Although a detailed analysis of transfer functions can provide an excellent insight in to effects of hull spacing and other design parameters, the actual responses of a vessels in appropriate sea states should be used to determine the best design. The RMS (root mean square) motions based on the results for 4b hull were calculated using ITTC two parameter spectrum. The spectra cover a range of wave frequencies but significant wave height was fixed at 1.25 meters and an average time period of 7.7 seconds to aid comparison.
It should be noted that the RMS responses are directly proportional to wave height, hence the responses for higher sea state may easily be calculated. However, it should be noted that in general there is a reasonable correlation relationship between significant wave height and characteristics period which co-dependent on the sea of interest and the direction of wave system. The below are the RMS of all the three hull forms at s/L ratio of 0.2 and 0.4.
Table 8.1: Conventional Catamaran s/L 0.2 Heave RMS response
| s/L | Fn | RMS in m |
| 0.2 | 0.2 | 0.28 |
| 0.2 | 0.5 | 0.281 |
| 0.2 | 0.8 | 0.282 |
Table 8.2: Inboard Catamaran s/L 0.2 Heave RMS response
| s/L | Fn | RMS in m |
| 0.2 | 0.2 | 0.279 |
| 0.2 | 0.5 | 0.28 |
| 0.2 | 0.8 | 0.282 |
Table 8.3: Outboard Catamaran s/L 0.2 Heave RMS response
| s/L | Fn | RMS in m |
| 0.2 | 0.2 | 0.288 |
| 0.2 | 0.5 | 0.288 |
| 0.2 | 0.8 | 0.289 |
Table 8.4: Conventional Catamaran s/L 0.2 Pitch RMS response
| s/L | Fn | RMS in rad |
| 0.2 | 0.1 | 0.02125 |
| 0.2 | 0.5 | 0.02174 |
| 0.2 | 0.8 | 0.02212 |
Table 8.5: Inboard Catamaran s/L 0.2 Pitch RMS response
| s/L | Fn | RMS in rad |
| 0.2 | 0.2 | 0.02123 |
| 0.2 | 0.5 | 0.0216 |
| 0.2 | 0.8 | 0.02198 |
Table 8.6: Outboard Catamaran s/L 0.2 Pitch RMS response
| s/L | Fn | RMS in rad |
| 0.2 | 0.2 | 0.02321 |
| 0.2 | 0.5 | 0.02349 |
| 0.2 | 0.8 | 0.02378 |
Table 8.7: Conventional Catamaran s/L 0.4 Heave RMS response
| s/L | Fn | RMS in m |
| 0.4 | 0.2 | 0.28 |
| 0.4 | 0.5 | 0.281 |
| 0.4 | 0.8 | 0.282 |
Table 8.8: Inboard Catamaran s/L 0.4 Heave RMS response
| s/L | Fn | RMS in m |
| 0.4 | 0.2 | 0.28 |
| 0.4 | 0.5 | 0.281 |
| 0.4 | 0.8 | 0.282 |
Table 8.9: Outboard Catamaran s/L 0.4 Heave RMS response
| s/L | Fn | RMS in m |
| 0.4 | 0.2 | 0.288 |
| 0.4 | 0.5 | 0.288 |
| 0.4 | 0.8 | 0.289 |
Table 8.10: Conventional Catamaran s/L 0.4 Pitch RMS response
| s/L | Fn | RMS in rad |
| 0.2 | 0.2 | 0.02137 |
| 0.2 | 0.5 | 0.02174 |
| 0.2 | 0.8 | 0.02212 |
Table 8.11: Inboard Catamaran s/L 0.4 Pitch RMS response
| s/L | Fn | RMS in rad |
| 0.4 | 0.2 | 0.02116 |
| 0.4 | 0.5 | 0.02153 |
| 0.4 | 0.8 | 0.02191 |
Table 8.12: Outboard Catamaran s/L 0.4 Pitch RMS response
| s/L | Fn | RMS in rad |
| 0.4 | 0.2 | 0.02321 |
| 0.4 | 0.5 | 0.02349 |
| 0.4 | 0.8 | 0.02377 |
In general, the motions of the conventional catamaran and inboard catamaran hullforms were found to be similar. But, for outboard catamaran increase in heave was observed with increase in forward speed for larger demi hull spacing, but the pitch response was lower when compared to conventional catamaran and inboard catamaran hull. The response appeared to be dependent on the optimum spacing and the speed. At s/L=0.2 the outboard catamaran at Fn =0.2 gave the lowest heave response. At s/L=0.4 the catamaran and the inboard catamaran gave the lowest heave response at Fn= 0.2. In the case of pitch response, it was observed that inboard catamaran gives the lowest response at Fn =0.1. At both spacing (i.e. s/L=0.2 and at s/L=0.4) Below are the graphs representing heave and pitch ROA response comparison for asymmetrical catamarans and conventional catamaran.
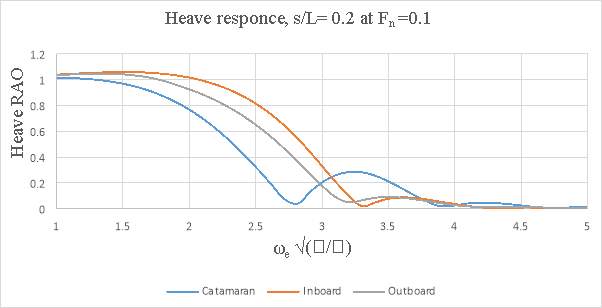
Figure 8.1 – Heave response s/L= 0.2 and Fn= 0.1
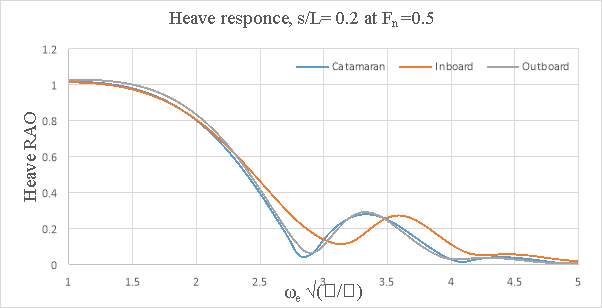
Figure 8.2 – Heave response, s/L= 0.2 and Fn=0.5
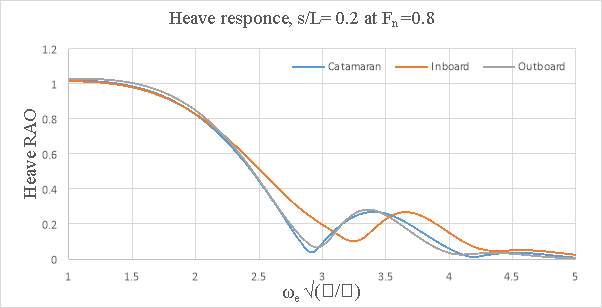
Figure 8.3- Heave response s/L= 0.2 and Fn = 0.8
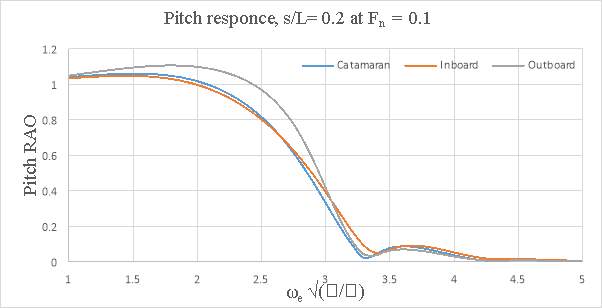
Figure 8.4 – Pitch response s/L= 0.2 and Fn = 0.1
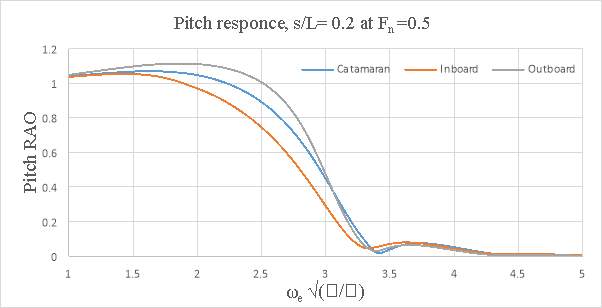
Figure 8.5 – Pitch response s/L= 0.2 and Fn = 0.5
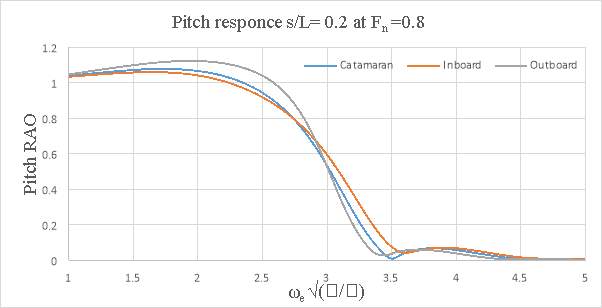
Figure 8.6 – Pitch response s/L= 0.2 and Fn= 0.8
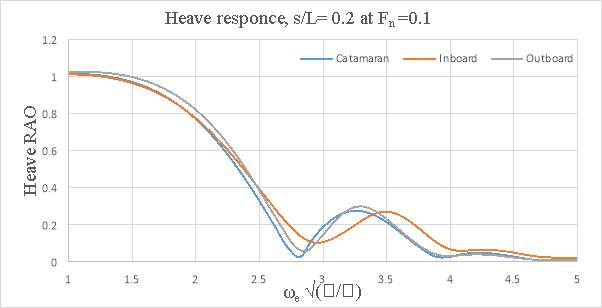
Figure 8.7 – Heave response s/L= 0.4 and Fn =0.1
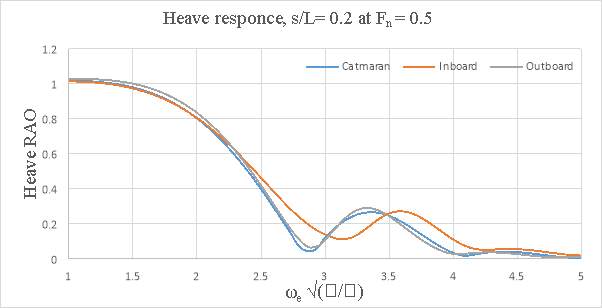
Figure 8.8 – Heave response s/L= 0.4 and Fn =0.5
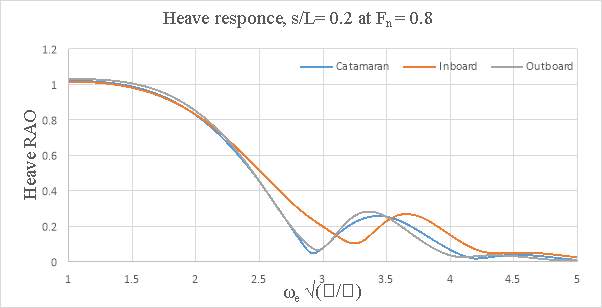
Figure 8.9 – Heave response s/L= 0.4 and Fn =0.8
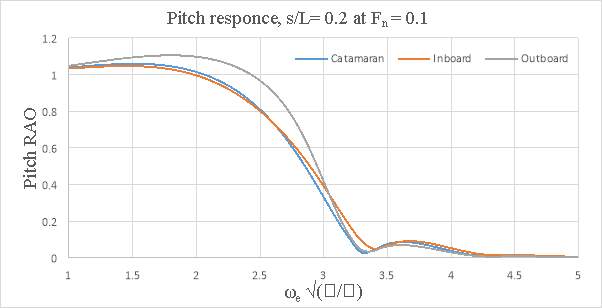
Figure 8.10 – Pitch response s/L= 0.4 and Fn =0.1
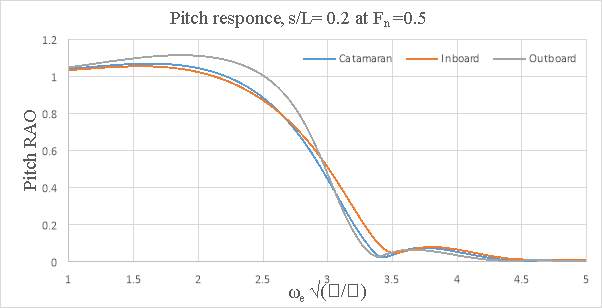
Figure 8.11 – Pitch response s/L= 0.4 and Fn = 0.5
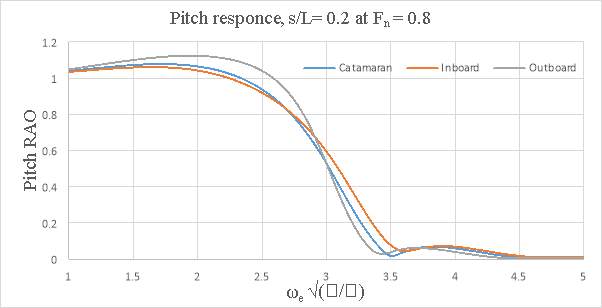
Figure 8.12 – Pitch response, s/L= 0.4 at Fn = 0.8
Added resistance results
Added resistance for three models at various speeds were tested. The data were plotted to a base of non- dimensionalised encounter frequency. The added resistance was non-dimensionalised too. The added resistance showed a distinct peak for all the conditions tested. Added resistance of the conventional catamarans was found to be more than twice the asymmetrical catamarans, especially at higher Froude number.
The added resistance was, generally, found to increase with Froude number. The change was greater between Fn =0.2 to 0.5 and much less between Fn = 0.5 to 0.8. Added resistance of conventional catamarans was found to be more than twice the asymmetrical catamarans, especially at higher Froude number. It was also discovered that closer spaced catamarans (s/L=0.2) has less added resistance than the wider catamarans (s/L=0.4). This may be due to pitch transfer function for the s/L=0.2 catamarans being less than for than s/L=0.4 catamarans over a substantial part of the frequency range.
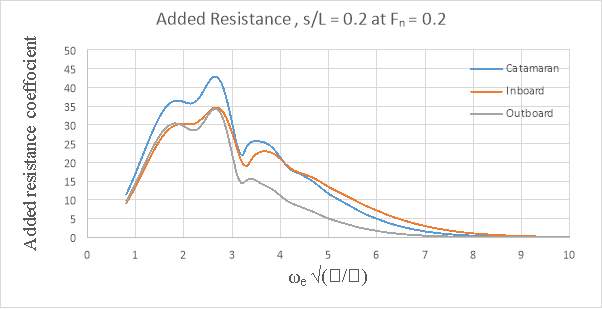
Figure 8.13- Added Resistance, s/L = 0.2 at Fn = 0.2
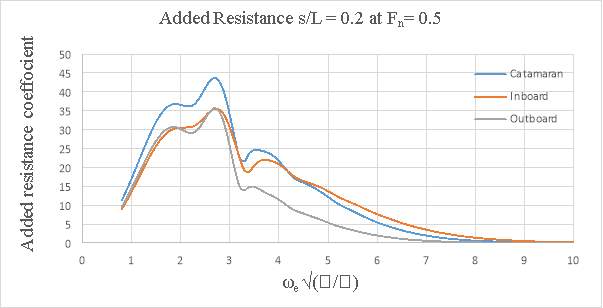
Figure 8.14- Added Resistance, s/L = 0.2 at Fn= 0.5
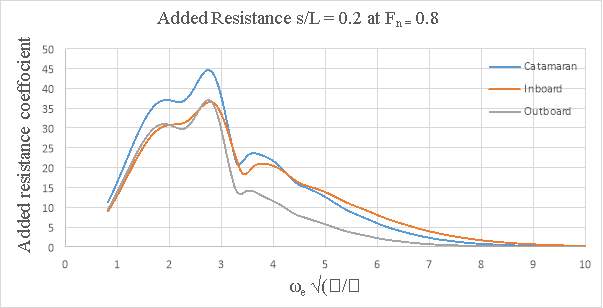
Figure 9.15- Added Resistance, s/L = 0.2 at Fn = 0.8
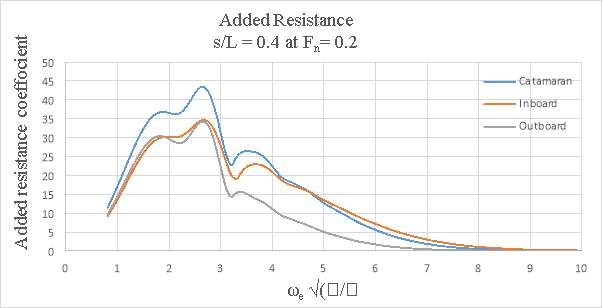
Figure 9.16- Added Resistance, s/L = 0.4 at Fn = 0.2
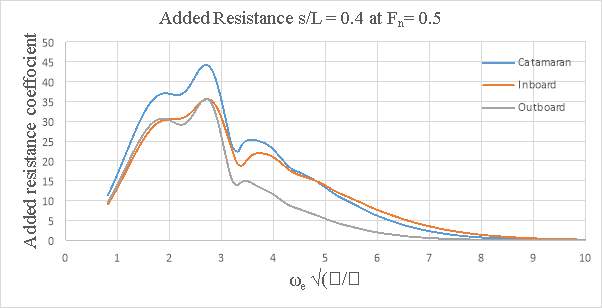
Figure 9.17- Added Resistance, s/L = 0.4 at Fn= 0.5
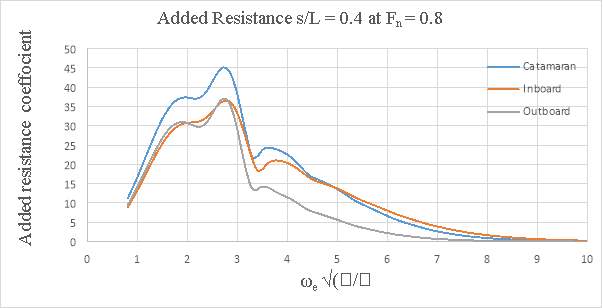
Figure 9.18- Added Resistance, s/L = 0.4 at Fn = 0.8
Chapter 9
Conclusion
The main goal of this research is to predict any favorable reduction in the motion characteristics of newly developed Asymmetrical catamaran hullforms when compared to conventional catamarans.
The model 4b based on S-NPL systematic series hull-forms was chosen the motion analysis. MAXSURF has been used to generate the required Asymmetrical catamaran hullforms and Rhinoceros has been used to convert the required curved surfaces (NURBS) into solid body.
The objective of this thesis can be fulfilled with the existing Strip theory based tool, MAXSURF motions. But, the results obtained cannot be relied upon. In order to have complete confidence on the MAXSURF motions results, it is necessary to validate the software. For this purpose, the MAXSURF motions was used to predict the motions of conventional and results were compared with experimental data that has already been established for the 4b of the S-NPL series. MAXSURF motions were not as accurate as the experimental results but the curve shows similar trend as the experimental data, thus providing encouragement that MAXSURF motions can be used for motion prediction.
In general, the motions of the conventional catamaran and inboard catamaran were similar. For outboard catamaran, however, increase in heave response was noticed with increase of speed, but the pitch response was lower when compared to the conventional catamaran and inboard catamaran. The response appears to be dependent on the demihull spacing and the speed. At s/L=0.2 the outboard catamaran at Fn = 0.2 gave the lowest heave response. At s/L=0.4 the conventional catamaran and the inboard catamaran gave the lowest heave response at Fn = 0.2. The added resistance was, generally, found to increase with Froude number. The change was greater between Fn =0.2 to 0.5 and much less between Fn = 0.5 to 0.8. Added resistance of conventional catamarans was found to be more than twice the asymmetrical catamarans, especially at higher Froude number. It was also discovered that closer spaced catamarans (s/L=0.2) has less added resistance than the wider catamarans (s/L=0.4). This may be due to pitch transfer function for the s/L=0.2 catamarans being less than for than s/L=0.4 catamarans over a substantial part of the frequency range.
In conclusion, the MAXSURF results obtained from this research shows that the characteristics of Heave and pitch motions exhibited by asymmetrical catamarans are almost similar when compared to experimental results of the conventional catamarans at various Froude numbers and thus does not make any significant difference in performance at high-speeds. Although Added resistance of asymmetrical catamarans were almost half when compared with conventional catamarans especially at higher Froude number. It was also discovered that closer spaced catamarans has less added resistance than the wider catamarans. Also, MAXSURF reveal a significant consistency with the validation process which involved the experimental data. Therefore, the process of this study provides the advantages of economy of time and cost consumption in the relevant fields.
Future Work
The research work carried out in this thesis is limited to the investigation of only 4b models of the NPL series. Investigation can be further expanded to all the models of the NPL series. Analysis can also be done on other systematic series of high speed hull forms such as AMECRC series, Series 64. In this thesis, only the motions due to the head seas has been considered. Investigation can also be extended to quartering seas and following seas. MAXSURF was used for predicting the motions. These results can also be validated by conducting towing tank experiments or using CFD tools. Furthermore, the present study investigated only two separation ratios s/L=0.2 and s/L=0.4, One can perform analysis by at different separation ratio or different configurations such as staggered positions of the demi-hulls.
References
Bailey, D., (1976), “The NPL high-speed round bilge displacement hull series.” Royal Institution of Naval Architects, Maritime Technology Monograph No. 4.
Beck R. F., Reed A. M., (2000), “Modern seakeeping computations for ships” Proceedings. For 23rd Naval Hydrodynamics Conference 1–43 Val-de-Reuil France National Academy of Sciences.
Bentley (2012) “MAXSURF Motions user’s manual.” Bentley Systems Inc.
Bhattacharyya, R., (1978), “Dynamics of marine vehicles.” John Wiley and Sons.
Centeno, R., Fonsec, N., and Guedes Soares, C., (2000), “Prediction of catamarans accounting for viscous effects.” International Shipbuilding Progress, 47, 2000, pp.303-323
Clement, E.P., Blount, D.L., (1963), “Resistance Tests of a Systematic Series of Planing Hull Forms.” Transactions SNAME, Vol. 71, pp. 491-579.
De Jong, P., (2011), “Seakeeping behavior of high speed ships.” Ph.D. dissertation, Delft University of Technology.
Doctors, L.J., (2000), ‘The influence of hull configuration on the motions of a catamaran.”, In, International maritime association of Mediterranean IX Congress, pp. 13 – 24.
Faltinsen, O. M. & Timokha, A. N. (2009), ‘Sloshing’. Cambridge University Press.
Fang, C.C., (1996), “An investigation of motions of catamarans in regular waves.”, PhD thesis, University of Glasgow.
Fridsma, G., (1969), “A systematic study of the rough-water performance of planning boats.” Technical report 1275, Davidson Laboratory, Stevens Institute of Technology.
Froude, W., (1861), “On the Rolling of Ships,” Transactions, Institution of Naval Architects, Vol. 2, pp. 180-229.
Hadler, J.B., Lee, C.M., Birmingham, J.T., and Jones, H.D., (1974), “Ocean Catamaran Seakeeping Design, based on the Experiences of USNS Hayes.”, Transactions SNAME, Vol. 82, pp. 126-161.
Holloway, D. S. (1998), “A High Froude Number Time Domain Strip Theory Applied to the Seakeeping of Semi-SWATHs.” PhD thesis, University of Tasmania.75
Journee J.M.J., (1992), “Quick Strip Theory Calculations in Ship Design.”, PRADS’92, Conference on Practical design of Ships and Mobile Structures, vol. I. pp 5-12.
Krylov, A., (1896), “A New Theory of the Pitching Motion of Ships on Waves and the Stresses Produced by this Motion.” Transactions, Institute of Naval Architects, vol. 37, pp. 326-359.
Lloyd, A.R.J.M., (1998), “Ship Behavior in Rough Weather.”, Ashford press.
Molland, A. F., Wellicome, J. F., and Couser, P. R,. (1994),” Resistance experiments on a systematic series of high speed displacement catamaran forms: Variation of length-displacement ratio and breadth-draft ratio.” UK: University of Southampton. Ship Science Report No.71
Sahoo, P. K., Doctors, L. J., (2004), “Theoretical and Experimental Study of Motion Characteristics of High-Speed Catamaran Hull Forms.”, Practical design of ships and other floating structures Vol.9 No.2, pp.665-671.
Salvesen, N., Tuck, E., and Faltinsen, O., (1970).” Ship Motions and Sea Loads.” Transactions of SNAME: 1970, New York, 78(8):250–287.
Savitsky, D., (1964), “Hydrodynamic design of planing hulls.” Marine Technology, Vol. 1, No. 1, pp. 71-95.
Savitsky, D., (1968), “On the seakeeping of planing Hulls” Marine Technology, Vol. 5, No. 2, pp. 164-174.
Sen, D., Negi, A., (2014), “Wave-induced loads on a catamaran hull with forward speed.” Conference proceedings, International Conference on Safety & Reliability of Ships, Offshore & Subsea Structures; 18-20 August 2014; Glasgow, UK.
Sottorf, W., (1934), “Experiments with planing surfaces.” Technical report, National Advisory Committee for Aeronautics.76
Subramanian, V. A., Gururajan, N., (2004), “parametric studies on motions of high speed planning catamarans.”, Ship Technology research, Vol. 51, No.1, pp 3-8
Wellicome, J.F., Temarel, P., Molland, A.F., Couser, P.R., (1995), “Experimental measurements of the seakeeping characteristics of fast displacement catamarans in long crusted head-seas.” Technical report, Ship Science Report 89, University of Southampton, UK.
Cite This Work
To export a reference to this article please select a referencing stye below:
Related Services
View all


Related Content
All TagsContent relating to: "Engineering"
Engineering is the application of scientific principles and mathematics to designing and building of structures, such as bridges or buildings, roads, machines etc. and includes a range of specialised fields.
Related Articles

DMCA / Removal Request
If you are the original writer of this dissertation and no longer wish to have your work published on the UKDiss.com website then please: