A Global Deal for Aviation – Driving Climate or Technology Change?
Info: 18096 words (72 pages) Dissertation
Published: 11th Dec 2019
Tagged: TechnologyAviationClimate Change
Contents
List of Abbreviations (Will update as project progresses)
ABSTRACT: I will write one when the final report is done
1.1 Aviation’s Role in the Global Economy
1.2 Impact of Aviation on Climate Change
1.3 Factors driving ICAO plan to reduce emissions
4.2 Sustainable Alternative Fuels
4.3 Aircraft Technology & Standards
4.3.2 Emission Control Policies
4.4 Market Based Measures (MBM)
4.4.1 Outcome of ICAO Meeting for MBM
4.4.5 Where can ICAO acquire offsets from?
5 Aviation emissions against 2°C scenario
5.1 Aviation 2°C target scenarios
5.2 Comparing ICAO Plan of Action to emission scenarios
6 What can be done to help avoid missing the RCP Scenarios?
7 Future Work & Dissertation Improvements
List of Abbreviations (Will update as project progresses)
| Acronym | Full – Form |
| GDP | Gross Domestic Product |
| IPCC | Intergovernmental Panel on Climate Change |
| ICAO | International Civil Aviation Organisation |
| GHG | Greenhouse Gases |
| COP | Conference of the Parties |
| UNFCCC | United Nations Framework Convention on Climate Change |
| CAEP | Committee on Aviation Environmental Protection |
| EU ETS | European Union – Emissions Trading Scheme |
| GANP | Global Air Navigation Plan |
| ATM | Air Traffic Management |
| ICCT | International Council on Clean Transportation |
| MBM | Market Based Measure |
| RPM / K | Revenue Passenger Miles / Kilometres |
| RTK | Revenue-Tonne per Kilometre |
| SARPs | Standards and Recommended Practices |
| IEA | International Energy Agency |
| LDCs | Least Developed Countries |
| SIDS | Small Island Developing States |
| LLDCs | Landlocked Developing Countries |
List of Figures
Fig 1: Economic impact of Aviation (Air Transport Action Group, 2016).
Fig 4: Potential causes for flight inefficiencies (Marais et al., 2013).
Fig 6: Carbon neutrality of Biofuels (Beginner’s guide to aviation biofuels, 2011).
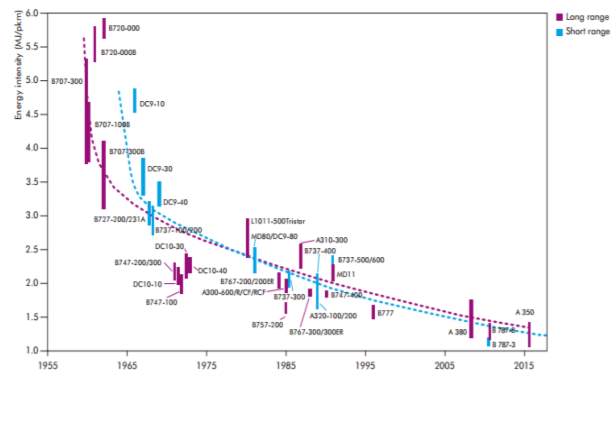
Fig 8: Trends in Aircraft Fuel Efficiency ((Transport, energy and CO2, 2009), (Lee et al., 2001)).
Fig 12: Amount of CO2 to be offset by MBM. Source CAEP analysis (ICAO, 2016).
Fig 15: ICAO reference curve for analysis. Original image: (Bows-Larkin et al., 2016).
Fig 16: Operational measure emission reductions. Original image: (Bows-Larkin et al., 2016).
Fig 17: Alternative fuel measure emission reductions. Original image: (Bows-Larkin et al., 2016).
Fig 18: Technology measure emission reductions. Original image: (Bows-Larkin et al., 2016).
Fig 19: MBM scheme emission Mitigation. Original image: (Bows-Larkin et al., 2016).
List of Tables
Table 1: Emission reduction scenarios for Operational Improvement.
Table 2: Emission reduction scenarios for Alternative Fuels.
Table 3: Emission reduction scenarios for Technology Improvement.
Table 4: Shows the reduction in CO2 emission after Operational Measures are implemented.
Table 6: Shows the reduction in annual growth rate after Technological improvements are implemented
Table 9: Amount of Carbon that needs to be offset by MBM scheme (refer to Fig 12), (ICAO, 2016)
Table 10: % of CO2 emissions offset by CORSIA.
Table 11: Shows the reductions in CO2 emission reduction after just MBM scheme is implemented.
1 Introduction
1.1 Aviation’s Role in the Global Economy
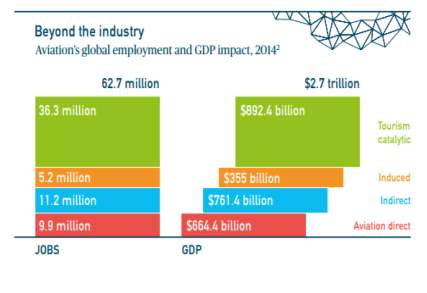 Aviation plays a crucial role in global social and economic development by facilitating international trade, tourism and connecting people across continents. The industry has a significant impact on global commerce contributing $2.7 trillion (3.5%) to global GDP (Gross Domestic Product) and is one of the biggest employers in the world with nearly 63 million jobs directly, indirectly & tourism-based being supported by the sector (ATAG, 2016). Although, the accuracy of this data may vary across multiple sources, the scope of aviation’s contribution to the global economy cannot be ignored.
Over the past few decades globalisation and connectivity has brought about significant growth for the aviation sector. According to IATA (International Air Transport Association) the sector supported 3.8 billion air travellers in 2016 and this demographic is expected to increase to 7 billion by 2034 (Iata.org, 2015). Even though this is an industry driven evaluation, there is no denying the exponential growth of the Aviation Sector and as the sector grows so do the GHG (Greenhouse Gas) emissions generated. The advantages of aviation for global economy are undeniable but the impact it has on climate change is a cause for concern.
1.2 Impact of Aviation on Climate Change
The impact of global warming has drawn attention to the transport sector and the role of aviation can no longer be ignored. Aviation accounts for 2 to 2.5% of global GHG emissions while International aviation accounts for 65% of total aviation emissions (Anderson, K, 2006).
There has been an estimated 98% increase in the emission levels from aviation between 1990 and 2006 which is significantly greater than any other mode of transport (Anderson, K, 2006).
According to the 1944 Chicago Convention, ICAO (International Civil Aviation Organisation) is the UN body charged with coordinating and regulating international air travel.
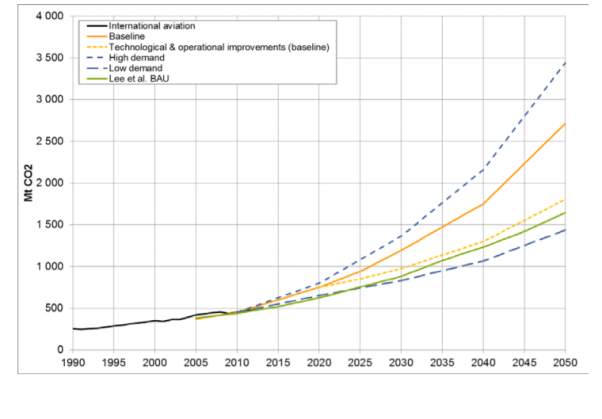
The ICAO forecasts that by 2036 the emissions from aviation is expected to increase between 155% to 300% compared to the 2006 levels (Icao.int, 2016). In the year 2015, the Aviation sector generated 781 million tonnes (Mt) of CO2 compared to the 36 billion tonnes generated globally (ATAG, 2016).
Apart from CO2 emissions, Aviation is also responsible for releasing other gases (NOx, CO etc.), heat and particulates which contribute to climate change (Penner, 1999).
The economic benefits (section 1.1) associated with aviation have in the past caused developed countries (USA, UK etc) to overlook the contribution to GHG emissions from the aviation sector and they have been reluctant to work together to implement any long-term mandatory policy – due to economic competition. While, the developing countries (India, China, Indonesia etc.) fall under the sustainable development banner of UNFCCC, which means they have little regulatory motivation to act (Grounded, 2010).
The omission of international aviation from any major CO2 mitigation policy has caused the emissions to rise unchecked.
1.3 Factors driving ICAO plan to reduce emissions
The ICAO has been influenced by the UNFCCC’s COP meetings as well the European Commission’s Trading Scheme (EU ETS) to develop a plan to reduce/mitigate emissions. The ICAO General assembly meeting of 2016 and the actions taken during the meeting have been a build-up of the following:
- Kyoto Protocol: The 1997 Kyoto Protocol recognised the impact from aviation and mandated the countries in Annex 1 to “pursue limitation or reduction of emissions of greenhouse gases through the ICAO” (UNFCCC, 1998).
The ICAO took the following actions:
A year prior to the Kyoto Protocol (i.e. 1996), ICAO requested of IPCC to generate a report on the atmospheric impact from aircraft engine emissions – IPCC special report
aviation and the global atmosphere. The findings of the report were published in 1999 – an important conclusion was that Aviation accounted for 2% of man-made CO2 emissions in 1992.
During the ICAO assembly in September 1998, the ICAO requested that the CAEP (Committee on Aviation Environmental Protection) study policy options to limit Aviation GHG (Greenhouse Gases) taking into account the 1999 IPCC report findings. In response, the CAEP established 3 research groups to study emissions from aircraft engines;
- Development of Technology & related Standards.
- Improvement in Operations to reduce Fuel Consumption.
- MBMs (Market Based Measures)
ICAO gave a statement to COP 4 (fourth session of UNFCCC Conference of the Parties) in November 1998 that stringent NOx standards have been agreed on. ICAO detailed CAEP’s research into a new emissions parameter which would include climb & cruise emissions, and CO2. ICAO also told COP 4 that MBMs and Emissions trading will be studied further (International Civil Aviation Organisation, 1998).
In the years since Kyoto, aviation has shown a major rate of increase in emissions relative to other transport sources with no further steps taken to deal with the issue (Anderson, K, 2006).
- COP 15 meeting in Copenhagen: During the 2009 COP 15 meeting in Copenhagen, it was established that temperature rise due to global warming must be limited to 20C between 2009 and year 2100 by reducing emissions, moving to better energy sources and achieving carbon neutrality (COP21, 2015). To meet this target (this goal has been referred to as the 20C target in this report) all major GHG emitting sectors must contribute to decarbonisation and even though aviation was not specifically mentioned, this target still acted as a motivator in shaping ICAO objectives for the future.
- EU ETS: The EU ETS (European Union Emissions Trading Scheme) is the EU’s answer to reducing/mitigating GHG emissions. This scheme covers 45% of EU’s GHG emissions. In simple terms, it is a ‘cap & trade’ system (Climate Action – European Commission, 2013).
As the name suggests, this scheme involves putting a “Cap” on the emissions of certain GHG’s. The idea is to limit the emissions from heavy energy-using sectors (example: power generation, manufacturing etc) which fall under this scheme and then with time lower the Cap which would result in a reduction in total emissions. The ‘Trade’ side of the scheme is meant to account for the lack of emission reducing technology. Not all industries have advanced enough to put a cap overnight on their emissions hence, the EU used the idea of Carbon-Trading. Under this scheme, every company is given or sold a fixed number of allowances and the company is required to report their emissions. For each 1 tonne of CO2 released they give up 1 allowance (EUA). If a company has spare allowances they are free to carry it on to the next year or sell the allowance to other companies with higher emissions (Climate Action – European Commission, 2013).
In 2012, the EU included the aviation sector into its carbon market, this action sparked concerns from non-EU countries citing EU’s overreach across international lines and the rise in costs for consumers if all flights were included, this could prove counterproductive for most economies. As a result of this back-lash the scheme was limited to only intra-EU flights (DEHSt, 2012). The scheme was equipped with a Stop the Clock feature until 2016 which allowed the ICAO to come up with a global solution during their 2016 meeting and failure to do so would enforce the EU ETS for all airlines operating in the EU. Due to this push from EU, ICAO met in 2013 to agree on developing a plan for implementing global MBM from 2020 to work towards carbon neutrality (European Commission, 2013).
- Paris Agreement: The Paris agreement is UNFCCC’s attempt to bring together all 197 member parties (currently 144 have signed on) to undertake an ambitious effort to combat climate change and cope with the effects.
The goal of this agreement is to respond aptly to the threat of climate change by ensuring that the rise in temperature is below 2° C and to pursue further efforts to limit temperature rise below 1.5° C (Bigpicture.unfccc.int, 2016).
Post the Paris agreement, the demand for reducing greenhouse gas emissions has grown. Although there is no specific mention of Aviation in the Paris Agreement, in order to achieve the goals, there needs to be an economy-wide reduction in emissions.
All major sectors including Transport which is one of the major culprits, have been put under a spotlight. Aviation is an important sub-section of transportation and plays a crucial role in the sustainable development of the world.
1.4 Current Position of ICAO
In the months of September/October of 2016, the International Civil Aviation Organisation members met to discuss provisions to control greenhouse gas emissions from the aviation industry. At this meeting, they presented the following four pillars of climate action – which the ICAO claims will help reduce/mitigate the emissions from Aviation (ICAO, 2016).
- Operational Improvement.
- Sustainable Alternative Fuels.
- Aircraft Technology & Standards
- Market-Based-Measures.
This report will study these measures and then aim to answer what level of impact they will have on emissions from aviation.
2 Aims & Objectives
2.1 Aim
The aim of this report is carry out a study of the measures (Operational, Alternative fuels, Technology & MBMs) which have been determined by ICAO as viable solutions for reducing GHG emissions from aviation. The research will look at the situation from the 2016 ICAO assembly meeting onwards and aim to calculate if these measures can reduce emissions enough that aviation can meet the 2°C temperature increase target (before pre-industrial levels) set during COP15.
2.2 Dissertation Objectives
The main objective of this report is to study the outcome of the 2016 ICAO General Assembly with regards to meeting the Paris Agreement goals.
The following steps will be taken to deliver on the research topic:
- Literature review of how emissions are reduced/mitigated by implementing the four ICAO measures (Operational, Alternative fuels, Technology & MBMs).
- Evaluate the ‘three’ measures outlined by ICAO to ‘reduce’ emissions – Operational Improvement, Sustainable Alternative Fuels & Technology- and quantify the amount of CO2 which can actually be reduced if these measures are successfully implemented (the report will consider a Likely and an Optimistic case situation for each measure being implemented currently or which could be implemented in the near future).
- The main focus will be around the Market Based Measures as ICAO has developed a new carbon mitigation scheme (section 4.4). The report will present a timeline of how this scheme will be implemented, who will it affect, how much CO2 needs to be mitigated (after the reduction from the three measures stated above) to ensure carbon neutral growth from 2020 & where could the Carbon emission units be bought from.
- The report will also evaluate each proposed measure and policy to see how likely is it for aviation to meet the 2°C temperature increase target.
- Conclude by providing alternate solutions which the ICAO could invest in to further reduce the emissions.
3 Methodology
Literature Review:
To begin with, a study of the UNFCCC meetings (i.e. COP) was done. This helped to establish the climate change goals of the UNFCCC, this was done to understand the factors which influenced ICAO to act. This research took into account the official minutes presented by UNFCCC on its website and publications.
This was followed by a literature review of the main measures (Operational, Alternative fuels, Technology & MBMs) that the ICAO 2016 environmental report cites as solutions to reduce emissions (ICAO, 2016). For each suggested measure, external academic literature was studied to understand how each measure works towards reducing aviation emissions.
Once the background knowledge on the working principle for each measure was established, then the potential ‘% reductions’ were identified for each measure. In order to do this, reduction scenarios from ICAO & research papers were considered and then divided into Likely & Optimistic cases.
The Likely scenario constitutes emissions reductions which are expected to occur based upon current trends where is little in way of motivation for stakeholders to act, there is a lack of technology and infrastructure.
The Optimistic scenario includes emissions reductions when there is rapid investment & development of the measures proposed by ICAO. Within this scenario there is an assumption that there will be uniform adoption of each measure across the aviation community, in other words it is a best-case scenario.
MBM Scheme Review:
The literature review is followed by an explanation of the ICAO’s new MBM scheme. This theory covers the plan to implement the MBM scheme – ICAO 2016 report taken as reference – and a critical evaluation of the limitation of the scheme. After that, the report identifies international programmes that sell carbon units in order to find areas where the airline operators could acquire it’s needed carbon allowances from – to do this literature on Emissions trading schemes (which use the same type of allowances) was studied.
2°C emission reduction scenarios:
The MBM review is followed by a comparison of aviation emissions reduction (due to ICAO measures) against reductions that are actually needed to have a reasonable chance keeping temperature increase (before pre-industrial levels) below 2°C.
This is done by using the ‘% reductions’ from the literature review to quantify what quantity of total CO2 emissions can be reduced by each measure for both the Likely & Optimistic scenario.
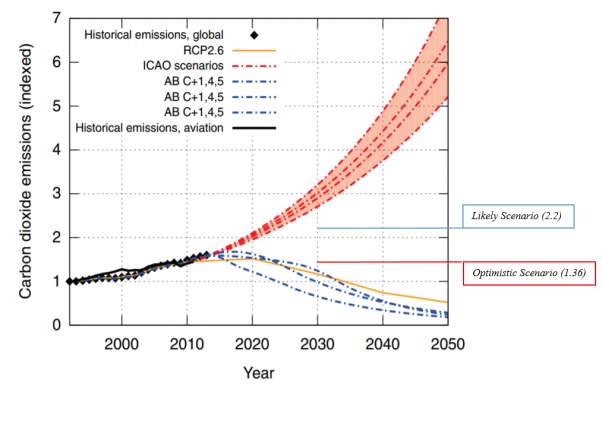
For the comparison against 2°C targets, a graph is taken from Anderson & Bows (2011) (section 5) which presents multiple emission reduction scenarios for aviation in order to have a reasonable chance at avoiding the 2°C temperature increase. On this graph for each calculated reduction (both likely & optimistic) a ‘line-marking’ is placed to show where the emissions will fall to if the measure is successfully implemented. Then the reductions are cumulated to show the new emission level after the ICAO plan of action is successfully implemented.
This comparison will be able to assess the feasibility of the solutions proposed by ICAO towards achieving the Copenhagen COP15 and Paris Agreement objectives.
4 ICAO’s Plan of Action
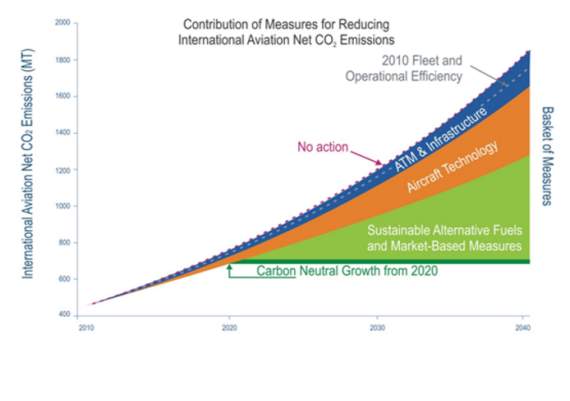
The A38-18 resolution of the ICAO 2013 assembly set forth a policy for the organisation to address the impact of international aviation on climate change (Icao.int, 2016). The CAEP in 1999 developed 3 research groups (Development of Technology & related Standards, Improvement in Operations to reduce Fuel Consumption, MBMs) (section 1.3). These main groups formed the basis for what the ICAO calls its ‘Basket of Mitigation Measures’. ICAO’s basket of measures is the organisation’s proposed solution to reduce CO2 emissions from International Aviation and eventually achieve a sustainable future for aviation. The basket of measures according to ICAO are ‘flexible’ and will allow member states to mix and match according to their circumstances (ICAO, 2016).
The following sub-sections discuss these measures and will aim to give you an understanding of what areas the ICAO plans to focus on.
4.1 Operational Improvement
In Aviation, the term ‘Operations’ is used to represent a range of activities from flying the aircraft, monitoring take-off & landing i.e. ATM (air traffic management), to conducting airport activities. Each process involved in a flight’s operation has room for improvement such that further optimization of these operations, reducing auxiliary power unit usage, increasing the efficiency of flight procedures, and reducing weight, could achieve further reductions in CO2 emission. Operational improvement is considered ideal in most situations because it does not necessarily require new equipment or technology to be implemented rather there can be improvements in the existing ways the aircraft is operated. These improvements can be applied in relatively short periods of time and can be incorporated into the Aviation growth plan of developing countries as well (Icao.int, 2016).
Operational Measures show real-time reduction in emissions i.e. for every 1 tonne of conventional jet fuel reduced, aviation saves 3.16 tonnes of CO2 (ICAO, 2016). Operational improvements are also important because the other ICAO measures are meant for future purposes (i.e. start in the year 2020 or after) while operational measures can be implemented across existing aircrafts during maintenance and overhaul stages and to the new aircrafts in production.
Future Reduction from Operational Measures: ATM
Research shows that upto 8% of total airline fuel may be wasted due to inefficiency in air travel routes (Sarkar, 2012). In order to cope with these inefficiencies and the future growth of the airline industry, the ICAO undertook the GANP (Global Air Navigation Plan) which is based around further developing & improving ATM (ICAO, 2016).
When flights operate using a 100% efficient ATM system it allows aircrafts to move from one location to another location via the fuel-optimum route. Inefficiencies occur when flights operate at less optimum routes of travel, the improvement of ATM by changing operation practices can help recover some of these inefficiencies however, due to real world constraints (such as, safety, weather, capacity etc.) this is not possible and we observe higher fuel burn than ideally expected (Reynolds, 2014).
One of the main ways in which environmental impact from aviation is reduced is through the improvement of ATM and keeping in line with the ICAO’s GANP, multiple programs across the globe have come into play such as, the SESAR (Single European Sky ATM Research) in Europe, the NextGen (Next Generation Air Transport System) in US etc.
The objective of these programmes is to develop technology and supporting strategy on how best to utilise the available airspace, these programmes also aim to reduce noise pollution, increase air space capacity & reduce delays ((EUROCONTROL/EU, 2012), (FAA, 2013)).
The Asia and South Pacific Initiative to Reduce Emissions (ASPIRE) is a programme which aims to quantify the extra fuel burned using inefficient ATM systems in the Pacific airspaces. Research conducted by ASPIRE found that if under the current ATM system most of the constraints are removed/mitigated while still ensuring safety, we can observe fuel burn reductions of 5–6% per flight.
This number is expected to increase with the addition of new technologies as most current ATM systems are manual. Current Air Traffic Control systems are based around manual controllers who have to use available data to plan routes within predefined sectors & these routes are longer due to constraints (military airspaces, weather etc) hence have many inefficiencies. This problem will be exasperated further due to growing demand which will lead to more congestion and delays repeating the cycle of excess fuel burn. However, with new technology more direct routes can be established which will be simulated by computers and will be adaptable to changing conditions hereby, reducing delays and fuel consumption ((Reynolds, 2014), (Dr. Schlumberger, 2012)). The IPCC found in their research that improvements to ATM could potentially result in fuel savings of upto 12% per commercial flight ((Penner et al., 1999), (IPCC, 1999)).
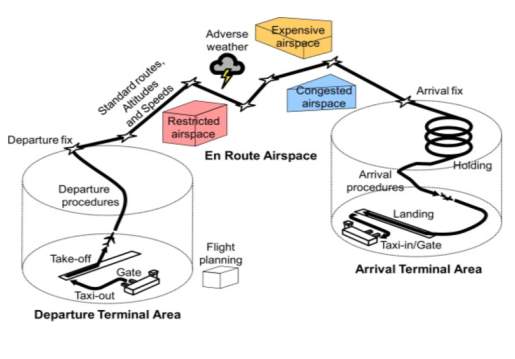
Figure 4 highlights the opportunities for improvement during a single flight and by utilising the available reductions some of the following improvements are being tested across multiple airports & airlines.
Airplane Flight Path Improvements:
Making improvements during ascend & descend segments of a flight can help save significant amount of emissions.
A Continuous Descend Operation (CDO) is where the flight slows down from cruise speed and instead of coming down in steps it makes its way in one smooth slope. At a Copenhagen airport, CDO implementation observed a reduction of 32,000 tonnes of CO2 a year. Research shows that if CDO is implemented across Europe we could see a reduction of 500,000 tonnes of CO2 a year. This operation if applied across all airports coupled with technology to aid the descend could help further emission reduction ((Sarkar, 2012), (Dr. Schlumberger, 2012)).
Another popular initiative being tested by airlines & airports is the Single Engine Taxi, this method involves only using 1 engine to taxi to & from the runway. Airlines have found that for a commercial aircraft one minute of single engine taxi can save upto 430,000 litres of fuel per year for an aircraft ((Dr. Schlumberger, 2012), (Emirates United Kingdom, n.d.)). As this system does not require new technology rather motivation from Airlines to act, it could be turned into a compulsory policy measure by the regulating parties.
A new method of efficiently utilising the airspace is the RVSM (Reduced Vertical Separation Minima), this effectively reduces the distances between flights in the vertical directions and allows mitigation of congestion & delay issues. Modern aircrafts with latest navigation systems have significantly higher manoeuvrability meaning this new measure does not jeopardise the safety while improving upto 2% of global fuel efficiency (Malwitz et al., 2009).
On Ground Reductions:
Airports also show scope of substantial fuel savings through the reduction of APU usage. The APU system is responsible for running the electrical systems of the airline when the engine is turned off (i.e. until it is given a clear path by the ATM to taxi). The consumption of fuel is further increased by delays which can be avoided by proper ATM. Studies show that by using a GPU (Ground Power Unit) upto 85% of APU usage can be reduced. An airport experiment showed that GPU installations at 50 gates resulted in 33,000 tonnes of CO2 emission reduction per year ((Kinsey et al., 2012), (Dr. Schlumberger, 2012)). It should be made compulsory for all airports to invest in GPU systems which saves energy losses from the APU.
Alternate Operational Measures:
Mutual collaboration of airlines & airports will also be important in the coming years in order to meet growing demand. Airlines have been able to work together in making use of larger aircrafts to accommodate more passengers (this is evident amongst international flights where the aircraft belongs to one airline while the passengers are from other multiple airlines). This ensures that flights don’t go empty. Another benefit of collaboration would be to invest in programmes together rather than work separately on your own, this will allow significant advance in operational procedures (Beginner’s Guide to Aviation Efficiency, 2010).
Another relatively easy to implement change would be to maximise payload for an aircraft. This can be done by increasing the occupancy of the flight & the belly load carrying capacity of the plane. This action will significantly reduce the need for separate freight-only flights. This change if coupled with reducing cabin deadweight can lead to significant cost & fuel savings for the airline company. However, the implementation of this change depends on the business model & regulatory motivation (Yu-Hern Chang, 2011).
Emission Reduction Scenarios from Operational Improvement:
The emission reduction scenarios have been developed by taking industry expectations as reference i.e. they are based on multiple estimations in the available literature.
Operational improvements are aimed at reducing the emissions from the aviation sector. However, there is a grey area when it comes to the exact amount which can be reduced, as Bows-Larkin (2014) points out that, as operational improvement reduces emissions, it opens a new window for further growth which will then cause a rebounding effect. Hence, in order for this measure to be effective the rate of emission reduction must be greater than the growth rate (Bows-Larkin, 2014). This means that most of the optimism which Aviation organisations have may be misplaced.
The possible reductions due to Operational improvement has been classified into 2 different categories based on future exponential growth of Aviation.
First is the Likely Scenario, in this scenario a 6% reduction in emissions is taken, with the bulk of the improvements from ATM. The assumption made is that majority of the procedures & technologies discussed in section 4.1 to improve Operations will not be successfully developed or adopted in time. This assumption reasonably accounts for future growth and possible challenges for implementing changes, this is also the reduction that ASPIRE observed with current ATM system.
The second is the Optimistic scenario, this is based around the expectations of various organisations working towards operational improvement such as NextGen, SESAR, NATS (National Air Traffic Services, UK) etc. and they believe that there is chance for upto 10% improvement due to operational measures. Hence, assuming that the goals of these organisations is met, for the Optimistic Scenario a 10% reduction is emission is taken.
| Scenario | % Emission reduction due to Operational Measures |
| Likely | 6% |
| Optimistic | 10% |
Table 1: Emission reduction scenarios for Operational Improvement.
Fig 4: Potential causes for flight inefficiencies (Marais et al., 2013).
Fig 5: Worldwide Commercial Jet Fuel Consumption & cost for 2011-2021 (U.S. Energy Information Administration (EIA). Fig 4: Potential causes for flight inefficiencies (Marais et al., 2013).
Fig 4: Potential causes for flight inefficiencies (Marais et al., 2013).
4.2 Sustainable Alternative Fuels
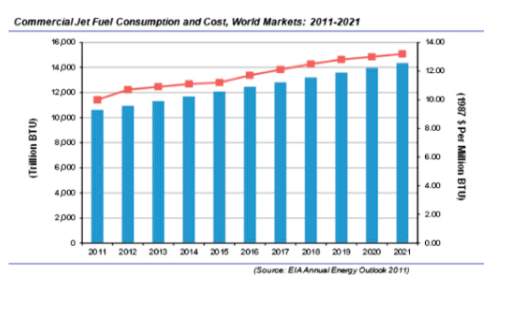 Over the past few decades there has been a rapid increase in fossil fuel usage while the supply is gradually depleting hence, the need for more fuel. On the other hand, the rising GHGs call for a reduction in overall emissions hence, the need for cleaner fuels. Oil demand for transportation is expected to rise at the rate of 1.3% p.a. till 2030 while the price for fuel is constantly increasing. In order to ensure that energy costs remain at bay, transport sectors like Automobile & Rail have already begun to move to renewable energy sources, while there has been little progress to the Aviation fuel market (Kandaramath Hari, Yaakob and Binitha, 2015).
If there has to be a timely (with the goal of avoiding a 2°C temperature increase) reduction in emissions, the role of Sustainable fuels is paramount. These alternative fuels are being developed to meet the short & mid-term requirements while technology advances enough to solve the aviation emission problem. To meet the fuel requirements of aviation there has been research into fuels that have a lower carbon footprint (compared to conventional jet fuel) without compromising in terms of performance, cost, safety & modifications (ICAO, 2016).
Properties of Alternative Fuels:
The traditional jet fuels (Jet-A & Jet A-1) which are used in modern day aircrafts are obtained from the kerosene fraction of crude oil. The fuel requirements for Aviation are extremely precise, it requires fuels that have a very high energy density hence the current liquid hydrocarbon is popular. The alternative fuel must have good cold flow properties, thermal stability and a low freezing point (Mohammad et al., 2013).
Aviation stakeholders expect these fuels to be ‘drop-in’ i.e. they can be used with the existing aircraft and technology. These drop-in fuels according to ICAO are “completely compatible, mixable and interchangeable with conventional jet fuel”. This would ensure there is no need for new infrastructure, safety and emission standards, and no extra expenses for manufacturers and airline operators (Knörzer and Szodruch, 2012). In the United States the Federal Aviation Administration (FAA) plans to incorporate 1 billion litres of these ‘drop-in’ fuels into commercial aviation by 2018. Other countries have also encouraged rigorous testing through airline companies (Brown N, 2012).
In aviation fuels importance is given to the energy content hence for this research only the hydrocarbon-based ‘drop in’ fuels are considered, these fuels can either be used on their own or mixed with conventional jet fuel. Other fuels such as liquid methane & liquid hydrogen etc. are beyond the scope of this research.
As opposed to conventional fuels (derived from crude oil), alternative fuels can be derived from coal, Biomass (woods, crops, animal fats etc), oil shale & tar sand. The main industrial routes for obtaining these alternative fuels are 1) synthetic process of nature gas (Synthetic Jet Fuels) and 2) hydrotreating process of lipids (Bio-Jet Fuels) ((Chiaramonti et al., 2014), (Zhang et al., 2016)).
Popular Alternative Fuels:
Synthetic fuels are obtained from feedstocks such as coal, natural gas and hydrocarbons. The production of these fuels involves the gasification of above mentioned feedstocks, in order to get synthesis gas (hydrogen + carbon monoxide). The synthesis gas is then passed through the Fisher-Tropsch (FT) process which produces liquid hydrocarbons and further upgrades lead to the production of a ‘drop-in’ jet fuel.
N.B. Above process is also used to convert Biomass-to-Liquid (BTL) which is a non-synthetic fuel (not fossil fuel derived).
The above discussed FT fuels have significant advantages over the conventional fuels used, they are cleaner, have better low temperature properties & high thermal stability. FT fuels emit 2.4% less carbon, 100% less sulphur and 50-90% less particulates than conventional jet fuel. FT fuels allow for high altitude operations & low temperature starting. However, even though FT fuels have lower carbon emissions, the total life-cycle carbon emissions (cumulative emissions from production to use) of synthetic FT fuels can be upto twice those of conventional jet fuels. This can be mitigated by the use of carbon capture and sequestration (CCS) technology during fuel production (Stratton et al., 2010). The issue with this change is the additional costs of production due to plant improvements and technology innovation which makes it a relatively less popular idea.
The other type of alternative fuel being used/developed are bio-jet fuels. These are fuels produced from biomass (wood, crops, trees, animal fats etc.) and the carbon generated from these fuels is the carbon which was absorbed by the plants during photosynthesis. This means that upon combustion, the carbon is returned to the environment hence ensuring carbon neutrality (Knörzer and Szodruch, 2012). Most Bio-jet fuels today use plant oils (like algae, camelina, jatropha) and animal fats (like beef tallow) as feedstock. This feed is hydroprocessed to produce aviation fuel, this is called Hydroprocessed Renewable Jet fuel (HRJ fuel) ((Zhang et al., 2016), (Lokesh et al., 2015)).

Due to the possibility of carbon neutrality, HRJ fuels are considered as one of the best alternates to conventional fuel. However, there are some noticeable issues with these Bio-Jet fuels, primarily, the low energy density & poor high-temperature thermal stability. It is due to these reasons why aviation has not been able to incorporate Bio-Jet fuel into aircrafts, there is still further need of technology development which can tailor the fuel to aviation ((Zhang et al., 2016), (Lokesh et al., 2015)).
Future Production Constraints:
The development of alternative fuels depends on their economic and environmental sustainability. First there is the economic sustainability, this includes the cost of fuels, the implementation of new technology and infrastructure, in order to be economically viable these costs must be competitive to the current fuel costs.
Then there is the environmental sustainability, this includes the GHG emissions associated with the extraction, production and usage of alternative fuels, these emissions must be significantly less than conventional fuel to encourage investment from stakeholders & to avoid serious damage to natural resources. As the demand for alternative fuels rises there may be implications on economies which depend on oil – there maybe rise in oil prices, loss of jobs, effects on other transport sectors (Zhang et al., 2016).
Synthetic FT fuels are very attractive alternative fuels in countries with high Coal (e.g. USA) and Gas (e.g. Russia) reserves. While non-synthetic FT fuels and bio-jet fuels are derived from biomass and there is concern regarding competition for farmland with food (Hill, 2007).
A growing demand for biofuels may eventually put a strain on the food industry, hence the focus needs to shift towards biofuels derived from non-food sources (Hill, 2007).
Emission Reduction from Alternative Fuels:
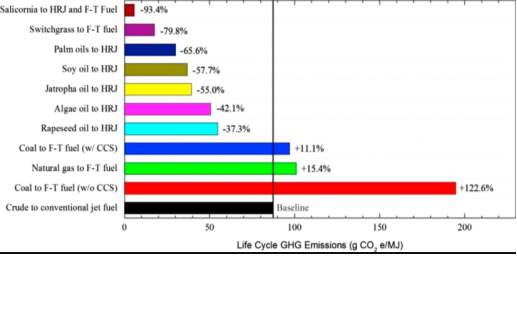
Research by Stratton et al. (2010) & Lokesh et al. (2015) has been able to establish the Life-cycle carbon emissions from the various hydrocarbon based alternative fuels relative to conventional jet fuel (Jet-A). Bio-jet fuels derived from camelina, micro-algae, and jatropha deliver 70%, 58%, and 64% of life cycle emissions savings, respectively while synthetic FT fuels have slightly higher (11%) emissions than conventional fuel when CCS is implemented. This highlights the opportunity alternative fuels offers towards avoiding the 2°C temperature increase ((Lokesh et al., 2015), (Stratton et al., 2010)).
Current Status of Sustainable Fuel Usage:
Realising the impact alternative fuels can have on the goal of achieving green aviation, governments and the international aviation community have begun investing in the research & development of sustainable fuels. The ICAO has for a long time supported the use of alternative fuels and in 2009 it launched a Global Framework on Aviation Alternative Fuels (GFAAF). This is an online database which details the progress in the field of alternative fuels to allow stakeholders to share information. The aim of this framework is to encourage a collaboration between airlines, fuel providers and governments, the airlines provide testing support, the fuel suppliers (e.g. ExxonMobil algae based fuel testing program) provide testing & infrastructure while government provides encouragement through funding & regulation ((Zhang et al., 2016), (ICAO, 2016)).
By 2012 more than 1500 flights were successfully using blends of alternative fuels. This number has grown to over 2500 flights at the present with major airlines such as KLM, United Airlines, Lufthansa coordinating with the ICAO to test various blends which can be implemented in the coming years. Currently, there is a limitation on these synthetic fuels as it has to blended with conventional jet fuels due to the absence of aromatics (they prevent leakage) in alternative fuels. In the future ICAO aims to incentivise the use of biofuels and support commercial-development (however, there is no detailed information on this at the moment) (ICAO, 2016).
Scenarios for Future Emission Reductions:
In order to establish the emission reduction scenarios for alternative fuels, there two factors to consider.
First, the Penetration of sustainable fuels into the global oil market i.e. how much of the total aviation fuel burn will be alternative fuel (i.e. derived from alternative sources). This depends on technology barriers/breakthroughs, limits of biofuel feedstock growth (this includes flora & fauna agriculture), limitation on infrastructure investment and the competitive market of biofuels over conventional fuel.
In order to establish how much penetration of alternative fuels will be observed in the future, the IEA’s Energy Technology Perspectives has been used as reference. The report establishes conservative and optimistic scenarios which will fit well with the objective of this report.
The IEA conservative scenario assumes a 3% penetration by 2030 and 15% penetration of aviation biofuels by 2050 i.e. by 2050 15% of fuel burnt will be derived from alternative sources. Similarly, the IEA optimistic scenario estimates 5% penetration by 2030 and 30% by 2050 (Energy technology perspectives 2008, 2008).
Second, is the Emission reduction from alternative fuels due to improvement in fuel efficiency. Even though the life-cycle carbon emissions (see Fig 7) show that reductions can be upto 90%, due to limitations (energy density, technology, aromatics etc. discussed above) it is assumed that a 50% reduction will be observed with the replacement of conventional jet fuel with alternative fuel. This assumption is in line with expectations of IATA, UK Committee of Climate Change (theccc.org, 2009). Also at present alternative fuels are blended with conventional fuels and not used by itself.
Hence to find total % of emissions reductions due to alternative fuels a product of the (% of Alternative fuels in the market) and (% improvement in fuel efficiency) needs to be taken (theccc.org, 2009).
| Scenario | % Penetration of Alternative Fuel (in 2050) | % Improvement in Fuel Efficiency | Total % of Emissions Reduction due to Alternative Fuels. |
| Likely | 15% | 50% | 7.5% |
| Optimistic | 30% | 50% | 15% |
Table 2: Emission reduction scenarios for Alternative Fuels.
Fig 4: Potential causes for flight inefficiencies (Marais et al., 2013).
Fig 5: Worldwide Commercial Jet Fuel Consumption & cost for 2011-2021 (U.S. Energy Information Administration (EIA). Fig 4: Potential causes for flight inefficiencies (Marais et al., 2013).
Fig 4: Potential causes for flight inefficiencies (Marais et al., 2013).
4.3 Aircraft Technology & Standards
A majority of GHG emitting sectors rely heavily on Science & Technology to be the antidote to their emission issues, a major reason is that the population of the world is growing at an exponential rate and with economic growth more people are getting access to previously expensive/unavailable resources like Airplanes & Cars which means that curbing demand is not always a viable option. The ICAO is no different in its dependency on Technological advancement to increase fuel efficiency. The third measure in ICAO’s Plan of Action is Aircraft Technology & Standards, this has two parts first the Technology Improvement and second the Standards (Policies) which put a ‘Cap’ on emissions hereby encouraging stakeholders to invest in Technology.
4.3.1 Technology Improvements
Less fuel consumed (higher efficiency) means fewer emissions generated, this is not a new concept and is one of the most basic ways of reducing emissions and it is the pretext under which Technology improvement is based upon. It is in the financial interest of both the manufacturers & airline companies to reduce fuel consumption which means that there is already a strong motivation to make aircrafts more efficient.
The aircrafts in use today have improved significantly when compared to the early commercial jets of 1960s. There has been a major reduction in engine efficiency (fuel burn per passenger km) while increasing number of passengers & payload capacity (Kharina and Rutherford, 2015).
The ICCT (International Council on Clean Transportation) reported that there has been drop in average fuel burn by approximately 45% which is a 1.3% yearly reduction for a commercial jet aircraft between 1960 & 2009 (Kharina and Rutherford, 2015). ICAO states that the aircrafts of today are 70 – 80% more fuel efficient per passenger kilometre when compared to the 1960s (this is a higher estimation than ICCT due to increase in passenger capacity) (ICAO, 2016).
Example Case: The most widely used aircraft is the Boeing 737 series. From 1967 when the first Boeing 737-100 took flight to the present Boeing 737-800, there has been an increase in number of passengers by 48%, payload increase by 67% and reduction in fuel burn of 23% (Beginner’s Guide to Aviation Efficiency, 2010).
There is no denying the fact that aircrafts today are more efficient, environment friendly and more operationally capable. A majority of this improvement can be allotted to step changes in technology. (Lee, 2000) states that between 1960 and 2000 the main efficiency improvement in jet aircraft was through improving engine fuel per unit thrust and this accounted for 69% of the changes while aerodynamics contributed a further 27%.
Possible Future Innovations (Evolutionary):
Evolutionary innovation refers to technological improvements which are expected to be developed gradually with time. Over the next few decades there are multiple Evolutionary technological innovations which if successfully developed & implemented will be able to reduce emissions significantly. Improvements to Aerodynamics, Propulsion (engine efficiency improvements), and light-weight structures will have a direct impact on the emissions.
Drag Savings:
Reducing drag (both Skin dependant & lift dependant) is the main agenda for any design team. An aerodynamic force is responsible for opposing the aircraft’s motion on all external parts. Reductions in drag are achieved by advances in materials, structures & aerodynamics design.
One promising way of reducing drag is through improving wing design. Increasing the wing span (using lighter materials to avoid an increase in weight) by adding a folding wing-tip mechanism which can be used during manoeuvring & gusty conditions. This folding wing-tip when designed like a winglet (folded upwards and pointing back) can significantly reduce vortex drag (smaller wake). Additions of these winglets on existing aircrafts shows a 3-5% reduction in fuel burn. This technology can be implemented during overhaul stages on majority of the new long-range airplanes like Boeing 737-800 & Airbus -380 ((Green, 2009), (Air Travel – Greener by Design, 2005)).
A Skin-friction drag is of two types, the Turbulent flow & the Laminar flow skin-friction.
In order to reduce the Turbulent flow skin-friction, a new technology called ‘Riblet’ has been developed. Riblets are miniscule (order of micrometres) extrusions shaped like ribs on the surface of the aircraft, at high speeds these structures can help reduce skin friction upto 7% which amounts to about 2-3% of total drag reduction. The issue with this technology is the limitation of manufacturing equipment and material properties which restrict high tolerances ((Szodruch and Knorzer, 2012) (Viswanath, 2002)).
The second type of skin-friction is due to laminar flow (Viscous Drag), reductions in this type of drag can produce upto 10% cut-back on fuel consumption. In order to reduce Viscous Drag, technologies which aim to maintain laminarization of flow over wing, tail and nacelles are being explored. There are different methods of achieving laminar flow around an airplane like the development of surfaces which provide Natural Laminar Flow (NLF). Under the European Clean Sky 2 Joint Initiative, there has been progress in testing modified wings which allow for NLF by using the latest manufacturing capabilities ((Szodruch and Knorzer, 2012).
NASA has been testing similar methods to reduce laminar flow contaminants and expects 30% drag reductions. Other methods such as Hybrid Laminar Flow offer similar improvements ((Szodruch and Knorzer, 2012), (Green, 2009)). The technologies to improve the flow around the aircraft have existed for a long time, however, they rely heavily on enhancement of manufacturing capabilities and are limited in terms of accessibility.
Apart from Aerodynamic improvements on an Airframe, reducing the empty weight of aircrafts per payload also improves fuel efficiency. Major weight reductions are made by replacing the aluminium based alloys with carbon-fibre induced plastic composites. These composites are stronger and lighter (have 60% the density) than aluminium hence they can save upto 20% in weight. The ability of composites to be formed in complex geometries serves as an advantage by reducing the number of parts and helping streamline the design further to either reduce empty space or increase payload capacity. However, the costs of manufacturing composites are higher than those of metals which means that aircraft manufacturers have been slow on the uptake with some popular aircrafts like Airbus 330, Boeing 777 using less than 20% composites (Green, 2009).
The advantage of this technology is that it can be implemented to current aircrafts. ACARE (Advisory Council for Aeronautics Research in Europe) hopes to ensure that by 2020, 65% of materials on an aircraft are composites. If this goal is realised globally it would mean that (assuming 20% weight reduction per aircraft compared to aluminium) 15% fuel burn reductions will be observed ((Green, 2009), (Air Travel – Greener by Design, 2005)).
Other innovative techniques include using 3D printing which uses radical designs which are lighter, compact and stronger. Making the aircraft & engine more electric can help further reduce the emissions. Using lighter paints (new-age paints are 10% – 20% lighter) etc., in an aircraft is also recommended.
Propulsion Improvements:
Major fuel efficiency increase in the past has been driven by engine improvement. The propulsion efficiency of an engine is a product of
2) from eligible mechanisms, programmes or projects. An example of such a programme is the UNFCCC Clean Development Mechanism (CDM) (Icao.int, 2016).
4.4.3 CORSIA Line of Action
The carbon offsetting scheme comes into action in 2021 which marks the beginning of the pilot phase and will last from 2021 to 2023. Under this phase and the first phase (from 2024 through 2026) of the plan, the ICAO calls on nations to volunteer to participate in the scheme. As of April 2017, 67 states representing 87.5% of global international aviation activities announced their participation in the scheme. This is an opportunity to develop an understanding, research the benefits and resolve any flaws a carbon offsetting scheme may have. In 2022, a first review will be conducted to carry out any needed adjustments and further reviews will be carried out every 3 years.
The second phase of the scheme will be implemented from 2027 through 2035. As mandated by the ICAO this phase would apply to “all States that have an individual share of international aviation activities in RTKs (Revenue tonne per kilometre) in year 2018 above 0.5 per cent of total RTKs or whose cumulative share in the list of States from the highest to the lowest amount of RTKs reaches 90 per cent of total RTKs, except LDCs, SIDS and LLDCs unless they volunteer to participate in this phase.” (Icao.int, 2016).
Currently the ICAO is working towards ensuring that airline operators, nations and ICAO can work together efficiently to implement the scheme (Icao.int, 2016). The scheme in itself is not perfect and would require honest ICAO intervention to improve the issues.
4.4.4 Limitations of CORSIA
As the ICAO does not have an influence on domestic aviation, this means that CORSIA is limited to mitigating international aviation. Given the distances domestic flights can cover in large countries like Canada, United States this could hinder aviation emission reduction plans. In order to reduce overall aviation emissions domestic aviation must be included into some ETS program or individual countries must plug their own emissions.
The CORSIA scheme is limited to only CO2 emissions however, aviation produces other NOX & particulates that contribute to climate change. An effort must be made to develop stringent NOX standards which are regulated by governments.
CORSIA would be implemented to specific routes of travel (see 4.4.2). In the case where either one or both parties are not part of CORSIA the offsetting will not be applied to that route this means that most routes arising or terminating at developing countries will not be subject to offsetting, this could be an issue towards long-term goals as majority of the aviation growth is being observed in developing countries. Also, a loophole with this is that airline operators may choose to re-route their flights via countries outside the scope of the scheme (Icao.int, 2016).
Another factor to consider for this offsetting scheme and the ICAO carbon neutral growth level is that aviation will grow un-hindered until the year 2020 and CORSIA will only aim to offset those emissions above the 2020 level. With the current growth rate for aviation it would mean that the carbon levels would be significantly higher than current levels and Aviation will consistently generate emissions at 2020 level.
The initial phases (Pilot + First) are voluntary and a cause for concern would be the remaining emitters (especially Russia and India who have expressed reservations) who have yet to volunteer. Due to the many limitations discussed above, the ICAO MBM scheme would only affect about 40% of total global aviation activity (Hedley et al., 2016).
Apart from these scheme loopholes, there are still crucial elements of the scheme which have not been developed or agreed upon. A strategy for the MRV system needs to be agreed by 2018 and implemented by 2019, this means there will be little time for testing hence the burden of testing will fall on the Pilot & First phase (Hedley et al., 2016).
At the moment, an EUC and electronic registries are being developed to establish which offsets can be used by the airline operators. The UN-backed CDM offsets are already included in the scheme and further offset markets need to explored (Icao.int, 2016).
Another issue with implementation is that ICAO has given member states the responsibility to enforce the scheme which means that there needs to be some level of stringent policy which reprimands the non-compliant operators (Hedley et al., 2016).
Currently, the scheme has been watered down to secure support from countries such as USA and China. However, it is a step in right direction and would require major work from ICAO and stakeholders to work together to further improve the scheme and adapt to changing times (Hedley et al., 2016).
4.4.5 Where can ICAO acquire offsets from?
The offsets in question are going to compensate for aviation emissions, hence it is imperative that they be “real, permanent, additional and verified” (carbonmarketwatch.org, 2013). At present the market for offset credits in being explored by the ICAO with offset credits the UNFCCC CDM already accepted. The offset credits can be acquired from a number of sources such as;
Clean Development Mechanism (CDM) is a carbon offset programme established under the Kyoto Protocol and it allowed developed countries to meet their GHG reduction commitments by investing in mitigation projects in developing countries. CDM project offsets are called “certified emission reductions” (CERs). At first CDM was limited to country – to – country level interaction but in 2015 the UNFCCC made CDM accessible to anyone who wishes to cancel CERs. At present, there are 8000 CDM projects in 103 countries with the potential to generate 5 billion CERs (Icao.int, 2016). As these offsets have already been accepted by ICAO, it is of significant importance that the quality of these offsets be ensured, because majority of the offsets will be acquired through the CDM programme (Bailis, Broekhoff and M. Lee, 2016).
Joint Implementation (JI) mechanism was introduced under Article 6 of the Kyoto Protocol with the goal that developed countries (Annex I) could acquire offsets from other Annex I countries. The offset credits from JI are referred to as Emission Reduction Units (ERUs) (Unfccc.int, n.d.). The JI programme is severely criticised due to lack of quality control of offsets, with host nations issuing offsets which are not verified hence the use of this programme is debatable. However, during the EU ETS airlines have used the ERUs with the EU accepting the offsets (Kollmuss and Schneider, 2015).
New Market Mechanism (NMM) is the new international market offsetting scheme under development to supplement CDM and JI, it was approved by the UNFCCC in 2011 and it will be a while before the guidelines and procedures are developed but it should be available for CORSIA (unfccc.int, 2014).
Other options such as Voluntary offset programmes and allowances from cap-and-trade systems also exits. The offsets from Voluntary programmes is usually not of the best quality due limited regulation (Bailis, Broekhoff and M. Lee, 2016).
5 Aviation emissions against 2°C scenario
In 2014, the Intergovernmental Panel on Climate Change (IPCC) cited the importance of cumulative GHG (net GHG emitted over a time period) towards global mean temperature increase. From year 2015 onwards, in order to have 50:50 (‘reasonable’) chance of avoiding the 2°C target there remains around 1100-1400 GtCO2 that can be emitted and all sectors must contribute through significant emission reductions and mitigations (Bows-Larkin et al., 2016). As it is the cumulative GHG generated over the next few decades that will influence global temperature increase, the ICAO & IATA goals of achieving carbon neutral growth may not be sufficient and the aviation sector must look towards achieving decarbonisation (CAMES et al., 2015)
Based on current growth rates global aviation is expected to generate 43 GtCO2 between 2016 and 2050. This amounts to about 3-4% of the remaining cumulative carbon budget. With the ICAO’s plan of action there will be observable reductions and it needs to be seen if those reductions are in-line with 2°C target scenarios (BiologicalDiversity.org, 2015).
5.1 Aviation 2°C target scenarios
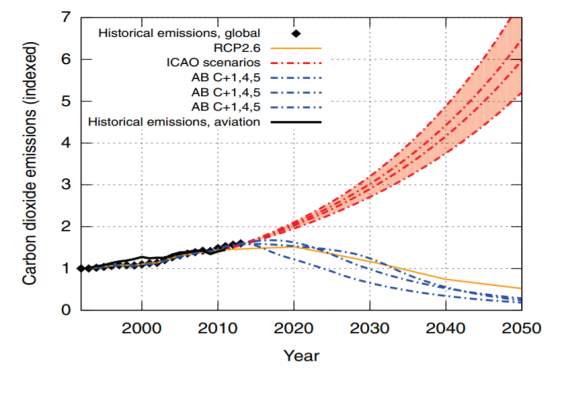
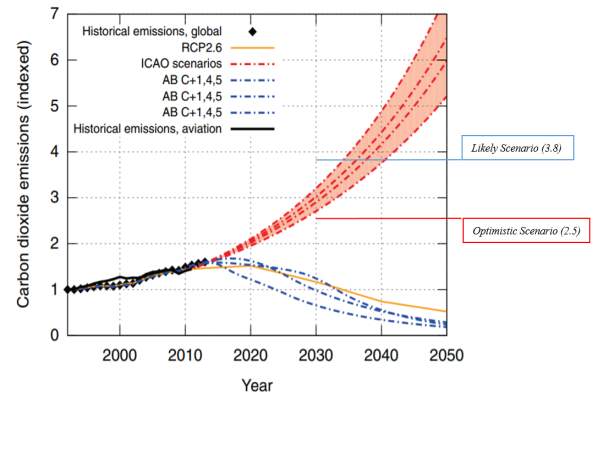
Bows-Larkin et al. (2016) developed contrasts between ICAO emissions scenarios until 2050 against global CO2 emission scenarios compatible with avoiding the 2°C temperature increase before pre-industrial levels (Fig 14). In order to compare the reductions due to the ICAO plan of action (see section 4) the Bows-Larkin et al. (2016) graph (Fig 14) is taken as a reference and the emission reduction due to each measure is plotted on the graph. This is expected to develop an understanding of where the current ICAO plan compares to the ‘2°C target’.
Explanation of Figure 14:
Before moving forward, the following background is provided on the Bows-Larkin et al. (2016) graph.
In Figure 14, the ‘Red’ curve section of the graph constitutes the ICAO future emissions scenarios until 2050. The scenarios vary depending on potential growth hence there are multiple curves with different level of emissions.
The Yellow line on the figure is the (Representative Concentration Pathways) RCP 2.6 scenario. RCPs are scenarios/trajectories adopted by the IPCC in 2014 for carbon dioxide emissions and the resulting GHG concentration in the atmosphere. There 4 different RCP trajectories and each covers a different climate change outcome for the 21st century. Bows-Larkin (2014) explains that the RCP 2.6 scenario most closely aligns with the 2°C level of temperature increase. As is evident from Fig 14 that the historical trend is not in line with the RCP2.6 scenario (which gives us the best chance of staying within 2°C level of warming) meaning there needs to significant rapid reductions in the future.
The additional Blue lines represent three global scenarios from Anderson and Bows (2011), these scenarios express the amount of CO2 reduction necessary across all sectors to have a reasonable chance at avoiding 2°C temperature increase (refer to Anderson and Bows, 2011 for derivation).
The (Anderson & Bows) AB C+1,4,5 represents 3 scenarios for emission reduction. The C+1 scenarios is the curve with a high chance of avoiding 2°C temperature increase, the C+1 scenarios considers an immediate and steeper cut in emissions starting from 2020. The C+4 scenario assumes a gradual increase in emissions following the general historical trend followed by a rapid reduction (about 6% p.a.) till 2050. The C+5 scenario considers a gradual reduction (1-2%) till 2030 followed by a rapid reduction (about 8% p.a.) until 2050.
All three AB scenarios have been set up with the intention of not exceeding the threshold, hence it should be Aviation’s objective to follow a similar suit (Anderson and Bows, 2011).
5.2 Comparing ICAO Plan of Action to emission scenarios
Assumptions:
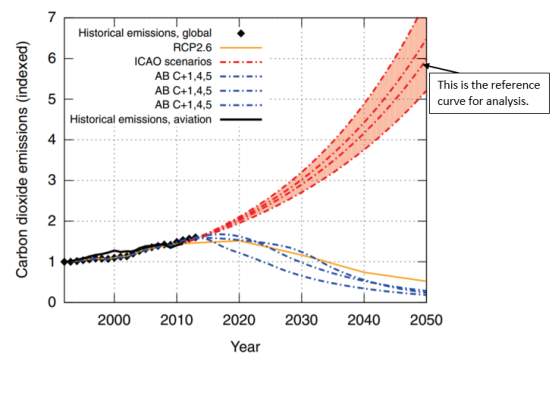
- Out of the 4 ICAO curves the 3rd curve from the top (terminating at carbon emission ‘6’) has been taken as the level at which emissions will be in 2050 (see Figure 15). This represents a 300% increase in emissions between 2010 and 2050 which is approximately in-line with ICAO estimations (see section 1.2).
- It must be noted that the emissions on the graph have been indexed to 1992 levels. Hence when applying the % reductions (from section 4) to the emissions they will be applied on these indexed values. For example: A 10% reduction in overall emissions would be
10100×6=0.6reduction on the graph.
- For each plan of action measure (section 4) there is a likely scenario and an optimistic scenario and the ‘% reductions’ will be labelled onto the Bows-Larkin et al. (2016) graph.
- As the reductions will be labelled on an existing graph which is not to scale the markings will not be exact. However, it will still allow for the evaluation of the ICAO plan of action.
Operational measure reductions:
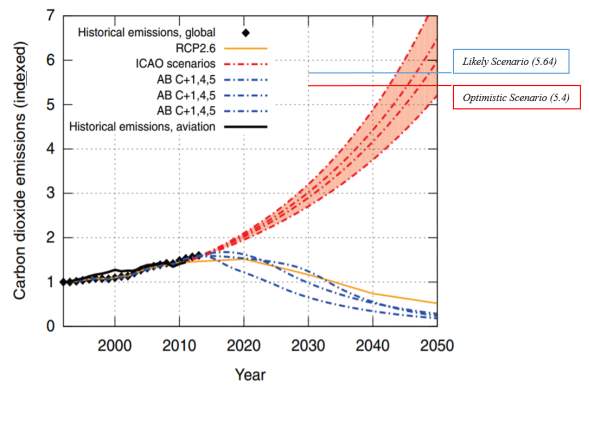
In the Likely scenario, the assumption made was a 6% reduction. When a 6% reduction is applied to total carbon emissions (‘6’) it would reduce the emissions by
6100×6=0.36
Hence the Likely scenario brings down the total emissions to
6-0.36=5.64
Similarly, for the Optimistic scenario a 10% overall reduction was assumed which would reduce the emissions by
10100×6=0.6
Hence the Optimistic scenario brings down the total emissions to
6-0.6=5.4
| Scenario | Initial CO2 emission level | CO2 Emission level after Operational Reductions |
| Likely | 6 | 5.64 |
| Optimistic | 6 | 5.4 |
Alternative fuel reductions
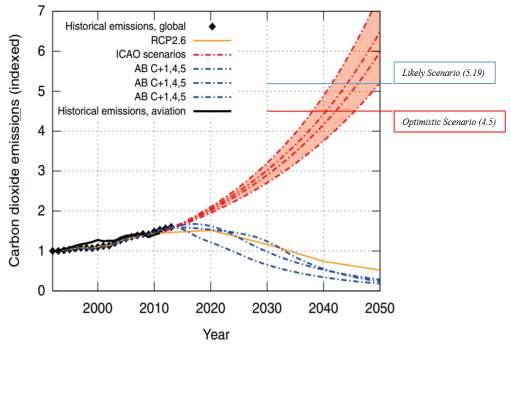
In the Likely scenario, the assumption made was a 7.5% reduction. When a 7.5% reduction is applied to total CO2 emissions it would bring down the emissions by,
7.5100×6=0.45
. This is the independent reduction which is observed when only Alternative fuels are implemented under likely scenario.
Similarly, for the Optimistic scenario a 15% overall reduction was assumed which would reduce the emissions by,
15100×6=0.9
. This is the independent reduction which is observed when only Alternative fuels are implemented under Optimistic scenario.
To find the total reductions after both Operational & Alternative fuel reduction, the independent emission reduction from Alternative fuels is subtracted from the (CO2 Emission after Operational Reductions).
| Scenario | Initial CO2 emission level | CO2 Emission level after Operational Reductions | CO2 Emission level after both Operational & Alternative fuel reduction. |
| Likely | 6 | 5.64 | 5.19 |
| Optimistic | 6 | 5.4 | 4.5 |
Table 5: Shows the reduction in CO2 emission after both Operational Measures & Alternative fuels are implemented.
Technology driven reductions
First the growth rate for the chosen ICAO curve needs to be evaluated. The emissions between 2020 and 2050 rise from about 1.9 to 6 and this is chosen to calculate the growth rate for future emissions because the MBM scheme comes into play from 2020 and there needs to be consistency for MBM calculation later on.
The growth rate is compounded annually hence the annual growth rate can be calculated by using the ‘Annual Compound interest formula’
A=P1+rt
where A is final value, P is the starting principal value, ‘r’ is rate, ‘t’ is the number of years.
For the growth rate calculation, the Final Amount (A) is 6, Principal Amount (P) is 1.9, the Growth rate is r and the Time (t) is 30 years (2050-2020).
6=1.81+r30
Solving for ‘r’ gives an annual growth rate of 4%, this is comparable with the past growth rates of over 3% since 1990 and can be taken as an acceptable reference point. This is also in-line with the 3.8% annual growth that IATA has assumed to calculate its passenger growth (Iata.org, 2015). Owen, Lee and Lim (2010) estimate that aviation will at about 3.6% (depending on scenario) hence the assumption is reasonable.
The reductions due to technology are gradual and are implemented over time. Based on the initial literature review it was established that technology produces an annual reduction in fuel burn (for both Likely & Optimistic scenarios) (see section 4.3.1). The annual technology reduction will reduce the annual growth rate.
Hence, in order to find the new growth rate, the (% reduction due to technology) is subtracted from estimated (Growth rate = 4%).
| Scenario | Growth Rate | % reduction due to Technology | New growth rate after Technology reduction |
| Likely | 4% | 1% | 3% |
| Optimistic | 4% | 1.5% | 2.5% |
Table 6: Shows the reduction in annual growth rate after Technological improvements are implemented.
This new growth rate is then input into the ‘Compound Interest Formula’ to recalculate the new CO2 emission level. The new CO2 emission level when subtracted from ‘6’ will give us the total reductions observed due to just Technology Improvements.
| Scenario | Initial CO2 emission level | New growth rate | New Emission Level | Emission reduction due to Technology |
| Likely | 6 | 3% | 4.6 | 1.4 |
| Optimistic | 6 | 2.5% | 4 | 2 |
Table 7: Shows the reductions in CO2 emission reduction after just Technological improvements are implemented.
This reduction is then cumulated to the reductions due to Operational and Alternative fuel improvements to establish the total reductions when 3 (Operations, Alternative fuels, technology) measures are implemented.
| Scenario | CO2 Emission after both Operational & Alternative fuel reduction. | CO2 Emission level after 3 measures are implemented |
| Likely | 5.19 | 3.8 |
| Optimistic | 4.5 | 2.5 |
Table 8: Shows the reduction in CO2 emission after Operational Measures, Alternative fuels & Technology Improvements are implemented.
MBM offsetting
In the case of MBM the offsets estimated by the CAEP (section 4.4) has been taken as a reference.
| Scenario | Quantity to Carbon to be offset using CORSIA scheme (in 2050) |
| Likely | 816 Mt |
| Optimistic | 590 Mt |
Table 9: Amount of Carbon that needs to be offset by MBM scheme (refer to Fig 12), (ICAO, 2016)
Fig 4: Potential causes for flight inefficiencies (Marais et al., 2013).
Fig 5: Worldwide Commercial Jet Fuel Consumption & cost for 2011-2021 (U.S. Energy Information Administration (EIA). Fig 4: Potential causes for flight inefficiencies (Marais et al., 2013).
Fig 4: Potential causes for flight inefficiencies (Marais et al., 2013).
Following the same suit as the technology case. First, based upon the growth rate (4%) the expected 2050 emission is calculated using the Compound interest formula.
The emissions in 2015 was 781Mt, hence at a 4% per annum growth rate hence the emissions in 2050 are;
7811+410035= 3082MtCO2
This is again in line with available literature, BiologicalDiversity.org (2015) estimates that aviation CO2 emissions in 2050 could be higher than 3GtCO2.
In order to find the % reduction brought about by the CORSIA scheme the amount of carbon offset (in 2050) is divided by emissions (in 2050).
| Scenario | Quantity to Carbon to be offset using CORSIA scheme (in 2050) | CO2 Emission in 2050 | % of CO2 Emission Offset by CORSIA |
| Likely | 816 Mt | 3082 Mt | 26.5% |
| Optimistic | 590 Mt | 3082 Mt | 19% |
Table 10: % of CO2 emissions offset by CORSIA.
Fig 4: Potential causes for flight inefficiencies (Marais et al., 2013).
Fig 5: Worldwide Commercial Jet Fuel Consumption & cost for 2011-2021 (U.S. Energy Information Administration (EIA). Fig 4: Potential causes for flight inefficiencies (Marais et al., 2013).
Fig 4: Potential causes for flight inefficiencies (Marais et al., 2013).
Using the % offset by CORSIA, the emissions offset on the Bows-Larkin et al. (2016) graph can be estimated by multiplying with ‘6’ i.e. the CO2 Emission reference level. This offset amount can then be subtracted from Initial CO2 Emission in 2050 (‘6’) to give mitigation (reduction) through offsetting.
| Scenario | % of CO2 Emission Offset by CORSIA | Initial CO2 Emission Level | CO2 Emission level after CORSIA offset | Reduction due to CORSIA |
| Likely | 26.5% | 6 | 4.41 | 1.6 |
| Optimistic | 19% | 6 | 4.86 | 1.14 |
Now, reductions due to all 4 measures is combined together to find the net reductions in CO2 emission levels.
| Scenario | CO2 Emission level after 3 measures are implemented | CO2 Emission level after all 4 measures are applied |
| Likely | 3.8 | 2.2 |
| Optimistic | 2.5 | 1.36 |
Table 12: Shows the reduction in CO2 emission after Operational Measures, Alternative fuels, Technology Improvements & MBM scheme are implemented.
5.3 Evaluation of Results
The final calculation showed that the with the successful implementation of the ICAO plan of action (see section 4) the emission level could be brought down between 1.36 – 2.2 (indexed to 1992 levels). The calculations in section 5.2 are within reason as they can be corroborated with the ICAO plan to achieve Carbon Neutral Growth from 2020. In the year 2020, the emission level is estimated to be 1.9 and this falls within the Likely to Optimistic range that was calculated.
6 What can be done to help avoid missing the RCP Scenarios?
This section would be similar to a conclusion, here I am going to suggest some ways the emissions can be further reduced. Maybe add % deflection from RCP 2.6.
7 Future Work & Dissertation Improvements
Not all measures will be implemented at all times uniformly throughout the world. Developed will have more options.
The growth rate is much higher in developing countries and lower in developed hence different reductions in emissions based n geographical regions.
It is also assumed that each measure will be applied successfully by the ICAO.
N.B. The switch to these alternative fuels will help reduce emissions however, in the long run these emissions will have to be dealt with. This has not been factored into the current report.
In this section, I will suggest how to further improve the research.
8 Project Timeline
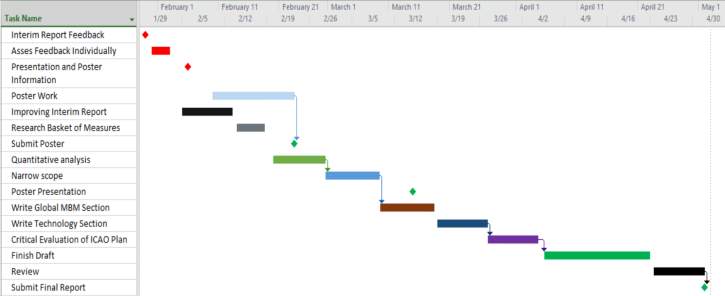
9 References
“COP21 | 2°C Target: Result of State Contributions”. Cop21.gouv.fr. N.p., 2015. Web. 6 Oct. 2016.
“Facts & FIGURES – Air Transport Action Group (ATAG)”. Atag.org. N.p., 2016. Web. 24 Sept. 2016.
“KYOTO PROTOCOL TO THE UNITED NATIONS FRAMEWORK CONVENTION ON CLIMATE CHANGE”. UNFCCC. N.p., 1998. Web. 2 Oct. 2016.
Abeyratne, R. (2014). Aviation and climate change. 1st ed. Springer, pp.69-81.
Air Travel – Greener by Design Mitigating the environmental impact of aviation: Opportunities and priorities. (2005). The Aeronautical Journal, [online] 109(1099), pp.361-416. Available at: https://www.aerosociety.com/Assets/Docs/About_Us/Greener%20By%20Design/GbD%20-%202005%20Science%20and%20Technology%20Report.pdf.
An introduction to market-based-measures (MBMs). (n.d.). [online] Waraw: Environment, Air Transport Bureau International Civil Aviation Organisation. Available at: http://www.icao.int/Meetings/EnvironmentalWorkshops/Documents/2015-Warsaw/6_1_An-introduction-to-market-based-measures-MBMs.pdf [Accessed 5 Dec. 2016].
Anderson, K. (2006). EU ETS & Aviation. Available: http://www.ieta.org/Three-Minute-Briefings/3881178 Last accessed 24 Sept. 2016
ATAG, (2016). Aircraft Benefits Beyond Borders. [online] Geneva: e Air Transport Action Group (ATAG), pp.3-11. Available at: http://www.atag.org/ [Accessed 25 Oct. 2016].
Auctioning of Emission Allowances in Germany Periodical Report: Early Auctions and Auctioning in Aviation 2012. German Emissions Trading Authority (DEHSt), 2012. Web. 16 Oct. 2016
Beginner’s guide to aviation biofuels. (2011). 1st ed. Geneva, Switzerland: Air Transport Action Group.
Beginner’s guide to aviation efficiency. (2010). 1st ed. Geneva, Switzerland: Air Transport Action Group.
Bigpicture.unfccc.int. (2016). UNFCCC eHandbook. [online] Available at: http://bigpicture.unfccc.int/#content-the-paris-agreemen [Accessed 15 Nov. 2016].
Brown N. Alternative jet fuels – feedstock development, processing and conversion research & regional supply and refining infrastructure. Federal Aviation Administration; 2012. Available at: http://www.faa.gov/about/office_org/headquarters_offices/ang/offices/management/coe/media/pdf/ajfepMeeting/Alternative%20Fuels%20-%20Part%201.pdf.
Chiaramonti, D., Prussi, M., Buffi, M. and Tacconi, D. (2014). Sustainable bio kerosene: Process routes and industrial demonstration activities in aviation biofuels. Applied Energy, [online] 136, pp.767-774. Available at: http://www.sciencedirect.com/science/article/pii/S0306261914008769.
Climate Action – European Commission. (2013). The EU Emissions Trading System (EU ETS) – Climate Action – European Commission. [online] Available at: http://ec.europa.eu/clima/policies/ets_en [Accessed 16 Oct. 2016].
Dr. Schlumberger, Charles E. 2012. Air transport and energy efficiency. Transport papers; no. 38. Washington DC; World Bank Group. http://documents.worldbank.org/curated/en/746271468184153529/Air-transport-and-energy-efficiency
Emirates United Kingdom. (n.d.). Flight Operations | Efficiency and Technology | Emirates United Kingdom. [online] Available at: https://www.emirates.com/uk/english/environment/efficiency_and_technology/flight_operations.aspx [Accessed 15 Jan. 2017].
Energy technology perspectives 2008. (2008). 1st ed. Paris, France: IEA, pp.200-250. Available at: http://www.iea.org/media/etp/etp2008.pdf
EUROCONTROL/EU, 2012. European ATM Master Plan. 2nd ed. http://www.atmmasterplan.eu
Evaluation of potential near-term operational changes to mitigate environmental impacts of aviation J. Aerospace Eng., 227 (8) (2013), pp. 1277–1299 http://dx.doi.org/10.1177/0954410012454095
Executive Summary of the Impact Assessment amending Directive 2003/87/EC (2013) European Commission http://ec.europa.eu/clima/policies/transport/aviation/docs/swd_2013_431_en.pdf
FAA, 2013. NextGen Implementation Plan. http://www.faa.gov/nextgen/implementation
Green, J. (2009). The potential for reducing the impact of aviation on climate. Technology Analysis & Strategic Management, [online] 21(1), pp.39-59. Available at: http://www.tandfonline.com/doi/abs/10.1080/09537320802557269.
Hill, J. (2007). Environmental costs and benefits of transportation biofuel production from food- and lignocellulose-based energy crops. A review. Agronomy for Sustainable Development, [online] 27(1), pp.1-12. Available at: https://www.scopus.com/record/display.uri?eid=2-s2.0-33947304155&origin=inward&txGid=A9D7E77A545199AB3E0AE0A1964CCB29.wsnAw8kcdt7IPYLO0V48gA%3a2.
Iata.org. (2015). IATA – 20 Year Passenger Forecast. [online] Available at: http://www.iata.org/publications/store/Pages/20-year-passenger-forecast.aspx [Accessed 27 Nov. 2016].
ICAO 2013 Environmental Report. (2013). [online] Environmental Branch of ICAO, p.24. Available at: http://cfapp.icao.int/Environmental-Report-2013/#1/z [Accessed 1 Dec. 2016].
ICAO, (2016). ICAO ENVIRONMENTAL REPORT 2016. Environment Branch of the International Civil Aviation Organization (ICAO), pp.97-125.
Icao.int. (2016). Carbon Offsetting and Reduction Scheme for International Aviation (CORSIA). [online] Available at: http://www.icao.int/environmental-protection/Pages/market-based-measures.aspx [Accessed 23 Nov. 2016].
In-text: (Penner, 2000) Your Bibliography: Penner, J. (2000). Aviation and the global atmosphere. 1st ed. [Geneva]: Intergovernmental Panel on Climate Change, pp.3-6.
IPCC, 1999. Intergovernmental Panel on Climate Change. Aviation and the Global Atmosphere. Cambridge University Press, UK.
Ipcc.ch. (n.d.). Aviation and the Global Atmosphere. [online] Available at: https://www.ipcc.ch/ipccreports/sres/aviation/124.htm [Accessed 1 Dec. 2016].
K. Marais, T.G. Reynolds, P. Uday, D. Muller, J. Lovegren, J.M. Dumont, R.J. Hansman
Kandaramath Hari, T., Yaakob, Z. and Binitha, N. (2015). Aviation biofuel from renewable resources: Routes, opportunities and challenges. Renewable and Sustainable Energy Reviews, [online] 42, pp.1234-1244. Available at: http://www.sciencedirect.com/science/article/pii/S1364032114009204.
Khalid, S., Lurie, D., Stringfellow, A., Wood, T., Ramakrishnan, K., Paliath, U. and Wojno, J. (2013). Open Rotor Engine Aero Acoustic Technology Final Report. [online] Evendale: General Electric Company. Available at: https://www.faa.gov/about/office_org/headquarters_offices/apl/research/aircraft_technology/cleen/reports/media/Open_Rotor_Public_Final_Report.pdf
Kharina, A. and Rutherford, D. (2015). Fuel efficiency trends for new commercial jet aircraft: 1960 to 2014. International Council on Clean Transportation, pp.1-11.
Kinsey, J., Timko, M., Herndon, S., Wood, E., Yu, Z., Miake-Lye, R., Lobo, P., Whitefield, P., Hagen, D., Wey, C., Anderson, B., Beyersdorf, A., Hudgins, C., Thornhill, K., Winstead, E., Howard, R., Bulzan, D., Tacina, K. and Knighton, W. (2012). Determination of the emissions from an aircraft auxiliary power unit (APU) during the Alternative Aviation Fuel Experiment (AAFEX). Journal of the Air & Waste Management Association, [online] 62(4), pp.420-430. Available at: https://www.ncbi.nlm.nih.gov/pubmed/22616284.
Knörzer, D. and Szodruch, J. (2012). Innovation for sustainable aviation in a global environment. 1st ed. Amsterdam: IOS Press, pp.129-136.
Lee, D. and Fahey, D. (2009). Aviation and global climate change in the 21st century. [online] Sciencedirect.com. Available at: http://www.sciencedirect.com/science/article/pii/S1352231009003574
Lee, J. (2000). Historical and Future Trends in Aircraft Performance, Cost, and Emissions. Boston: Massachusetts Institute of Technology.
Lokesh, K., Sethi, V., Nikolaidis, T., Goodger, E. and Nalianda, D. (2015). Life cycle greenhouse gas analysis of bio jet fuels with a technical investigation into their impact on jet engine performance. Biomass and Bioenergy, [online] 77, pp.26-44. Available at: http://www.sciencedirect.com/science/article/pii/S0961953415000859.
Malwitz, A., Bal Subramanian, S., Fleming, G., Yoder, T. and Waitz, I. (2009). Impact of the Reduced Vertical Separation Minimum on the Domestic United States. Journal of Aircraft, [online] 46(1), pp.148-156. Available at: http://web.mit.edu/aeroastro/partner/reports/rsvm-caep8.pdf.
Massachusetts Institute of Technology, Cambridge, MA. Available at: http://web.mit.edu/aeroastro/partner/reports/proj28/partner-proj28-2010-001.pdf.
Mohammad, M., Kandaramath Hari, T., Yaakob, Z., Chandra Sharma, Y. and Sopian, K. (2013). Overview on the production of paraffin based-biofuels via catalytic hydrodeoxygenation. Renewable and Sustainable Energy Reviews, [online] 22, pp.121-132. Available at: http://www.sciencedirect.com/science/article/pii/S1364032113000579.
Pablo M.J. Mendes de Leon, et al., Protecting the Environment by Use of Fiscal Measures: Legality and Propriety, 62 J. Air L. & Com. 791 (1997) http://scholar.smu.edu/jalc/vol62/iss3/10
Penner, J. (1999). Aviation and the global atmosphere. 1st ed. Cambridge: Cambridge University Press, p.26-65.
Perullo, C., Tai, J. and Mavris, D. (2013). Effects of Advanced Engine Technology on Open Rotor Cycle Selection and Performance. Journal of Engineering for Gas Turbines and Power, [online] 135(7), p.071204. Available at: http://gasturbinespower.asmedigitalcollection.asme.org/article.aspx?articleid=1697739.
R.W. Stratton, H.M. Wong, J.I. Hileman (2010). Life cycle greenhouse gas emissions from alternative jet fuels. Partnership of Air Transportation Noise and Emissions Reduction.
Reynolds, T. (2014). Air traffic management performance assessment using flight inefficiency metrics. Transport Policy, [online] 34, pp.63-74. Available at: http://www.sciencedirect.com/science/article/pii/S0967070X1400050X [Accessed 5 Jan. 2017].
Rolls-royce.com. (n.d.). Open rotor technology. [online] Available at: https://www.rolls-royce.com/about/our-technology/research/research-programmes/sustainable-and-green-engine-sage-itd/open-rotor-technology.aspx
Sarkar, A. (2012). Evolving Green Aviation Transport System: A Holistic Approach to Sustainable Green Market Development. American Journal of Climate Change, [online] 01(03), pp.164-180. Available at: http://file.scirp.org/Html/5-2360021_22479.htm#txtF3 [Accessed 1 Feb. 2017].
Szodruch, J. and Knorzer, D. (2012). Innovation for sustainable aviation in a global environment. 1st ed. Amsterdam: Ios Press.
theccc. (2009). Meeting the UK aviation target – options for reducing emissions to 2050. [online] Available at: https://www.theccc.org.uk/archive/aws2/Aviation%20Report%2009/21667B%20CCC%20Aviation%20AW%20COMP%20v8.pdf
Transport & Environment, (2010). Grounded: How ICAO failed to tackle aviation and climate change. [online] Transport & Environment. Available at: https://www.transportenvironment.org/sites/te/files/media/2010_09_icao_grounded.pdf [Accessed 3 Nov. 2016].
Vallack, H., Haq, G., Whitelegg, J. and Cambridge, H. (2014). Policy pathways towards achieving a zero-carbon transport sector in the UK in 2050. World Transport Policy and Practice, [online] 20.4, pp.7-30. Available at: http://www.eco-logica.co.uk/pdf/wtpp20.4.pdf.
Viswanath, P. (2002). Aircraft viscous drag reduction using riblets. Progress in Aerospace Sciences, [online] 38(6-7), pp.571-600. Available at: http://inter.action.free.fr/faq/riblets.pdf.
Yu-Hern Chang, (2011). Operating cost control strategies\\ for airlines. African Journal of Business Management, [online] 5(26). Available at: http://www.wctrs-society.com/wp/wp-content/uploads/abstracts/lisbon/selected/02232.pdf [Accessed 4 Feb. 2017].
Zhang, C., Hui, X., Lin, Y. and Sung, C. (2016). Recent development in studies of alternative jet fuel combustion: Progress, challenges, and opportunities. Renewable and Sustainable Energy Reviews, [online] 54, pp.120-138. Available at: http://www.sciencedirect.com/science/article/pii/S1364032115010266.
Chevallier, J. (2015). Principles of Emissions Trading. [online] Spingerlink. Available at: https://link.springer.com/referenceworkentry/10.1007/978-3-642-38670-1_1 [Accessed 28 Feb. 2017].
Derik Broekhoff and Kathryn Zyla, 2008. Outside the Cap: Opportunities and Limitations of Greenhouse Gas Offsets. World Resources Institute Climate and Energy Policy Series. December 2008 http://pdf.wri.org/outside_the_cap.pdf
Icao.int. (2016). Results of Technical Analyses by CAEP. [online] Available at: http://www.icao.int/Meetings/HLM-MBM/Pages/background_information.aspx [Accessed 29 Jan. 2017].
World energy outlook 2013. (2013). 1st ed. Paris: International energy agency, pp.65-75.
Hedley, A., Rock, N., Zaman, P. and Gilani, S. (2016). First ever global regime for aviation emissions: ICAO adopts Global Market-Based Measure to combat aircraft CO2 emissions | Perspectives | Reed Smith LLP. [online] Reedsmith.com. Available at: https://www.reedsmith.com/en/perspectives/2016/10/first-ever-global-regime-for-aviation-emissions-ic [Accessed 14 Mar. 2017].
carbonmarketwatch.org. (2013). Turbulences Ahead: Market based measures to reduce Aviation emissions. [online] Available at: http://carbonmarketwatch.org/wp-content/uploads/2013/05/Aviation-Emissions-Policy-Brief-June-20131.pdf [Accessed 30 Mar. 2017].
Bailis, R., Broekhoff, D. and M. Lee, C. (2016). Supply and sustainability of carbon offsets and alternative fuels for international aviation. Stockholm Environment Institute – U.S. Center, [online] WORKING PAPER NO. 2016-03. Available at: http://assets.wwf.org.uk/downloads/sei_wp_2016_03_icao_aviation_offsets_biofuels.pdf
Kollmuss, A. and Schneider, L. (2015). Has Joint Implementation reduced GHG emissions? Lessons learned for the design of carbon market mechanisms. STOCKHOLM ENVIRONMENT INSTITUTE, [online] WORKING PAPER NO. 2015-07. Available at: https://www.sei-international.org/mediamanager/documents/Publications/Climate/SEI-WP-2015-07-JI-lessons-for-carbon-mechs.pdf
Unfccc.int. (n.d.). Joint implementation. [online] Available at: http://unfccc.int/kyoto_protocol/mechanisms/joint_implementation/items/1674.php [Accessed 30 Mar. 2017].
unfccc.int. (2014). New Market Mechanism. [online] Available at: https://unfccc.int/files/kyoto_protocol/mechanisms/application/pdf/2014_10_eig_on_the_new_market_mechanism.pdf [Accessed 11 Apr. 2017].
Lee, D. S.; Lim, L. L. & Owen, B. (2013). Bridging the aviation CO2 emissions gap: why emissions trading is needed. Available at: http://www.cate.mmu.ac.uk/wpcontent/uploads/Bridging_the_aviation_emissions_gap_010313.pdf
Grounded: How ICAO failed to tackle aviation and climate change and what should happen now. (2010). Transport & Environment. [online] Available at: https://www.transportenvironment.org/sites/te/files/media/2010_09_icao_grounded.pdf.
Iata.org. (2015). IATA -IATA Air Passenger Forecast Shows Dip in Long-Term Demand. [online] Available at: http://www.iata.org/pressroom/pr/Pages/2015-11-26-01.aspx [Accessed 1 Apr. 2017].
Bows-Larkin, A. (2014). All adrift: aviation, shipping, and climate change policy. Climate Policy, [online] 15(6), pp.681-702. Available at: http://www.tandfonline.com/doi/pdf/10.1080/14693062.2014.965125 [Accessed 3 Feb. 2017].
Bows-Larkin, A., Mander, S., Traut, M., Anderson, K. and Wood, F. (2016). Aviation and Climate Change–The Continuing Challenge. [online] Available at: https://www.researchgate.net/publication/303446744_Aviation_and_Climate_Change-The_Continuing_Challenge.
CAMES, M., GRAICHEN, J., SIEMONS, A. and COOK, V. (2015). Emission Reduction Targets for International Aviation and Shipping. [online] Available at: http://www.europarl.europa.eu/RegData/etudes/STUD/2015/569964/IPOL_STU(2015)569964_EN.pdf.
Cite This Work
To export a reference to this article please select a referencing stye below:
Related Services
View allRelated Content
All TagsContent relating to: "Climate Change"
Climate change describes large changes in global or local weather patterns and global warming generally considered to be largely caused by an international increase in the use of fossil fuels from the mid-20th century onwards.
Related Articles
DMCA / Removal Request
If you are the original writer of this dissertation and no longer wish to have your work published on the UKDiss.com website then please:

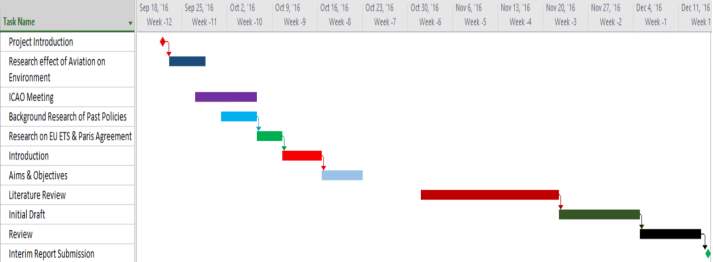 Semester 1: