Scalable Battery Management System for Low-Voltage Prototype Applications
Info: 7872 words (31 pages) Dissertation
Published: 9th Dec 2019
Tagged: Electronics
Keywords:
1.3 Goals of this Master Thesis
2.3 ISO 26262 Functional Safety
2.3.2 Initiation of the safety lifecycle
2.3.3 Hazzard Analysis and Risk Assessment
2.3.4 Functional Safety Concept
2.4.2 CRC Implementation in Hardware
2.4.3 CRC Implementation in Software
3.1 Scalability in Battery Management Systems
Figure 2.1: Functionality of a Battery Management System
Figure 2.2: Layers of a Li-ion battery pack
Figure 2.3: Centralized BMS Topology
Figure 2.4: Distributed BMS topology
Figure 2.5: Modular BMS topology
Figure 2.6: Temporal relationships in the context of fault [10].
Figure 2.7: ISO 26262 safety lifecycle [11]
Figure 2.8: Shift register for CRC generation and validation
Table 2.1: Classes of severity
Table 2.2: Classes of probability of exposure
Table 2.3: Classes of controllability
Table 2.4: Table to determine ASIL class
| SLI | Starting, Lighting and Ignition | ||
| BMS | Battery Management System | ||
| SOA | Safe Operating Area | ||
| ADC | Analog to Digital Converter | ||
| BDU | Battery Disconnect Unit | ||
| SOC | State of Charge | ||
| ECU | Electronic Control Unit | ||
| CAN | Controller Area Network | ||
| CMU | Cell Monitoring Unit | ||
| MMU | Module Management Unit | ||
| CSC | Cell Supervision Circuit | ||
| PMU | Pack Management Unit | ||
| PCB | Printed Circuit Board | ||
| EV | Electric Vehicles | ||
| ISO | International Organization for Standardization | ||
| IEC | International Electrotechnical Commission | ||
| CRC | Cyclic Redundancy Check | ||
| XOR | Exclusive OR | ||
| MSB | Most Significant Bit | ||
| HARA | Hazzard Analysis and Risk Assessment | ||
| ASIL | Automotive Safety Integrity Level | ||
| FSR | Functional Safety Requirement | ||
| HSI | Hardware Software Interface |
1 Introduction
1.1 Bosch Engineering GmbH
Bosch Engineering GmbH was founded in 1999 with 13 associates as a fully owned subsidiary of Robert Bosch GmbH. Today, headquartered in Abstatt, Germany, and employing 2000 associates worldwide, we offer the best of two worlds – the commitment and personal support of a cutting-edge, flexible engineering service provider and the expertise of a global company. As a state-of-the-art engineering service provider, it offers development and application solutions for all electronic systems in the Bosch portfolio.
BEG comprises of the following business units:
- BEG/NE1 – Engineering System and Software Services.
- BEG/NE2 – Calibration Services in Powertrain Unit.
- BEG/NE3 – Component related services.
1.1.1 BEG/EEB2
EEB which stands for Engineering Electronics- Product Group B is a competency under the engineering area BEG/NE1. It provides services in the field of body computer, battery and charging systems. EEB2 handles the advance development of charging systems, battery management functions, and innovative battery management strategies to develop customer specific solutions for high and low voltage applications.
1.2 Motivation
1.3 Goals of this Master Thesis
—Scalable communication model for a BMS.
2 Literature
Lead-acid batteries have been powering the automotive electrical system since the early 20th century. These batteries support the functions of Starting, Lighting, and Ignition; hence they are often termed as SLI Batteries [1] [2]. However, the high mass, low energy density, and poor lifespan are some significant drawbacks of the lead-acid chemistry. Starting and Service are two principal purposes of an SLI battery. The Starting function demands a high electrical power for a very short span of time. Whereas, the service function expects low to medium power for prolonged durations. Energy demands by the service function rose rapidly with increase in electronics within the vehicle. Hence, the need for higher capacity batteries with reduced mass and size came into existence [3].
Advancements in Li-ion technology has made it competitive in markets where mass, energy density, and lifespan are of serious concern [4]. Automotive applications require an absolute minimum voltage ranging between 6V and 8V. The Li-ion chemistry provides a voltage ranging identical lead acid batteries. These cells are characterised by their exceptional performance when operated within specific boundaries (voltage, current and temperature). Operating these cells outside of their specified parameters results in thermal runaway, an irreversible uncontrolled exothermic reaction leading to fire and potential explosion. Therefore, a Battery Management System (BMS) must monitor all cells and control the battery pack in case of any anomalies. Within their Safe Operating Area (SOA), they perform exceptionally at low temperatures thereby providing a high cranking current at the absolute minimum voltage [5]. Although expensive, the true value of ownership of a Li-ion battery is less than that of a lead-acid battery when their lifespan and performance are taken into consideration [6].
The BMS guarantees the safety of the Li-Ion Battery pack. A malfunction of the BMS or failure of its internal or external components compromises the system safety. An optimal balance between availability and safety proffers the automotive E/E system dependable. The ISO26262 standard provides a development procedure that assures functional safety and exemption from undesirable risks.
2.1 Battery Management System
The BMS is an integral component of the Li-Ion battery pack. It guarantees that the cell threshold levels are not violated, and the battery pack operates within the SOA. Protection of individual battery cells and enhancing safety and reliability of batteries stand out as the principal safety objectives of a BMS. Figure 2.1 shows a summarised functionality of the BMS.
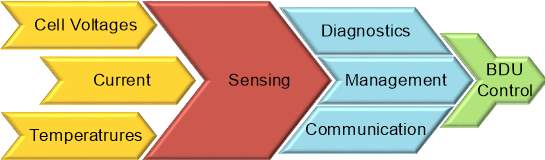
Figure 2.1: Functionality of a Battery Management System
Generally, a BMS has to fulfil certain requirements [7] which can be summarised as follows:
- Sensing: The BMS must consist of configurable, high-performance Analog to Digital Converters (ADC) to acquire cell voltages, temperatures, and the battery-pack current within a short span of time.
- Safety: The BMS must incorporate hardware and software components that protect the battery pack from, over-voltage, under-voltage, over-charge, over-current, over-temperature, under-temperature, loss of ground and short circuit protection.
- Thermal Management: The Li-ion chemistry is highly sensitive to extreme temperatures. Operation of the cells outside their temperature specifications results in a thermal overflow. Therefore, the BMS has to steadily monitor the battery-pack for any breach in the temperature thresholds.
- Battery Disconnect Unit (BDU) Control: The presence of load capacitance results in a high current spike when the load is directly connected to the battery pack. The BDU provides means to control the initial spike in current. The BMS must consider the presence of load capacitance every time the load connects to or disconnects from the battery pack through the BDU.
- Performance Management: The BMS should comprise of components and efficient algorithms which estimate the State of Charge (SOC), and power-limits. It should also support cell balancing components which ensures all series connected cells are held at an equal potential.
- Diagnostics: Diagnostic functions assist in identifying problems long before a massive system breakdown occurs. The BMS should support functional verification of the electronic components that comprise it. This enables detection of any component malfunction before an actual system failure. Besides component diagnostics, the BMS should also estimate the State of Health (SOH), an indication of an upcoming battery failure due to ageing or abuse.
- Communication Interface: The BMS should have the ability to transmit the measured quantities, estimated parameters, and battery state to other ECUs in the vehicle. This communication usually takes place over high speed CAN, since it provides robust communication under harsh operating conditions.
2.1.1 BMS Components
A Li-Ion battery is a nested assembly of cells, modules, and the pack as shown in Figure 2.2. The battery pack consists of series connected modules. Each module is made up of a combination of cells connected in series or series-parallel configuration.
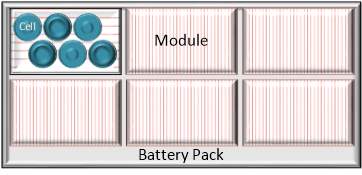
Figure 2.2: Layers of a Li-ion battery pack
Based on the battery pack requirement, a BMS is architectonically composed of the following three tiers [8]:
- Cell Monitoring Unit (CMU): A Cell Monitoring Unit is attached to each cell. It is responsible for the measurement of voltage, temperature, and other cell parameters. The CMU fulfils the sensing requirement of the BMS.
- Module Management Unit (MMU): A Module Management Unit administers a group of CMUs. It performs few evaluations and shares the parameters detected by the CMUs with the pack controller. It is solely responsible for cell balancing functionality. An MMU with integrated CMU is usually referred to as “Battery Cell Controllers” or “Cell Supervision Circuits” (CSC).
- Pack Management Unit (PMU): The Pack Management Unit or Pack Controller is the master control unit which uses an isolated internal communication network to interact with the MMUs. It performs major computations, evaluations, diagnostics, control actions, and communication with other E/E systems within the vehicle.
2.1.2 BMS Topologies
The aforestated tiers categorise the BMS based on its functionality into three significant topologies: namely Centralised, Distributed and Modular topology. This categorisation highlights the design cost, ease of maintenance, the precision of measurement, safety levels, etc. of the topology.
2.1.2.1 Centralized BMS
Centralised BMS presents the most straightforward and compact topology available. The PMU, MMU and CMUs are coupled into a single entity on a Printed Circuit Board (PCB). A bunch of wires run from this individual entity towards the cells. Figure 2.3 represents the schematic of a centralised topology for a BMS.
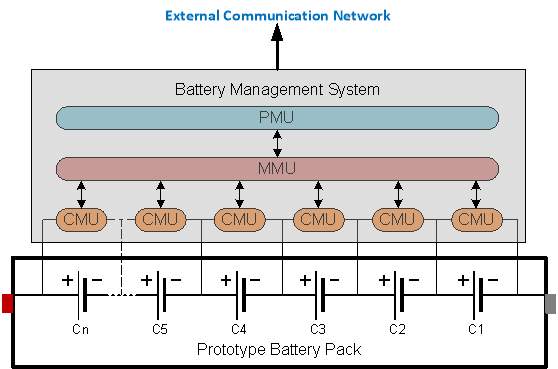
Figure 2.3: Centralized BMS Topology
Benefits of the centralised topology [9] for a BMS include:
- Economic Design: Assembling all the necessary components that constitute a BMS one PCB significantly lowers the design cost.
- Effortless maintenance: Troubleshooting or Replacement of the single assembly is easier than other topologies.
- Compact in size.
However, this topology does involve several limitations [9]:
- Spaghetti wires: The number of wires increases with increment in cells creating complicated cables.
- High Voltage Insulation: The design stands out to be a poor choice in case of high voltage battery packs since the voltage across the BMS would be the pack voltage. This high voltage drop gives rise to complexity in insulation.
- Not Scalable.
Although bound by limitations, this topology finds best fit in low voltage applications such as eBikes where only a few cells are involved.
2.1.2.2 Distributed BMS
The distributed BMS is by far the most complicated topology present where each cell is armed with a dedicated microcontroller. Figure 2.4 represents the schematic of a distributed BMS. The assembly of microcontrollers and CMU is termed the ‘Cell Board’. The cell boards communicate with each other and the PMU. However, some simple implementation of this topology does not demand the presence of a PMU.
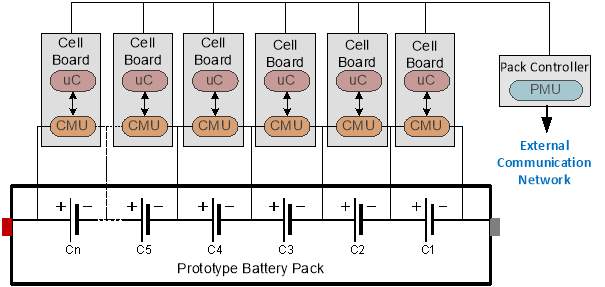
Figure 2.4: Distributed BMS topology
The distributed topology for a BMS offers the following benefits [9]:
- Precision: Dedicated microcontrollers for each cell improves measurement accuracy.
- Reliable connections: Fewer electronics between the measuring unit and the cell improves reliability.
- Low-cost assembly replacements: Cell boards are low-priced and convenient to replace.
- Detailed Troubleshooting: Presence of notification LEDs on the cell boards aids in quick troubleshooting.
- Scalable: The BMS can be transformed to a given requirement by varying the number of cell boards.
Although highly flexible and precise, the distributed topology does bring few disadvantages [9]:
- Cost: Cost stands out to be the primary drawback of this topology. The presence of excess electronic components per cell raises the price.
- Noise: Placement of cell boards directly onto the cells exposes them to a noisy environment which in turn affects their performance.
- High Replacement Labour: The presence of electronics inside the battery pack increases the effort of replacement and further the labour.
Though the distributed topology supports scalability, its high cost makes economically less feasible.
2.1.2.3 Modular BMS
The Modular BMS topology balances the best of centralised and distributed topologies. It consists of multiple MMUs which control certain number CMUs. This composition of MMU and CMUs is termed as “Cell Supervision Circuits” or “Battery Cell Monitors”. Figure 2.5 represents a schematic of a modular BMS where is CSC handles one battery module.
The PMU does not perform any measurement but, handles the overall management and communication with the MMUs to retrieve all cell parameters. The PMU functions as the master and initiates the communication, while the MMUs function as slaves by answering to the master.
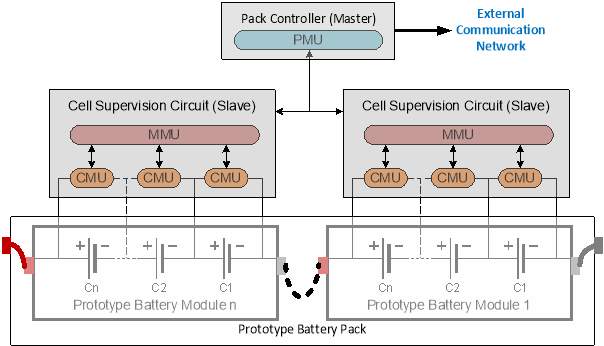
Figure 2.5: Modular BMS topology
The advantages of the Modular topology [9] for a BMS are as follows:
- Scalable: The BMS can be customised based on the requirement by adding or removing modules.
- Immune to noise: Placement of all electronic components away from the cells provides an environment with minimal influence from electrical noise. Any disturbance present in the communication lines between the MMUs and the PMU can be filtered using advanced communication techniques.
- Lower maintenance cost: Positioning the MMUs outside the cells enable uncomplicated replacement of defected MMUs.
- Cost: The cost of devising a modular topology is higher than a centralised topology but less compared to a distributed topology with the same number of cells.
From the points above it is obvious that a modular BMS offers scalability at an affordable price. However, it does carry few drawbacks [9]:
- Precision: The measurementis not as precise as a distributed BMS due to the presence of wire taps and cell balance process.
This topology finds exemplary application in Electric Vehicles (EV). The modular BMS is a perfect trade-off between a centralised BMS and a distributed BMS when scalability is a prime requirement. Hence the Modular BMS is the topology of interest for this thesis. With scalability emerges the need for a scalable communication algorithm which manages an active communication between the master and slave units.
2.2 Battery Cell Controllers
2.3 ISO 26262 Functional Safety
Electronic control systems guarantee a safe and stable operation of various critical functions within the automobile. Any malfunction in a safety-critical component compromises the integrity of the system in consideration. Hence, the safety of Electrical and Electronic systems in the vehicle is of grave concern. The ISO 26262 standard is an extension of the IEC 61508 that addresses the safety of all safety-related electrical, electronics, software, and communication components present in the automobile (Functional Safety) [10].
The ISO 26262 classifies failures into two main categories [10]: namely systematic and random. Systematic failures, which are identified in a deterministic manner is a result of inappropriate methods incorporated during design. Random failures, on the other hand, occur unpredictably during the system lifetime. Permanent faults, intermittent faults, or transient faults are the causes of a random system failure. Failures can be further classified into single-point failure, multi-point failures, cascading failures, dependent failures, and independent failures [10]. The ISO 26262 standard approaches these failures by defining safety goals, and not from their direct impact on the system. The measures derived by employing this standard ensures that the system transits to a safe state after detection of a fault, within the fault tolerant interval, thereby mitigating a hazard. Figure 2.6 shows a relationship linking the occurrence of a fault, fault detection, fault diagnostic time, fault reaction time and the fault tolerant interval set by the standard.
Avoiding damage to an individual and environment signifying one of its key objectives, the safety lifecycle offered by this standard is integrated into various levels of the development process. It provides an automotive-specific risk-based approach to determine the integrity level [11]. The safety lifecycle described according to the standard is shown in Figure 2.7.
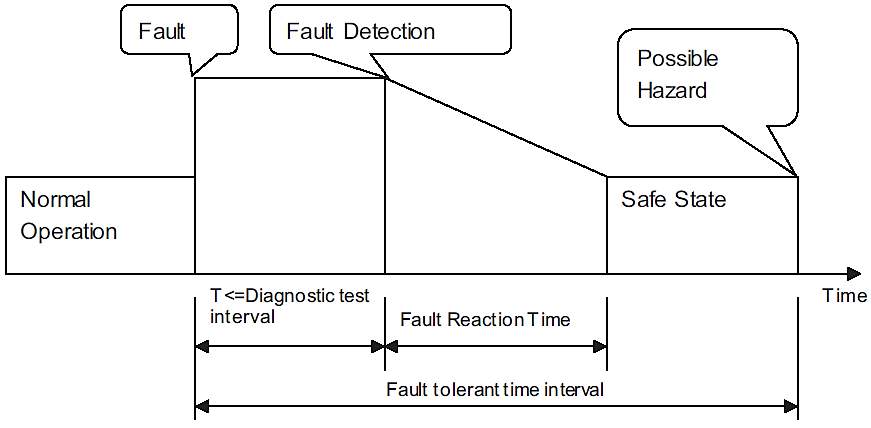
Figure 2.6: Temporal relationships in the context of fault [10].
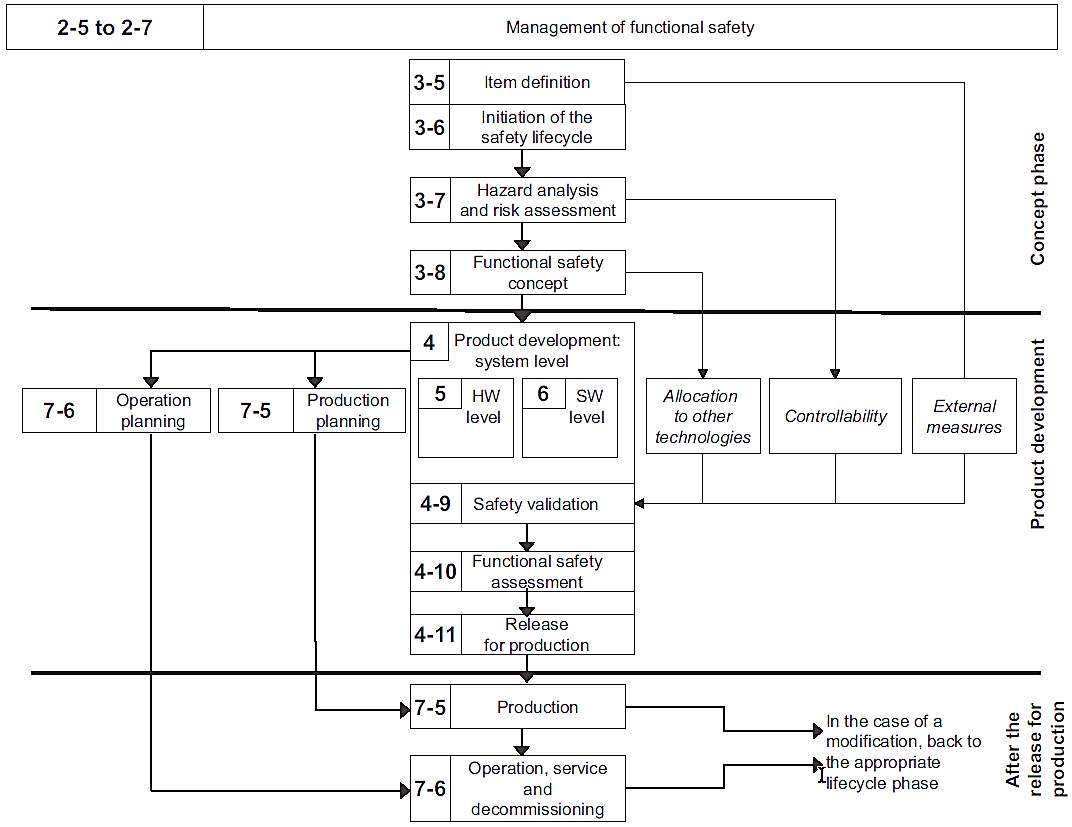
Figure 2.7: ISO 26262 safety lifecycle [11]
The outcome of each step in the safety lifecycle is termed as a work product. A work product then becomes an input to the subsequent step of the lifecycle. The functional safety concept (ISO 26262 Part 3, Clause 8) defined in the concept phase must accomplish the demands stated in the safety goals.
2.3.1 Item Definition
The concept phase according to the ISO 26262 standard opens with the item definition (ISO 26262 Part 3, Clause 5). ISO 26262 specifies an item as a system to which the functional safety standards are applied [12]. Definition of the item determines the scope of development.
Description of the item, its dependencies, and its interaction with the environment are the principal objectives of this step. This step further provides an understanding of the item that serves as a base for the activities in following stages. A block diagram representation of the item indicating its components, tiers, and interactions substantiate great value in establishing concepts.
2.3.2 Initiation of the safety lifecycle
This step intends to provide a clear contrast between new item development and alterations to existing item [12]. In case of a modification, this step also defines the safety lifecycle activities that support the modification workflow (ISO 26262 Part 3, Clause 6). Post analysis of the consequences of the intended modification, this stage provides two work products namely: Impact analysis and the refined Safety plan which are applied to the subsequent stages of the lifecycle.
2.3.3 Hazzard Analysis and Risk Assessment
The Hazzard Analysis and Risk Assessment (HARA) is a critical feature of ISO26262 with an objective to determine the safety goals of the item, thereby minimising the risk to acceptable levels [12] (ISO 26262 Part 3, Clause 7). The operating conditions and operating modes of the defined item are taken into account to identify the hazards. A hazardous situation can be classified based on three measures: namely severity of the event, the probability of exposure to the event and controllability. Section 2.3.3.1 to section 2.3.3.3 explains briefly the measures employed to determine an ASIL. ASIL specifies the ISO 26262 requirements and the safety measures of the item for avoiding the unreasonable residual risks [10].
2.3.3.1 Severity Class
This class reflects the extent of damage to human life as a consequence of a hazard. It is further classified into four subclasses (refer Table 2.1), S0 to S3 where S0 indicates no injury, whereas S3 signifies fatal injuries.
| Severity Class | ||||
| S0 | S1 | S2 | S3 | |
| Description | No injuries | Light and moderate injuries | Severe and life-threatening injuries (survival probable) | Life-threatening injuries (survival uncertain) |
Table 2.1: Classes of severity [12]
2.3.3.2 Exposure Class
This class indicates the probability of occurrence of a hazardous situation under instructed operating conditions. This probability ranges from E0 to E4 as shown in Table 2.2 where each subsequent subclass is higher in magnitude. An Exposure E0 indicates that the occurrence of a specific hazard is notably unusual, whereas E4 denotes a pretty high probability of occurrence of that hazard.
| Exposure Class | |||||
| E0 | E1 | E2 | E3 | E4 | |
| Description | Incredible | Very low probability | Low probability | Medium probability | High probability |
Table 2.2: Classes of probability of exposure [12]
2.3.3.3 Controllability Class
This class reveals the ability of the driver to handle and mitigate the hazard if any has occurred. The controllability rating ranges from C0 to C3 (refer Table 2.3), where C0 indicates the situation can be brought under control, whereas C3 signifies an uncontrollable event.
| Controllability Class | ||||
| C0 | C1 | C2 | C3 | |
| Description | Generally controllable | Simply Controllable | Normally controllable | Difficult to Control or Uncontrollable |
Table 2.3: Classes of controllability [12]
The aforestated measures assist in determining the ASIL level associated with a hazard. Table 2.4 shows the mapping between the three classes of measure and the four ASILs, where ASIL D signifies the highest safety integrity level and ASIL A the lowest. Alongside the four ASILs, class QM is approached through the Quality Management process and requires no compliance with ISO 26262.
| Severity Class | Probability Class | Controllability Class | ||
| C1 | C2 | C3 | ||
| S1 | E1 | QM | QM | QM |
| E2 | QM | QM | QM | |
| E3 | QM | QM | A | |
| E4 | QM | A | B | |
| S2 | E1 | QM | QM | QM |
| E2 | QM | QM | A | |
| E3 | QM | A | B | |
| E4 | A | B | C | |
| S3 | E1 | QM | QM | A |
| E2 | QM | A | B | |
| E3 | A | B | C | |
| E4 | B | C | D | |
Table 2.4: Table to determine ASIL class [12]
Following a systematic evaluation of hazardous events, the safety goals are formulated, and an Automotive Safety Integrity ASIL Level is assigned to each safety goal. The hazard analysis, risk assessment and the safety goals are verified according to ISO 26262 – Part 8, Clause 9 [13] for completeness, consistency, and compliance with the conducted analysis and item definition. The work products: namely HARA, Safety goals, and verification review resulting from this stage are used to derive the functional safety requirements.
2.3.4 Functional Safety Concept
Utilizing the safety goals stated in section 2.3.3, the prime objective at this stage (ISO 26262 – Part 3, Clause 8) is to derive the Functional Safety requirements (FSR) [12]. These are technology independent properties carrying ASIL information and associated with safety goals. The FSRs are allocated to components specified as part of item definition (refer section 2.3.1). Every safety goal is specified with at least one FSR. The Functional Safety Concept ensures that the occurrence of a fault does not violate the safety goal, thereby retaining the defined item in a safe state. Furthermore, it handles reporting of the detected fault(s) to another system (s) (items) to keep the risk exposure time at an acceptable level. Figure 2.8 represents the hierarchical method by which the FSRs are determined from the safety goal.
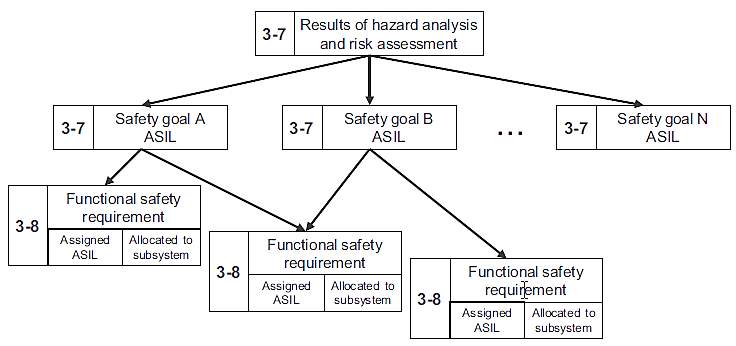
Figure 2.8: Mapping of safety goals and FSRs
The FSRs determined at this stage are verified according to ISO 26262 – Part 8, Clause 9 [13] for consistency and compliance with safety goals and their ability to mitigate the evaluated hazards. The functional safety concept and its verification reports stand as work products at the end of the concept phase.
2.3.5 Product Development at System Level
The prime objective of the product development at a system level is to determine the functional safety activities during various phases of system development (ISO 26262 – Part 4, Clause 5) [14]. Technical safety requirements (TSR), system architecture, and Hardware-Software Interface (HSI) are planned at this stage. The developed hardware and software are integrated and tested at item level before vehicle level integration[1].
Specification of TSRs from the FSRs determined in section 2.3.4 is a crucial step in product development (ISO 26262 – Part 4, Clause 6). The TSRs refine the functional safety concept based on preliminary assumptions. They are the technical requirements obligatory in implementing the functional safety concept. Every FSR is associated with at least one or more TSRs. These are later assigned directly to hardware and software solutions. Figure 2.9 represents the hierarchical method of refining FSRs by linking then to TSRs.
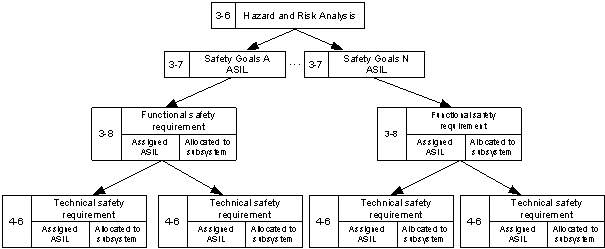
Figure 2.9: Mapping of TSRs to FSRs
Specification of safety dependencies between systems or components of the defined item, chosen safety mechanism, technical safety during various life-stages[2] of the item, and verification and validation against the functional safety concept and preliminary assumptions are handled under specification of technical safety requirements. The specified TSRs, system verification report according to ISO 26262 – Part 8, Clause 9 [13] and the refined validation plan are the work products passed on to the subsequent stages.
2.3.6 Product development at hardware Level
2.3.7 Product development at software level
2.4 Checksum
The presence of interferences and channel noise in the communication medium result in delivery of corrupted data to the receiver. Hence, error detection techniques are applied to improve the reliability of data transmitted across communication channels. Cyclic Redundancy Check (CRC) is one such error detecting technique which can identify unanticipated changes to raw data in communication and storage devices.
Peterson and Brown demonstrated the representation of binary digits as coefficients of a polynomial (refer equation 2.1). This representation makes it convenient to analyse and manipulate the polynomial (binary digits) from the viewpoint of elementary algebra[3]. The theorems proved as part of their work benefits in the detection of single, double, triple and burst errors that occur during data transmission [15].
=114 0 0 0 110 0 0 0 16 15 0 13 0 0 10
2.4.1 CRC Principle
The principle behind CRC computation is polynomial division. For an information polynomial
G(X),
Xn-kGXis divided by a generator polynomial
P(X), yielding a quotient
Q(X)and a remainder
R(X)where
kdenotes the number of bits in the information code while
ndenotes the number of bits in the encoded code. Equation 2.2 represents the polynomial division.
Selection of the generator polynomial plays a significant role in the CRC implementation because the transmitter and the receiver must both agree upon the same generator polynomial. The remainder obtained as part of long-division becomes the CRC for an information polynomial. Hence, the encoded polynomial
F(X),
nbits long, represented by equation 2.3, is the polynomial sum of
Xn-kGXand the remainder obtained. These check bits are a redundancy because they do not alter the value of the information bits.
The transmitter usually generates the CRC bits, and the receiver uses these bits to the integrity of the received data. Since CRC is the remainder obtained from a polynomial division, dividing the encoded polynomial mentioned in equation 2.2 by the generator polynomial
P(X)at the receiving end must return a remainder equal to zero. Any discrepancy in data during transmission results in a non-zero remainder at the receiver end indicating an error in communication. The concept of CRC generation and validation is explained in Example 1.
An information polynomial
X5+ X2+1should be encoded by a generator polynomial
X3+ X1+1. Consider
n=8and
k=4.
- Degree of the information polynomial is greater than the generator polynomial.
- Transforming the information polynomial:
X8-4.X5+X2+1= X9+X6+X4
- Therefore, a polynomial division of the transformed information polynomial with the generator polynomial yields:
X9+X6+X4=X6+X4+X2+1.X3+ X1+1+X2+X+1 (2.4)
- Comparing equation 2.4 and equation 2.2:
- The encoded polynomial according to equation 2.3, equation 2.5 and equation 2.6 is:
FX=(X9+X6+X4)information Polynomial+X2+X+1CRC
(2.7)
The encoded information code is transmitted to the receiver, where it is decoded using the same generator polynomial.
- The polynomial division of the encoded polynomial with the generator polynomial yields no remainder as shown in equation 2.8.
FX=X6+X4+X2+1.X3+ X1+1+0 (2.8)
- A zero remainder in equation 2.8 verifies the integrity of the data received.
2.4.2 CRC Implementation in Hardware
The remainder returned after polynomial division is of keen interest in CRC generation and validation. Modulo two arithmetic and disinterest in the quotient simplifies the polynomial division to a great extent. Hence, the polynomial under modulo two addition is realised in hardware shift registers and XOR gates. An XOR operation implements modulo two arithmetic. The size of the shift register depends on the degree of the generator polynomial. The information polynomial is right shifted through this shift register in an MSB first format. A shift register for dividing an information polynomial by a generator polynomial
X3+ X1+1is shown in Figure 2.8.
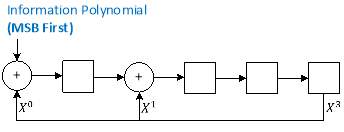
Figure 2.10: Shift register for CRC generation and validation
2.4.3 CRC Implementation in Software
The generation and validation of CRC mentioned in section 2.4.2 are, not efficient techniques when implemented in software [16]. The computation of encoded code with an 8-bit generator polynomial for a 32-bit information polynomial requires 40 shift operations and at most 40 XOR operations. This intense computation turns out to be time-consuming, resource draining, and inefficient.
Look-up table based method for generation and validation is usually implemented in software. This method reduces computation time by a significant margin. For an 8-bit generator code, the remainder obtained after dividing
2nvalues ranging from
0to
2n-1, are precomputed and stored in a table, i.e. CRC table. The information code can now be processed byte by byte thereby reducing processing time. Hence, calculation of CRC for 32-bit information code encoded using an 8-bit generator code requires 4 XOR operations and 4x referral to the look-up table. An efficient technique to compute the CRC for a 4 byte information polynomial is represented below:
- Assume an initial value for the CRC as shown in equation 2.9. This value is termed as the CRC seed value.
- Perform an XOR operation, i.e. modulo two addition between
initCRCand
Byte0(see equation 2.10). The outcome of this operation is the
crcIndex, which assists in obtaining the remainder from the look-up table.
crcIndex1=initCRC ⊕Byte0 (2.10)
tempCRC1=crctable[crcIndex1] (2.11)
- An XOR operation is then performed with the result obtained in equation 2.11 the next data byte. The result of the XOR operation acts as an index to the CRC table. These steps are iterated (refer equation 2.12 to equation 2.16) until the CRC index for the last data byte is determined.
crcIndex2=tempCRC1⊕Byte1 (2.12)
tempCRC2=crctable[crcIndex2]
(2.13)
crcIndex3=tempCRC2⊕Byte2
(2.14)
tempCRC3=crctable[crcIndex3]
(2.15)
crcIndex4=tempCRC3⊕Byte3 (2.16)
- The value retrieved from the CRC table (see equation 2.17) using the
crcIndexof the last data byte provides the CRC of the whole information code.
CRC=crctable[crcIndex4] (2.17)
7 Bibliography
| [1] | E, Karden; P, Shinn; P, Bostock; J, Cunningham; E, Schoultz; D, Kok, “Requirements for future automotive batteries – a snapshot,” Journal of Power Sources, vol. 144, pp. 505-512, 2005. |
| [2] | G, Richter; E, Meissner, “Vehicle electric power systems are under change! Implications for design monitoring and management of automotive batteries,” Journal of Power Sources, vol. 95, pp. 13-23, 2001. |
| [3] | M. Ceraolo, T. Huria, G. Pede and F. Vellucci, “Lithium-ion Starting-Lighting-Ignition Batteries:Examining the feasibility,” IEEE Vehicle Power and Propulsion Conference, pp. 1-6, 2011. |
| [4] | A. D. Pasquier, I. Plitz, S. Menocal and G. Amatucci, “A comparative study of Li-ion battery, supercapacitor and nonaqueousasymmetric hybrid devices for automotive applications,” Journal of Power Sources, vol. 115, pp. 171-178, 2003. |
| [5] | Bosch Automotive Electrics and Automotive Electronics, 5 ed., MA: Bentley Publishers, 2014. |
| [6] | C. Messina, “7 Facts Comparing Lithium-ion With Lead Acid Batteries,” RELI3ON, 29 August 2015. [Online]. Available: http://www.relionbattery.com/blog/7-facts-and-figures-comparing-lithium-ion-vs.-lead-acid-batteries. |
| [7] | B. Scrosati, J. Garche and W. Tillmetz, Advances in Battery Technologies for Electric Vehicles, Woodhead Publishing, 2015. |
| [8] | M. Brandl et al., “Batteries and Battery Management Systems for Electric Vehicles,” Design, Automation & Test in Europe Conference & Exhibition, pp. 971-976, 2012. |
| [9] | D. Andrea, “BMS Topologies,” in Battery management Systems for Large Lithium-Ion Battery Packs, Noorwod, MA, Artech House, 2010, pp. 44-49. |
| [10] | International Organization for Standardization, “Road vehicles — Functional safety — Part 1: Vocabulary,” ISO, 2011. |
| [11] | International Organization for Standardization, “Road vehicles — Functional safety — Part 2: Management of Functional Safety,” ISO, 2011. |
| [12] | International Organization for Standardization, “Road vehicles — Functional safety — Part 3:Concept phase,” ISO, 2011. |
| [13] | International Organization for Standardization, “Road vehicles — Functional safety — Part 8: Supporting processes,” ISO, 2011. |
| [14] | International Organization for Standardization, “Road vehicles — Functional safety — Part 4: Product development at the system level,” ISO, 2011. |
| [15] | W. W. Peterson; D. T. Brown, “Cyclic Codes for Error Detection,” Proceedings of the IRE, vol. 49, no. 1, pp. 228-235, January 1961. |
| [16] | S. Sheng-Ju, “Implementation of Cyclic Redundancy Check in Data Communication,” 2015 International Conference on Computational Intelligence and Communication Networks (CICN), pp. 529-531, 2015. |
[1] Not a point of interest for this thesis
[2] Production, operation, maintenance and decommissioning
[3] Exception – Addition requires modulo two [15]
Cite This Work
To export a reference to this article please select a referencing stye below:
Related Services
View all


Related Content
All TagsContent relating to: "Electronics"
Electronics regards the science and technology involved in the development of electrical circuits and electronic devices and equipment that use them.
Related Articles

DMCA / Removal Request
If you are the original writer of this dissertation and no longer wish to have your work published on the UKDiss.com website then please: