Internet Privacy and User Awareness of Vulnerabilities
Info: 9876 words (40 pages) Dissertation
Published: 23rd Jun 2021
Tagged: Cyber Security
An Investigation into Behavioural Clustering Models to develop an enhancement into online privacy concerns
Abstract
The following report explores the world of internet privacy and aims to raise awareness to the vulnerability that users face when browsing online. As well as highlighting the risks associated with the exchange and sharing of personal information, measures to reduce these risks will also be explored. The purpose of this project is to outline and raise awareness to the importance of having a clear and educated choice into publishing personal information online.
Many advertising companies incorporate cookies as a form of tracking the online activities of their customers, as a means of enticing customers to return by publishing personalised adverts catered to their purchasing behaviours. Although cookies are placed on most online websites, a vast majority of web users are unaware of their purpose and intention. A primary research survey collected the results of 82 respondents which showed 39% of web users to have no clear idea into what the reasoning behind a cookie was.
An online cookie essentially follows the web user through each website visit they make, which can be interpreted as collected the users web history over time. The web history of an individual has the potential to reveal a range of personal information about the user, whether it be their most frequently visited sites or the hours in which these visits are being made. With this in mind, the Safari web history of two users was mined and analysed and finally classified into clusters of text, which had been extracted from the titles of the visited web pages. Each cluster reveals private information about the user, for example, user 2 was found to be a resident of San Francisco, with a keen interest in children’s toys.
Table of Contents
Proposed System & Requirements
Term Frequent – Inverse Document Frequency (TF-IDF)
Appendix (unlimited words plz)
Introduction
Context behind the problem
Buchanan et al. (2007) describe today’s technology to be similar to that of a double-edged sword, where although it enriches our lives it also raises new concerns in regards to the privacy of our personal information. The past 10 years have shown the internet to be an important and essentially vital part of day to day life in the millennial wold (Ibid). Although the new generations seem to have no issues with accepting the digital era, older generations are struggling to adjust. What most have disregarded is the reason as to why the struggle to adjust even originated to begin with; lack of information and knowledge about the internet makes such a user vulnerable when browsing online, which would seem like the perfect target audience.
Popular social media sites like that of Facebook and Twitter create a platform whereby users can express their opinions and build their own online profile. The act of openly publishing personal information online could be thought of as subsequently allowing online web crawlers and targeted marketing applications the right to access the privacy of our daily web searches.
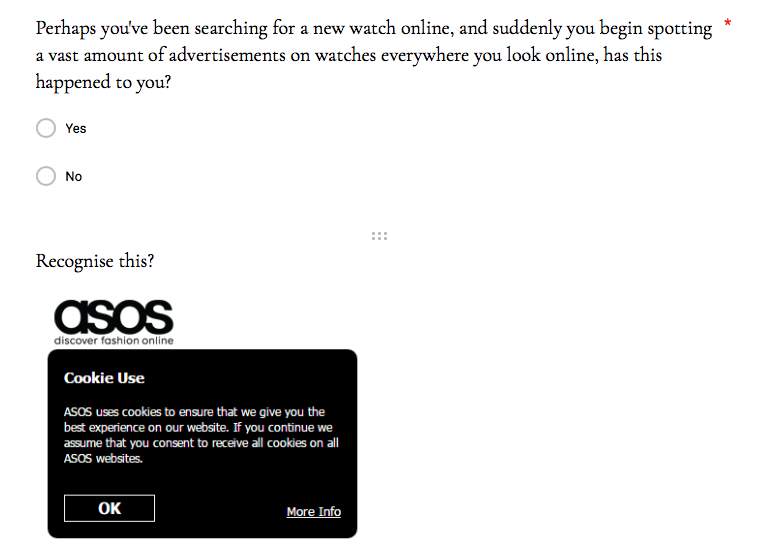
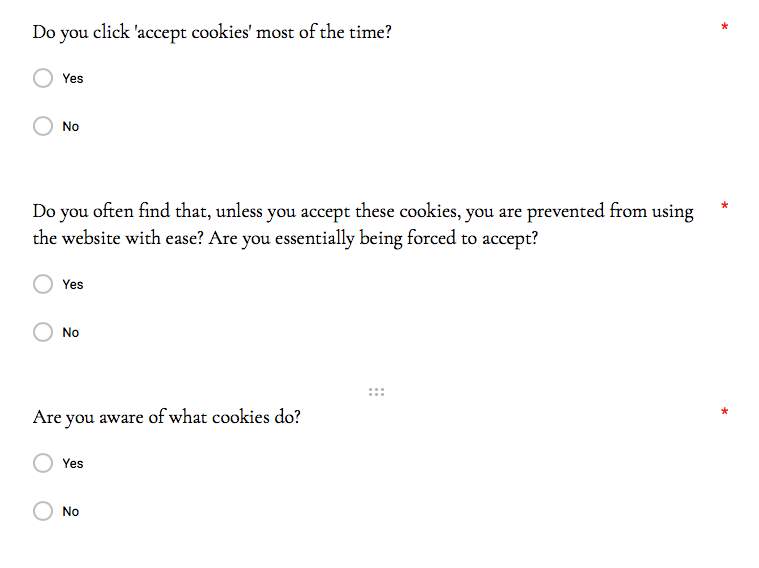
What many online users are not aware of is the exact vulnerability that they place themselves in each time they accept cookies on a website. Admittedly, on most occasions these cookies are just designed for personalised advertising and marketing, however, the question must be raised that if it is that easy for a company to access our information, it must be just as trivial for someone with an ulterior motive. The main question of concern is that, if each web user were fully aware and knowledgeable in how private information is sold and shared online, would their choices have been different when either accepting a cookie or publishing their information? Some websites even go as far as to essentially force the user to accept a cookie, by blocking the view of the page unless it has been accepted. This kind of manipulation seems to speak for itself. It seems as though while the public remain unaware, the advertising companies are reaping all of the benefits.
Approach & Objectives
The overall objective is to create a browser extension whereby the user would have the ability of viewing their browsing activities in a way that a marketing company would with the use of cookies. This report focuses on the mechanics behind the extension, and demonstrating the implementation and technical approach taken to achieve the relevant results.
The underlying motivation for the creation of the system is to demonstrate the capabilities that these marketing companies have when it comes to deducting information from the collected browser history of each of their consumers. As well as this, the main intention is to raise awareness and increase the level of common knowledge that the average web user has when it concerns sharing their personal information online.
The Safari web history of two individual users will be compared and explored for contrasting characteristics. The study will aim to explore the possible traits that each user presents through their daily browsing activities. In doing so, the study will aim to highlight the vast amount of private information that can be deduced from the analysis of a user’s browsing history.
The main, distinguishable feature between the two history databases is the relative size. Specifically, the web history file corresponding to user 1 contains a total of 10,900 rows, whereas that of user 2 amounts to 25,130 rows. The difference in size allows for a deduction to be made as to how much data is required for a reliable analysis to be made about the corresponding individual.
Once the necessary datasets have been collected from the databases the next stage pre-processes the data into a comprehendible and manageable format. The initial approach is to undertake an exploratory analysis which will build the foundation upon which any queries and insights could be taken from. From this, the dataset containing the titles of each visited web page can then be text mined, from which TF-IDF scores can be calculated and finally clustered to reveal information about the user by applying the K-Means algorithm.
Literature Review
Privacy
Over a decade ago, direct vendors were amid the limited selection of businesses to track and examine the characteristics and purchases made by consumers by utilising computer databases (Phelps, Nowak and Ferrell, 2000). Fast forward to today, it has become somewhat of a business norm to routinely analyse the online purchasing behaviour of each individual consumer (Ibid). Phelps, Nowak and Ferrell (2000) further explain how recent surveys have shown consumers to be concerned around the magnitude of information that companies may know about them, how accurate the information might be and a raised concern as to how that information may have been obtained to start with.
Clifford and Van Der Sype (2016) similarly argue that there has been an increasing amount of online users, due to the abundance of internet access as well as the growth of computing capabilities. Social networking sites, like that of Facebook, Twitter, and many others, propose their online services as ‘free’ but behind the scenes there is a trade agreement whereby access to personal data and information is exchanged for the usage of the site (Ibid). It could be argued that there is no harm in sharing one’s personal information so freely, however, Clifford and Van Der Sype (2016) further explain how there have been an increasing amount of reported exploits of private information made by these services. This raises great concern relative to the efficiency of the currently applied mechanisms that are there to ensure a safeguard for personal data (Ibid). Phelps, Nowak and Ferrell (2000) explain how an increasing amount of consumers are supporting privacy protection measures, which includes restrictions on the exchange of information.
Although many consumers have shown to be increasingly concerned towards the protection of their online information, their online purchasing behaviour has not altered (Ibid). Online web users have also been found to willingly partake in a consumer society, at the expense of their personal information (Ibid). However, Buchanan et al. (2007) highlight that many online consumers provide false information, whether it be as simple as providing their name. The emphasis here is not on the information being provided, but what is done with that information, and the awareness the consumer has in the latter. There appears to be a common threshold that most web users do not cross when it comes to the sharing of their personal details. A few studies have implied that online users are less concerned with providing demographic and lifestyle related information and considerably more protective when asked to provide financial information and personal identifiers (Phelps, Nowak and Ferrell, 2000).
As well as the supposed harmless tactics to obtain a user’s personal information, intentionally detrimental ways occur on the other end of the spectrum. Pittaro (2007) describes a cyber stalker to be an online user who facilitates the internet as a means of instigating distress and unease towards their target victim, accompanied with the use of “sophisticated tactics” which in many situations are legally acceptable. Brokerage websites allow internet users to search for lost loved ones or friends, most of the time this service is free of charge but a small fee may sometimes apply (Ibid). These online services provide the user with confidential details such as a person’s name, date of birth, social security number and other private details which further provides cyber stalkers with another trivial method of obtaining information about their victim (Ibid).
Gorman and McDonald (2012) explain ransomware to be a type of malevolent software which essentially disables the overall usage of a computer. Most commonly, the ransomware program will present a message that demands a ransom payment in order for the computer to be restored to full functionality (Ibid). This is an example of extreme, illegal violation of online privacy.
Behavioural Tracking
Behavioural tracking is also known as targeting and profiling and it entails the collection and analysis of data retrieved online which is in turn transformed into knowledge (Castelluccia, 2012). Searching for identifying patterns in the collected data is what is most often referred to behavioural tracking (Ibid). Behavioural tracking is used to track the behaviour of online web users over time and to build profiles based on the collected information to reveal the characteristics, interests and even online purchasing activities on the targeted individual (Ibid). This allows advertising companies the ability to personalise online adverts that effectively appear in the user’s daily web searches (Ibid).
Following users through their visited sites is mainly executed through the use of cookies, javascripts and supercookies (Ibid). Castelluccia (2012) explains that there are two types of web cookies, them being session and persistent cookies and further describes a web cookie to be a segment of text that is stored by a user’s web browser and that is linked to a HTTP request. To elaborate, session cookies are regularly used to collect user preferences, but the type of cookie in itself is known to be impermanent (Ibid). On the other hand, persistent cookies are quite the opposite in the sense that the files linger in the user’s browser until they expire or are specifically removed, and essentially act as authentication tokens to maintain an online session with the server in question (Ibid). Bielova (2013) explains that the HTTP(S) protocol associated with cookies is stateless, which effectively means that the origin of two HTTP requests cannot be identified as to having been originated from the same matching client or not. The only suitable action to take in this scenario would be to put separate mechanisms in place to track the individual clients (Ibid).
Websites have to be able to differentiate one user from another in order to have the ability to track them individually (Ibid). A unique identifier is stored in a user’s browser cookies and whenever that same user returns to the website in question, the cookies are sent and thus the individual user can easily be established (Ibid).
According to Castelluccia (2012), Javascripts have the ability to access information such as cached objects and the history of links that have been visited, all of which are stored in the browser. By combing both the cookies and results obtained from the JavaScript execution, information can be easily obtained which would include a client’s IP address, email address and even language preference (Ibid). Bielova (2013) explains that the list of URLs that have been visited by a user are not permitted to be accessed by the JavaScript code, due to privacy concerns. However, a recognised technique does exist whereby visited links are presented differently in comparison to those unvisited; Cascading Style Sheets (CSS) (Ibid).
A “Flash Cookie” is a type of web cookie supported by the popular Adobe Flash plug-in, which is also one of the most major Supercookies that are known of (Castelluccia, 2012). One of the most disconcerting features of Supercookies is that they are implicitly stored outside of the web browser’s control, meaning that users have no means by which they could remove or even be aware of the cookie in question (Ibid). As mentioned earlier, standard cookies can eventually expire but this is not the case for Supercookies.
Exploratory Analysis
Exploratory analysis is a vital element of statistical analysis, whereby initial observations and deductions can be made from a dataset. It allows the user to get an overall sense of the data as well as raise new questions in relation to the attributes of the dataset and emerging patterns. As is often the case with Big Data, it is the anomalies in a dataset which often reveal vital information about the data. The exploration is mainly done with the use of graphical visualisations which further cater towards pattern discovery.
In relation to this particular study, the extracted datasets are explored to unveil the users most frequently visited websites, the times in which their searches are more frequent and also their daily number of website visits. These simple calculations allow for initial assumptions to be made about each user which are noted and kept in mind when running future, more complex, algorithms. Once the initial exploration of the data was complete, the next stage was to explore and decide upon the way in which the collected date would be grouped into a comprehendible format, by which would also be user interactive in future.
Machine Learning
Machine Learning algorithms are typically split into two learning groups; supervised and unsupervised. Among the two, supervised learning is the more frequently used type between the two. Some well-known algorithms falling under this group type are Linear Regression, Logistic Regression, Naïve Bayes, K-nearest neighbour, Neural Networks and Decision Trees.
Supervised learning algorithms can be applied to a dataset when there is a known target variable of interest. The original dataset is split into train and test sets and the chosen model is trained so that it can learn how the values of the target attribute alternate given the values of the training set. The trained models are then applied to predict the outcome of the target attribute in future events.
The datasets based on the history of the web users have no specific target variable, thus the appropriate approach to take was to apply an unsupervised learning algorithm. Unsupervised learning is the second group in which most Machine Learning algorithms are grouped in to. Some of the corresponding algorithms belonging to this group are K-means, Hierarchical Clustering and Mixture Models. Applying unsupervised learning algorithms to datasets of a large dimension can be known to reveal new insights that may otherwise remain unknown. These algorithms are typically applied where humans have inadequate knowledge in regards to the underlying mechanisms of a problem. Clustering is a class of methods that are usually used for the organisation of data into a set of clusters (groups) such that the objects or items in each cluster share similarities with each other and distinguishable differences with items belonging to other clusters.
Trevino (2016) explains how K-Means clustering is applied to unlabelled sets of data with the end goal of discovering groups in the data. The variable K represents the number of clusters, from which the model applies iterations to allocate each data point to one of the clusters (Ibid). These allocations are made based on the similarities that a data point shares with the other points of that cluster (Ibid).
K-means clustering algorithm methodology:
- Input: K, set of points
x1,x2,…,xnwhere n is the total number of data points, which in this case is the total number of terms computed over all titles and the corresponding TF-IDF scores, and K is the number of clusters.
- Place centroids
c1,c2,…,ckat random locations
- Repeat this until convergence is reached
- For each data point
xi:
- Compute the Euclidean distance between the instance
xiand the cluster centre
cj. Assign the data point to cluster j.
Euclidean Distance=argminjD(xi,cj)
- For each cluster j where j = 1…K :
- Calculate the new mean of all points
xithat have been assigned to cluster j
cja=1nj∑xi→cjxi(a) for a=1…d
- STOP when the assignments of each cluster no longer change
The computation time for K-means clustering is O(
Text Mining
The implementation chapter of this report will outline the exact procedure taken to manipulate raw text data into a format in which an algorithm can more easily comprehend. Text mining is the process of obtaining knowledge and complex patterns from documents of text, oftentimes also referred to as knowledge discovery (Tan, 1999). Naturally, the storage of information is most commonly done in text format, yet it is a more challenging discipline than that of Data Mining (Ibid). Tan (1999) further explains that there are mainly two components that make up the structure of text mining, these being Text Refining and Knowledge Distillation. Text Refining is described to be the process of converting text documents of a raw format into immediate form, which is then used to uncover patterns and insight into the text document, respectively known as Knowledge Distillation (Ibid). The process essentially transforms text from being in an unorganised state into an organised state, from which important features can be extracted and analysed accordingly.
Feinerer, Hornik and Meyer (2008) further explain typically used applications in text mining, which include the classification and clustering of documents. For instance, document clustering includes the grouping together of items that share similarities, such as grouping news articles or movies of similar genres (Ibid). On the other hand, the classification of documents is used to categorise text, commonly applied in the filtering of e-mails when identifying whether an email is spam or not (Ibid). Feinerer, Hornik and Meyer (2008) also describe more inventive techniques of text mining that have been applied, including analysing the writing style of an author to discover the probability that a certain text was written by them.
The titles of each users visited web pages were extracted and saved into csv files, from which they could be uploaded into RStudio and text mining techniques were applied. This was a necessary step as the text file must be in a clear and concise format, one which would condone the implementation of calculating the TF-IDF scores of each term.
TF-IDF
Term Frequency (TF) provides the user with the frequency of each word in a given text or document which is in turn divided by the total number of words or terms in the document (FreeCodeCamp, 2018). The official mathematical formula is given below:
Term Frequency= tfa,b=na,b∑kna,b
Inverse Document Frequency (IDF) is effectively used to compute the weight or amount of infrequent words in the given document. Respectively, the terms that appear most rarely have a higher IDF score than those who appear more frequently. The official mathematical formula is as follows:
Inverse Document Frequency=idfw=logNdft
Combining the above frequencies gives the overall TF-IDF score in a given document:
wa,b=tfa,b×logNdfa
where tfa,b=number of occurences of a in b
dfa=number of documents that contain a
N=total number of documents
Primary Research Survey
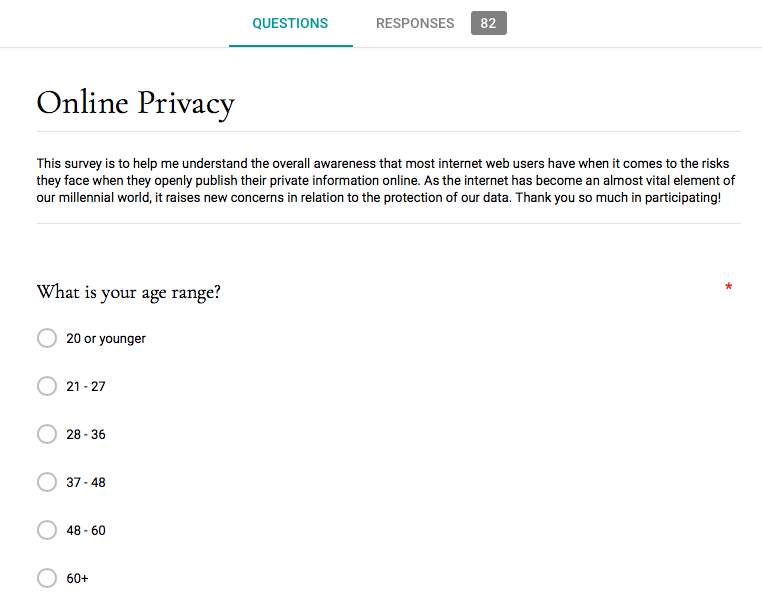
When conducting the initial primary research, the target audience for the survey had to be entirely mixed in terms of their overall computing capabilities and understanding. The main purpose of the survey was to understand what the target market were most concerned about, in regards to the protection of their personal data, and how aware they actually were of the risks of actively publishing their information online. The survey was created and built using Google Forms, which allowed for reaching a wide audience. A total of 82 responses were submitted for the survey.
The first question in the survey provided interesting results into the age-range of the respondents. With the highest percentage, 32.9% of respondents were between the ages of 37-48, and 28-36 year olds formed the next 28% of total respondents. As can be seen via the screenshot below, the number of respondents aged between 21-27 and 48-60 were about the same. Both ends of the age spectrum were amid the few of that age bracket to submit the survey. The next question confirmed that 81.7% are female and the remaining 18.3% male.
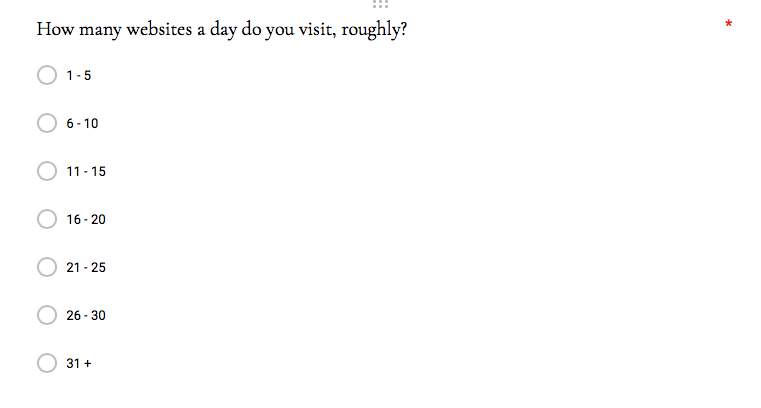
The next question posed was based on the average number of daily visits to websites. Most of the respondents claim to only visit 6-10 websites a day, forming 35.4% of the group, with the next highest at 28% claiming to visit a mere 1-5 websites a day. Those who claimed to visit at least 21+ websites a day only formed 13.4% of the total number of respondents.
When asked about personalised advertising and pop-up advertising relating to their previous online purchasing history, 93.9% of respondents confirmed that they had recognised this form of advertising in the past. The results to the next question showed that almost half of the online users confirmed that they did indeed accept pop-up cookies on most occasions. As mentioned earlier, many sites often place large pop-up notices upon entering their site to encourage the user to accept their cookie, to which 72% confirmed that they felt as though they were largely manipulated into accepting.
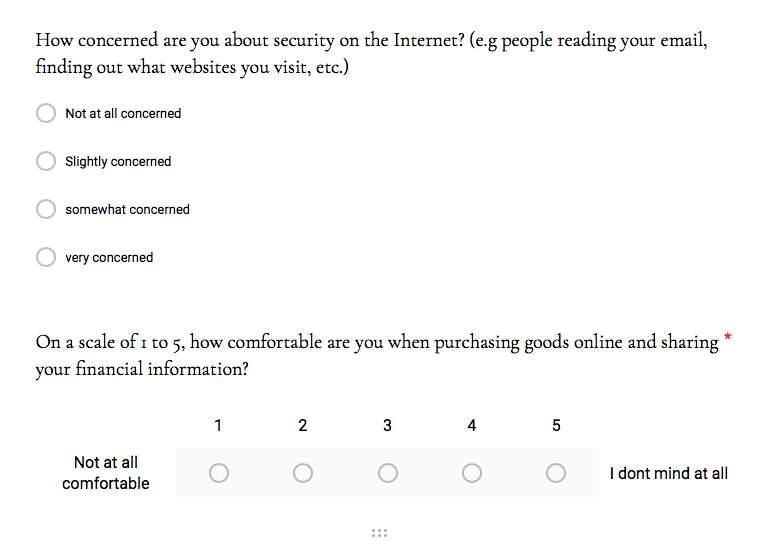
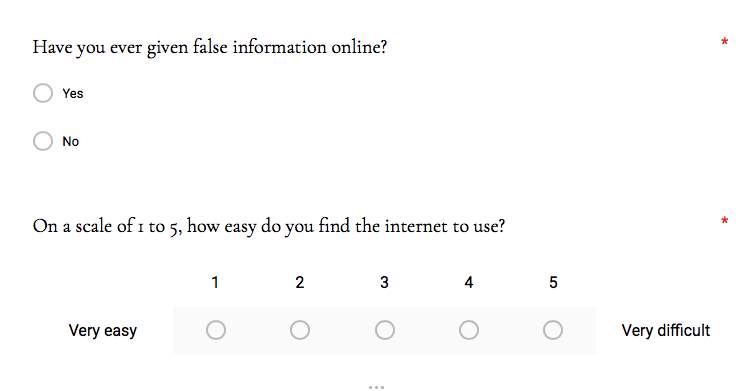
Although many users may accept these cookies, whether willing or not, an impressive 61% from the survey were aware of the purpose of cookies and what they do. When asked about their level of concern towards their personal security on the internet, 41.5% claim to be ‘somewhat concerned’ and only 9.8% are ‘not at all concerned’.
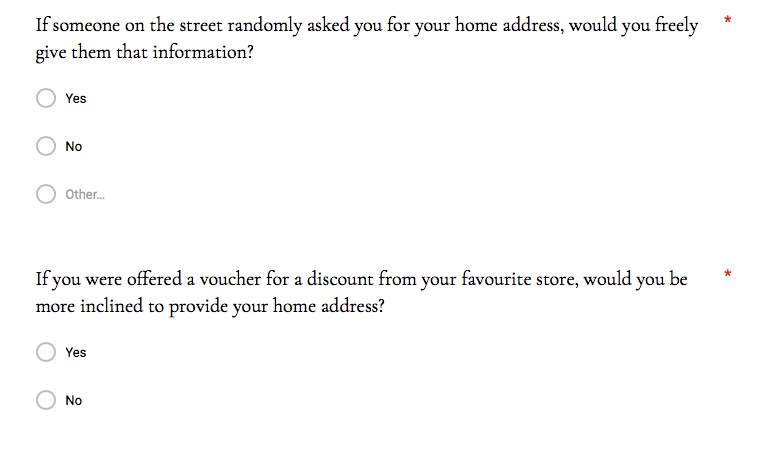
Providing information online versus a stranger on the street can feel as though they are two completely separate scenarios, however, the potential consequences remain the same. This question was put forward in the survey, where 100% denied that they would provide their home address to a stranger on the street. However, when informed that in exchange for this private information they will hypothetically receive a discount from their favourite store, 41.5% of the respondents confirmed that they would comply. It is this exact method and technique that online marketing agencies are exhausting when targeting their audience. On many occasions, a frequent online user will be offered a 10% discount, for example, if they were to provide their email address before purchasing their goods.
Market Research
- Compare plug ins
- How will mine be different
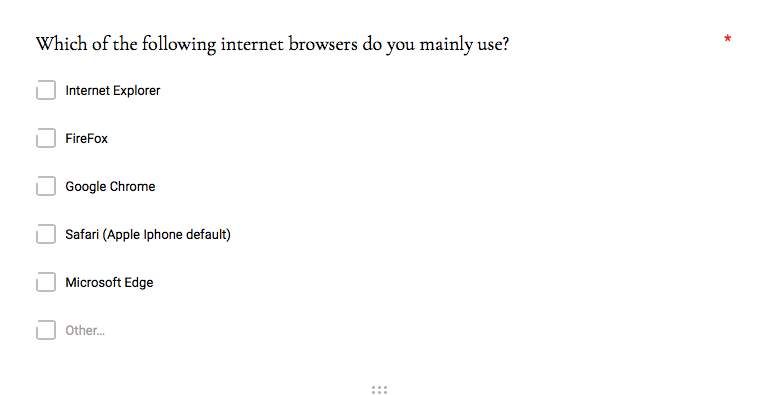
There are many downloadable plug-ins and extensions available on the market that aim to essentially provide the user with more control into their online browsing experience. From the primary research survey conducted, most respondents confirmed that their most popular browser to use is Google Chrome, thus the following research was based on extensions currently available in the respective market.
EditThisCookie is a Chrome extension created by Francesco Capano in 2014 which offers the user a variety of features such as deleting, searching, editing and even creating cookies. The successful extension is currently being used by over 2.5 million users as of August 2018, according to the Chrome Web Store. The extension itself mainly focuses on giving the user more control over the cookies that are obtained over time. Capano (2014)
Who Targets Me? is a free downloadable software, founded by Same Jeffers and Louis Knight-Webb in 2017. The browser extension was initially created with the purpose of creating awareness into personalised advertising, specifically to Facebook users. The user is advised to create an anonymous Facebook profile and to act accordingly as a standard user of the social network. The software actively collects the adverts that have been posted on Facebook and authorises the user to view a personalised breakdown of the political posts and provides information as to why the user may have been specifically targeted with that advert.
Proposed System & Requirements
The downloadable extension will be created for the purpose of Google Chrome, as it was confirmed to be the most popular browser used by internet users. With many users having highlighted their concerns towards their online privacy, the extension will allow them to interact and view their searching habits, collected over periods of time. As well as this, the titles of each visited web page will be collected and algorithms will be implemented which will essentially provide each user with an overview of what their searching habits unveil about them as individuals.
The logo for the extension will be used as an icon which will be found in the upper right hand corner of the Chrome toolbar, as shown below.

Figure 1: Logo, created by author

Figure 2: Logo as it would appear in the Google Chrome toolbar [screenshot by author]
Upon clicking on the icon itself, a new tab will open in the browser which will take the user to the dashboard page of the extension. On reaching this page, the users top 20 most frequently visited websites will be illustrated in the form of a bar graph. The user will also have the option of selecting the number of top viewed websites that they wish to view, for instance, by selecting ‘Top 30’ from the available drop-down menu. This interactive interface allows the user to have more control in the system and in how they view their browsing habits.
The user will also be able to inspect their average time spent on the net, with the additional choice in whether the line graph represents daily, weekly, or monthly averages.
The primary section of the dashboard will be a section whereby the user clicks on a button, prompting the system to output a selection of groups that share similarities. Specifically, these similarities are calculated with the use of TF-IDF scores and by implementing the K-Means algorithm, which is demonstrated in the implementation chapter of this report. The user will actively be able to select the number of groups or clusters that they wish to view. Each group will contain terms that are most similar to each other, which will effectively contain terms that indicate the geographical location, gender, employment status and interests of the individual.
The combination of the above will provide the user with an overall deeper understanding into what their browsing activities would appear to be from the view of an outsider.
| Functional Requirements | |
| What the system will do and the inputs and outputs that are relevant in each case | The action taken by the model |
| Collect the titles of each visited web page | Allows for TF-IDF analysis and the clustering of like terms |
| Collects the time at which each corresponding web page is visited | Collects information for the analysis of typical browsing times and overall amount of time that the user spends on the web |
| Collects the URL of each page visit | Enables the illustration of the most frequently visited websites made by the user |
| Non-Functional Requirements | |
| To enable the data to be analysed and outputted to the user in a response time of less than 5 seconds | Considering the response time |
| Usability Requirements |
Technical Specification
Python is a popular programming language, and was also the language used in the calculations to follow. The following Python libraries were imported into Spyder to support the corresponding calculations:
NumPy: A package designed for scientific computing in Python, containing many features but namely sophisticated functions.
Pandas: A library that is BDS-licensed which efficiently provides necessary tools for data analysis as well as high-performance data structures.
Urllib.parse: This package breaks up the strings of a Uniform Resource Locator (URL) into sections.
Implementation
Data Pre-processing
The corresponding dataset containing information on the web history was located in the Safari directory. The directory is easily accessible, with its exact location being ‘/library/safari/history.db’. The database file itself can also be easily sent over networks, in this case as an attachment through email.
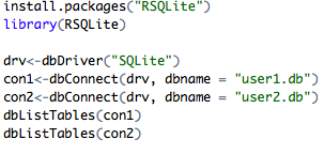
The preparation of the databases takes place in RStudio, with the library RSQLite which allows for the inspection and manipulation of raw databases.
The History.db files, appropriately renamed as ‘user1.db’ and ‘user2.db’, were loaded into RStudio with the following input:
The following output gives insight into the tables located in each database, which are naturally identical due to Safari storing information the same for each user:
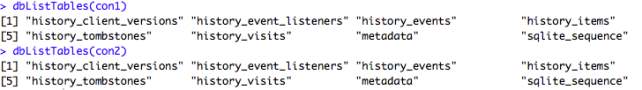
Of all 6 tables in the Safari database, the only necessary data for the purpose of this study belong to the tables titled history_visits and history_items. The variable fields corresponding to the tables are as follows:
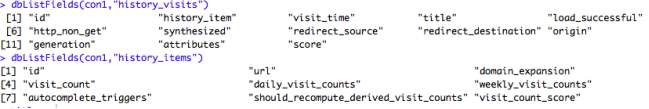
An initial observation at the raw data gives insight into what information can be obtained from mining the given data; most frequently visited websites, the average daily time spent browsing the net, etc.
In history_visits, the variable “title” contains the given titles of each visited web page, thus extracting these tiles and saving them into a text file was necessary to aid future analysis:

The visit_time variable in the history_visits table displays the date and time in NSDate format. To elaborate, NSDate objects represent a time range comparative to a reference date, specifically: 00:00:00 UTC on 01.01.2001. As an example, time and date is represented as 529456512.4, which is not in a human-readable format. Necessary data manipulations were
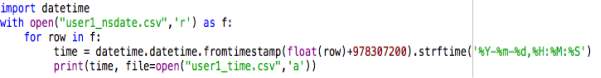 then made to convert each epoch time into a datetime format. The following input in Python converted each time accordingly.
The file titled ‘user1_time.csv’ contains date presented in the following, readable format.
| 22/05/2018 | 22:48:34 | Amazon Sign In |
Exploratory Analysis
The data is required to be relatively ‘raw’ for this step in order to achieve the correct results.
First, the number of daily web visits was computed and plotted into line graphs as follows for each user.
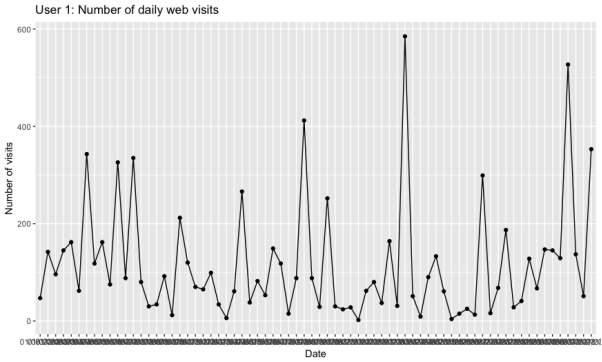
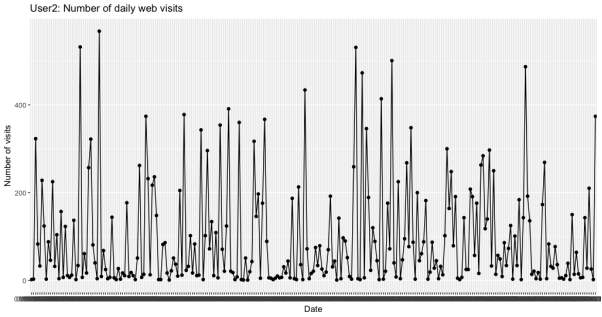
As can be seen from the above plots, both datasets appear stationary over time. The number of daily web visits vary day-to-day for both users, however, the data collected for user 2 spans over a larger range of dates which is emphasised through the line graph.
To gain a deeper understanding into the amount of web pages visited, the following plots were generated in Excel to illustrate the total number of websites that had been visited per weekday.
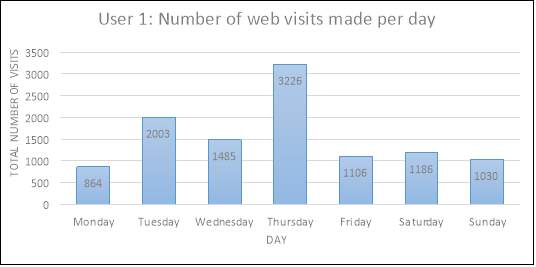
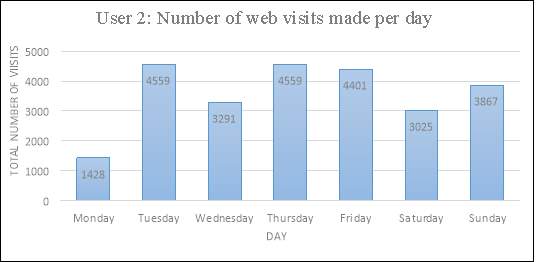
The above plots illustrate an interesting difference in the browsing habits of both users. For instance, user 1 demonstrates an increase in website visits on Thursdays, with a total of 3,226 searches made. However, searches made over the remaining days of the week seem to drop, with 2,003 searches on Tuesdays being the next most popular day. Aside from Mondays, user 2 demonstrates a consistency in their searching habits, with a total range of 3,025-4,559 web visits being made. In this particular situation, the results of user 2 are more reliable for analysis due to the greater size of data collected in comparison to user 1. Due to the stationarity and balance between most days, it could be deciphered that user 2 is a frequent web user, yet at this stage it would be inappropriate to predict whether the individual may be a student or someone who works from home. Analysis into the users most frequent web searches should provide the researcher with a greater understanding of who this individual may be.
Analysing the days and times in which most searches occur on the web can also convey a large insight into the user themselves. Further analysing the type of searches being made would give insight into whether the user is a parent, or whether they are seeking a job, as well as many other factors.
The following plots illustrate the number of visits made at every hour, between Monday to Friday, spanning over the entire date range for each user. The epoch time was again converted into a readable format, but without including the minutes and seconds for each time; only the hour at which the visits were made were relevant to this exploration.
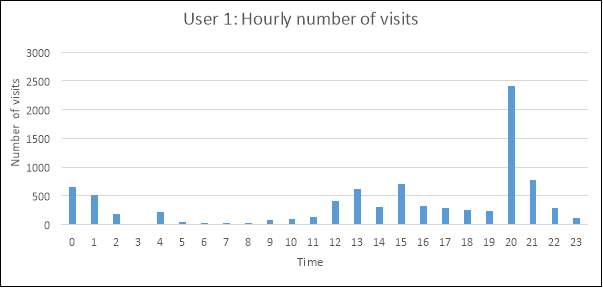
Exploring the busiest browsing times for each user can provide insight into what the users daily activities or routine may consist of. For instance, user 1 demonstrates more web searches in the time ranges of 12pm-4pm and an increase again at 8pm-10pm.
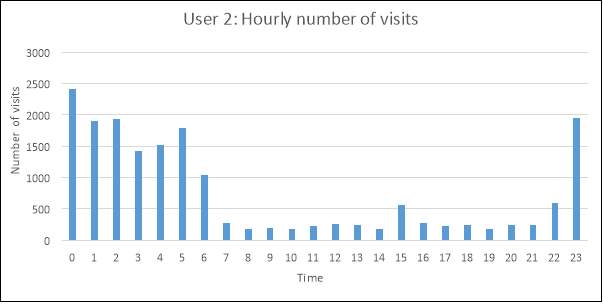
There appears to be a noticeable difference in the most popular browsing times of user and user 2. User 2 displays a clear decrease in number of visited websites between the times of 7am-10pm. From this information, there is an increased likelihood that user 2 works between those hours, if this judgment is based upon the typical working day being 9am-5pm.
The most popular times that a user browses online can be greatly beneficial to marketing and advertising companies. It must also be considered that different types of web searches may correlate with the times that the searches are being made, which would in turn allow these companies to publish personalised adverts where the user may be considered more vulnerable.
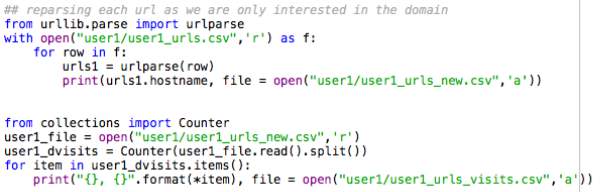
Before a hypothesis can be made, the most popular searches made by each user must also be explored. In order for this to be made possible, the URL of each visited website needed to be split so that only the host name of each URL remained. As an example, the following URL ‘https://www.youtube.com/watch?v=sIGHAdIYjNI’ was broken down and converted into the following host name: www.youtube.com. By doing so, the count occurrence of each visited web page was easier to compute. The following code syntax illustrates how this was done in Python.
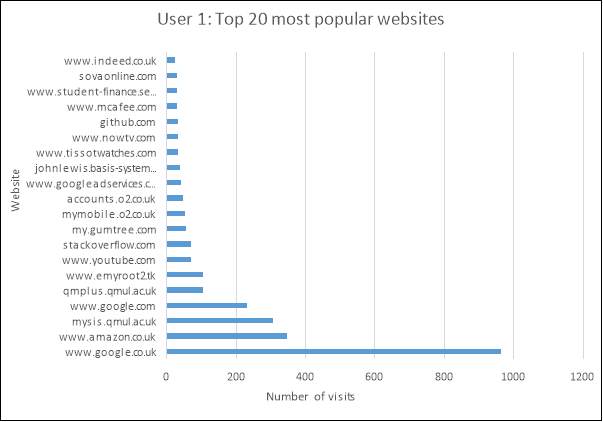
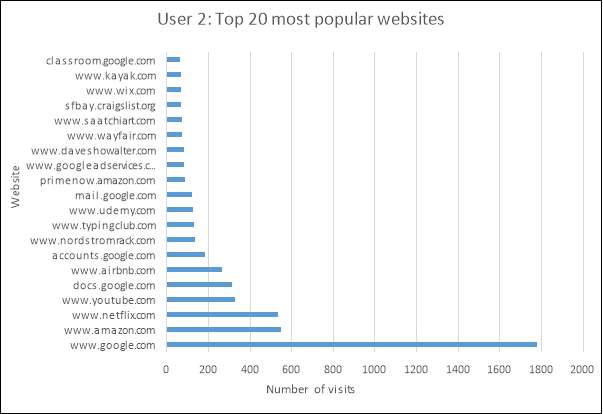
As can be expected, the top 2 most frequently visited sites for both users are Amazon and Google. However, a slight yet important difference to note is that user 1 uses Google.co.uk whereas that of user 2 is Google.com, which also applies to that of Amazon. This gives an initial inclination as to where the user was located at the time of the searches made. Although it is not currently a strong enough argument to assume where the users reside, it is certainly worth keeping this information in mind when performing more concise analysis in future.
The popular website visits of user 1 provide insight into what their employment status may be. For instance, the website www.indeed.co.uk is a well-known job searching website, and www.student-finance.service.gov.uk is where a student in higher education would apply for tuition loans and maintenance loans to help with their finances during the time of their studies. If it can be assumed that there lies a correlation between the two, the assumption can be deduced that the user is a student in higher education who is in search of a part-time or full-time job.
Text Mining in R
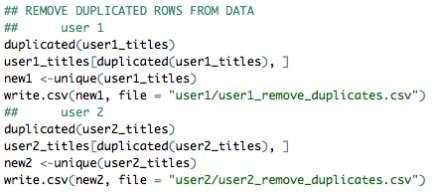
The file containing the titles of each visited web page contains many duplicates of title names. This can be due to users commonly refreshing each web URL in aid of faster page loading. Calculating the TF-IDF scores at this stage would not provide reliable results, thus it is necessary to remove these duplicates from the created dataset. As mentioned earlier, the total number of titles extracted from the history database stands at 10,900 for user 1 and 25,130 for user 2. Once the necessary manipulations were made to the data, the total number of titles corresponding to user 2 decreased dramatically to 4,902 titles. The code used to apply the manipulations are as follows.
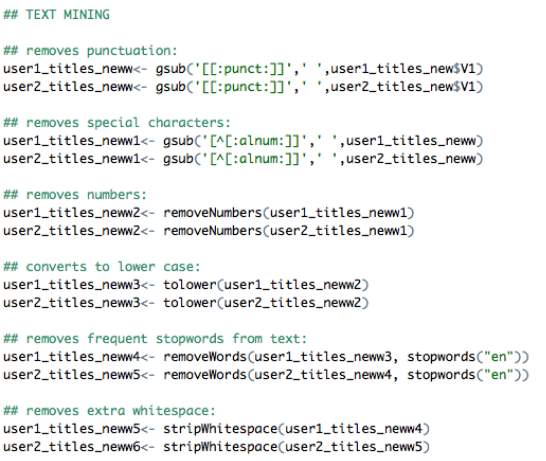
Text mining in R is a popular way of cleaning datasets without losing vital information. The intention is to remove unnecessary terms and characters from strings of text to ensure any future analysis can be made without difficulty. The two datasets were cleaned by removing punctuation, special characters, numbers, whitespace and stopwords from each string of text.
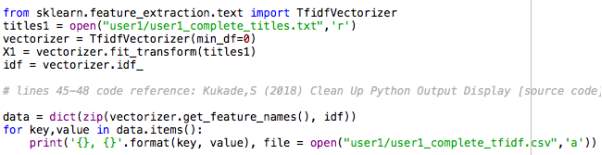
Term Frequent – Inverse Document Frequency (TF-IDF)
To calculate the TF_IDF score of each term in the documents, the following code was implemented into Python.
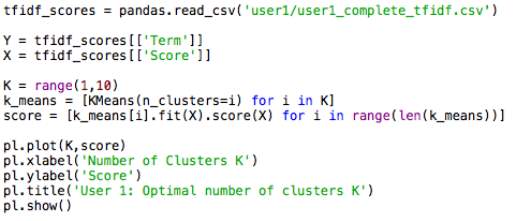
Elbow Method
In this scenario, it is common to apply the Elbow Method which will aid in validating the number of clusters required. The method essentially analyses the percentage of variance which is explained as a function of the number of clusters K (Anand, 2017). Choosing the number of clusters should be done in a way that adding an extra cluster would not provide better modelling results of the data (Ibid). On the graph, the first cluster is expected to explain much of the variance, but as the value of K increases the marginal gain is expected to drop which is illustrated by a distinguishable angle in the graph, better known as the elbow point (Ibid). It is at this stage that the number of clusters K can be selected, however, it can often be an ambiguous choice.
Specifying a cluster range of 1-10, the following plots represent the score values on the y-axis and the number of clusters on the x-axis.
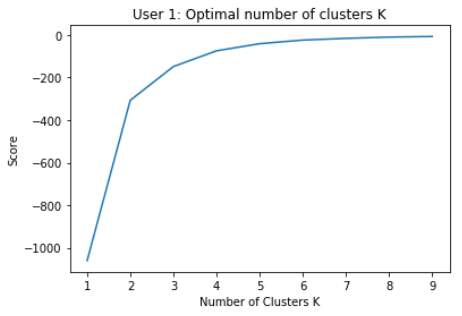
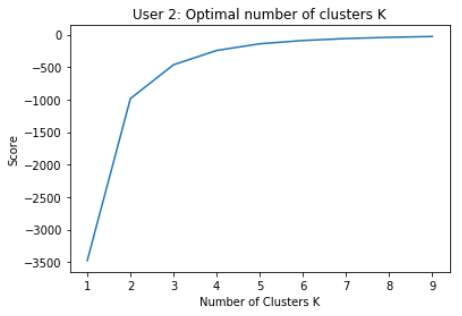
For both datasets, K = 2 appears to be the most appropriate number of clusters to apply, as the elbow point is most apparent here.
However, as the study is based on categorising the browsing characteristics of each user, using 2 categories would not suffice in this particular study. Reverting back to the table made earlier, using 10 clusters seems an appropriate choice as it conveys a vast amount of information about each user.
K-Means Clustering
The TF-IDF scores were then used to run a k-means clustering algorithm through Python. The user-specified number of clusters is K=10, with a total of 10 values in each cluster.
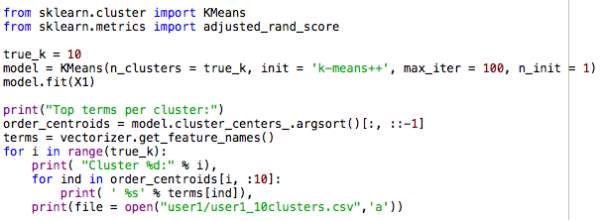
The initial algorithm produced the following clusters for each user.
| User 1 | User 2 | |
| Cluster 1 | Python, stack, overflow, sqlite, scrape, library, urls, data, Wikipedia, enfield | Stanford, edclub, san, university, jose, careers, Francisco, medicine, research, review |
| Cluster 2 | History, youtube, trailer, safari, urls, python, export, scrape, api, analyse | Grand, showalter, dave, nature, photography, piano, baby, antique, shop, page |
| Cluster 3 | Watch, free, house, season, putlocker, episode, women, se, automatic, lone | Amazon, toys, prime, squishy, games, squishies, video, rising, slow, toy |
| Cluster 4 | Uk, amazon, prime, video, mask, bowl, face, yahoo, mixing, beauty | Maps, ca, inn, sea, san, hotel, rd, creek, airport, campus |
| Cluster 5 | Crawler, github, riematrix, master, js, page, css, popup, lib, docxgen | Pool, coral, spa, ca, jose, installation, san, pools, swimming, adams |
| Cluster 6 | Mendeley, use, using, download, plugin, related, info, feed, clay, welcome | Parker, warby, eyeglasses, women, daisy, quiz, freddy, frames, kiss, glasses |
| Cluster 7 | Gumtree, ad, account, messages, post, edit, London, ads, classified, stuff | Website, templates, wix, page, html, free, creative, arts, store, events |
| Cluster 8 | Payment, ticketmaster, details, charge, dart, confirm, delivery, confirmation, uk, log | Kids, shoes, clothing, camper, us, women, jewelry, girls, amazon, store |
| Cluster 9 | Watches, tissot, ladies, automatic, women, Powermatic, Seiko, lady, goldsmiths, watchshop | Uk, love, factor, ll, Wayfair, air, youtube, delta, lines, terry |
| Cluster 10 | London, san, heathrow, flight, jose, oyster, Francisco, transport, north, graduate | Youtube, gmail, west, project, girls, home, furniture, lauratomdunn, dance, sale |
The clusters generated with the current code implementation are chosen at random; 100 data points are taken from the list of terms and clustered accordingly. However, it is not reliable to cluster in this manner, thus the code was adjusted so all data points were clustered.
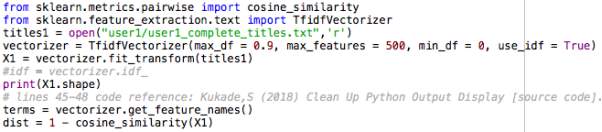
As shown above, the code for running the TF-IDF scores was adjusted. Specifically, the max_df = 0.9 term instructs the algorithm to discard any terms that occur in more than 90% of the documents, where the documents are represented by each page title. The term max_features = 500 states to only select the 500 best terms from the total selection over the corpus, where the terms are ordered by the frequency. Cosine similarity is used to produce a degree of similarity between each of the documents in the corpus.
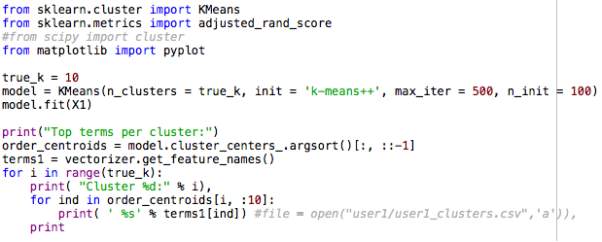
The term n_init = 100 instructs the K-means algorithm to run 100 times with differing centroid seeds each time. By doing this, the final output of results will represent the best possible output in terms of inertia. Also, the previously run algorithm consisted of clustering into a total of 10 clusters, which was changed to a total of 8 clusters. The reason for this being that 10 clusters demonstrated some clusters sharing similarities into the content they represented, thus experimenting with 8 clusters proved more appropriate. The final results for user 1 are as follows.
| Top terms per cluster | |
| Cluster 0 | London, heathrow, san, flight, jose, oyster, Francisco, transport, north, graduate |
| Cluster 1 | watch, free, house, season, putlocker, episode, se, survivor, lone, movies |
| Cluster 2 | watches, women, automatic, ladies, watch, tissot, bulova, certina, Seiko, goldsmiths |
| Cluster 3 | python, scrape, sqlite, urls, history, website, extension, csv, windows, description |
| Cluster 4 | youtube, history, library, enfield, trailer, data, sicily, privacy, account, results |
| Cluster 5 | uk, amazon, prime, video, mask, bowl, face, yahoo, mixing, beauty |
| Cluster 6 | crawler, github, riematrix, master, js, page, css, popup, lib, docxgen |
| Cluster 7 | overflow, stack, python, urls, using, extension, file, save, history, posts |
Running the algorithm on user 2, keeping to 10 clusters was more appropriate in this case due to the size of the dataset being relatively larger than that of user 1.
| Top terms per cluster | |
| Cluster 0 | Stanford, edclub, west, center, university, lane, American, bill, careers, research |
| Cluster 1 | san, jose, Francisco, ca, ballet, escape, auction, maps, room, pool |
| Cluster 2 | shoes, clothing, tory, burch, women, flip, jewelry, amazon, kids, us |
| Cluster 3 | website, templates, wix, page, html, free, creative, arts, store, events |
| Cluster 4 | gmail, lauratomdunn, inbox, korinnadunn, aug, dunn, receipt, flight, welcome, summer |
| Cluster 5 | photography, showalter, dave, nature, national, Wyoming, Colorado, loranc, roman, park |
| Cluster 6 | maps, girls, project, us, kids, home, school, united, flights, big |
| Cluster 7 | youtube, lyrics, video, factor, song, guess, Katie, Byron, try, official |
| Cluster 8 | grand, furniture, piano, baby, sale, antique, owner, shop, page, elm |
| Cluster 9 | amazon, toys, prime, squishy, games, squishies, video, rising, slow, toy |
User Acceptance Testing
Critical Evaluation
- Degree of success
- Limitations (be specific)
- Were objectives met
- Conclusions
Interpreting results
It is evident from the produced results that an analysis run over web searches ranging from a shorter time span do not differ from the results produced from that of a larger time range.
From inspecting the clusters associated with user 1, the following information can be deduced about the user:
Geographical Location: Enfield, London UK
- Clusters 0, 5 and 6 contain the following terms, indicating the likely location of residence: London, heathrow, enfield, uk
Gender: Female
- Clusters 2 and 6 contain terms implying the gender of the web user; women, ladies, beauty
Similarly, the following information can be deduced from the results obtained for user 2.
Geographical Location: San Jose, USA
Bibliography
Tan, A.-H. (1999) ‘Text Mining: The state of the art and the challenges’, in Proceedings of the PAKDD 1999 Workshop on Knowledge Disocovery from Advanced Databases. doi: 10.1.1.38.7672.
- Anand, S. (2017). Finding Optimal Number of Clusters. [online] DataScience+. Available at: https://datascienceplus.com/finding-optimal-number-of-clusters/ [Accessed 8 Aug. 2018].
- Bielova, N. (2013) ‘Survey on JavaScript security policies and their enforcement mechanisms in a web browser’, Journal of Logic and Algebraic Programming. doi: 10.1016/j.jlap.2013.05.001.
- Buchanan, T. et al. (2007) ‘Development of measures of online privacy concern and protection for use on the Internet’, Journal of the American Society for Information Science and Technology. doi: 10.1002/asi.20459.
- Capano, F. (2014). EditThisCookie. [online] Editthiscookie.com. Available at: http://www.editthiscookie.com/blog/ [Accessed 1 Aug. 2018].
- Castelluccia, C. (2012) ‘Behavioural tracking on the internet: A technical perspective’, in European Data Protection: In Good Health? doi: 10.1007/978-94-007-2903-2_2.
- Clifford, D. and Van Der Sype, Y. S. (2016) ‘Online dispute resolution: Settling data protection disputes in a digital world of customers’, Computer Law and Security Review. doi: 10.1016/j.clsr.2015.12.014.
- Discover about Sqlite and How to perform Sqlite Forensics Efficiently. (2018). Sqlite Database in Chrome & Chrome Forensics. [online] Available at: https://sqliteviewer.com/blog/sqlite-in-google-chrome-and-its-forensics/ [Accessed 22 Jul. 2018].
- Feinerer, I., Hornik, K. and Meyer, D. (2008) ‘Text Mining Infrastructure in R’, Journal Of Statistical Software. doi: citeulike-article-id:2842334.
- FreeCodeCamp. (2018). How to process textual data using TF-IDF in Python – freeCodeCamp. [online] Available at: https://medium.freecodecamp.org/how-to-process-textual-data-using-tf-idf-in-python-cd2bbc0a94a3 [Accessed 27 Jul. 2018].
- Gorman, G. O. and McDonald, G. (2012) ‘Ransomware : A Growing Menace’, Symantec.
- Jain, A. (2016). Complete guide to create a Time Series Forecast (with Codes in Python). [online] Analytics Vidhya. Available at: https://www.analyticsvidhya.com/blog/2016/02/time-series-forecasting-codes-python/ [Accessed 7 Aug. 2018].
- Lani, J. (2010). Time Series Analysis. [online] Available at: http://www.statisticssolutions.com/wp-content/uploads/kalins-pdf/singles/time-series-analysis.pdf [Accessed 7 Aug. 2018].
- Phelps, J., Nowak, G. and Ferrell, E. (2000) ‘Privacy Concerns and Consumer Willingness to Provide Personal Information’, Journal of Public Policy & Marketing. doi: 10.1509/jppm.19.1.27.16941.
- Pittaro, M. L. (2007) ‘Cyber stalking : An Analysis of Online Harassment and Intimidation’, International Journal. doi: 10.5281/ZENODO.18794.
- Sqlite.org. (2018). About SQLite. [online] Available at: https://sqlite.org/about.html [Accessed 22 Jul. 2018].
- Tan, A.-H. (1999) ‘Text Mining: The state of the art and the challenges’, in Proceedings of the PAKDD 1999 Workshop on Knowledge Disocovery from Advanced Databases. doi: 10.1.1.38.7672.
- Trevino, A. (2016). Introduction to K-means Clustering. [online] Datascience.com. Available at: https://www.datascience.com/blog/k-means-clustering [Accessed 2 Aug. 2018].
Appendix
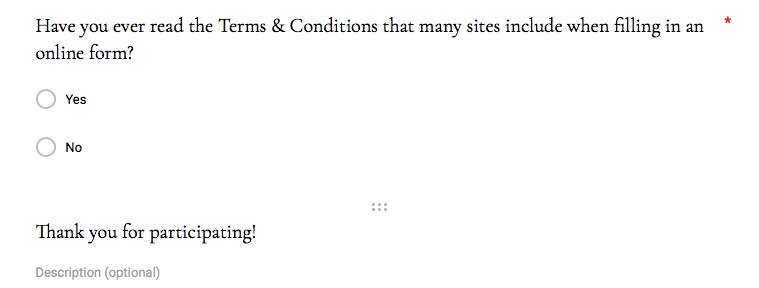
Primary Research Survey

Cite This Work
To export a reference to this article please select a referencing stye below:
Related Services
View all


Related Content
All TagsContent relating to: "Cyber Security"
Cyber security refers to technologies and practices undertaken to protect electronics systems and devices including computers, networks, smartphones, and the data they hold, from malicious damage, theft or exploitation.
Related Articles

DMCA / Removal Request
If you are the original writer of this dissertation and no longer wish to have your work published on the UKDiss.com website then please: