Jurassic Mass Extinction Events: Causes and Effects
Info: 7443 words (30 pages) Dissertation
Published: 9th Dec 2019
Abstract
Mass extinction during the Pleinsbachian-Toarcian (PL-TOA) interval of early Jurassic coincide with several environmental crises such as rapid global warming, marine transgression, methane release from gas hydrate, marine anoxia, and large igneous province (LIP) eruption. The well-established ammonite bio-stratigraphic scheme (PL-TOA) shows family extinction throughout different regions of the world that substantiates this mass extinction to be global in extent. The litho- and bio-stratigraphic schemes with other various invertebrate macrofaunal species extinction of N Yorkshire, England also support this extinction to be global and multi-phased. Although fossils (benthic and pelagic marine fossils; especially ammonites) are the main focus of this report, sedimentology, relative sea level rise, temperature change, redox indications, and carbon isotopic data from N Yorkshire emphasize the precise timing of the onset of anoxia and explain the paleo-environment in the early Jurassic with the likely cause of the anoxic event to be progressive warming. Furthermore, the diversity data of ammonite and foraminiferal species in PL-TOA succession of North America are compared to those of Europe and other parts of the Arctic – to examine the geographical degree of different phases of this extinction. These two taxonomic groups in three different ocean basins (paleo Pacific, paleo Arctic, and Tethys Oceans) not only help understand the geographic range of this extinction, but also support the globally controlling factor, the eruption of the Karoo-Ferrar LIP, which verifies the “Volcanic Greenhouse Scenario”. Lastly, the six extinction phases in these diversity data correlate with the duration of Karoo magmatism that supports the predominant factor of early Jurassic mass extinction to be the eruption of Karoo-Ferrar LIP. This report further examines different controversies regarding the causes of sharp, negative C isotope excursions during Toarcian interval, and proposes Toarcian C isotope values and gas hydrate methane release to be irrelevant to the development of the early Jurassic mass extinction and consequent widespread anoxia.
- Introduction
Mass extinction is a termination of a significant proportion of the world’s biota over a narrow geologic interval of time due to a massive global disruption to the environment (Hallam and Wignall, 1997). Hainik (2012) has recently stated that greenhouse gas emissions are giving a major influence to the oceanic ecosystem of modern times, causing extinction, and eventually creating a marine anoxic event. Therefore, understanding extinction with its relation to global warming is an essential task for science and modern society. This will lead to the point where geologic event can unfold and paleo-stratigraphic record can be filled with more certainty.
Among several causes of mass extinction such as asteroid impacts, widespread dissolved oxygen shortages, plate tectonics, and climatic change, a mechanism-chain has currently developed to link the global warming and greenhouse gas discharge to the extinction events during the Early Jurassic. This is a model called the “Volcanic Greenhouse Scenario” proposed by Wignall (2005). As shown in figure 1, it shows the plausible chains of events causing the environmental changes and mass extinction events – supported by increased organic concentrations in sedimentary records and major disruptions in many isotopic and geochemical record. This scenario proposes that the eruption of large igneous provinces (LIPs) causes outgassing of CO2 and other greenhouse gases that leads to a long term global warming. Consequently, emission of those gases increases the water temperature and leads to the following series of events: (1) gas hydrate release from continental shelf and an immediate oxidation of methane to CO2, (2) break-down in ocean water dynamic system such as thermohaline circulation decrease, (3) increased weathering, erosion, and continental run-off, and lastly (4) ocean deoxygenation, marine stagnation, and marine anoxia (Fig. 1). This model has been invoked for a number of extinction events for the past 300 m.y. and this includes the Karoo-Ferrar LIP and the early Jurassic mass extinction, mainly during the Pleinsbachian-Toarcian (~ 183 Ma in Palfy & Smith, 2000). With the concept of “Volcanic Greenhouse Scenario”, this report aims to study the predominant cause of early Jurassic multi-phased mass extinction, Karoo-Kerrar volcanic eruption, using the globally distributed taxic extinctions of fossil records and geochemical data collected 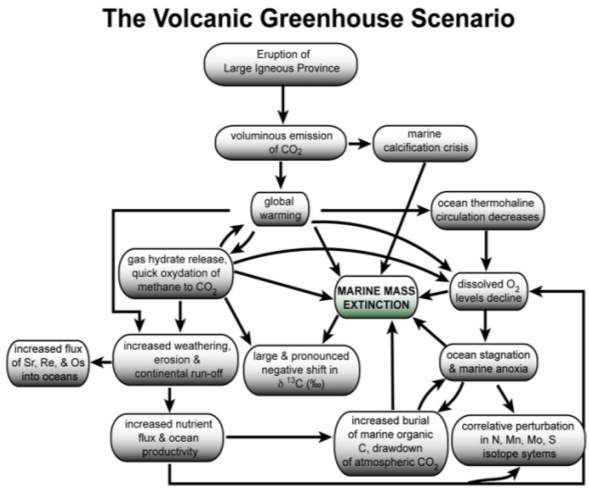 particularly from North Yorkshire of England and throughout the world.
Fig. 1. The “Volcanic Greenhouse Scenario” (modified from Wignall, 2001, 2005)
- Correlation Methods and Result
The age of PL-TOA boundary (187 Ma) has been interpolated due to the poor radiometric dates and magnetostratigraphic data (Harland et al., 1990). Also, many extinction schemes are available for correlation during the Phanerozoic (cf. Harland et al., 1990), but only few for the Lower Jurassic among which the best correlation methods is a high resolution ammonite bio-stratigraphic scheme (Dean et al., 1961; Haq et al., 1988; Harland et al., 1990). This scheme has divisions of 20 zones (1.5 m.y. per zone) and 53 or 56 subzones (on average 0.5 m.y. per subzone) and it is classified into different regions as follows: 1) Boreal realm (NW Europe, E Greenland, Siberia, N Japan, NE Canada), 2) Tethyan realm (Hungary, Austria, S Europe, N Africa, S Japan, Canadian Pacific Coast, Oregon, N Chile, Argentina), and 3) Austral realm (S Chile, Argentina, New Zealand) (Hallam, 1975; Smith and Tipper, 1986; Riccardi et al., 1990). Subsequently, those realms and different zones are correlated in terms of common and immigrant ammonite taxa. In figure 2, the table shows the number of family extinctions within the four classifications of realms in each standard ammonite biozones of Early Jurassic.
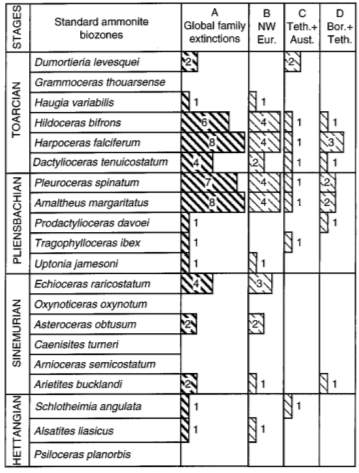
Fig. 2. Ammonite Family Extinctions in Lower Jurassic (Little & Benton; June 1995; v. 23; no. 6; p. 495– 498)
- Family-level Extinction of Ammonites
As shown in figure 2, the family-level extinction data of ammonite in the Lower Jurassic gives the following result:
(1) in column (A) Global family extinctions, there are 49 out of 52 families that terminated in the Early Jurassic;
(2) there was a greater scale of extinction from the late Pleinsbaschian to the early Toarcian due to 33 out of 49 family extinctions in five biozones – margaritatus, spinatum, tenuicostatum, falciferum, and bifrons;
(3) in column (B), only 18 out of 33 families had terminal taxa in NW Europe which indicates a great influence to global event from outside this area; and
(4) in column (C) and (D), 9 out of 33 had terminal taxa in Boreal and Tethyan realms while only 5 out of 33 had terminal taxa in Tethyan and Austral realms.
- Invertebrate Macro-faunal Species-level Extinction Sampling in North Yorkshire
Among several species-level sampling conducted in the NW Europe, one of the most stratigraphically complete PL- TOA section lie on the North Yorkshire coast (Little, 1995). Figure 4 shows macrofaunal invertebrate species range charts and species extinction percentage rate from margaritatus zone to the bifrons zone of N Yorkshire. The E.P.S or extinction percentage rate of the species is significantly high (81% in the red box) on top of the early Toarcian (tenuicostatum zone) on the extinction horizon. During this interval, only three epifaunal bivalve species survived whereas Nektonic and pseudoplanktonic groups were mostly unaffected (Hallam, 1986; Little,

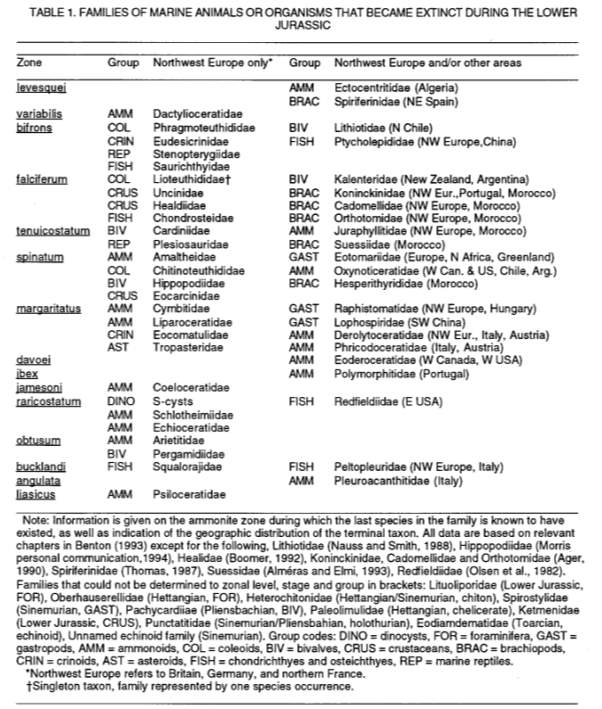 Fig. 3 (or Table 1). Families of marine organisms that became extinct during the Early Jurassic. BIV Lithiotidae family (red box) is the only family extinction in S America. (Little & Benton; June 1995; v. 23; no. 6; p. 495– 498)
unpublished). Moreover, in falciferum and bifrons zones, pseudoextinction pattern in a fast evolving immigrants of Tethyan ammonites and belemnite families (Doyle, 1990, 1992; Howarth, 1992a, 1992b) leads to high extinction rates in these zones that coincide with the presence of organic rich shale deposition (Jenkyns, 1998).
Before the PL-TOA boundary, only 2 out of 40 families, (A) Eotomaridae and (B) Amaltheidae (red circles), had terminal taxa in the North Yorkshire basin (Fig. 4). This species-level event is therefore inadequate to explain the late Pliensbachian–early Toarcian family extinction phase, and cannot be accepted in regionally based fine-scale studies (Little and Benton, 1995). Furthermore, there are other data (Fig. 5) from N Yorkshire to indicate the anoxic event to have started specifically in the mid D. semicelatum Subzone of early Toarcian.


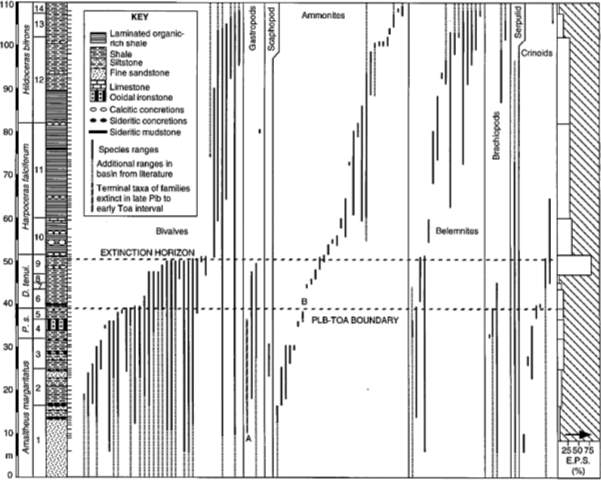 Fig. 4. Lithostratigraphic and biostratigraphic schemes with invertebrate macrofaunal species range chart from late PL to early TOA of Northern Yorkshire. Terminal taxa (red circles): A, Ptychomphalus expansus (family Eotomaridae); B,Pleuroceras hawskerense (family Amaltheidae). “Abbreviations: P. s. 5Pleuroceras spinatum,D. tenui. 5Dactylioceras tenui-costatum. Ammonite subzones: 1, Amaltheus stokesi;2,A. subnodosus;3,A. gibbosus;4,Pleuroceras apyrenum;5,P. hawskerense;6,Pro-togrammoceras paltum;7,Dactylioceras clevelandicum;8,D. tenuicostatum;9,D. semicelatum; 10, Cleviceras exaratum; 11, Harpocerasfalciferum; 12, D. commune; 13, Peronoceras fibulatum; 14, Catacoeloceras crassum. Max E.P.S (81%) is marked in red box.” (Little & Benton; June 1995; v. 23; no. 6; p. 495– 498)
Fig. 5. Correlation of zones and subzones in NW and S Europe (Macchioni, 2002; Cecca and Macchioni, 2004; Page, 2004)
As mentioned above, there are more data collected from North Yorkshire that include the Grey Shales of D. Tenuicostatum zone and Jet Rocks members of the H. Serpentinum zone. Data in figure 6 and 7 only come from the Kettleness section of N Yorkshire. In these data, Howarth’s (1962, 1973) bed numbering scheme, and Droser and Bottjer’s (1986) ichinofabric index classification scheme were used. The Total Organic Carbon (TOC) concentration (Fig. 7) came from Rock Eval pyrolysis and benthic fossil occurrences at species level were measured in decimetre scale. Grain size was observed in the field while Si/Al ratio was examined in the thin section. And, concentrations of K, Th, and U collected in the field were directly measured using a field-portable gamma-ray spectrometer (Myers and Wignall, 1987). Additionally, framboid sizes of pyrite were assessed with a scanning electron microscopy (Wignall and Newton, 1998). Such redox indicators were measured to correlate with the Index of Anoxia (IA) with the degree of pyritization (DOP) of iron (Raiswell et al., 2001).
FOSSIL RANGES
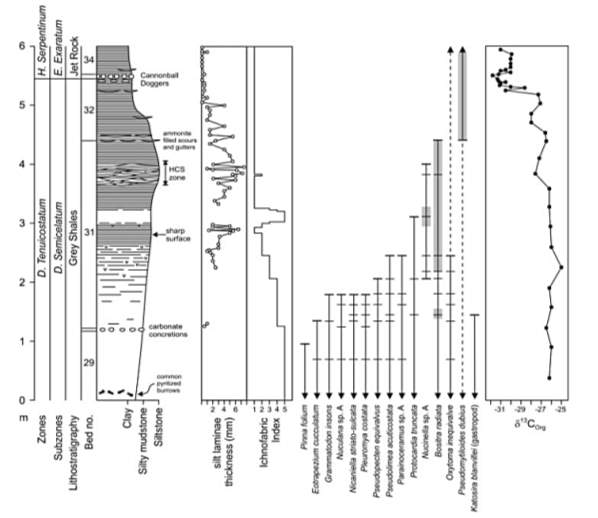 In figure 6, a diverse benthos ranges up to Grey Shale until the lower – middle part of Bed 31 where most of them disappear apart from the Oxytoma inequivalve that survives up to the early Cretaceous. The extinction level co-occurs with a gradual lamination of siltstone and great abundance (shaded) of epibenthic bivalves although with low diversity. As shown, Bositra radiata disappears at the base of Bed 32 while pseudomytiloides dubius persists through the Jet Rock in high number (shaded). Figure 6 shows that no benthic species extinction event coincides with the major ammonite extinction at the PL-TOA boundary below the D. Tenuicostatum interval which is not shown in figure 6.
Fig. 6. Sedimentary logs (D. tenui. – H. Serpentinum zones), silt laminae thickness graph, ichnofabric index diagram, benthic macrofaunal species ranges, and organic C isotopic fluctuations graph at Kettleness, North Yorkshire. (Wignall et al., 2005)
REDOX INDICATORS
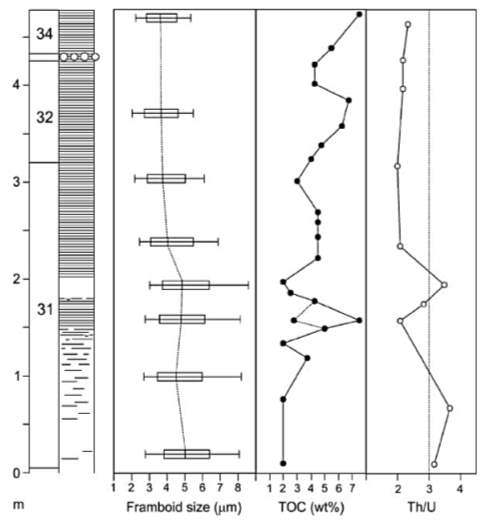 In figure 7, the total organic carbon (TOC) values reach 7.5% (red circles) in the basal laminated interval of Bed 31 (upper part of D. semicelatum Subzone) and in Bed 34 (Jet Rock). Likewise, the hydrogen index (HI) values in North Yorkshire sections show a general increase in the late D. semicelatum Subzone (Saelen et al., 2000; Bucefalo Palliani et al., 2002). Moreover, in the middle of Bed 31 (Fig. 7) at which point the laminated deposition begins, the pyrite framboids commonly found in Grey Shales and Jet Rock shrink in size (red arrow), then remain constant after 40cm of laminated deposition above this point. Also, as shown in figure 7, Th/U values rise to 3 in the bioturbated strata and drops to 2 in the laminated strata. In addition to decrease in pyrite framboid size and Th/U ratio values, and increase in TOC and HI values, the index of anoxia (IA) and the degree of pyritization (DOP) both increase at the end of D. semicelatum Subzone; IA increases from 0.3 to 0.75 and DOP goes above 0.75 (Newton, 2001). There were not only extinctions of benthos, but also of all calcareous nannofossil species and of 7 out of 10 dinoflagellate cyst species during the late D. semicelatum Subzone, although interestingly none of the ammonites have gone extinct (Palliani et al., 2002).


40cm


20cm

Fig. 7. Measure of oxygenation through extinction phases at Kettleness. “Pyrite framboid diameters are plotted as box-and-whiskers showing 25th and 75th percentiles and the median. The “whiskers” denote the 10th and 90th percentiles, sample size varies from 178 to 261. The total organic carbon (TOC) weight % values are for whole rock samples except at 1.5 m where a lower whole rock value is contrasted with a sample in which silt laminae were removed prior to analysis. The Th/U ratio is calculated from gamma-ray spectrometer data.” (Wignall et al., 2005) There is a 20cm non-laminated area (left red arrow) when the framboid size starts to gradually decrease 40cm (right red arrow) from then stay constant. The red circle of TOC indicate 7.5% and Th/U at 3.
- Stratigraphic Range Chart
Figure 8 shows the PL-TOA ammonite biodiversity in the NW Tethyan and Arctic domains, with six major declines of time intervals: 1) Ibex-Davoei Zone, 2) Gibbosus Subzone, 3) Pleinsbachian-Toarcian boundary, 4) Semicelatum Subzone, 5) Bifrons-Variabilis Zones, and 6) Dispansum Zone. Number 1 decline of lower Pleinsbachian is interpreted as a regional decline in species diversity and Numbers 2-6 are known to have contributed to PL-TOA extinction (Dommergues et al., 2009; Dera et al., 2010). Dera et al. (2009). Also, the work herein further compares the stratigraphic charts of ammonite and foraminiferal data in North America and the ammonite species data in Europe.
As shown in Figure 9, the PL-TOA ammonite (red circles) are well-distributed whereas coeval foraminiferal faunas (green circles) are not. While ammonite successions have been found in the northern part of paleo pacific, the foraminiferal successions have been located in two areas – paleo pacific and paleo Arctic Oceans (Miller et al., 2002; Smith, 2006). Hence, ammonite species ranges were compiled and analysed as one dataset while foraminiferal data had to be first analysed in regions, then re-analysed as a unified dataset.
- Diversity Measurement
Ammonite and foraminiferal species diversity is measured using methodology in figure 10 presented by Foote (2000) and Hammer and Harper (2006). Diversity is first divided into zonal level, then into informal subzone levels – lower, middle, and upper (Fig. 10A). Then, four main classes of taxa are used to quantify the stratigraphic ranges of species in western N America (Fig. 10B). Depending on the stratigraphic range of taxa, different unitary weight were given: taxa that range through Nbt were counted as one, Nbl or Nft as half of the unit, and Nfl as a third of a unit (Hammer, 2003). Lastly, singleton is defined as species of confined to a certain zonal or sub-zonal interval of time (Nfl category) in this study (Foote, 2000).
- Ammonite and Foraminiferal Diversity Data and Extinction Patterns
If there is an overabundance of Nbt value (one unit) that crosses both measured boundaries, changes in diversity within a certain interval of time may be diminished. Therefore, Figure 11B shows the foraminiferal species stratigraphic range chart without long-ranging species. However, the derived species diversity rates had similar values except in the lower Kanense Zone (Fig 11). Therefore, it was re-analyzed by considering only the Van Valen metric (Fig. 10C) with singletons in figure 12 in which the extinction and origination rate pattern look similar for both ammonite and foraminiferal species. However, the scale of ammonites is much higher compared to that of foraminifera. Both graphs in Fig 12 gives the following trend: 1) extinction and origination rates are relatively low in the early-mid Pleinsbachian; 2) origination rate increases in lower and upper Kunae Zone; 3) extinction rate drastically increases in the PL-TOA boundary and origination rate also rise (but notably less than the that of extinciton rate); and 4) origination and extinction rates in lower Toarcian are generally similar to those in upper Pleinsbachian and later generally increase in the upper Toarcian.
Finally, as shown in figure 13, the ammonite and foraminiferal biodiveristy (species) levels in N America and NW Tethyan (and Arctic domains) both declined and reached low points in six different phases: 1) middle Whiteavesi–middle Freboldi Zones, 2) upper Kunae–lower Carlottense Zones, 3) upper Carlottense–middle Kanense Zones, 4) upper Planulata–lower Crassicosta Zones, 5) middle Crassicosta–Hillebrandti Zones, and 6) lower–middle Yakounensis Zone. These periods of decreasing species diversity correlate well with the multi-phased event recorded in combined ammonite data from the northwest European and Arctic domains as studied by Dera et al. (2010) (Fig. 13B); and also seem to relate with reductions at the generic level in the Neuquén Basin of South America (Riccardi, 2008). The lowest diversity rate coincided with the CIE (Carbon Isotope Excursion) event in lower Toarcian. Such results are further analyzed in the Discussion.
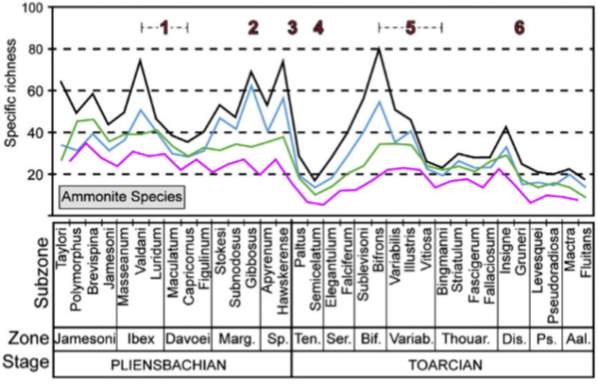
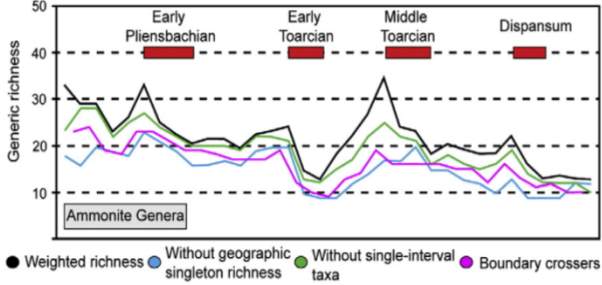
Fig. 8. Species and generic ammonite diversity in the PL-TOA interval of Europe (modified from Dera et al., 2010; Caruthers et al., 2013)


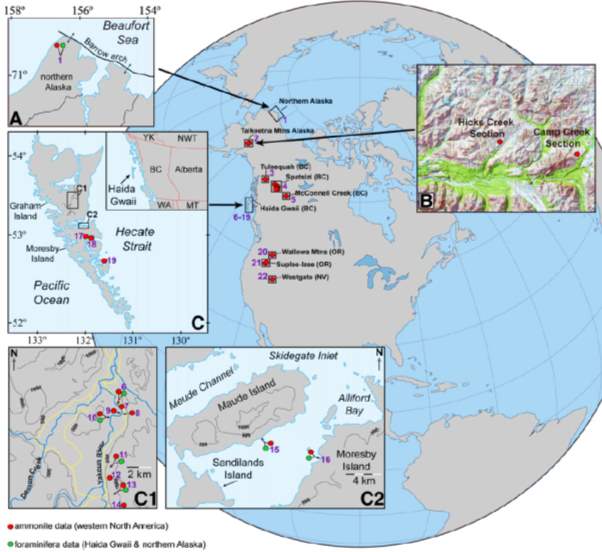
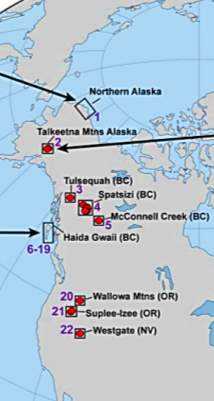
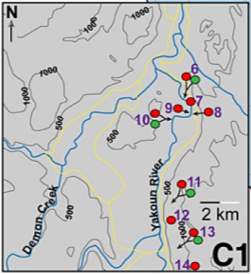
Fig. 9. Maps showing the locations of previously published PL-TOA stratigraphic sections in western N America (Caruthers et al., 2013)
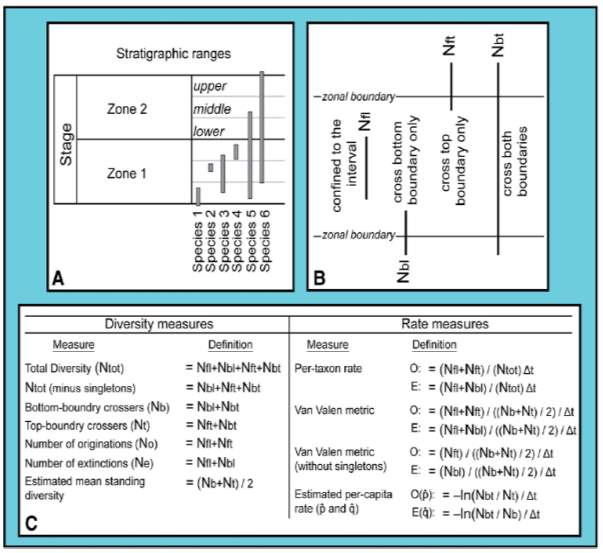
Fig. 10. “(A) Example of stratigraphic ranges of hypothetical species, divided at the zone- and informal subzone-levels. Taxa from within each informal subzone are identified as being from the ‘lower’, ‘middle’, or ‘upper’ part of the zone. (B) Four fundamental classes of taxa (after Foote, 2000) used in this study to quantify stratigraphic ranges of species in western N America. (C) Definitions of diversity and rate measures (after Foote, 2000). O = Origination rate, E = Extinction rate.” (Caruthers et al., 2013)
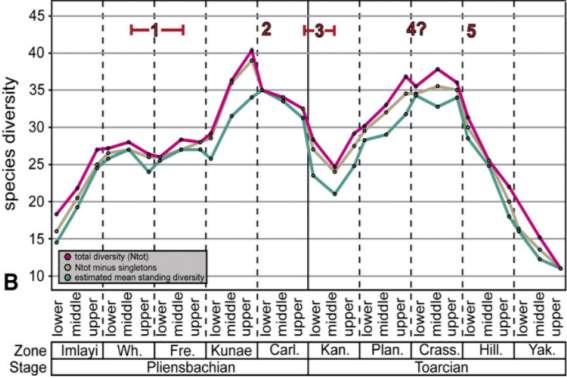
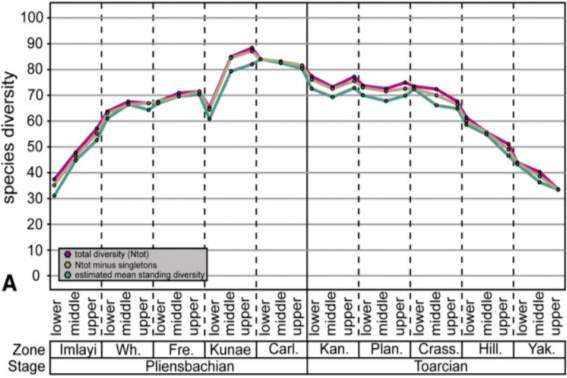
Fig. 11. “Combined Pliensbachian–Toarcian foraminiferal species diversity from Haida Gwaii and the South Barrow #3 core in Arctic Alaska, western North America. Data in (A) is the total combined species from the compiled stratigraphic range chart (Supplemental Data). Data in (B) does not include species whose stratigraphic ranges are greater than 6 ammonite zones within the Pliensbachian–Toarcian interval. In (A) only small declines in biodiversity are noted in the Kunae, Kanense, and Planulata Zones and a gradual decline in species diversity that occurs throughout the upper part of the Toarcian. In (B) declines in species diversity are evident over five potential intervals throughout the Pliensbachian– Toarcian time (red numbers).” (Caruthers et al., 2013)
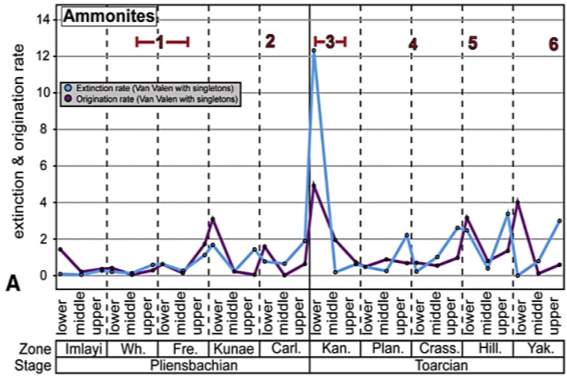
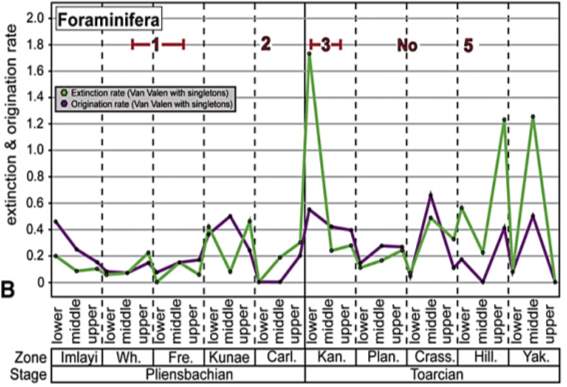
Fig. 12. “Extinction and origination rates for Pliensbachian–Toarcian ammonite (A) and foraminiferal (B) species in western North America. Rate metrics for foraminifera do not contain species whose stratigraphic ranges are greater than 6 ammonite zones within the Pliensbachian–Toarcian time interval.” (Caruthers et al., 2013)
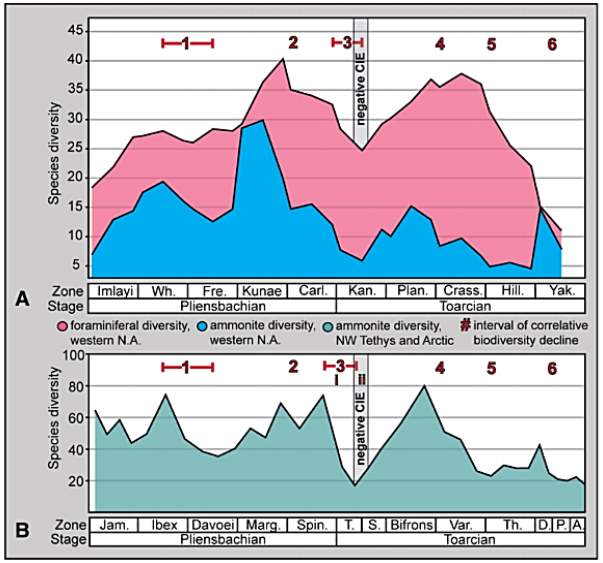
Fig. 13. “Ammonite and foraminiferal species level biodiversity in (A) Western North America and (B) NW Tethys and Arctic domains (Dera et al., 2010). Figure shows multi-phased event with major declines occurring over six correlative intervals. In both datasets (A and B), the main phase of extinction is a large progressive decline that begins just before the Pliensbachian/Toarcian boundary and extends into the Lower Toarcian where diversity reaches its lowest levels at an interval coeval with the negative CIE. Note: th Middle Toarcian event in Dera et al. (2010) is illustrated here as two separate events (#4, #5). Intervals i & ii = approximate extinction intervals previously identified by Harries an Little (1999) and Caswell et al. (2009), Wh. = Whiteavesi, Fre. = Freboldi, Carl. = Carlottense, Kan., = Kanense, Plan. = Planulata, Crass. = Crassicosta, Hill. = Hillebrandti, Yak. Yakounensis, Jam. = Jamesoni, Marg. = Margaritatus, Spin. = Spinatum, T. = Tenuicostatum, S. = Serpentinum, Var. = Variabilis, Th. = Thouarsense, D. = Dispansum, P. Pseudoradiosa, A. = Aalensis, negative CIE = negative carbon-isotope excursion interval in Caruthers et al. (2011).” (Caruthers et al., 2013)
- Discussion
- Global or Regional Extinction: Ammonite Family Extinction
Although majority of extinction has occurred in Boreal and NW Europe, extinctions in Tethyan and Austral realms that include S America highly assure this event to be global in extent and also multi-phased as supported by the extended extinctions in the five-zone phases from margaritatus to the bifrons zone. Since one family, Lithiotidae (Fig. 3; red box), had terminal taxa from N Chile of S America in bifrons zone, Hallam’s view that he could not find any evidence of PL-TOA extinction in S America is disproven.
- Timing of Extinction: Species-Level Extinction in North Yorkshire
There was a sediment anoxia due to the carbon-rich sediments all over Eruope during the time which E.P.S drastically increased from the late Toarcian to falciferum zone, and the pseudo-extinction pattern was shown during falciferum to bifron zones. Generally, these information indicate that a major species-level extinction in NW Europe is caused by an anoxic event during early Toarcian of falciferum zone time (Hallam, 1986; Jenkyns, 1988). According to Hallam (1986), there was a species-level extinctions or a low level event in early Toarcian, not at the end of Pleinsbachian, and aforementioned evidences from North Yorkshire well-substantiates his statement. However, this view can only be recognized in species-level, but neither in genus nor family-level. For example, the presence of only 2/40 terminal taxa (A and B in Fig. 4) of extinct families below the PL-TOA boundary does not support the family extinction phase in the late Pleinsbachian and early Toarcian extinction.
- Timing and Paleo-environmental Interpretation: Kettleness Section and Europe
Based on all the redox indicators and fossil ranges shown in figures 6 and 7, there clearly was an anoxic deposition in Bed 31. The species extinction of most benthos in the middle of Bed 31 means less burrowing activities, thus upper part of this bed shows continuously well-preserved laminations (Fig. 6 & 7). Furthermore, decline of Th/U and increase of TOC, HI, IA, and DOP values are the typical consequences of anoxic deposition (Fig. 7). Anoxic condition has long been thought to begin much later in the overlying Jet Rock (upper part of Bed 32), yet euxinic-ity or having restricted hydraulic circulation as evidenced by pyrite framboid data in the mid D. semicelatum tells the onset of anoxia to be earlier. The pyrite framboid sizes and mean diameters reduces in the middle of Bed 31 (Fig. 7) and this occurs in oxygen-restricted environments when the redox boundary moves from sediment to within the water column (Wilkin and Barnes, 1997). The 20cm-thick bioturbated strata in the Bed 31 with a drastic increase in Th/U shows the temporary development of bottom-water oxygenation (Fig. 7). Therefore, we can say that intense oxygen-restriction event has begun in the mid D. semicelatum Subzone and continued into the E. exaratum Subzone. Moreover, extinctions of all calcareous nannofossil species and most of the dinoflagellate cyst species indicate that upper water column was also greatly affected.
The Early Toarcian is characterised by a gradual rise in temperature or global warming (Fig. 15). The onset of anoxia on Tethyan continental margin begins during the tenuicostatum zone while Boreal realm remains well-oxygenated. However, there is a transient interval of oxygen-poor deposition in both realms when mass extinction of benthos (Fig. 6), Tethyan ammonites (Cecca and Macchioni, 2004) and dinoflagellate cysts (Bucefalo Palliani et al., 2002) occur at the same time of mid-late D. semicelatum Subzone. Subsequently, euxinic condition is formed during exaratum Subzone interval in the Boreal basins with increased run-off and salinity-stratified water column, meanwhile showing improvement of ventilation in Tethys with anti- estuarine circulation due to an increasingly warm and arid Tethyan climate (Fig. 15). The warming in Boreal basins may have been due to a suppression of upwelling and a failure of circulation. Overall, the Toarcian paleo-environmental changes in Europe can be related to a series of effects caused by progressive warming (Fig. 14). Figure 15 shows the reconstruction of the Boreal and Tethyan transition in W Europe during the early Toarcian.
Therefore, Toarcian anoxic event in Europe is diachronous between Tethyan and Boreal provinces. Although Boreal anoxia developed earlier in time, it shortly co-occurs with the Tethyan anoxia during D. semicelatum
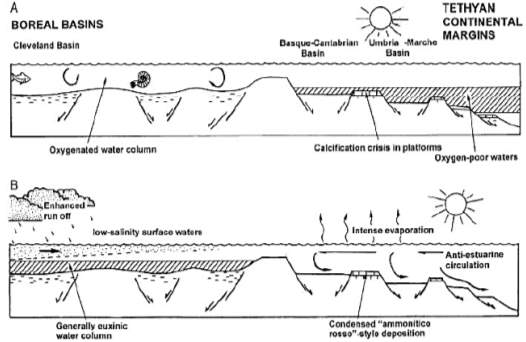
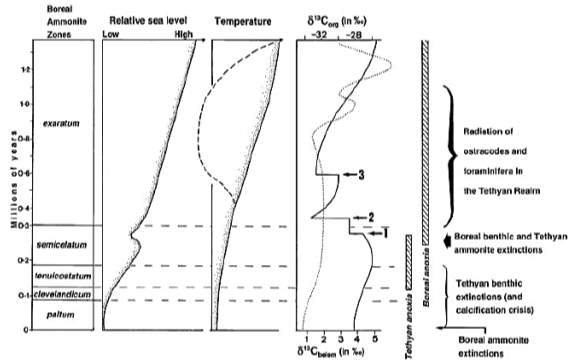 Fig. 14. Summary of paleo-environmental history of early Toarcian interval (Wignall et al., 2005)
Fig. 15. Cartoon reconstruction of the Boreal to Tethyan transition during early Jurassic (Wignall et al., 2005)
Subzone which explains the brief period of overlap in progressive distribution of black shales in the European region. Such interpretations from Kettleness and Europe both agrees with the timing of Toarcian anoxia to be widespread at least in Europe during the D. semicelatum interval.
- Multi-phased Extinction and Karoo-Magmatism
The multi-phased species level extinction during the PL-TOA interval is potentially global because the ammonite and foraminiferal extinction declines in N America has similar patterns with those in NW European and other Arctic domains as shown in figure 13. In figure 16, the approximate timing of this multi-phased event is known to be the following: 1) the middle Whiteavesi– middle Freboldi Zone at ~186 My, 2) the upper Kunae– lower Carlottense Zone at ~184 My, 3) the upper Carlottense–middle Kanense Zone event at ~183 My, 4) the upper Planulata–lower Crassicosta Zone event between 182 and ~181 My, 5) the middle Crassicosta–Hillebrandti Zone event between ~181 and 180 My, and 6) the Yakounensis Zone event at ~179 – 178 My (Caruthers et al., 2013). According to Jourdan et al. (2008), the Karoo Basin has erupted over a 10Ma duration from 186 to 176 Ma and the main extinction pulses of magmatism occurs from 184 to 181 Ma (Fig. 16). As shown in figure 16, the eruption ages of Karoo Basin correlates with the timing of multi-phased extinction in that four out of six phases occurred within the main-phase of magmatism. The early Pleinsbachian decline thought to be separate from this mass extinction event is within the error range of Karoo magmatism, and late Toarcian decline coincides with the later stage of magmatism. These interpretations in species diversity decline in western N America and Europe, and their timing with the magmatism of Karoo basin eruption support the “Volcanic Greenhous Scenario” as a significant factor during the Pliensbachian Toarcian multi-phased extinction.
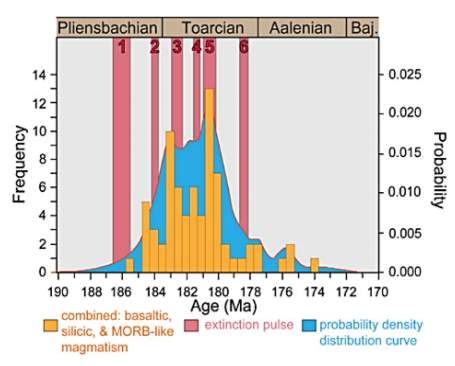
Fig. 16. “Diagram comparing the timing of the multi-phased Pliensbachian–Toarcian extinction with emplacement of the Karoo volcanic province. The 40Ar/40Ar age probability density distribution diagram and frequency histogram of volcanic rocks in the Karoo Basin are modified from Jourdan et al. (2008) to show its correlation in timing with the known phases of extinction. Figure suggests that all six phases of diversity decline occur within the duration of Karoo magmatism. Baj. = Bajocian.” (Caruthers et al., 2013)
- Controversy
Based on the paleo-environmental interpretations and Karoo-magmatism, such Toarcian mass extinction and marine anoxia is triggered by a gradual warming ultimately caused by the release of CO2 from Karoo-Ferrar flood basalt province. However, the timing and geographical extent has recently been questioned, with emphasis placed on regional conditions in the Tethys Ocean area rather than global controls. Caruthers et al., (2014) compare the paleontological and geochemical data from western North America with known correlative data in Europe (Fig. 16); their data indicate that during Pliensbachian-Toarcian interval, synchronous with Karoo-Ferrar magmatism: “(1) there were six globally correlative intervals of taxonomic diversity decline that constitute evidence of a multi-phased extinction event; (2) there was a major disruption in the long-term δ13C profile (∼3‰-7‰), suggesting volcanogenic CO2 outgassing as a preeminent factor driving global warming and mass extinction; (3) there was a large negative excursion in the Early Toarcian δ13C profile in two successions on Haida Gwaii (formerly known as Queen Charlotte Islands), Canada, suggesting global methane release; and (4) the northeast Panthalassa Ocean did not contain anoxic water during the Early Toarcian. (Caruthers et al., 2014)”. Therefore, Caruthers et al. (2014) strongly oppose that the “Toarcian oceanic anoxic event does not appear to have globally affected every marine environment in the same manner, thus it is possible that local anoxic water masses occurred in restricted basins outside the Tethys Ocean area.” Additionally, several negative δ13C excursions start at the end of D. semicelatum Subzone (Fig. 14) in N Yorkshire data, plausibly caused by the release of methane from gas hydrate reservoirs. Beerling et al. (2002) suggested that around 5000Gt of C was released to result in a great catastrophe, yet such claims are not true for two reasons. Firstly, the excursions happened right after the extinctions (in Bed 34 of Fig. 6 & 7) and long after the onset of global warming (Fig. 14). This mean, the “catastrophe” occurred when many species were actually radiating. Secondly, since excursions are present in carbon-rich sediments such as black shale facies, they are to be shown in one of the most stratigraphically complete section of early Jurassic, Cleveland Basin of N Yorkshire. However, regular, fine-scale varves that are formed during anoxic conditions with high hemi-pelagic sedimentation rates, are not present in beds 32 to 34 (of Cleveland Basin succession) that consist of organic-rich and silt laminae.
- Conclusion
Based on the species extinction, sedimentology, fossil ranges, and redox indications in Kettleness section of N Yorkshire, the precise timing of the onset of anoxia is recognised to be during the mid D. semicelatum. Then, the diversity data of ammonite and foraminiferal species in N America are compared to those of Europe to determine if early Jurassic multi-phased extinction events are regional or global. Based on the extinction, origination, and species diversity rate charts that have similar patterns in N America, NW Tethys and, other parts of the Arctic, the geographical degree of PL-TOA mass extinction proves to be global in extent – ammonite family extinction also support this view. Despite different controversies regarding C isotope trends, the evidence in this report suggests a sudden negative carbon isotope excursion is unlikely to explain the extinction and also the gas hydrates methane release to be an irrelevant consequence using the sedimentology and the timing of the onset of global warming and Toarcian anoxia. Overall, this report proposes the progressive warming due to CO2 emission from the eruption of Karoo-Ferrar LIP as the main cause of this mass extinction using three reasons: 1) the Karoo magmatism coincides with the timing of major declines in which four (late PL-early TOA) out of six phases correlate with the main-phase of magmatism, 2) lower PL decline goes within the error range in the start of Karoo magmatism, and lastly 3) upper Toarcian decline coincides with the later stage of magmatism.
References
Beerling, D. J., Lomas, M. R., and Gro¨cke, D. R., 2002, On the nature of methane gas-hydrate dissociation during the Toarcian and Aptian oceanic anoxic events: American Journal of Science, v. 302, p. 28–49.
Bucefalo-Palliani, R. B., Mattioli, E., and Riding, J. B., 2002, The response of marine phytoplankton and sedimentary organic matter to the early Toarcian (Lower Jurassic) oceanic anoxic event in northern England: Marine Micropaleontology, v. 46, p. 223–245.
Cecca, F., and Macchioni, F., 2004, The two early Toarcian (Early Jurassic) extinctions events in ammonoids: Lethaia, v. 37, p. 35–56.
Dean, W.T., Donovan, D.T., Howarth, M.K., 1961. The Liassic Ammonite zones and subzones of northwest European province; Bulletin of the British Museum (Natural History). Geology 4, 435–505.
Dera, G., Neige, P., Dommergues, J.-L., Fara, E., Laffont, R., Pellenard, P., 2010. Highresolution dynamics of Early Jurassic marine extinctions: the case of Pliensbachian– Toarcian ammonites (Cephalopoda). Journal of the Geological Society of London 167, 21–33. http://dx.doi.org/10.1144/0016-76492009-068.
Dera, G., Pucéat, E., Pellenard, P., Neige, P., Delsate, D., Joachimski, M., Reisberg, L., Martinez, M., 2009. Water mass exchange and variations in seawater temperature in the NW Tethys during the Early Jurassic: evidence from neodymium and oxygen isotopes of fish teeth and belemnites. Earth and Planetary Science Letters 286, 198–207.
Dommergues, J.-L., Fara, E., Meister, C., 2009. Ammonite diversity and its palaeobiogeographical structure during the early Pliensbachian (Jurassic) in the western Tethys and adjacent areas. Palaeogeography, Palaeoclimatology, Palaeoecology 280, 64–77.
Doyle, P., 1990, The British Toarcian (Lower Jurassic) belemnites, Part 1: Palaeontographical Society Monograph 584, p. 1– 49.
Doyle, P., 1992, The British Toarcian (Lower Jurassic) belemnites, Part 2: Palaeontographical Society Monograph 587, p. 1– 49.
Droser, M. L., and Bottjer, D. J., 1986, A semiquantitative field classification of ichnofabric: Journal of Sedimentary Petrology, v. 56, p. 558–559.
Foote, M., 2000. Origination and extinction components of taxonomic diversity: general problems. Paleobiology (supplement 26), 74–102.
Hallam, A., 1987. Radiations and extinctions in relation to environmental change in the marine Jurassic of north west Europe. Paleobiology 13, 152–168.
Hallam, A., 1975, Jurassic environments: Cambridge, United Kingdom, Cambridge University Press, 239 p.
Hallam, A., Wignall, P.B., 1997. Mass Extinctions and Their Aftermath. Oxford University Press, Oxford (320 pp.).
Hallam, A., 1986, The Pliensbachian and Tithonian extinction events: Nature, v. 319, p. 765–768.
Hammer, Ø., Harper, D., 2006. Paleontological Data Analysis. Blackwell Publishing, Massachusetts (351 pp.).
Hammer, Ø., 2003. Biodiversity curves for the Ordovician of Baltoscandia. Lethaia 36, 305–313.
Harland, W. B., Armstrong, R. L., Cox, A. V., Craig, L. E., Smith, A. G., and Smith, D. G., 1990, A geologic time scale 1989: Cambridge, United Kingdom, Cambridge University Press, 263 p.
Harnik, P.G., Lotze, H.K., Anderson, S.C., Finkel, Z.V., Finnegan, S., Lindberg, D.R., Liow, L.H., Lockwood, R., McClain, C.R., McGuire, J.L., O’Dea, A., Pandolfi, J.M., Simpson, C., Tittensor, D.P., 2012. Extinctions in ancient and modern seas. Trends in Ecology & Evolution 27, 608–617
Haq, B. U., Hardenbol, J., and Vail, P. R., 1988, Mesozoic and Cenozoic chronostratigraphy and cycles of sea-level change, in Wilgus, C. K., et al., eds., Sea-level changes: An integrated approach: Society of Economic Paleontologists and Mineralogists Special Publication 42, p. 71–108.
Howarth, M. K., 1992a, The ammonite family Hildoceratidae in the Lower Jurassic of Britain, Part 1: Palaeontographical Society Monograph 586, p. 1–106.
Howarth, M. K., 1992b, The ammonite family Hildoceratidae in the Lower Jurassic of Britain, Part 2: Palaeontographical Society Monograph 590, p. 106–200.
Howarth, M. K., 1962, The Jet Rock Series and Alum Shale Series of the Yorkshire Coasts: Proceedings of the Yorkshire Geological Society, v. 33, p. 381–422.
Howarth, M. K., 1962, 1973, The stratigraphy and ammonite fauna of the Upper Liassic Grey Shales of the Yorkshire coast: Bulletin of the British Museum of Natural History, Series Geology, v. 24, p. 235–277.
Jenkyns, H. C., 1988, The early Toarcian (Jurassic) anoxic event: Stratigraphic, sedimentary, and geochemical evidence: American Journal of Science, v. 288, p. 101–151.
Jourdan, F., Féraud, G., Bertrand, H., Watkeys, M.K., Renne, P.R., 2008. The 40Ar/39Ar ages of the sill complex of the Karoo large igneous province: implications for the Pliensbachian–Toarcian climate change. Geochemistry, Geophysics, Geosystems 1–20, Q06009. http://dx.doi.org/10.1029/2008GC001994.
Little, C.T.S., Benton, M.J., 1995. Early Jurassic mass extinction: a global long-term event. Geology 23, 495–498.
Little, C.T.S., 1995. The Pliensbachian–Toarcian (Lower Jurassic) Extinction Event. PhD. Thesis University of Bristol, Bristol, England.
Miller, E.L., Grantz, A., Klemperer, S.L. (Eds.), 2002. Tectonic evolution of the Bering Shelf–Chukchi Sea–Arctic Margin and adjacent landmasses: Geological Society of America Special Paper, 360 (387 pp.).
Myers, K. J., and Wignall, P. B., 1987, Understanding Jurassic organic-rich mudrocks—new concepts using gamma-ray spectrometry and palaeoecology: examples from the Kimmeridge Clay of Dorset and the Jet Rock of Yorkshire, in Leggett, J. K., and Zuffa, G. G., editors, Marine clastic sedimentology: London, Graham and Trotman, p. 172–189.
Newton, R., 2001, The characterisation of depositional environments using Fe, S and C geochemistry: United Kingdom, University of Leeds, Ph.D. thesis, 208 p.
Raiswell, R., Newton, R., and Wignall, P. B., 2001, A water column anoxicity indicator: resolution of biofacies variations in the Kimmeridge Clay (Upper Jurassic, UK): Journal of Sedimentary Research, v. 71A, p. 286–294.
Riccardi, A. C., Damborenea, S. E., and Mancen˜ido, M. O., 1990, Jurassic taxa ranges and correlation charts for the Circum Pacific: 3. South America and Antarctic Peninsula: Newsletters on Stratigraphy, v. 21, p. 75–103.
Sælen, G., Tyson, R. V., Telnæs, N., and Talbot, M. R., 2000, Contrasting watermass conditions during deposition of the Whitby Mudstone (Lower Jurassic) and Kimmeridge Clay (Upper Jurassic) formations, UK: Palaeogeography, Palaeoclimatology, Palaeoecology, v. 163, p. 163–196.
Smith, P. L., and Tipper, H. W., 1986, Plate tectonics and paleobiogeography: Early Jurassic (Pliensbachian) endemism and diversity: Palaios, v. 1, p. 399– 412.
Smith, P.L., 2006. In: Haggart, J.W., Enkin, R.J., Monger, J.W.H. (Eds.), Paleobiogeography and Early Jurassic molluscs in the context of terrane displacement in western Canada: Geological Association of Canada Special Paper, 46, pp. 81–94.
Wignall, P. B., and Newton, R., 1998, Pyrite framboid diameter as a measure of oxygen deficiency in ancient mudrocks: American Journal of Science, v. 298, p. 537–552.
Wignall, P.B., 2001. Large igneous provinces and mass extinctions. Earth-Science Reviews 53, 1–33.
Wignall, P.B., 2005. The link between large igneous province eruptions and mass extinctions. Elements 1, 293–297.
Cite This Work
To export a reference to this article please select a referencing stye below:
Related Services
View allRelated Content
All TagsContent relating to: "History"
History is a topic that covers humanity and past events, allowing us to study and understand human society and how it has changed over thousands of years. By looking back at previous events in history, we can begin to understand how humanity developed over time and formed life as we know it today.
Related Articles
DMCA / Removal Request
If you are the original writer of this dissertation and no longer wish to have your work published on the UKDiss.com website then please:


