Dissertation on Connected Vehicle Road Safety
Info: 7588 words (30 pages) Dissertation
Published: 18th Nov 2021
Tagged: TechnologyTransportation
Assessing the Safety Effects of Different Roadway Features in School zones: A Microsimulation Study
ABSTRACT
This study evaluated the effectiveness of Connected Vehicle (CV) technologies in adverse visibility conditions using microscopic traffic simulation. Traffic flow characteristics deteriorate significantly in reduced visibility conditions resulting in high crash risks. This study applied CV technologies on a segment of Interstate I-4 in Florida to improve the traffic safety under fog conditions. Two types of CV approaches (i.e., connected vehicles without platooning (CVWPL) and connected vehicles with platooning (CVPL)) were applied to reduce the crash risk in terms of three surrogate measures of safety: the standard deviation of speed, the standard deviation of headway, and rear-end crash risk index (RCRI). This study implemented Vehicle-to-Vehicle (V2V) communication technologies of CVs to acquire real-time traffic data using the microsimulation software VISSIM. A car following model for both CV approaches was used with an assumption that the CVs would follow this car following behavior in fog conditions. The model performances were evaluated under different CV market penetration rates (MPRs). The results showed that both CV approaches improved safety significantly in fog conditions as MPRs increase. To be more specific, the minimum MPR should be 30% in order to provide significant safety benefits in terms of surrogate measures of safety for both CV approaches over the base scenario (non-CV scenario). In terms of surrogate safety measures, CVPL significantly outperformed CVWPL when MPRs were equal or higher than 50%. The results also indicated a significant improvement in the traffic operation characteristics in terms of average speed.
Keywords: Connected vehicles, Platooning, Surrogate safety measures, Rear-end crash risk, Vehicle-to-vehicle, Car following model,
1. INTRODUCTION
Traffic crashes are a serious safety concern and it is more serious when it involves with school-age pedestrian as there has been an increase in the number of school-age pedestrians and cyclists injured and killed throughout the years. Most of the states set a lower speed limit at school zone area to protect children from severe crashes. However, drivers often do not comply with these speed limits. Sometimes, some school zones require drivers to reduce their speed suddenly which may cause a variation of speed between vehicles and it may result in rear-end crashes. As with school zones, drivers are needed to modify their on-going behavior with the flashing red lights of school bus, but some drivers react more quickly while others may take more time to stop for a school bus which may cause severe crashes. According to National Highway Traffic Safety Administration (NHTSA) 324,710 fatal motor vehicle traffic crashes occur between 2006 to 2015 and of those crashes, 0.4% (1,172) were classified as school transportation related. Number of crashes at school zone area is high enough in USA as well as in Florida and it also has an increasing trend which means a lot to focus on school zone safety. (from FARS database)
Although there have already been a lot of research conducted on traffic safety in school zone area, there is a lack of studies to assess safety the effects of specific roadway treatments. Moreover, most of those studies focused on different types of traffic control devices i.e. flashing beacon with different sign and marking, speed monitoring display (SMD), dynamic message sign (DMS) etc. (reference) to improve safety in school zone area but they hardly focus on the traffic safety. Also, those kinds of traffic control devices improve pedestrian safety to some extend depending on the location of school and driver’s compliance rate, but these may create problem to the drivers due to lots of control features or quicker reaction.
So, the objective of this study was to apply different safety strategy to reduce crash in school zone. In this paper, the top most crash prone school zones were selected based on previous crash statistics and a network was built in microsimulation software (VISSIM) to analyze different safety strategy i.e. two step speed reduction, reducing collector road etc.
2. BACKGROUND
In order to improve traffic safety in school zone, drivers are normally required to slow down and pay more attention to complex driving environment following specific signs and markings. Previous research found that the impact of speeding is acute with the presence of high percentage of vulnerable road users (1) (Pedan et al., 2004) and school zones are the prominent of them (Roper et al., 2006). Furthermore, child pedestrian crashes are more likely to happen closer to school zones than farther away (2)(3). Ellison et al. (4) examined the speeding behavior in school zones in Sydney, Australia by using GPS. In this study, they observed 147 drivers over five weeks and focused on both the duration and magnitude of speeding and the differences related to a number of driver, trip, vehicle and road characteristics. The result showed that over 20 percent of the distance driven in school zone area is at speed higher than the posted speed limit (40 km/h) and 8 percent is driven at 10 km/h or more speed than the above speed limit. Also, the study implied that the over-speeding rate in school zone is higher than urban arterials and residential streets. In addition, Roper et al. (2006) found that approximately half of all vehicles exceeded the speed limit and Kattan et al. (5) showed that around 10% of the vehicles exceeded the speed by 10 km/h or higher than the posted speed limit. A similar result was found by McCoy et al. (6) that the driver compliance with the posted speed limit is less than 20 percent. A posted speed limit in school zones depends on the roadway characteristics on which the school is located and the preceding segments of the roadway before the school zones start(4). This study also showed that if the speed of the previous segment is higher than 70 km/h then it is difficult to reduce the speed with the posted speed limit (40 km/h).
A traffic sign usually used to deliver a warning and advise to motorists is one of the most effective tool to regulate driver actions. A failure to regulate driver behavior is considered a major contributor to road traffic crashes (7). This situation is worse in school zone areas due to the presence of children. Numerous studies have been conducted to analyze traffic control device performance in school zone area and most of them concentrated on the effectiveness of sign, marking and the combination of them. Hawkins et al. (8) conducted a studied in College station, Texas to determine the effectiveness of rear facing school speed limit beacons to reduce the speed limit and found that it can substantially reduce speed in school zone area. Similarly, Rose et al. (9) measured traffic speed before and after the installation of rear-facing school speed limit beacons in the field and found that a flashing beacon installed at the end of the school zone was a potentially effective means of improving speed limit compliance in school zones. Also, Saibel et al. (10) Lindenmann (11) found that the presence of flashing lights or beacons with school zone signs was effective in slowing traffic down. In a study of differential effects of traffic sign in school zones in New South Wales, Sydney, Australia (12), it was found that the combination of written text and flashing lights were the most effective in reducing vehicle speed at 40 km/h speed limit when motorists interrupted by signalized traffic intersections. It also found that flashing lights only sign could reduce the speed but not below the posted speed limit where there was no difference between text only and no sign conditions. Another study was conducted in North Carolina about the effectiveness of school zone flashers and found that no practical difference in vehicle speed between flasher and non-flasher locations during school time hours (13).
Speed monitoring display (SMD) is another type of traffic control device, which provides actual feedback to drivers on their actions within the school zone and by using radar it shows the drivers both the posted speed limit and their speed at which they are travelling. Lee et al. (14) conducted a study in South Korea to evaluate the effectiveness of speed monitoring display to reduce the speed in school zone area and in this study the location was selected with high visibility, low congestion and no presence of other signal to evaluate the sole effect of SMD. The study also investigated the short and long-term effect of SMD and found that SMD can reduce speed more in short term than long term. Although in both case the speed is lower than the previous condition. For example, Speed Monitoring Displays (SMD) can reduce speed by 17.5% (8.2 km/h) and 12.4% (5.8 km/h) at the SMD location for short term and long-term study respectively in school zones area. Also, another study (15) of utilizing SMDs conducted in Utah and found that safety and efficiency vary by locations and SMDs can reduce speed and there is no negative impact on the safety of a location. Furthermore, a study (16) was conducted to measure the effectiveness of Dynamic Speed Display Signs (DSDSs) in school zone and found that speeds were reduced by 9 mph at the school speed zone where DSDSs present, but it can be more effective if appropriate site conditions apply.
National Highway Traffic Safety Administration (NHTSA) in Portland, Oregon conducted a study and determined how automated speed enforcements (ASE) impacted speed reduction efforts in school zones and how public accepted and perceived their presence. ASE measure the vehicle speed and if the speed is higher than the posted speed it will automatically give ticket to the violators. School speed limits in Oregon are 20 mph and this study used ASE’s in five different school zones 2-3 times a week for a three-month period during the school year. The results were compared to five school zones to the surrounding school where there were no ASE present. The result showed that average speed dropped when ASE’s present when flashing beacon on and off. This drop was 3-4 mph more when flashing beacon is on. Therefore, it can be concluded that ASE dropped the vehicle speed and it is more effective when paired with flashing beacon.
Zhao et al. (17) conducted a study in China to examine the effectiveness of traffic control devices on driver behavior. This research used driving simulator experiment to assess the effect of school zone signs and marking for two different types of schools. Average speed, relative speed difference, standard deviation of acceleration and 85th percentile speed was used to evaluate the effectiveness of traffic control device, which were derived from driving simulator. Result showed that flashing beacon with school crossing warning ahead, reduced speed and school crossing warning ahead and the school crossing pavement markings were recommended for the school zone adjacent to a major multilane roadway characterized by high traffic volume and median strip. It also showed that school crossing ahead pavement markings were recommended for minor two-lane roadway. Zhang (2005) conducted an experiment using a driving simulator to evaluate the effectiveness of speed limit signs on the highways and van der Horst et al. 2007 (18), using a driving simulator found that when a guardrail appeared on the side of the road, drivers tended to move away from it. Moreover, Ben-Bassat et al. (19) used driving simulator to study the effect of shoulder width, guardrail and roadway geometry on driver perception and behavior.
Although these existing studies and established guidelines provides useful information regarding traffic control device, sign and marking effectiveness in school zone area, very few studies investigated the effect of different roadway features in school zone. So, the objective of this study was to find out the effectiveness different roadway features and measure the traffic safety in school zone area. Furthermore, in most of the previous studies, traffic control devices were installed in school zone and afterward they measured the effectiveness of them. Sometimes, this change created negative impact depending on the location of school zone. Hence, to address this problem, we analyzed the impact of different roadway features in microsimulation environment which can give an indication to transportation planners or engineers prior to implementing different roadway features.
3. SELECTION OF SCHOOL ZONE
To identify the most crash prone school zone for Orange and Seminole county in Florida, we have collected school location data, AADT, total crash for the year of 2012 to 2016 from Signal four Analytics (S4A). We have also collected pedestrian crash data for the same year for the age of 5 to 14 years old children as because before 5 years old most of the children go to school with their parents and after 14 years they are enough matured. So, children with 5 to 14 years age are more vulnerable to crash than others.
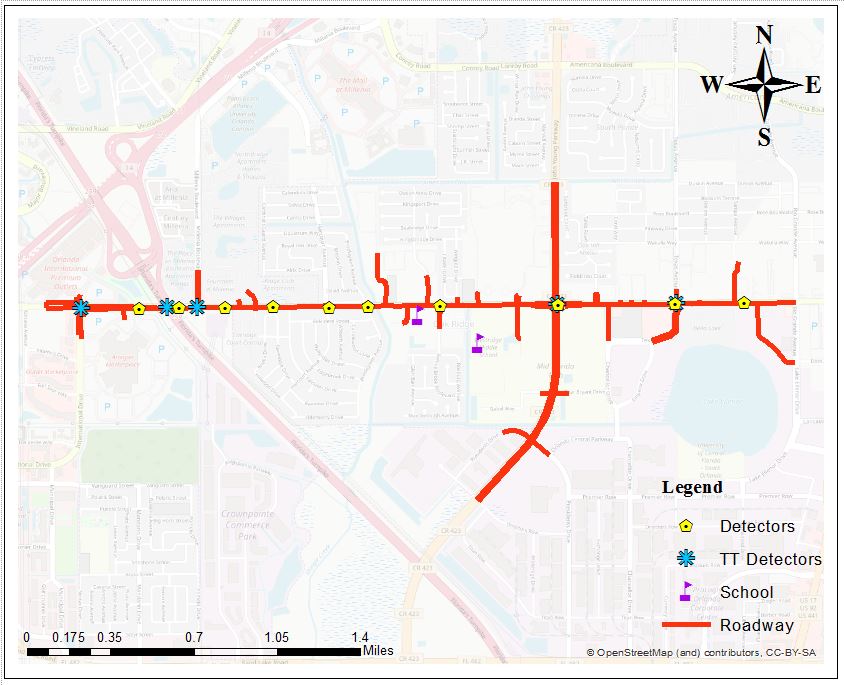
FIGURE 1 The study area showing Fog Monitoring System (FMS) and Regional Integrated Transportation Information System (RITIS).
To define the area of the school zone, we have created 1000 feet buffer (reference) around a school and then count the number of crash inside the buffer area. In this case, we have selected only public school in Orange and Seminole county in Florida as the data for private school were not good enough. Sometimes two or more school zones have overlapped each other, so we merged the overlapped school zone and counted them as one zone. Also, we have chosen the AADT which intersect the buffer area only.
To define the most crash prone school, we have used total crash per daily vehicle mileage travelled (DVMT) within the school zone area. To calculate the DVMT for a school zone, we have multiplied AADT with segment length in miles within the school zone. If there are multiple roadway segment inside the school zone we added them together. We have also counted the total crash inside the buffer area and then divided by the DVMT to find the number of crash per daily vehicle mileage travelled for the school zone. For the crash selection, we have only selected the crashes which were occurred within the 200ft radius from those roadway segment which has AADT. So, we exclude those school zone where there is no roadway segment because in this case DVMT is equal to zero.
Finally, we have identified top ten schools zone based on high crash rate per 1000 miles DVMT which is listed in table-3.
Table 1 Top ten school based on Crash per thousand miles DVMT
| Sl. No. | Name | Type | Total Crash | DVMT | Crash per 1000 miles DVMT | Overlapped |
| 1 | WESTRIDGE MIDDLE | MIDDLE | 248 | 9204.782282 | 26.943 | Yes |
| 2 | SADLER ELEMENTARY | ELEMENTARY | 248 | 9204.782282 | 26.943 | |
| 3 | INNOVATIONS MIDDLE SCHOOL | MIDDLE/JR. HIGH | 411 | 19145.620035 | 21.467 | |
| 4 | ALOMA ELEMENTARY | ELEMENTARY | 333 | 19451.769563 | 17.119 | |
| 5 | PINE HILLS ELEMENTARY | ELEMENTARY | 50 | 2930.918577 | 17.059 | |
| 6 | OAK HILL ELEMENTARY | ELEMENTARY | 416 | 26405.637248 | 15.754 | Yes |
| 7 | SUNSHINE HIGH CHARTER | SENIOR HIGH | 416 | 26405.637248 | 15.754 | |
| 8 | UNION PARK ELEMENTARY | ELEMENTARY | 415 | 27417.999183 | 15.136 | Yes |
| 9 | UNION PARK MIDDLE | MIDDLE | 415 | 27417.999183 | 15.136 | |
| 10 | HOWARD MIDDLE | MIDDLE | 199 | 13314.797712 | 14.946 |
Crash per 1000 miles DVMT will be higher for those school zone where number of crash is higher and DVMT is smaller. From the above Table 1, it has been seen that the highest crash per DVMT is for the Westrige Middle and Sadler Elementary School.
4. DATA COLLECTION
As mentioned above, we found the most crash prone school zone i.e. Westrige Middle and Sadler Elementary School. Hence, for developing microsimulation network, traffic volume was collected during school hours (Thursday) from several location on the major roadway near the school zone. In this study, three types of vehicle compositions are used i.e. PC (Passenger Cars), HGV (Heavy Goods Vehicle), SB (School Bus) and their percentage were 95%, 3% and 2% respectively. Travel time data was collected from HERE along the major roadway for multiple segments. The location of volume and travel time data collection points were shown in Figure.
5. VISSIM SIMULATION MODEL AND CALIBRATION
According to U.S. DOT microsimulation guideline for arterials (Dowling et al. 2004), the model network should extend at least one intersection beyond those within the boundaries of the improvement and it should include areas that might be impacted by the proposed improvement strategies. Therefore, the research team selected the roadways i.e., West Oak Ridge, Millenia Boulevard, South John Young Parkway etc. near West Oak Ridge and Sadler Elementary school were selected that might have a major impact on school zone safety. Hence, a network was developed in VISSIM, version 10.0, which was about 3.21 miles long on West Oak Ridge Road connected with other road named South John Young Parkway (1.7 miles long). Moreover, around 29 driveway accesses and 7 intersections were considered near the school areas. Traffic information including traffic volume (aggregated into 5 minutes), PC (Passenger Cars), HGV (Heavy Goods Vehicle), SB (School Bus) percentage, desired speed distribution was obtained from HERE data. The simulation time was from 7.00 to 9.00 am where first and last 30 minutes were selected for warm-up and cool-down period. Geoffrey E. Heavers (GEH) statistic is a modified Chi-square statistic that incorporates both relative and absolute differences which was used to compare between field and simulated traffic volumes. The GEH statistic. The definition of GEH is as follows, t, n = the vehicle ID, N = the total number of vehicles, δ = the switching variable, ∆t = the time step, which was 0.1 s in simulation, Time= the simulation period, and TTC* = the threshold of TTC. The TTC* is used to differentiate the unsafe car following conditions from ones considered safe. According to previous studies, the values of TTC* varies from 1 to 3 s (21–23).
The TIT notion refers to the entity of the TTC brake lower than the threshold. In accord with TET that the larger values indicate the higher collision risks, a reciprocal transformation is used:
TITt=∑n=1N1TTCbrake(t)-1TTC*.Δt, 0
TIT=∑t=1TimeTIT(t)
A rear-end crash risk index (RCRI) was first proposed by Oh et al. (24). A rear end crash may occur when the two vehicles moving on the same lane and the leading vehicle stops suddenly but the following vehicle does not react with the following vehicle. So, if the following distance between leading and following vehicle is smaller than the stopping distance of following vehicle then rear-end crash may occur. In order to avoid the rear end crash, the following vehicle should follow its leading vehicle by making sufficient gap between them. According to Oh. et al. the RCRI can be expressed as:
SDF>SDL
SDL=vL×h+vL22×aL+lL
SDF=vF×PRT+vF22×aF
Where SDL and SDF are the stopping distance of the leading and the following vehicles, respectively.
lL the length of the leading vehicle,
vL the speed of the leading vehicle,
vF the speed of the following vehicle,
PRT is the perception-reaction time,
h the time headway,
aL the deceleration rate of the leading vehicle and
aF is the deceleration rate of the following vehicle.
Furthermore, Sharikur et al. proposed a new surrogate safety measures derived from RCRI and denoted as time exposed rear-end crash risk index (TERCRI) which is defined as:
TERCRI t=∑n=1NRCRIn(t)×Δt, RCRIn (t)=1,SDF>SDL0,Otherwise
TERCRI=∑t=1TimeTERCRI(t)
In VISSIM, we used three types of vehicle i.e. Car, Heavy Goods Vehicle (HGV) and School Bus (SB). Therefore, different deceleration rates were employed to estimate the reliable safe distance for the leading and following vehicles. The deceleration rate of PC was selected as 3.42 m/s2 where for both HGV and SB the rates were selected as 2.42 m/s2. The PRT was used as 1.5 s which is accepeted by AASHTO (25).
In this paper, we analyzed these three surrogate safety measures for all scenarios and compared between them.
7. RESULTS AND DISCUSSIONS
To evaluate the safety performance in school zone, three surrogate measures of safety were considered. As mentioned earlier, we introduced three key features i.e. two step speed reduction, reduction of collector road, TWLTL to Raised Median (RM) and analyzed TET, TIT and TERCRI index for each feature. Also, we combined the best two or three features and compared with the base scenario. Analysis of Variance (ANOVA) test was conducted to see whether there was significant different between each roadway features or not. Each scenario (base scenario, two step speed reduction, TWLTL to RM) was simulated repeatedly 30 times in order to consider the randomness effect of simulation and made average of the result. At first, the TTC threshold was considered 1.5 second and further sensitivity analysis was conducted for different TTC thresholds from 1 to 3 seconds.
 |
 |
 |
 |
As mentioned earlier, ten different scenarios (3 in TSR, 4 in RDA and 2 in TWLTL to RM) were tested including base. Also, three best combined scenarios (RDA and TSR) were also analyzed to compare with the field condition. The descriptive statistics of three surrogate safety measures (TET, TIT and TERCRI) for all scenarios are presented in Table 1, Table 2 and Table 3 respectively. The (minimum, maximum) values of base scenario for TET, TIT and TERCRI were found to be ranged between [444,620], [113,345] and [123,161] respectively.
In Two-step Speed Reduction (TSR), these measures were ranges between [332,448], [86,218] and [91,113] respectively for 40-25-15 scenario and [337,457], [91,130] and [91,115] respectively for 40-30-15 scenario and [321,437], [83,204] and [89,111] respectively for 40-20-15 scenario. On the other hand, in case of Reducing Driveway Access (RDA), the TET, TIT and TERCRI values were within approximately [358,500], [96,176] and [77,103] respectively for collector 25% scenario and [416,569], [111,157] and [79,108] respectively for collector 50% scenario and [434,571], [117,190] and [86,113] respectively for collector 75% scenario and [383,497], [100,144] and [75,100] respectively for collector 100% scenario. However, the scenario with TWLTL to RM [486,662], [138,206] and [143,176] values were belonging to TET, TIT and TERCRI respectively for Intersection U-turn and [520,685], [156,735] and [147,183] values respectively for Median U-turn scenario.
The higher value of TET, TIT and TERCRI index imply more dangerous situation. Hence, there are higher longitudinal crash risk for base scenario compared to all other scenarios except TWLTL to RM. For Two-step speed Reduction, 40-25-15 and 40-20-15 both show the best result among three of them while for Reducing Driveway Access, collector 100% shows best result among four of them. But for TWLTL to RM, all the three measures are too high than the base case scenario which means higher probability of crash risk than the field condition. The mean values of TET, TIT and TERCRI for all these scenarios are shown in figure which shows that except TWLTL to RM (intersection u-turn and median u-turn) all the scenarios can reduce the value of these surrogate safety measures. Also, the standard deviation of TET, TIT and TERCRI index are high for base scenario than two-step speed reduction and reducing driveway access. The values of standard deviation for TET, TIT and TERCRI index are shown in Table 1,2 and 3 respectively.
Moreover, we combined the best scenarios (Collector 100% and 40-25-15, 40-20-15, 40-30-15 separately) for analyzing surrogate safety measures found that all three combined scenarios outperformed than all other scenarios. The minimum, maximum, mean and standard deviation of TET, TIT, TERCRI values for three combined scenarios are very low than base condition which shown in Table1,2 and 3.
TABLE 2 Summary Statistics of TET
| TET | ||||||
| Scenarios | Sub-Scenario | Run | Mean(s) | Std Dev(s) | Minimum(s) | Maximum(s) |
| Base | Base | 30 | 548 | 43 | 444 | 620 |
| Two step speed Reduction | 40-25-15 | 30 | 399 | 31 | 332 | 448 |
| 40-30-15 | 30 | 407 | 31 | 337 | 457 | |
| 40-20-15 | 30 | 384 | 30 | 321 | 437 | |
| Reducing Driveway Access | Collector 25% | 30 | 438 | 37 | 358 | 500 |
| Collector 50% | 30 | 498 | 39 | 416 | 569 | |
| Collector 75% | 30 | 506 | 37 | 434 | 571 | |
| Collector 100% | 30 | 444 | 31 | 383 | 497 | |
| TWLTL to RM | TWLTL to RM (Intersection U-turn) | 30 | 580 | 41 | 486 | 662 |
| TWLTL to RM (Median U-turn) | 30 | 614 | 42 | 520 | 685 | |
| RDA and TSR | Collector & 40-25-15 | 30 | 319 | 27 | 263 | 380 |
| Collector & 40-20-15 | 30 | 291 | 25 | 239 | 352 | |
| Collector & 40-30-15 | 30 | 327 | 26 | 276 | 383 | |
| TIT | ||||||
| Base | Base | 30 | 158 | 40 | 113 | 345 |
| Two step speed Reduction | 40-25-15 | 30 | 112 | 27 | 86 | 218 |
| 40-30-15 | 30 | 108 | 10 | 91 | 130 | |
| 40-20-15 | 30 | 103 | 25 | 83 | 204 | |
| Reducing Driveway Access | Collector 25% | 30 | 122 | 15 | 96 | 176 |
| Collector 50% | 30 | 132 | 12 | 111 | 157 | |
| Collector 75% | 30 | 137 | 14 | 117 | 190 | |
| Collector 100% | 30 | 118 | 10 | 100 | 144 | |
| TWLTL to RM | TWLTL to RM (Intersection U-turn) | 30 | 171 | 15 | 138 | 206 |
| TWLTL to RM (Median U-turn) | 30 | 202 | 104 | 156 | 735 | |
| RDA and TSR | Collector & 40-25-15 | 30 | 70 | 7 | 54 | 86 |
| Collector & 40-20-15 | 30 | 62 | 8 | 52 | 85 | |
| Collector & 40-30-15 | 30 | 74 | 7 | 61 | 91 | |
TABLE 2 Summary Statistics of TERCRI
| Scenarios | Sub-Scenario | N | Mean(s) | Std Dev(s) | Minimum(s) | Maximum(s) |
| Base | Base | 30 | 144 | 10 | 123 | 161 |
| Two step speed Reduction | 40-25-15 | 30 | 101 | 6 | 91 | 113 |
| 40-30-15 | 30 | 103 | 6 | 91 | 115 | |
| 40-20-15 | 30 | 100 | 6 | 89 | 111 | |
| Reducing Driveway Access | Collector 25% | 30 | 88 | 6 | 77 | 103 |
| Collector 50% | 30 | 93 | 7 | 79 | 108 | |
| Collector 75% | 30 | 99 | 7 | 86 | 113 | |
| Collector 100% | 30 | 86 | 7 | 75 | 100 | |
| TWLTL to RM | TWLTL to RM (Intersection U-turn) | 30 | 160 | 9 | 143 | 176 |
| TWLTL to RM (Median U-turn) | 30 | 165 | 9 | 147 | 183 | |
| RDA and TSR | Collector & 40-25-15 | 30 | 46 | 4 | 39 | 58 |
| Collector & 40-20-15 | 30 | 44 | 4 | 38 | 56 | |
| Collector & 40-30-15 | 30 | 50 | 4 | 43 | 65 |
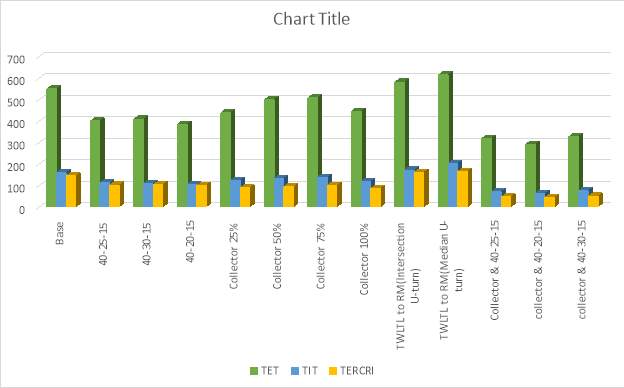
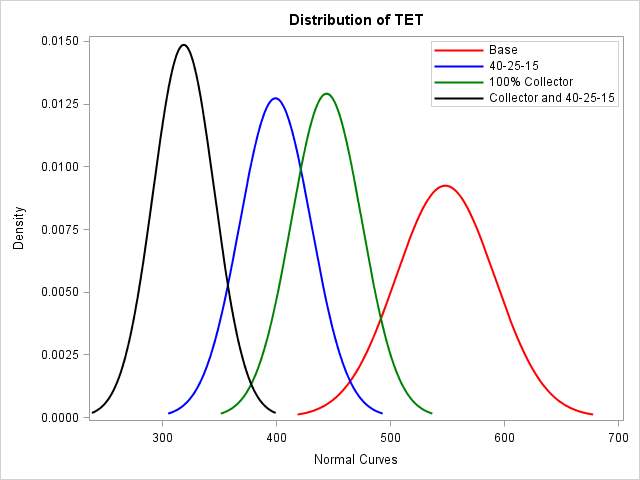
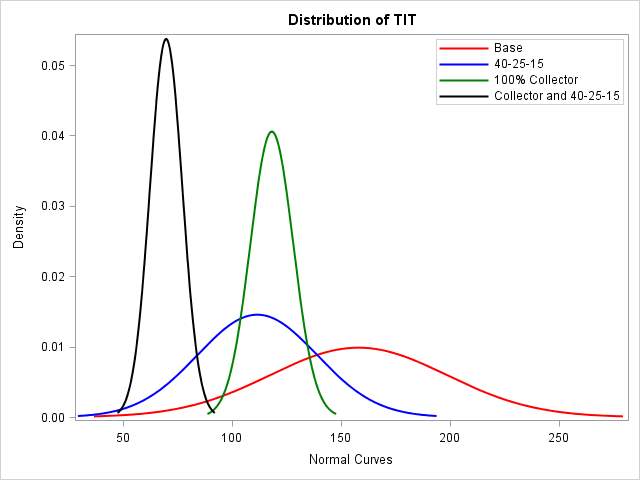
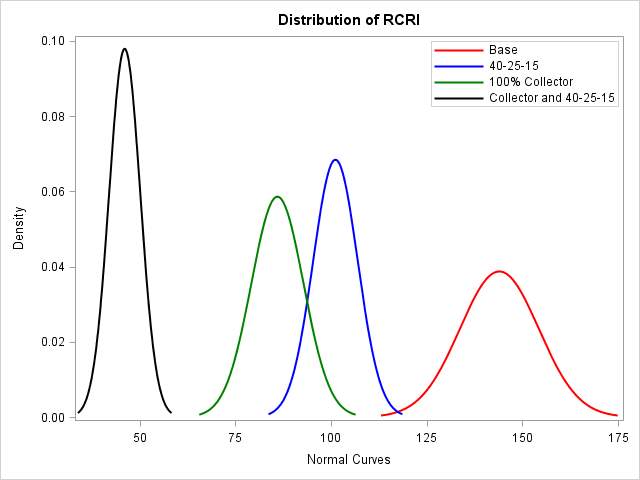
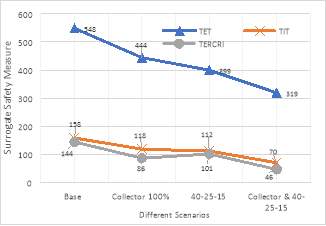
FIGURE 4
As show in figure, the distribution of TET, TIT and TERCRI of base, 40-25-15, collector 100% and collector & 40-25-15 scenarios approximately followed the normal distribution because of the random effect of simulation. Furthermore, the value of TET, TIT and TERCRI for these four scenarios are presented in Figure which shows that all three scenarios improved a lot than base scenarios but the combined scenarios (collector & 40-25-15) reduced TET, TIT and TERCRI values approximately by 42%, 56% and 68% respectively than base scenario.
The One-way ANOVA analysis are also presented in Table which indicates significant differences among all thirteen scenarios including base and infer that collector & 40-25-15 outperformed than the other scenarios. Moreover, we tested ANOVA separately for two-step speed reduction and reducing driveway access and combination of RDA (collector 100%) and TSR which showed that the sub-scenarios are also significantly different from each other in each scenario.
TABLE One-way ANOVA analysis of TET, TIT, and TERCRI.
| Measures | Attribute | Sum of squares | DF | Mean Squares | F-value | Significance |
| TET | Between Groups
Within Groups Total |
3743678
447026.3 4190704 |
12
377 389 |
311973.1
1185.74 |
263.10 | |
| TIT | Between Groups
Within Groups Total |
591372
432244 1023616 |
12
377 389 |
49280.97
1146.53 |
42.98 | |
| TERCRI | Between Groups
Within Groups Total |
563198
18342 581540 |
12
377 389 |
46933.12
48.65 |
964.65 |
The above results of TET and TIT are mainly based on the same parameter setting of TTC threshold is 1.5 s. Sensitivity analysis of TTC thresholds were also conducted. The various values TTC threshold do not affect the results of simulations. The three values of TTC threshold ranging from 1 to 3 seconds have almost same results. Compared with base scenario, all the reductions of TET and TIT values maintain within 35% to 7%, 24% to 16% respectively for Scenario 1 and 19% to 10%, 25% to 17% respectively for Scenario 2. And TET, TIT values reduced higher for Scenario 3 which is 42% to 14%, 56% to 37% respectively.
| TTC* (s) | Scenarios | Base condition | Scenario 1
(40-25-15) |
Scenario 2 (Collector 100%) | Scenario 3 (Collector 100% & 40-25-15) | ||||
| Measures | TET | TIT | TET | TIT | TET | TIT | TET | TIT | |
| 1.5 | Average value | 549 | 158 | 88 | 40 | 444 | 118 | 319 | 70 |
| Changing proportion | – | – | 35% | 24% | 19% | 25% | 42% | 56% | |
| 2.0 | Average value | 772 | 269 | 648 | 218 | 678 | 211 | 581 | 143 |
| Changing proportion | – | – | 16% | 19% | 12% | 21% | 25% | 47% | |
| 3.0 | Average value | 1001 | 416 | 931 | 349 | 905 | 343 | 863 | 264 |
| Changing proportion | – | – | 7% | 16% | 10% | 17% | 14% | 37% | |
8. CONCLUSION
The main objective of this paper was to assess the safety of different roadway features in school zone area based on micosimulation results. At first, the most crash prone school zone was identified base on total crash per thousand miles DVMT (Daily Vehicle Miles Travelled) which was furtuher analyze by microsimulation software. The simulation experiments were designed by deploying three major scenarios i.e. Two-step speed reduction, Reducing Driveway Access and TWLTL to RM with some sub scenarios and three surrogate safety measures i.e. TET, TIT and TERCRI were analyzed for all scenarios separately and also their combined effect.
Results indicated that the implementation of TSR and RDA significantly affected the logitudinal safety in school zone area. The distribution of the three surrogate safety measures follow normal distribution because of the stochastic nature of simulation. The value of TET, TIT and TERCRI were larger for base scenario compared to all other scenario except TWLTL to RM. In TWLTL to RM, two sub scenarios were tested and found that all the surrogate safety measures were larger than base scenario and the reason was large number of traffic made U-turn both at the intersection and median which caused more crash risk. All the sub scenarios in TSR and Collector 100% sub scenario in RDA showed lesser surrogate safety measure than all other scenarios. And the combination of these two types outperformed than all other scenarios. One-way ANOVA analysis showed that there was significant difference among all other scenarios and also individual sub scenarios but only best three of them with base scenario was presented. Also, sensitivity analysis was conducted for different value of TTC thresholds to compare the result among all the best three scenarios.
Even so, the authors recognize that there are some important issues which are needed to be investigated. In this study, only the surrogate safety measures are considered but in case of RDA, TWLTL to RM scenarios, there should be some delay which is not studied through this paper. Thus how to capture the delay and analyzed it is worthy of being studied.
REFERENCES
1. Peden, M., R. Scurfield, D. Sleet, D. Mohan, A. A. Hyder, E. Jarawan, and C. Mathers. World Report on Road Traffic Injury Prevention. 2004.
2. Abdel-Aty, M., S. S. Chundi, and C. Lee. Geo-Spatial and Log-Linear Analysis of Pedestrian and Bicyclist Crashes Involving School-Aged Children. Journal of Safety Research, Vol. 38, No. 5, 2007, pp. 571–579. https://doi.org/10.1016/j.jsr.2007.04.006.
3. Warsh, J., L. Rothman, M. Slater, C. Steverango, and A. Howard. Are School Zones Effective? An Examination of Motor Vehicle versus Child Pedestrian Crashes near Schools. Injury Prevention, Vol. 15, No. 4, 2009, pp. 226–229. https://doi.org/10.1136/ip.2008.020446.
4. Ellison, A. B., S. Greaves, and R. Daniels. Capturing Speeding Behaviour in School Zones Using GPS Technology. Road and Transport Research, Vol. 22, No. 4, 2013, pp. 30–42.
5. Kattan, L., R. Tay, and S. Acharjee. Managing Speed at School and Playground Zones. Accident Analysis and Prevention, Vol. 43, No. 5, 2011, pp. 1887–1891. https://doi.org/10.1016/j.aap.2011.04.009.
6. McCoy, P. T., and J. E. Heimann. School Speed Limits and Speeds in School Zones. Transportation Research Record, Vol. 1254, 1990, pp. 1–7.
7. Kirmizioglu, E., and H. Tuydes-Yaman. Comprehensibility of Traffic Signs among Urban Drivers in Turkey. Accident Analysis and Prevention, 2012. https://doi.org/10.1016/j.aap.2011.11.014.
8. Hawkins, H. G. Rear-Facing School Speed Limit Beacons. ITE Journal (Institute of Transportation Engineers), 2007.
9. Rose, E. R., H. G. Hawkins, A. J. Holick, and P. Bligh. Evaluation of Traffic Control Devices: First Year Activities. Vol. 7, No. 2, 2004.
10. Saibel, C., P. Salzberg, R. Doane, and J. Moffat. Vehicle Speeds in School Zones. ITE Journal (Institute of Transportation Engineers), 1999.
11. Lindenmann, H. P. The Effects on Road Safety of 30 Kilometer Per Hour Zone. ITE Journal, No. June, 2005, pp. 50–54.
12. Gregory, B., J. D. Irwin, I. J. Faulks, and E. Chekaluk. Differential Effects of Traffic Sign Stimuli upon Speeding in School Zones Following a Traffic Light Interruption. Accident Analysis and Prevention, 2016. https://doi.org/10.1016/j.aap.2015.10.020.
13. Simpson, C. Evaluation of Effectiveness of School Zone Flashers in North Carolina. Transportation Research Record: Journal of the Transportation Research Board, 2008. https://doi.org/10.3141/2074-03.
14. Lee, C., S. Lee, B. Choi, and Y. Oh. Effectiveness of Speed-Monitoring Displays in Speed Reduction in School Zones. Transportation Research Record, 2006. https://doi.org/10.3141/1973-06.
15. G., A. K., and S. Mitsuru. Field Evaluation of the Effect of Speed Monitoring Displays on Speed Compliance in School Zones. Applications of Advanced Technology in Transportation (2006).
16. Ullman, G., and E. Rose. Evaluation of Dynamic Speed Display Signs. Transportation Research Record, 2005. https://doi.org/10.3141/1918-12.
17. Zhao, X., J. Li, J. Ma, and J. Rong. Evaluation of the Effects of School Zone Signs and Markings on Speed Reduction: A Driving Simulator Study. SpringerPlus, 2016. https://doi.org/10.1186/s40064-016-2396-x.
18. van der Horst, R., and S. de Ridder. Influence of Roadside Infrastructure on Driving Behavior: Driving Simulator Study. Transportation Research Record: Journal of the Transportation Research Board, Vol. 2018, No. November 2014, 2007, pp. 36–44. https://doi.org/10.3141/2018-06.
19. Ben-Bassat, T., and D. Shinar. Effect of Shoulder Width, Guardrail and Roadway Geometry on Driver Perception and Behavior. Accident Analysis and Prevention, Vol. 43, No. 6, 2011, pp. 2142–2152. https://doi.org/10.1016/j.aap.2011.06.004.
20. Minderhoud, M. M., and P. H. L. Bovy. Extended Time-to-Collision Measures for Road Traffic Safety Assessment. Accident Analysis and Prevention, Vol. 33, No. (1), 2001, pp. 89–97.
21. Li, Z., Y. Li, P. Liu, W. Wang, and C. Xu. Development of a Variable Speed Limit Strategy to Reduce Secondary Collision Risks during Inclement Weathers. Accident Analysis and Prevention, Vol. 72, 2014, pp. 134–145.
22. Sultan, B., M. Brackstone, and M. McDonald. Parameter Analysis for Collision Avoidance Systems. 2002.
23. Li, Y., H. Wang, W. Wang, S. Liu, and Y. Xiang. Reducing the Risk of Rear-End Collisions with Infrastructure-to-Vehicle (I2V) Integration of Variable Speed Limit Control and Adaptive Cruise Control System. Traffic Injury Prevention, Vol. 17, No. (6), 2016, pp. 597–603.
24. Oh, C., S. Park, and S. G. Ritchie. A Method for Identifying Rear-End Collision Risks Using Inductive Loop Detectors. Accident Analysis and Prevention, Vol. 38, No. 2, 2006, pp. 295–301. https://doi.org/10.1016/j.aap.2005.09.009.
25. American Association of State Highway and Transportation Officials (AASHTO). A Policy on Geometric Design of Highways and Streets. Washington, D.C., 2004.
Cite This Work
To export a reference to this article please select a referencing stye below:
Related Services
View all


Related Content
All TagsContent relating to: "Transportation"
Transportation refers to the process of goods, people or animals being moved from one place to another. There are multiple methods of transport, including train, boat, bus, plane, lorry, and more.
Related Articles

DMCA / Removal Request
If you are the original writer of this dissertation and no longer wish to have your work published on the UKDiss.com website then please: