Designing a Conventional Water Treatment Plant
Info: 9845 words (39 pages) Dissertation
Published: 28th Sep 2021
Tagged: Civil Engineering
Table of Contents
1.0 Introduction
1.1 Water Quality Analysis
1.2 Additional Treatment Required
2.0 Overview of Water Treatment Unit Processes
2.1 Intake and screening
2.2 Coagulation (rapid mix)
2.3 Flocculation
2.4 Clarification / Sedimentation
2.5 Filtration
2.6 Disinfection
3.0 Water Treatment Plant (WTP) Design
3.1 WTP lay-out and flow capacity
3.2 Intake Screen Design
3.3 Coagulation Design
3.3.1 Dosage
3.3.2 Sizing
3.4 Flocculator Design
3.4.1 Size and Rational Speed requirement
3.4.2 Diffuser Wall Type I between flocculators
3.4.3 Diffuser Wall Type II to Sedimentation Basin
3.5 Sedimentation / Clarification Design
3.6 Granular Filtration Design
3.7 Chlorination Disinfection
3.8 Sludge Drying Lagoons
4.0 Environmental Impacts
5.0 Alternate Treatment Processes
6.0 References
1.0 Introduction
While the main role for treating drinking water is to make it safe, it’s also important to treat water for aesthetic purposes. No one wants to drink discolored, odorous water no matter how safe it is.
People like water to taste clear, look clear and smell clear; and it’s the quality of the water source that will determine what kind of treatment it will need. For instance, mountain spring water fresh from ice will need very little treatment when compared to river water that contains high sediments or groundwater that can be salty or brackish.
Generally, the water treatment design and planning process is driven by factors such as, water source availability and quality, sustainability assessments of treatment and source options that weigh financial, social and environmental parameters, legal regulatory requirements and the availability of land, skillsets and technology (Crittenden, 2012). In a conventional water treatment plant (WTP), raw water undergoes a series of processes which include the units below. In addition, Australian drinking water is treated with fluoride and the pH is adjusted.
- Intake and screening
- Coagulation (rapid mix)
- Flocculation
- Clarification/sedimentation
- Filtration
- Chlorination/disinfection
- Residual management
1.1 Water Quality Analysis
Table 1 is a comparison of the existing raw water quality of the river of interest compared to the Australian Drinking Water Guidelines (ADWG) recommendations. If ADWG recommendations were not listed for a parameter, then recommendations from the U.S Environmental Protection Agency (EPA) or other government agencies were used. Both Health-based and Aesthetic-based requirements are outlined.
From the table, river water quality meets recommendations for parameters like the minerals magnesium, lead and calcium. However, minerals such as sodium and iron exceed the aesthetic limit.
A significant health concern from the river is the insecticide Dieldrin content which is too high; the recommended level here is 0.0003mg/L and the Dieldrin river level is between 0.0005-0.01 mg/L. That is up to 33 times more than the recommended limit. Total dissolved solids (TDS) parameter is also at the maximum health limit of 600 mg/L. The ADWG does not list any particular limit on Total Organic Carbon (TOC), however the U.S EPA recommends less than 2mg/L of TOC for water to be safe to drink. This indicates the TOC levels in the river can be too high as TOC fluctuates between 2 to 15mg/L.
Table 1. River Water Quality Analysis. Dieldrin previously used as insecticides and in combination with Aldrin shouldn’t exceed 0.0003mg/L (ADWG p.372)
| Parameter | Unit | Average Value | ADWG recommendations
Health |
ADWG recommendations
Aesthetic |
| pH | mg/L | 6.8 | ||
| Sodium | mg/L | 200 | – | 180 |
| Calcium | mg/L | 80 | 60-200 (CaCO3) | |
| Magnesium | mg/L | 36 | 25-50 | |
| Chloride | mg/L | 210 | 250 | |
| Sulfate | mg/L | 18 | 250 | |
| Total iron | mg/L | 2.8 | 0.3 | |
| TDS | mg/L | 600 | 0-600 | |
| Turbidity | NTU | 1-17 | 5 | |
| TOC | mg/L (organic C) | 2-15 | ||
| Dieldrin | mg/L | 0.0005-0.01 | 0.0003 | |
| Lead | μg/L | 0.1-0.3 | 0.01 |
1.2 Additional Treatment Required
Since Dieldrin and TOC are the main parameters of safety concern for this river, the WTP must address these concerns. According to ADWG (p.372) only 30% of Dieldrin can be removed by conventional chlorine disinfection. And chlorination has no effect on TOC. However, 85% of both TOC and dieldrin can be removed by Granular Active Carbon filtration (G.A.C). Therefore, the WTP to be designed will include a review of alternate treatment technologies that can treat these parameters. These technologies will be:
- Ozonation (a more advanced disinfection method)
- Active Carbon Filtration (a more advanced adsorption filtration method)
- Nanofiltration (a Reverse Osmosis method)
2.0 Overview of WTP unit processes
2.1 Intake and screening
First, large floating objects like leaves and sticks are separated with bar rack screens so the mechanical equipment and pumps in the subsequent processes are safe. Smaller macro particles are removed with finer mesh screens and grit removers. Additionally, the more effective the screening is, the less maintenance is required for subsequent treatment units. As it passes through it is naturally aerated so it can react with the surrounding air and release its odors and gases. After the water passes through the screens, sediments that are more difficult to settle goes to the next stage.
2.2 Coagulation (rapid mix)
Water then reaches the coagulation stage. At this stage, the water still has fine light particles that cannot be physically removed. The tiny particles are called colloids. To remove these colloids a chemical coagulant is added in a series of tanks and mixed vigorously in a flash mixer through which the chemical is evenly distributed throughout the process. A coagulant is a salt – like Aluminum Sulfate or Ferric Sulfate – which binds colloids together forming larger heavier flocs. A pH adjustment is sometimes required here to attain optimum coagulation.
2.3 Flocculation
After the coagulation process, the water is transferred to the flocculation chambers. the coagulation process with flash mixing destabilizes the smaller particles and in flocculation process the water is gently mixed for about an hour to aid the formation of larger particles called flocs. These can be easily removed when the water travels to the sedimentation chamber.
2.4 Clarification / sedimentation
This process is primarily aimed at preparing the water for subsequent filtration. At this point water, along with the flocs, pass into a specially designed tank known as a clarifier or sedimentation tank. Here the flocs have time to settle and clump together to form sludge which is heavy enough to sink allowing cleaner water to pass into the next stage. The sludge is collected and disposed. After this process, only a few unsettled particles are left which could be filtered in the next stage. This process has four stages. First, the velocity is decreased to a degree that the flow is uniformly distributed in the sedimentation basin. The second zone is used for settling, the velocity of the water has really slowed down and the suspended particles can be settled out here. The third stage is where there is a smooth transition of water from sedimentation basin to filtration chambers and lastly there is the sludge zone where the settled solids are collected to be removed
2.5 Filtration
The water now needs to be filtered slowly through fine sand-like material which could be placed in separate layers to get rid of any remaining dissolved particles these particles could be a mixture of suspended organic and inorganic particles such as fine silts and clays or bacteria and cysts. Even though disinfection acts as the basic defense against pathogens, if filtration is done properly, the load on disinfection is considerably reduced which increases the efficiency of the disinfection process. Filtration is made from single sand media or mono media or dual media with sand and the addition of Anthracite, a type of coal or Granular Active Carbon (G.A.C).
If water is heavy with organic compounds like in some rivers, further types of purification methods can be used such as ozone purification which is a disinfection step also. Here O3 is bubbled through water into a tank. The O3 reacts with organic compounds which can pass out of the water as gas. The water can then be filtered through G.A.C or carbon granules to further take out undesirable traces of organic materials. The particles in the end are trapped by the filtered medium which could be later washed out by filter backwashing.
2.6 Chlorination disinfection
Lastly, the treated water must be disinfected to make sure harmful pathogens are killed, while not all pathogens are required to be killed, what is required is pathogens to be inactivated so they do not replicate or reproduce. The water must travel a long way to end users, thus, to ensure it is pathogen-safe until then a certain amount of chlorine is added. Lastly the pH levels are controlled to make it as relatively neutral as possible and fluoride is added. Water is stored in storage tanks and ready for use.
3.0 Water Treatment Plant (WTP) Design
Figure 3.0 Unit Operation in a Conventional WTP (Pham, 2017)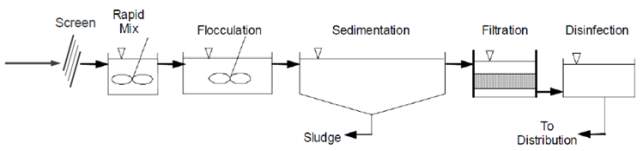
Figure 3.0 Unit Operation in a Conventional WTP (Pham, 2017)
3.1 WTP layout and flow rate capacity
Figure 3.0 displays the WTP Unit processes which include:
1. Intake Screen Design
2. Coagulation Flash Mixer
3. Flocculators
4. Sedimentation / Clarification Design
5. Granular Active Carbon Filtration Design
6. Disinfection / Chlorination dosage
7. Sludge / Residual Management
Annual Average Daily Flow (AADF): 100 ML/day = 1.0 x 10⁸ L/d = 1.15 m3/s
Design Flow Rate (Q): 150 ML/d = 1.5 x 10⁸ L/d
1444 mins or 86,400 seconds (s) in 24 hours or 1 day (d)
Q = 150 ML / 86,400 = 1.736 x10⁻³ ML/s
= 1.736 m3/s or 1736 L/s
= 104.2 m3/min or 104,200 L/min
3.2 INTAKE SCREEN DESIGN
Assumptions
A manual bar screen will be used in the approach channel with a velocity of 0.6 m/s (Va).
The bars are 10 mm thick and openings are 3cm wide
Angel inclination is 60o
Using best hydraulic design for a rectangular channel L:W of 1.5
vsc = velocity of flow through the screen (ms-1)
va = velocity in approach channel, 0.6 ms-1
Determining dimension of the cross section of the channel
Q= 1.73m3/s
va= 0.6
L:W = 1.5
A across = Q/ Va = 1.73/0.6 = 2.88m2
L x W = 1.5 x W2
W = √ (2.88 / 1.51) = 1.38 m
L = 1.5 x 1.38 = 2.06
Therefore, width of channel is 1.12 m and length of the channel is 1.68 m
Therefore, width of channel is 1.38 m and length of the channel is 2.06 m
Determine area of the screen
Ascreen = Lscreen x W
Lscreen = 2.06 / Sin60 = 2.06/0.86 = 2.39 m
Ascreen = 2.39 x 1.12 = 2.68m2
Determine number of bars in the screen (n)
Number of bars = n à number of spaces = n + 1
a = opening between bars = 0.01 m
b = thickness of the bars = 0.03 m
W = (n x 0.01) + (n+1) x 0.03 = 1.12
= 0.04n + 0.03 = 1.12
n = 28 bars
Determine velocity through the screen (vsc)
vsc = Q/Aopening
Aopening = (a) x (b) x L
= (n +1) x (0.03) x (1.68)
= 1.46 m2
vsc = 1.15/1.46
Screen Velocity is sufficient as it is less than the maximum recommended flow velocity of 1 ms-1
Determine headloss through a clean coarse screen
hL = headloss through the coarse screen (m)
g = gravitation acceleration (9.81 ms-2)
Cd = discharge coefficient, 0.84
vsc = velocity of flow through the screen (ms-1)
va = velocity in approach channel
hL = 1 / 2gC2d (v2sc – v2a) = 1 / 2x 9.81 x 0.842 (0.782 – 0.62) = 0.0173 m or 17.3 mm
3.3 COAGULATION / RAPID MIX DESIGN
3.3.1 Coagulant Dosage
Assume tests have shown optimum coagulation occurs when 1 L of raw water is dosed with 0.004L of a 10,000mg/L Aluminum Sulfate (alum) solution and 0.0016mL of a 5000mg/L suspension of lime (Ca(OH)2). Q= 1.73m3/s or 1736 L/s
- Amount of alum in 0.004L: 40 mg = 0.004 x 10,000
- Amount of lime in 0.0016L: 8 mg = 0.0016 x 5000
This was added to 1 L raw water sample and therefore alum dose is 40mg/L and lime dose is 8mg/L. Thus daily chemical dose requirements to treat a flow of 1736L/s is calculated below.
Daily dosage requirements
Alum: 40 x 1736 x (24×3600) = 6000 kg/d
Lime: 8 x 1736 x (24×3600) = 1200 kg/d
3.3.2 Design of Flash Mixer – Propeller Type
Design considerations:
Square tanks (perform better than cylindrical)
Fixed baffles
Flat bladed impeller better than a fan propeller type
Introducing chemicals at the mixer blade level shows improved coagulation
Typical design:
G : 1000 s-1, t = 30 s
Power input of 26.4 – 52.7 kW/(m3/s) for dt =
Have 6 mixer chambers, 3 in parallel, each having a total of 2 in series
Basin size, number and configuration
Q= 1.73m3/s
Choosing t= 30 s
D:W ratio: 1.5
Vtotal chamber = Qx t = 51.9 m3
Square tank = D x L x W = (1.5 x W) x (W2) = 51.9 m3
L = W = 3√ 51.9 / 1.5 = 17.64m
D = 1.5 x 17.64 =26.4m
V = 8,214 m3
Divided by 6 chambers, 3 parallel each having a total of 2 in series
Each chamber will be = 342 m3
Mechanical mixing intensity
Based on Camp-stein Root-Mean-Square (RMS) velocity gradient
G = √ (P/ μ.V)
P = G2 x μ.V
= 10002 x 1x 103 x 51.9
= 5.19 x 10¹⁰ W = 5.19 x 10⁷ kW
Energy efficiency of 80% accounted for:
Pinput = 5.19×10⁷ / 0.8 = 6.4×10⁶ kW
Power divided by 6 chambers = 1×10⁶ kW
Rotational speed required
P= pNpN3D5 = μVG
Np = power number dependent on the blade configuration
P = density of liquid (kg.m3) (TSS + TDS + Density of Water)
N = rotational speed (rev.s-1)
D = Diameter of impeller (m)
G = RMS velocity gradient
V = volume of mixing vessel
Assumptions:
Assume Np = 1.35 according to Post Mixing Optimization 2017 (http://www.postmixing.com/mixing%20forum/impellers/pr.htm)
Assume p = TDS + TSS + Water Density (kg.m3)
TDS is 600mg/L (See table 1) = 0.06 kg/m3
Assume TSS is also 600mg/L = 0.06 kg/m3
Water Density 1g.cm3 = 0.0001 kg / cm3, therefore water density is 1000kg/m3
p = 0.06 + 0.06 + 1000 = 1000 kg/m3
Assume :
D = 2 meters
G = 5.19 x10² kW
V = 342 m3 per vessel (chamber) and there are 6 chambers
Therefore rotational speed required:
N = 3√(p x Np x D5) / P
N = 3√ 1000 X 1.35 x 32/ 1000000 = 0.62 rev.s-1
3.4 FLOCCULATOR DESIGN
Horizontal Paddle Flocculators were selected for this WTP as the turbidity and suspended solids in the raw water quality was relatively high. This design requires a clarification process, which is designed later in this report. This is due to the larger heavier flocs generated by Horizontal Paddle Flocculators.
Table 1.0 Design Criteria for Horizontal Paddle flocculators (An Ninh, 2017)
|
Parameter |
Unit |
Value |
|
Velocity gradient, G |
s-1 |
40 |
|
Tip speed |
m/s |
|
|
Rotational speed |
rev/min |
0.5-3.0 |
|
Compartment dimensions W L |
m m |
3-25 3-8 |
|
Diameter of wheel |
m |
3.5 |
|
Paddle board |
mm |
100 x 150 |
|
Paddle board length |
m |
2-3.5 |
|
Ap/tank section area |
% |
Less than 20 |
|
Paddle tip speed |
m/s |
4m/s (strong floc) 2 m/s (weak floc) |
|
Spacing between paddle wheels on same shaft |
m |
1 |
|
Clearance from basin walls |
m |
0.7 |
|
Minimum basin depth |
m |
1 + D (1m |
|
Minimum clearance between stages |
m |
1 |
Assumptions:
No headloss occurs
Designed with 2 parallel trains and each train is to be made of 5 compartments in series
Detention time dt = 20 min
Two paddle wheels exist in each compartment
Each paddlewheel has 4 arms and 3 paddle board on each arm with leading edges located at 0.67, 1.33 and 2m from the shaft centreline.
Width of paddle board is 0.15m
Assume dynamic viscosity of water (μ) is 1.31 x 10³ kg.s
Assume fluid density (p) is 998 kg/m3
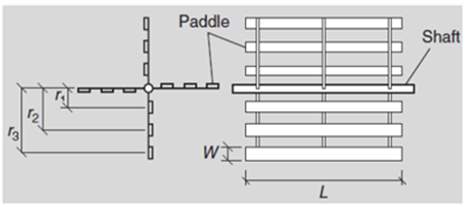
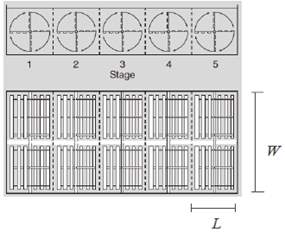
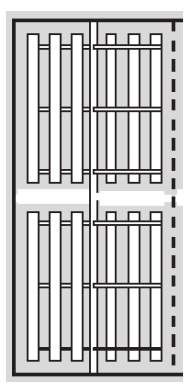
Figure 3.4 Horizontal Paddle Flocculator Design (An 2017) Bottom left: Top view of the unit showing 2 parallel trains and each train is to be made of 5 wheels / compartments in series. Top & Bottom left: Cross section and close up of each wheel, showing each one has 4 arms with 3 paddle boards on each arm. Bottom right: Top view of one compartment, showing 2 wheels and 3 paddle boards on each arm from the center shaftline.
3.4.1 Size and Rotational Speed requirement
Determine dimension of the compartment:
Q= 104.2/min
Detention time (dt) = 20 mins
Volume of each compartment:
Vcomp= (104.2×20)/(2×5) = 208.4m3
Minimum basin depth (Table 1) Dcomp = 1 + diameter of wheel Dp = 1 + 2 x 2 = 5m
Minimum length of compartment: Lcomp = 2 x 0.7 + 2 x 2 = 5.4m
Width of basin: Wcomp = V/(LxD) = 208.4/(5×5.4) = 7.72m
Compartment dimension: L x W x D = 5.4 x 7.7 x 5 = 207.9m3
Length required for clearance: 2 x 0.7 + 1 = 2.4m
Length of each paddle = (7.7 – 2.4)/2 = 2.7m (in the recommended range in Table 1)
Power required to achieve a velocity gradient of, G = 40s-1
P = G2 x μ x V = 402 x 1.31 x 103 x 208.4 = 437 W
Rotational Speed of the Paddle Shaft (R)
G2 x μ x V = P = CDAppvR3/ 2
CD= drag coefficient on paddle, dimensionless
Ap= projected area of paddle, m2
p = fluid density (assumed 998 kg/m3)
vR = velocity of paddles relative to fluid, m/s (100% with baffles)
Calculation of CD for flat paddle board:
Lp:Wp = 2.7:0.15 = 18 CD= 1.5 according to Reynolds no. for paddle
Calculation of Ap for one paddle board:
Ap x Lp x Wp = 2.7 x 0.15 = 0.405
Calculation of vR for each paddle (vR1,vR2,vR3)
vR1 = (2r1 π) x N
vR2 = (2r2 π) x N
vR3= (2r3 π) x N
Each paddle has 3 paddle boards with leading edges located at 0.67, 1.33 and 2m from the shaft centreline.
Width of paddle boards are 0.15m
R is the rotational speed of the paddle shaft (rev/min)
Therefore:
r1 = 0.67 – 0.15 / 2 = 0.595m
r2 = 1.33 – 0.15 / 2 = 1.255m
r3 = 2 – 0.15 / 2 = 1.925m
Finding N using power input to the water by one paddle arm,3 paddle arms will generate different power inputs to the water (P1, P2, P3), but for simplicities sake one paddle arm will be calculated.
Parm= P1 + P2 + P3 = ½ CD xAp x p x (vR13 + vR23 + vR33) = ½ CD xAp x p x (2πN)3 x (r13 +r23 +r33 )
= ~ 7 x 10⁵ x N3
Since there are 2 wheels and each wheel has 4 arms of similar energy input, the total power input to the water by paddles in one compartment should be:
Pcomp = 2 x 4 x Parm = 7 x 2 x 4 x 105 x N3
56 x 105 x N3 = 437 W
N = 0.043s-1 or 2.56m-1 (rev/min)
3.4.2 Diffuser Wall Type I between flocculator compartments
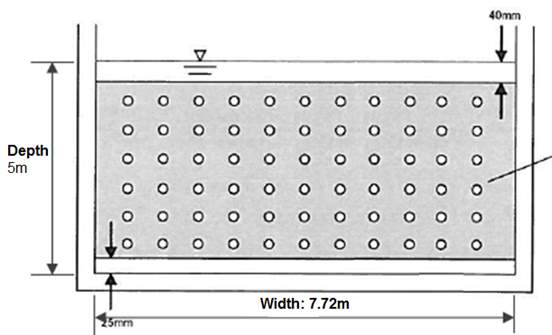
Figure 3.4.2 Type I Diffuser wall between each compartment. Circular holes are placed at vertical and horizontal spacing at 0.6m to give total of 66 holes (6 x 11), 25 mm of clearance below the baffle and 40 mm above the wall, from Section 3.4.1 the width and depth of the wall is provided as 5m and 7.72m respectively.
Table 3.4.2 Design Criteria for Type I Diffuser wall
| Parameter | Unit | Guideline |
| Opening area | % of flow cross-section | 2-5 |
| Velocity through orifice | m/s | 0.55 |
| Headloss across baffle | mm | 7-9 |
| Submergence of highest port | mm | 15 |
| Clearance below baffle for sludge removal | mm | 25 |
Opening diameters for circular holes:
Open area required for v = 0.55m/s is Across = Q/v = 1.73/0.55 = 3.14m2
Opening area due to clearance: A= 0.04 x 7.72 x + 0.025 x 7.72 = 0.5 m2
Total hole area: A = 3.14 – 0.5 = 2.64 m2 and for each hole Ahole = 2.64 / 66 = 0.04 m2
Hole diameter required: d1 = √ (5 x 0.04 / π) = 0.25m2
3.4.3 Diffuser Wall Type II to Sedimentation Basin
Similarly to Type I, Type II Diffuser wall will be a similar figure to Figure 3.4.2 but with a lower velocity through orifice and lower headloss of 0.35 mm and 3-4 mm respectively (Table 3.4.3). This will be accounted into the calculation of the diameter openings.
Table 3.4.3 Design Criteria for Type II Diffuser wall
| Parameter | Unit | Guideline |
| Opening area | % of flow cross-section | 2-5 |
| Velocity through orifice | m/s | 0.35 |
| Headloss across baffle | mm | 3-4 |
| Submergence of highest port | mm | 15 |
| Clearance below baffle for sludge removal | mm | 25 |
Opening diameters for circular holes:
Open area required for v = 0.35m/s is Across = Q/v = 1.73/0.35 = 4.94m2
Opening area due to clearance: A= 0.04 x 7.72 x + 0.025 x 7.72 = 0.5 m2
Total hole area: A = 4.94 – 0.5 = 4.44 m2 and for each hole Ahole = 4.44 / 66 = 0.067 m2
Hole diameter required: d1 = √ (0.067 / π) = 0.14m (within recommended range of 0.1-0.2 m)
3.5 SEDIMENTATION DESIGN
Horizontal Flow Rectangular Sedimentation Basin
Basin number, size and configuration
Basin width and depth depends on the size of sludge removal equipment, the largest being 6m in width for chain and flight sludge collector. Basin width in increments of 6 m will therefore be considered, starting with 6 m. Assume:
Width based on largest size for sludge removal equipment, 6 m in width, starting with 3 intervals (18m)
Water Depth of 6 m
Qmax = maximum daily flow assumed to be 1.5 times the Design Average Flow (Q) which is 1.73 x 1.5 = 2.6 m3/s
Basin Area
In order for particles to be removed, their settling velocity (vs) must be equal to or greater than the Overflow rate (OR). Here, it is assumed to be equal to vs at 2.2 m.h
Aplan = Qmax / OR = (2.6 x 3600 s.h) / (2.2 m.h x 2.6) = 6228/3.8 = 1800 m2
Aplan = L x W = 1800
L = 42.4 m
Checking design criteria:
The L:W and L:D and W:D ratios are all greater than the minimum recommended Reynolds value (OK)
Detention times at Qmax (acceptable range 1.5-4h)
dt Qmax = 18 x 42.4 x 6 / 1 x 3600 = 1.27 h OK , less than 2 which is valid
Horizontal Flow velocity (mean velocity should be between 0.3 – 1.1 m/min)
vf = Q/Across = 2.6 / (60m x 6) x 2.6 x 60 sec.min = 1.12 m/min
Checking Reynolds number (recommended 20,000 for a horizontal sedimentation basin)
Re = pvfRh / μ
Rh = 6 x 4 / 6 + 2 (6) = 1.33 m
vf = 1.12 m/min = 0.018 m/s
Re = 999.7 x 0.018 x 1.33 / 0.00131 = 18,269
3.5 GRANULAR FILTRATION DESIGN
Table 3.5 Rapid filter design criteria (Pham, 2017)
|
Parameter |
Units |
Value |
|
Filter type |
– |
Conventional, deep-bed dual media |
|
Flow control |
– |
Influent weir split, constant level |
|
Number |
– |
8 |
|
Inside dimensions |
m2 |
Less than 90m2 (10×4.55x 2 cells) |
|
Media surface area (each filter) |
m2 |
91 |
|
Media surface area (total) |
m2 |
728 |
|
Maximum available head |
m |
2.5 |
|
Filtration rate One filter off-line All filters in service |
m.h m.h |
15 13.2 |
|
Filter media Type Depth Effective size Uniformity coefficient Density |
– m mm – – |
Dual media Anthracite & Sand 1.8 1.0
1700 |
|
Backwash criteria Maximum rate Normal rate Duration |
m.h m.h min |
48.2 ~40 15 |
Number of filters N= 5.73Q0.5 = 5.73 x 1.730.5 = 7.5 or 8 filters
Each filter should have two cells
Diameter of each cell:
Size of each filter 90m2/2 cells = 45m2 per cell
Radius of each cell = √(45/3.14) = 3.78m
Diameter of each cell = 3.78 x 2 = 7.6m
Setting Performance criteria:
Effluent Quality: Turbidity ~0.1 NTU
Filter Run length: 1-4days
Recovery (r):
r = VF – VBW – VFTW / VF = UFRV – UBWV – UFWV / UFRV
and vEFF = UFRV – UBWV /tF + tBW
VF = volume of water filtered during one filter run, m3(filtration rate)
UFRV = VF/a = υFtF = unit filter run volume, m3/m2 (a is filter cross sectional area, m2)
UBWV = VBW/a = υBWtBW = unit backwash volume, m3/m2
UFWV = VFTW/a (volume of filter to waste divided by the area of the filter) = υFtFTW= unit filter-to-waste volume, m3/m2
- r > 0.95
- υEFF= effective filtration rate, m/h
Assumptions:
VF = 10m/h
tF= 37.5h
tFW= 15min = 0.25h
VBW = 40m/h
tBW= 0.25h
Determine:
UFRV = VF /a = VF /(Q/ VF) = VF. tF = 10×37.5 = 375m3/m2
UBWV = VBW/a = VBW /(QBW/ VBW) = VBW / QBW. VBW = tBW .VW = 0.25 x 40 = 10m3/m2
UFWV = VFW/a = VFW / QFW/VF = VF .tFW = 10 x 0.25 = 2.5 m3/m2
Recovery needs to be greater than 95%
Recovery:
r = UFRV – UBWV – UFWV / UFRV = 375 -10-2.5/375 = 96.7%
Effective filtration rate:
VEFF= UFRV – UBWV / tF+tBW = 375 – 10 / 37.5 + 0.25 = 9.67m.h
Slightly slow, ideal effective filtration is approx. 20 m/h
Flow-control:
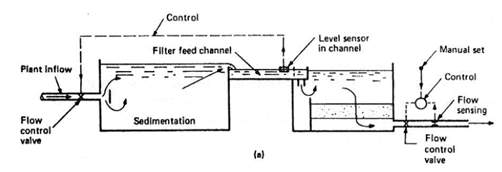
Figure 3.5 Influent weir flow-splitting flow control (Pham 2017). Shows upstream control with equal flow splitting.
In order to accommodate and manage increasing headloss, the WTP will maintain constant head in the filter effluent while varying the upstream head (Pham 2017). This can be done with the influent weir flow split method. Here (Figure 3.5) filters have a common and controlledfeed channel and water is distributed evenly to each filter.
Type of filter media:
1.2m anthracite (d10, UC = p = 1.5) over 0.3m Sand (d10= 0.5,UC p = 2.65)
Clean-bed headloss:
Ergun equation: hL = кυ (1- e)2 . μLυ e3 .pwgd2 + кI (1-e) . Lv2 / e3 .gd
e = porosity (dimensionless)
кυ = headloss coefficient due to viscous forces, unitless
кI = headloss coefficient due to inertial forces, unitless
ρw = fluid density, 1000 kg/m3
υ = filtration rate (superficial velocity), 15m.h or 4.16×10⁻³ m.s
d = media grain diameter, 0.001m, derived from chart of Range of Reynolds numbers for granular filtration technologies (Pham 2017)
μ = dynamic viscosity of fluid, 1.31 x 10³kg/m.s
g =gravity 9.8 m.s
L = depth of granular media, m
Table 3.5.1 e, кυ, кI derived from Kuwumura figures in notes from Pham 2017
| unit | Sand | Anthracite | |
| e | – | 0.41 | 0.50 |
| кυ | – | 112 | 225 |
| кI | – | 2.25 | 4.0 |
| d | m | 0.001 | 0.001 |
| L | m | 0.3 | 1.2 |
Sand hL = 112 (1-0.41)2 . (1.31×103 x 0.3 x 4.16×10-3) / 0.413 x (1000 x 9.8 x 0.0012) + 2.25 (1-0.41) x 0.3x (4.16×10-3)2 / 0.413 x 9.8 x 0.001 = 3.5 m
3.6 DISINFECTION / CHLORINATION
Assume 1 km pipeline contactor will be designed between the WTP and the service reservoir and this pipeline is to be used as a chlorine contactor for the WTP. Applying the Darcy-Weisbach friction factor or f=0.034. Q= 1.73m3/s or 104.2m3/min. Concentration of chlorine is typically 1-16 mg/L, however 2 mg/L chlorine is selected to minimize disinfection by-products (DBPs).
Determine diameter of pipeline:
Q = 104.2 m3/min
Q= v.A = (L/t) (0.25πD2)
D = √ (1000 / 30) / (104.2 / 0.25π) = 0.5m
Area of conduit: A=2πrh+2πr2= 1570.39m2
Dispersion of flow in pipeline:
To achieve a 4 log removal, d must be less than 0.006
d =89,500 f 3.6(D/L)0.859
d = dispersion number, dimensionless
f = Darcy-Weisbach friction factor, unitless
D = diameter of conduit, m
L = length of the pipeline, m
d =89,500 0.034 3.6(0.5/1000)0.859= 6.74 x 10⁻⁴
Resident time of 30 mins is sufficient to achieve a 4 log removal.
3.8 SLUDGE DRYING BEDS
Given:
- Q = 1.73
- Turbidity = average 8 NTUs
- Alum: 40mg/L (See Section 3.3.1 Coagulant Dosage)
- Lime: 8mg/L (Section 3.3.1)
Design considerations for lagoon sludge drying beds (Pham 2017):
- Sizing: dry sludge loading 80 kg/m2 (dry region).
- Each lagoon should be capable of holding sludge over a period of 3-4 months
- Minimum no. of lagoon: 3 (but 4 preferred)
- Depth of liquid sludge: maximum 1.83 m during the filling stage but 1.2 m is preferred
- Shape: minimum L:W = 4:1
- Minimum distance between inlet and outlet: 30 m to prevent flow short circuiting
Sludge production rate: (total dry sludge) = Sludge from turbidity + alum coagulant
- Turbidity (kg/d) = 0.2 (mg/L.NTU) x 8 (NTU)x 1.73 x (24×3600) / 1000 = 239 kg/d
- Alum coagulant (kg/d) = 6000 kg/d (See Section 3.3.1 Coagulant Dosage)
- Sludge production rate (kg/d) = 6000 + 239 = 6239 kg/d
Number and area of lagoons: 10 lagoons selected each would be sized to hold sludge with an average of 4% solids and for a duration of 3 months. Each lagoon has a top water level of 1.83m during filling stage.
The average amount of dry solid: 3months x 30days x 6239kg = 561,510 kg
The required net area for lagoons: 561,510 kg / 80 = 7100 m2
Sludge lagoon volume capacity:
10 lagoons selected, L:W = 4:1,
Dimension of each lagoon: 40m (L) × 10m (W) x 1.83 m (D) initial depth
Length = 40 m (30 m required as a minimum to prevent flow short circuiting)
Providing a total capacity of 7,320m3
Checking:
The total volume of 4% solids sludge would be: V = 561,510/0.04 = 14,037 m3
If the depth of filling cycle is 1.83 m, then the total volume required for 4% solid sludge: A = 14,037/1.83 = 7670m3
4.0 ENVIRONMENTAL IMPACTS
Two major environmental impact parameters were assessed across each unit of the WTP. According standard environmental impact categories of a Life Cycle Assessment (ISO14040), the production of GHG emissions (Global Warming Potential., GWP) affects Ecosystem Quality and Climate Change. Chemical toxicity (such as Aluminum) and eutrophication factors, namely high levels of N and P leaching also impact Ecosystem Quality (De Feo, 2016).
4.1 WTP Units of Highest Environmental Concern
Bonton and Bouchard et al., 2011 conducted an LCA on a conventional WTP and found 99.7% of ecosystem quality impacts came from the production of coagulants (Al) added. This means the the coagulation unit and the sludge management units are two of the units of highest concern.
Granular filtration (from coal by products) was also shown to be the cause of 75% climate change impacts, making the engineering of Filtration process to be important in reducing environmental impact. Electricity for general operation was the cause of 14.5% of adverse climate change and 3% from lorry transportation, assuming electricity and lorry fuel is sourced from fossil fuels.
4.2 Intake
Main consideration is environmental physical footprint and pump velocity and screen size of intake must not disturb the water source environment (Missimer, Hogan et al., 2015), it cannot be too fast that flora/fauna is disturbed. Its important to monitor changes in surface water or groundwater as monitoring may be required to ensure over using the reservoir is avoided. From overuse the river depth could change which kicks of a number of adverse effects such as temperature change in the water as water temperature is highly dependent depth. An example of the affect of screen size and velocity are fauna such as fish eggs and small fish could become trapped altering the ecology downstream.
4.3 Coagulation/Flocculation
The ecosystem quality impacts depends on the type of coagulant used (Crittenden, 2012). With aluminum sulfate proven to be toxic to aquatic fauna and dissolved oxygen conditions in receiving waterbodies with long term high doses (Smeltzer, Kirn et al. 1999). Bulky flocs also impact the amount of sludge and resulting in more landfill. Optimal floc size for water quality should be considered when environmentally planning the coagulation unit.
4.4 Clarification/Sedimentation
Sedimentation tanks take up a large footprint which could mean, if they are not design with the environment in mind, a clearing of a high amount of native vegetation. Industry standard environmental mitigation hierarchy (Water Corporation WA, 2015) stipulates to:
- First order is to avoid the impact altogether
- Second order is to minimize the impact.
- Third if this cannot be done then rehabilitating by restoring the affected area.
- Fourth is reducing the impact over time
- And fifth is compensate for the impact by substituting the environmental loss elsewhere.
Its important to consider minimizing size in areas of high quality vegetation or adopting the mitigation hierarchy if a significant clearing is required.
4.5 Filtration
As explained in section 4.1 since the WTP dual media includes anthracite a form of coal, this will impact resource depletion and secondary environmental impacts in terms of its extraction and transportation. Anthracite is also physically activated in industrial furnaces (Bonton and Bouchard et al., 2011) and results in the release of GHG and other pollutants into atmosphere.
Mitigation and adaptation measures for the use of anthracity (and GAC) is to replace it with coconut shells. Or to adapt the activation process from thermal to a chemical process which prevent gas pollutants (Bonton and Bouchard et al., 2011).
4.6 Disinfection
After water is chlorinated and used it returns back to the Sewage Treatment Plant for processing and likely discharge into the environment. With prolonged long term disinfectant by products (DBPs) in drinking water eventually leads to DBP accumulation in receiving environmental bodies. The US Geological Survey, USGS (Hladik & Focazio et al.,2014) found significantly high DBPs up and downstream of WWTP outfalls and indicated by products are known to be toxic to aquatic fauna.
Toxicology reports have shown that the chlorine in these waters change the pH, alkalinity, hardness and temperatures of water and impact on the aquatic life patterns (Stanley and Smith, 1991). Its important to keep chlorination to a minimum not exceeding 5mg/L (Pham 2017), higher than this results in more DBPs.
4.6 Residual/Sludge management
Increasing Sludge treatment to landfill has adverse environmental effects (Sniffer 2008). Following the hierarchy of environmental mitigation. Treated sludge to landfill can be avoided by including biosolids treatment and recycling sludge for commercial use such as methane gas and soil improvers and fertilizers. Another way is to keep sludge on site with the use of geobags underground, planting green infrastructure on top.
5.0 ALTERNATE TREATMENTS
As mentioned in Section 1.2, since Dieldrin and TOC are the main parameters of safety concern for this river, the WTP must address these concerns. According to ADWG 2011 only 30% of Dieldrin can be removed by conventional chlorine disinfection. And chlorination has no effect on TOC. However, 85% of both TOC and dieldrin can be removed by Granular Active Carbon filtration (G.A.C). This raw river water source could also comprise of other pollutants not measured such as viruses and pathogens. Therefore, the WTP to be designed will include a review of alternate treatment technologies that can treat these parameters. These technologies will be:
- Ozonation (a more advanced disinfection method)
- Active Carbon Filtration (a more advanced adsorption filtration method)
- Nanofiltration (a Reverse Osmosis method)
5.1 Ozonation
Ozonation is a conventional oxidation process using the chemical ozone or O3 through which organic compounds can be removed by converting them into CO2, H2O and mineral acids (Pham 2017, (Eckenfelder, 2000 and Tchobanoglous, Burton and Stensel, 2004). O3 being an oxidizing agent is used when chlorination isn’t sufficient to remove various organic compounds like dieldrin, leading to a higher TOC (Ross, Leeuwen and Grabow, 1976).
Oxidation through ozone is common and does not react with water to create any toxic species but it has a drawback in its use, it is highly unstable at atmospheric temperature and pressure and therefore it must be produced on site and should be used quickly (Gonçalves, 2009). Ozone has various uses when it comes to WTPs, it can be used from pre-oxidation stage all the way to disinfection (Lenntech.com, 2017) and when applied at the end of WTP, ozone can destroy various microorganisms.
Ross, Leeuwin and Grabow, (1976) tested a water sample with 1320 ug/L concentration of dieldrin and when treated with 149 mg/L of ozone in a controlled environment, the concentration of dieldrin was brought down to 14 mg/L hence proving that 99% of dieldrin was disintegrated when treated with ozone.
On the other hand (Ormad et al., 2008) comments that dieldrin removal can be 100% effective when ozone is used in conjunction with other chemical compounds such as powdered activated carbon and 20 mg of aluminum iodide.
Ozone is frequently used before GAC because the combination of both the processes remove organic and inorganic compounds simultaneously which help in improving flocculation and coagulation processes and it also reduces the discharge of the disinfectant byproducts. (Lenntech.com, 2017)
Ozone can also be very effective in removing protozoan pathogens which are parasites that cause a wide range of diseases (Nhmrc.gov.au, 2017) Ozone can also be helpful in removing Trihalomethanes (Kawamura, 2000) which are formed because some of the organics in water react with chlorine and that escapes to the open waters.
5.2 Adsorption
According to Crittenden (2012), adsorption is predominantly the transfer of mass in which organic and inorganic toxic substances are adsorbed or collected onto a solid compound and subsequently removed. In the case for drinking water, adsorption is commonly used to remove compounds with foul taste and odor, artificial organic chemicals, compounds which adds color to water, residual by product of disinfectants and inorganic chemicals such as heavy metals and arsenic. Granular or powdered active carb (GAC) is mostly used as adsorbents to remove toxic chemicals which are dissolved in water (Crittenden, 2012)
Granular Activated Carbon or GAC is commonly used to remove viruses, dieldrin and TOC. It is extremely effective to remove dieldrin (Smith et al., 1991) and removing non-organic matter (NOM) in post filtration (Crittenden, 2012)
The biggest drawbacks of GAC adsorption are that the filter needs constant replacement because there is a lot of waste which is generated through this process. Water must be analyzed constantly to see what type of activated carbon to use and the toxic substances are removed from water but not destroyed (Sswm.info, 2017)
On the other hand, Powdered Activated Carbon (PAC) is highly effective in the removal of various pesticides, organics in low concentrations and foul taste and odor. (Ormad et al., 2008) states that we can remove 85% of dieldrin in water by only using PAC. PAC is sought after not only because of its low cost compared to GAC but also because it can readily be added during all the processes of water treatment and because it creates no head loss and does not encourage bacterial development. One the biggest disadvantage of using PAC is that some toxins require a large amount of PAC for their removal, but once the contact time is increased, the amount of carbon used can decrease. Another problem with the PAC is that it requires constant sludge management and a larger area to expose more surface area contact of the PAC to react with water (Web.deu.edu.tr, 2017)
5.3 Nanofiltration
Membrane separation such as in nanofiltration forces water through a membrane, effectively straining the water and leaving behind the contaminants. The water is forced through the membrane that is less than 1 mm thick using by applying pressure to push it through in a process called Reverse Osmosis (AWWA 2011)
The membrane separation process separates pure H2O from all contaminants essentially producing distilled water. This results in two streams, a stream of pure water and a highly contaminated brine stream that must be disposed of in an environmentally sound manner. According to Cotruvo, J et al. (2010) this is often done by slowly discharging it back to the ocean where it dilutes. It is important that this is done slowly as brine is double or even 10 times the TDS of seawater. Slow discharge prevents salt plumbs from killing marine life.
According to (Brooks G. T., Roberts T. R. and Brooks G. T., 2005) Nanofiltration was initially based on reverse osmoses membrane to remove ions such as calcium, magnesium and soleplates. It was soon realized that due to the pore size around 0.001 pm, organic substances such as trihalomethanes could be greatly removed about 100%. Further studies show that the removal efficiency of nanofilters greatly depend on the membrane and the pesticide type. At about 3 to 5 ug/l, we can remove about 45 to 99% of pesticides. Nanofiltration can remove pesticides and hardness simultaneously. As the membrane of a nano-filter has a pore size of about 10-9 daltons which will separate almost everything except free atoms such as water.
A study in southern Africa shows that nanofiltration can clear brackish water and make it safe for consumption (Grimshaw, 2017) Naturally occurring attapulgite clays and zeolites are used as nano filters and a study in a milk factory in Algeria has shown that we can remove the organic matter from the wastewater using these radially available clays to make it safe for drinking (Grimshaw, 2017).
6.0 REFERENCES
Brooks G. T., Roberts T. R. and Brooks G. T. (2005). Pesticide chemistry and bioscience the food-environment challenge. England: Woodhead Pub.
Bonton C, Barbeau, B., Jedrzejak, S. (2012). Comparative life cycle assessment of water treatment plants. Desalination. 284. 42-54.
Crittenden, J. (2012). MWH’s water treatment. Hoboken, N.J.: John Wiley & Sons.
Cotruvo, J et al. (2010) Deslination Technology: Health and Environmental Impacts, CRC Press
De Feo G, Ferrara C. (2017) Investigation of the environmental impacts of municipal wastewater treatment plants through a Life Cycle Assessment software tool. Environ Technol. 2017 Aug;38(15):1943-1948
Desalination of Seawater: Manual of Water Supply Practices, M61, 1st ed. (2011) American Water Works Association
Eckenfelder, W. (2000). Industrial water pollution control. Boston: McGraw-Hill.
Lenntech.com. (2017). Drinking water preparation. [online] Available at: https://www.lenntech.com/applications/drinking/purification/drinking-water-preparation.htm [Accessed 21 Oct. 2017].
Gonçalves, A. (2009). Ozone: an emerging technology for the seafood industry. Brazilian Archives of Biology and Technology, 52(6), pp.1527-1539.
Grimshaw, D. (2017). Nanotechnology for clean water: Facts and figures. [online] SciDev.Net. Available at: http://www.scidev.net/global/water/feature/nanotechnology-for-clean-water-facts-and-figures.html [Accessed 22 Oct. 2017].
Kawamura, S. (2000). Integrated design and operation of water treatment facilities, 2nd ed. New York: John Wiley.
Hladik, M.L., Focazio, M.J. and Engle, M., 2014. Discharges of produced waters from oil and gas extraction via wastewater treatment plants are sources of disinfection by-products to receiving streams: Science of the Total Environment, v. 466-467, p. 1085-1093
Pham, A.N., (2017) Lecture notes for CVEN9856 Water Treatment, University of New South Wales
HS, S., R, D. and C, B. (2017). Influence of Nanoparticles for Wastewater Treatment- AShort Review. [online] Austinpublishinggroup.com. Available at: http://austinpublishinggroup.com/chemical-engineering/fulltext/ace-v3-id1036.php [Accessed 22 Oct. 2017].
Missimer T.M., Hogan T.W., Pankratz T. (2015) Passive Screen Intakes: Design, Construction, Operation, and Environmental Impacts. In: Missimer T., Jones B., Maliva R. (eds) Intakes and Outfalls for Seawater Reverse-Osmosis Desalination Facilities. Environmental Science and Engineering. Springer, Cham
Nhmrc.gov.au. (2017). Australian Drinking Water Guidelines (2011) – Updated October 2017 National Health and Medical Research Council p.372 [online] Available at: https://www.nhmrc.gov.au/guidelines-publications/eh52 [Accessed 21 Oct. 2017].
Ormad, M., Miguel, N., Claver, A., Matesanz, J. and Ovelleiro, J. (2008). Pesticides removal in the process of drinking water production. Chemosphere, 71(1), pp.97-106.
Ross, W., Leeuwen, J. and Grabow, W. (1976). “Studies on Disinfection and Chemical Oxidation with Ozone and Chlorine in Water Reclamation” by W. R. Ross. [online] Works.bepress.com. Available at: http://works.bepress.com/hans_vanleeuwen/17/ [Accessed 23 Oct. 2017].
Smeltzer E, Richard K., Fiske S. (1999) Long term water quality and biologicaly effects of Alum Treatments of Lake Morey, Vermont. Journal of Lake and Reservoir Management 15(3):175-184
Scottish Government, Forestry Commission (2008) Human Health and the environmental impacts of using sewage sludge on forestry and restoration of direct land. SNIFFER Aug 2008[online] Available at: http://www.fwr.org/sewage/uklq09b.htm [Accessed 22 Oct 2017]
Stanley, S. and Smith, D. (1991). Modelling chlorinated discharges from water treatment plants: a case study. Canadian Journal of Civil Engineering, 18(6), pp.985-994.
Sswm.info. (2017). Adsorption (Activated Carbon) | SSWM. [online] Available at: https://www.sswm.info/content/adsorption-activated-carbon [Accessed 23 Oct. 2017].
Tchobanoglous, G., Burton, F. and Stensel, H. (2004). Wastewater engineering. Boston: McGraw-Hill.
Web.deu.edu.tr. (2017). Wastewater Engineering. [online] Available at: http://web.deu.edu.tr/atiksu/ana52/aryen2.html [Accessed 23 Oct. 2017].
Cite This Work
To export a reference to this article please select a referencing stye below:
Related Services
View all


Related Content
All TagsContent relating to: "Civil Engineering"
Civil Engineering is a branch of engineering that focuses on public works and facilities such as roads, bridges, dams, harbours etc. including their design, construction, and maintenance.
Related Articles

DMCA / Removal Request
If you are the original writer of this dissertation and no longer wish to have your work published on the UKDiss.com website then please: