Evaluation and Efficiency Measurement of E-government System
Info: 15782 words (63 pages) Dissertation
Published: 12th Jan 2022
Tagged: Information SystemsGovernment
In order to serve the society in electronic manner, many developing countries have launched tremendous e-government projects. The strategy of development and implementation e-government system has reached different levels, and to ensure consistency of development, best measure of value-add, progress and if the results of the project concur to the overall vision, objectives and goals of policies and strategies as well as of programs, evaluation is an important aspect. The purpose of evaluation in this guideline is to provide the basis for measuring the value of e-government different projects to the governments as providers of services; and citizens, businesses and non-governmental organizations as receivers of services.
Literal review
Most of e-government systems are driven to achieve operational efficiency and effectiveness in service delivery. Governments work with tight budgets, hence there is an increasing demand to re-examine their spending priorities. Further, e-government programs are subjected to scrutiny to find out whether they are delivering the payoff as has been promised or not. Evaluation of e-government projects is also significant to assess the status of development, perform SWOT analysis as a learning basis [55, 56] and improve policy making for future implementation. Furthermore evaluation provides the basis for more effective policies and strategies by assessing customers’ needs and their expectations [57].
Several evaluation methods exist in the literature in which authors describe the indicators and factors for evaluation. Implementation of e-government initiatives from setting of vision statements to implementation in projects is country-specific, characterized by distinctive political, economic, social, cultural and technological status. Therefore the indicators for measuring the values and benefits of e-government initiatives should reflect the vision of e-government and the status of the country along the mentioned characteristics.
In his publication, M. P Gupta, has argue that there are three kinds of situations that require evaluation in e-government. One is the e-environment; second is evaluating the performance of an e-government programs or project; and third is the overall impact of e-government on general government functioning, economic development and citizen servicing.
Also supported by [58], the authors propose an evaluation framework covering economic, social and technical aspects. The aspects are elaborated further into performance, accessibility, cost-saving, openness, trust and usefulness of e-government initiatives. Other indicators used in evaluation are such as back office and front office (supply and demand), and impact of e-government to government and its customers [55].
Syamsudd in proposes an evaluation framework for developing countries [59] based on the ITPOSMO model (Information, Technology, Processes, Objectives and values, Staffing and skills, Management systems and structures and other resources) developed by Heeks [28]. Heeks uses the model to describe the gap existing between the status of the country implementing e-government and design of e-government initiatives in which he described the gap as highly contributing to the failure of most e-government initiatives in developing countries. There are many evaluation forms have been explored in literature which we summarize some of it and the main objectives have been maintained for. Table 1
Table 12: Evaluation Form
| Re-examine spending priorities |
| The pay-off of e-government investment projects |
| Assessing the status of development |
| Assessing citizen needs and expectation |
| Impact of E-government to government |
| Improving future implementation |
| Overall impact on general e-government functioning (Economic development, public service,…) |
There is no doubt that considering an evaluation form that meets all government objectives is just dust in the wind. Each e-government project has a special goal and special target, dealing with business entity has different perspective as dealing with citizen’s need. In the following section we will examine the evaluation techniques in e-government realm.
Evaluation model of e-government system
Evaluation form today has many more valuation approaches available to them than in last decade. As they address the different challenges, it is an opportune time to consider what 21th century evaluation developments are valuable for future use and which ones would best be left behind. I have, in this section, we attempted to sort some alternative evaluation approaches for e-government development system.
2.1 OECD Evaluation Method
As an important evaluation method that has emerged recently is defined by OECD (2002). It is an evaluation typology that assesses an e-Government initiative according to its relevance, effectiveness, efficiency and internal functioning.
- Relevance: Relevance explains the justification for e-Government projects, by checking the appropriateness of its political/strategic goals against the driving soci-economic needs or factors. Governments use the results of these factors to build their program strategies or business cases. One of these popular dimensions generally used by OECD governments is the level of demand of population groups for e-Government, by assessing population capacity to get online and/or measuring groups’ behaviors and expectations. Generic tools are used at both the program and project level such as official statistics and large surveys. Observation tools which cover very broad population areas can be extremely costly and sometimes are not the most effective evaluation tool to get comprehensive data. Ad hoc surveys, focus groups, or expert panels are normally used instead.
- Effectiveness: Effectiveness assesses the extent to which the project has delivered the desired effects Most of the metrics used to assess the benefits measure, the quality and the frequency of use of electronic services compared to traditional service delivery channels, and sometimes measure the financial benefits. These metrics evaluate the direct effects of e-Government.
- Efficiency and internal functioning: Efficiency checks whether the e- Government initiative could make the same effects with less resources or make a more effective achievement with the same resources. There are mainly two types of measures to judge the efficiency of a program or project:
- Cost benefit analysis (CBA) which measures the efficiency of an organization in terms of monetary terms.
- Cost effectiveness analysis (CEA) with compared public instruments among them which produce similar effects.
An effective application of traditional financial metrics to measure the real efficiency of e-Governments initiatives such as CBA and ROI is a challenging issue from a methodological point of view. The full complexity of a large project, the number of persons concerned, the definition of impacts, the indirect effects, etc. makes the quantification of advantages and costs often very difficult.
Evaluation tools such as CEA and benchmarking instruments seem to be more suitable to e-Government initiatives. On the basis of an established indicator, it is possible to compare, the efficiency of the program or project with similar programs or projects in other regions or countries, or with alternative approaches focusing on the creation of similar effects in the same region.
The UK for instance is launching international benchmarking studies on the basis of a template which covers the main interests of UK for e-Government, in order to check its performance against these criteria and tries through this to improve its performance gaps through the identification of best practices recorded in these studies [25].
Evaluation Methods Used by EU
Kunstelj and Vinter (2004) describe 3 evaluation methods used by the Europe Union.
They are EC1, IDA and EC2.
EC1 Model:
This model focuses on evaluating the development level of e-services. The e-service Development level indicates how far an individual service has developed towards full electronic operation online. The average score for a service is used to calculate the percentage of basic public services available online in an individual country.
IDA Model:
In contrast to the EC1 model, which only evaluates technological and organizational aspects of services, the European Commissions’ IDA model incorporated a more pragmatic approach. The model permits the evaluation of the maturity level of e-services, based on the following assessments:
- Accessibility: ease of use for locale and other EU users to access the service and actual possibility of usage from abroad.
- Usability: service covers real user needs, easy to learn, ensure few user errors, pleasant to use, presentation in foreign languages
- Supply: supply completeness and supply quality. The model is of interest as it adopted the evaluation of services from the user point of view.
EC2 model:
The latest European Commission research evaluated 20 basic services from the demand side. They supplemented the EC1 model which enabled direct comparisons between supply and demand. In the EC2 model service quality (as perceived by their users) is assessed in relation to:
- Overall service evaluation
- Service usability: measured by positive or negative answers on questions about websites accessibility, service accessibility, ease of use, language comprehensibility and website response speed.
- Benefits of service use: defined by users choice among benefits on benefits in the list (save time, save money, gain flexibility, get faster service, receive more and better information, receive better help, better control and better process.
Kunstelj and Vinter argued that the existing EU metrics are well developed in the methods of single services evaluation, but do not include a single case of the evaluation of integrated services.[55]
United Nation approach
The UN Global e-Government Readiness Report (2004) presents a comparative ranking of the countries of the world according to two primary indicators:, The state of e-readiness and the extent of e-participation the report also presents measures of e-Government readiness through a five stage model: chapter II
- E-government development index (EGDI)
In 2002, and in order to rank the performance of e-government development, the United Nations department of economics and social affaire (UNDESA) through its division for public administration and development management (DPADM) has lunch a new index named e-government development index (EGDI), which assesses national websites and how e-government policies and strategies are applied in general, and in specific sectors for delivery of essential services of all united nation member states. The assessment rates the e-government performance of countries relative to one another as opposed to being an absolute measurement. The e-Government readiness index (EGDI) is a composite index comprising three elements, an online services index (OSI), a telecommunication infrastructure index (TII), and a human capital index (HCI).
The telecommunication infrastructure index: is a composite weighted average index of five primary indexes relating to a country’s infrastructure capacity for delivering e-Government services. The indexes include (per 100 persons) the number of internet users, PCs, main telephones lines, cellular telephones, and broad banding. It based on data provided by the international telecommunication union (ITU).Each of these indicators was standardized via the Z-score procedure to derive the Z-score for each component indicator. The telecommunication infrastructure composite value for country “x” is the simple arithmetic mean of the fve standardized indicators derived this way:
Telecommunication infrastructure composite value= Average (Internet user Z-score+ Telephone line Z-score + Mobile subscription Z-score+ Wireless broadband subscription Z-score + Fixed broadband Z-score).
The human capital index: from 2002 to 2012, the UNPAN assessment survey has calculate the weighted average composite of two indicator, Adult literacy and Gross enrolment ratio. Recognizing that education is the fundamental pillar in supporting human capital, the 2014 survey introduce two new components to Human capital index, namely expected years of schooling, and mean years of schooling. Those added elements have been commissioned and validated by DESA/DPADM which has also strengthened the use of HCI. (UNPAN, 2016)
Similar to calculating the telecommunication infrastructure index (TII), and under the z-score procedure, the four component indicators have weighted arithmetic in the following formula:
Human capital composite value = 1/3 Adult literacy RZs + 2/9(Gross enrolment RZs + Estimate years of schooling Zs + Mean years of schooling Zs)
RZs: ration Z-score
Zs: Z-score
Online service index: provides a comparative ranking of countries based on their ability to deliver online services to their citizens using a five-stage model representing the levels of sophistication of a country’s online presence. These levels include, from bottom up: emerging, enhanced, interactive, transactional, and connected. As a country migrates upwards through the various stages, it is ranked higher in the web measure index. As countries move upwards toward the stage of connected government, they pass through many thresholds in terms of infrastructure development, content delivery, business re-engineering, data management, security and customer management [57].
The Survey questionnaire is organized in specific thematic sets of questions (subthemes) structured in four patterns corresponding to the four stages of e-government development. The patterns have been designed to provide a qualitative assessment within a rigorous quantitative methodology. Each question calls for a binary response. Every positive answer generates a new “more in depth question” inside and across the patterns.
UN has based on an expert assessment survey of the presence state for the three indicators’ composites of all United Nations members, which assesses national development and provides insights of common themes in development patterns of e-government policies and implementation strategies. We highlight the three indicators components in the following table 1.
Table 13: UN sub-index composites
| Indicator | Components/composites |
| Online service |
|
| Telecommunication infrastructure |
|
| Human capacity |
|
| E-government development |
|
The E-government development index (EGDI) is a weighted average of normalize score of three indicators, OSI, TII, and HCI, but in the absence of the Z-score standardization treatment, the EGDI would mainly depend on the component index with the greatest dispersion. Therefore, each of these indicators was standardized via the Z-score procedure to drive score for each component indicator, where standard Z-score calculation is:
x=ε-μσ
Where: ε is a raw score to be standardized,
μ is the mean of population, and
σ is the standard deviation of the population.
Mathematically, UN experts present EGDI’s weighted average in the following form:
EGDI=13 (OSINormalized+TIINormalized+HCINormalized)
As indicated, the EGDI is used as a benchmark to provide a numerical ranking of e-government development across united nation member states.
- E-participation Index
In other hand, the e-participation index (EPI) is derived as a supplementary index to the UN E-Government Survey. It extends the dimension of the Survey by focusing on the use of online services to facilitate provision of information by governments to citizens (“e-information sharing”), interaction with stakeholders (“e-consultation”) and engagement in decision-making processes.
Table 14: E-participation sub-index composites
| E-participation index | ||
| E-information | E-consultation | E-decision-making |
|
Engaging citizens in contributions to and deliberation on public policies and services |
Empowering citizens through co-design of policy options and coproduction of service components and delivery modalities. |
Source: UNPAN REPORT 2016
A country’s EPI reflects its e-participation mechanisms that are deployed by the government as compared to all other countries. The purpose of this measure is not to prescribe any particular practice, but rather to offer insight into how different countries are using online tools to promote interaction between citizen and government, as well as among citizens, for the benefit of all. As the EPI is a qualitative assessment based on the availability and relevance of participatory services available on government websites, the comparative ranking of countries is for illustrative purposes and should serve only as an indicator of the broad trends in promoting citizen engagement. As with the EGDI, the EPI is not intended as an absolute measurement of e-participation, but rather, it attempts to capture the e-participation performance of counties relative to one another at a particular point in time.
In the 2016 Survey, the e-participation questions were carefully reviewed and expanded to reflect current trends and modalities in how governments engage their citizens in public policymaking, implementation and evaluation. New questions were added to address data publishing and sharing by government agencies. Other updates included: the availability of information on the citizens’ rights to access government information; feedback from citizens concerning the improvement of online public services; and tools about public opinion regarding policy deliberation through social media, online polls and online discussion forums. While the EPI provides a useful qualitative analytical tool when comparing the data and ranking of countries for one particular year, caution must be taken in comparing e-participation rankings with past editions of the Survey.
There are many assessment initiatives have been deployed with different key concepts that have a special purpose, table 15 highlights most applied framework.
Table 15: Evaluation framework
| Key concepts | Approach | Name and source of Framework |
| – Applies quantitative as well as qualitative approaches – Multi-dimensional assessment of public value – Derived from MAREVA |
– Key value drivers of efficiency, democracy and effectiveness – Applied in benchmarking |
eGEP |
| – Based on expected ROI – Based on level of risk, benefits to employees and society, and concrete benefits to clients |
– Four success criteria: strategic alignment; economic justification; risk adjustment and analysis of expected results |
MAREVA |
| – Computes NPV – Mostly uses quantitative but has some qualitative aspects |
– Computes profitability, investment & development costs and operating costs and benefits – Computes cost and revenue using detailed templates |
WiBe (Economic Efficiency Assessment) |
| – Social and governance implications | – Project costs and benefits – Considers risks |
Demand Value Assessment Methodology |
| – Public value chain with input, output, outcome and impact – The relation between these variables is influenced by contextual variables – Paradigm shift “from efficiency to effectiveness” |
– Inputs are financial and non-financial cost producing output leading to outcomes and impact – Provides specific measurement & evaluation indicators including contextual variables – Includes key, sub and composite indicators |
Verdegem et al (2010) |
| – Uses KPIs and based on CMM and COBIT maturity frameworks |
– Post-implementation audit on IS project management – Provides feedback for future projects – Does not provide for specific indicators |
Victor et al (2007) |
| – Adopted from DeLone & McLean IS success model – Measures success of G2C Information Systems |
– Has six key dimensions: Information Quality, System Quality, Service Quality, Use, User Satisfaction, and Perceived Net Benefit – Uses data collected from surveys |
Wang and Liao (2008) |
| – Uses KPAs and KPIs for various stakeholders – Based on the concept of public value – Evaluate returns from user perspective |
– Based on three levels of analysis: value category, KPAs, and KPIs – Value categories include: financial, social, operational and strategic values |
Liu et al (2008) |
| – More weight on service orientation – Summary and detailed assessment – Assesses services offered to citizens (G2C), business (G2B) and government (G2G) |
– Based on 5 key attributes (service orientation, technology, sustainability, cost-effectiveness and replicability) each with specific sub-indicators and weights – Gives detailed methodological approach – context of a developing countries |
E-governance Assessment Framework (EAF) |
| – Utilizes assisted ‘service’ centres rather than ‘self-use’ centres – Adopted for developing countries – Has both qualitative and quantitative indicators – Focuses on impact from client and community perspective – Derived from eGEP, EAF, MAREVA and WiBe |
– Measures impact on three key stakeholders: clients, government agencies and citizens – A well-defined methodology for evaluation of manual and computerized systems – Considers overall rating of project – Has well-defined indicators – Context of a developing country |
Bhatnagar and Singh (2010) |
- Citizen-Centric Approaches to Evaluation of e-Government
Citizen-based evaluation of governmental systems has been the focus of a number of studies. User involvement is an important measure to make sure that services become citizen-centric. A direct approach to the evaluation of e-Government projects is a citizen-centric approach to the evaluation of e-Government which has been presented by Brestchmeider et al. (2004). In this approach, a theory of evaluation of web-based applications is presented and an experiment to test the validity of the model is planned. The theory of evaluation presented, identifies a transaction between a citizen and a web based application as a unit of analysis for evaluation. According to Brestchmeider et al. (2004) the contribution of the model is that it incorporates the variables that affect the process and outcome of the transaction.
NET-EUCEN, an EU-supported thematic network on citizen-centric e-government, has proposed a framework with a set of indicators to measure user involvement in e-government service development and provision. This framework builds on user involvement in all stages of the service lifecycle.
- User involvement in the design stage. The users are involved in development of ideas and concepts. Focus is on needs and requirements of the users, not technological constraints.
- User involvement in the development and implementation stages. Users are engaged in the initial implementation of the service in order to evaluate its features. Mock-ups and prototypes are used to continuously check that the service is aligned with user wishes and requirements. The aim of the user involvement is to improve the service and to optimize the outcome of the development and implementation.
- User involvement in the deployment and running stages. Users validate the service through testing of flexibility and interoperability. Test results are used to improve and customize service according to changes in political, economic or social environment
Based on this definition, the network examined case descriptions submitted to the e-Practice portal together with cases submitted by network partners. Most of the descriptions on the e-Practice portal did not discuss user involvement at all, but case owners were requested to submit additional information. The findings of this study revealed that very few cases were fully aligned with the above definition.
Another approach [60] is a typical study that tries to utilize lessons and experiences from evaluation of Web site performance in E-Commerce. The authors suggested use of a multidimensional Web evaluation strategy, which includes methods such as usability testing, user feedback, usage data, and Web and Internet performance, etc. that are common in the evaluation of commercial Web sites.
The evaluation approach used by West [61] was developed only on the basis of characteristics found by observing Web sites (e.g. phone contact information, addresses, publications, databases, foreign language access, privacy policies, security policies, an index, disability access, services, email contact information, and search capabilities, etc). He assigned weights to these observable attributes of the Web site and used aggregate measures to evaluate e-government service delivery.
Given the circumstance of a government Web site, a citizen’s information seeking activity on the site is related to the interaction of the citizen (as information user), information tasks to be completed (as information problem), and the government Web site (as information pool). Factors coming from any of these three components may influence the performance of a citizen’s information seeking activity.
The newly developed evaluation model therefore both examines characteristics more than those of the Web sites, and takes the background governmental factors in to account, too. Given this advantage, the proposed evaluation model can help tell a government agency whether its e-government services are delivered with high quality through its Web site. Also importantly, it can help identify those organizational factors which account for observed success or failure in Web-based e-government services delivery;
Table 16: Different citizen-centric approaches
| Evaluation approach | Description | Source |
| Wang, et al | evaluating the performance of a web-enabled e-government system with a citizen centric approach | [63] |
| Eschenfelder and Miller | a socio-technical toolkit for evaluation of e-government websites that address issues of openness and trust in e-government systems | {64} |
| Carter and Belanger | present results of their study on citizen adoption of e-government initiatives based on an approach supported by the Technology Acceptance Model (TAM) | [65] |
| Reddick | analyzes the demand side of e-government, which has to do with aspects of citizen interaction with e-government systems | {66} |
| WAES | Website Attribute Evaluation System is designed for evaluating the organizational openness of a government Web site solely from characteristics of the Web site itself. | Demchak et al [62] |
However, e-government studies have not focused on satisfaction as a major construct. Stowers reports that among existing e-government performance measures, customer satisfaction is the least used metric [67]. Recent findings reported by the Office of Management and Budget (OMB) [68] reflect the absence of citizen satisfaction measures as a part of their e-government systems.
Satisfaction measures are extensions of performance and quality measures. While the latter are user centric approaches, true citizen-centric evaluation of systems need to examine attitudes of the user towards e-government systems as a public service. This study evaluates various dimensions that underlie overall citizen satisfaction. It attempts to fill a gap by presenting a holistic view of satisfaction towards using an online governmental public information service.
- Problems with Evaluation Methodologies
The first problem with the current evaluation methods can be identified as there is no comprehensive approach to the evaluation of e-Government projects [55]. In addition, there is a tendency of these methods to ignore intangible issues like organizational culture and political factors. An example of such evaluation method is the CBA method.
Mustafa defined CBA as “one of several techniques that seek to evaluate the total costs and consequences of a program in a systematic manner [70]. The general thrust of the technique is that government resource allocation decisions should meet tests similar to those in the business sector. Program alternatives should be selected which will maximise the value of outputs from the resources allocated to them”. Mustafa criticised CBA as a decision technique that employs an apolitical conception of rationality and ignore the mobilization aspects (advocacy, bargaining and the exercise of power) of public programs.
Serafemidis and Simthson (1999) pointed out that particular emphasis has been placed on methodological development, which was built upon a 60 technical/functional and economical/financial content principles. Consequently, methodologies such as ROI and cost benefit analysis (CBA) have tended to monopolize the field. The changing role of IT means these content principles have changed considerably with a greater preponderance of intangible benefits and an increased uncertainty regarding their achievement. Traditional evaluation methods are unable to cope with these changes. According to Serafemidis and Simthson, (1999), intangible elements such as the power of stakeholders, seemed to be the main reason for the failure to institutionalize new developments in IT evaluation. Therefore, new evaluation approaches are needed to support a richer examination of these intangible aspects and elements of risk and uncertainty.
OECD (2002) presented another prospective on the problems of evaluation of e-Government. According to an assessment by OECD (2002), e-Government initiatives suffer from a gap in the e-Government as:
- E-Government national goals are instrumental rather than global oriented, and emphasis is on goals such as putting infrastructure and service delivery online with emphasis on customers and attention to cost effectiveness. Only few countries include in their strategies goals such as transparency, trust, and anti-corruption.
- Effective evaluation requires good metrics, regular monitoring and reporting of data, robust evaluation frameworks and discipline, long term evaluation practice experience, and strong professionalism. All this is hard to find in an e-Government context.
And regarding to citizen-centric approach, although this strategy could be useful, and is comprehensive in terms of studying Web site features, it was not adapted to the context of a government agency, which operates without competition or market considerations, and cannot reflect differences in service delivery mediated by citizens’ individual variations.
Conceptual Framework and Methodology
Introduction
In this chapter we aim to address the evaluation measurement concept for e-government system using data envelopment analysis technique (DEA). More specifically, we are going to develop a framework that account on E-government readiness index maintained by United Nations’ department of Economics and Social Affairs (UNDESA), to outline the question of ranking e-government development system between UN nation’s members and also to measure and track e-government readiness. Using complementary index EPI that have been developed by UNDESA as well, we propose a new framework to measure the efficiency of e-government development index regarding to their output and compare it with the UNPAN index. DEA technique in other hand has different models of efficiency measurement, choosing the model that can match the e-government metrics is well explored.
The rest of this chapter is organized as follows: the next section reviews the relevant literature on e-government readiness measures, the following section describes the existing method for e-government readiness index used by UNPAN. Introducing data envelopment analysis technique,
E-government readiness
Within the field of e-Governance research, significant attention has been devoted to the concept of benchmarks and indices for assessing and measuring various e-Governance projects. Significant diversity exists within the pool of initiatives meant to create the benchmarks and the stakeholders they cater to. Few of these benchmarks have been public-private initiatives, typically commissioned by governmental or inter-governmental bodies and executed by private consultants. Capgemini Ersnt & Young eEurope reports and related benchmarks meant to assess e-Governance capabilities of select European economies are such groups of benchmarks created through public–private partnerships (Cap Gemini Ernst and Young, 2005, 2006). Reports and benchmarks created by Accenture (Accenture, 2006), on the other hand, are largely private initiatives meant to serve policymakers as well as private investors interested in e-Governance. Further, Brown University’s e-Government survey series, carried out by the Center for Public Policy at the university, represent academic research efforts to create e-Government assessments (West, 2004, 2005, 2006). Finally, United Nations’ e-Government surveys, conducted annually since 2002, represent global inter-governmental efforts to assess the e-Government readiness at the national level (UNDESA, 2001, 2003, 2004, 2005, 2008, 2010, 2014, and 2016). We do not provide a detailed review of individual benchmarking studies, as we specifically focus on indices meant to capture e-Government readiness. Comprehensive reviews of various benchmarking efforts can be found in the works of Bannister (2007), Jansen (2005), and Kunstelj and Vintar (2004).
E-Government readiness index represents a more focused line of research within the broad spectrum of electronic-governance literature. E-Government readiness index, along with the related research, has been motivated by the need to evolve a common measure to assess the preparedness of various nations to make the transformation to electronic governance. It has been conceived as a yardstick that allows nations to gauge their status relative to others attempting to implement electronic governance (Bannister, 2007; Ojo et al., 2007; UNDESA, 2008). It is also meant to alert policymakers to specific strengths and weaknesses that could be suitably addressed to deliver electronic governance. Additionally, the rankings have also come to be perceived as representative of national capabilities, and as a means to enhance national positions for purposes like attracting investments, gaining leverage in international negotiations, and motivating citizen adoption of electronic governance (Bannister, 2007; UNDESA, 2008). The UNPAN surveys commissioned by UNDESA specifically state that the purpose of assessing e-Government readiness is to gauge “how ready are member states to take advantage of the opportunity provided by advances in information technology?” (UNDESA, 2008). Apart from being a tool of comparative assessment, it is also meant to be a means to monitor the evolution of e-Government readiness over time for member states. But till today there is not evaluation within the nation itself in term of input and output.
Research methodology
The Methodology that we have developed and used to evaluate the efficiency of e-government systems for United Nation members provides a way to understand the importance of e-government systems’ outcomes. This approach can be applied in particular to a variety of e-government projects and normative objectives in different areas affected by the implementation of e-government system as a large-scale project (technological, Organizational, etc.), and a variety of applications.
In our evaluation framework, we rely on united nation survey data as main source of data envelopment analysis inputs and outputs variables. In the following sub-section we will explore more details about DEA technique and UN readiness index. To do so we need to answer the two main questions
- What is the critical differentiator between united nation e-government readiness index, and other related readiness index?
- Among efficiency measurement techniques, why we choose DEA?
- United Nation Readiness
Within the limited field of e-Government readiness research, one can further note various strands. Readiness has been measured for a diverse set of functions and services, including such readiness measures as e-commerce, e-business, Internet diffusion, ICT development, digital access and connectivity, and information society among others (Bridges.org., 2005). While one might argue that certain indicators like readiness for e-commerce or e-business might not be the best representative features of e-Government, others nonetheless regard enablement of e-business or e-commerce as critical priorities. Such examples also highlight how e-Government readiness indices exhibit significant diversity and represent a variety of approaches to measuring readiness (Janssen, Rotthier, & Snijkers, 2004). In an insightful analysis, Ojo et al. (2007) highlighted how three of the more accepted versions of e-readiness index – the UNPAN index, the Brown University survey, and the Accenture e-Government leadership series – have no substantive overlap in terms of content and measurement items. Apart from significant variations in the constitutive items, they also found critical differences in the development of the indices in terms of weighting, and measuring the contributions of individual elements. Further, their analysis indicated only a moderate correlation between the indices. More importantly, however, even within the UNPAN index they found that not all constitutive elements contribute equally toward the overall index. The UNPAN team acknowledges the concerns with index composition and states that “although methodological work on the UN e-Government survey has helped elucidate some of the issues in e-Government measurement, there is no formal agreement on a common international framework. There is also no single view of how such indicators should be designed so that they remain relevant and practical over time” (UNDESA, 2010).
The key fundamental issues with a readiness index, as with any other composite index, are related to the choices of constitutive items for the index and the relative contribution of the items toward the index score. Largely, both the issues of scope and constitution – defined, respectively, as the choice of items to be included and the weights to be allocated to individual items have been repeatedly cited by the critics of the e-Government readiness index as key drawbacks of the collective research stream (Bannister, 2007; Jansen, 2005; Ojo et al., 2007)
From our perspective view, we opt to focus on united nation readiness index in our research only in order that it has one of widest coverage of nations and is one of the most current records of e-government assessment; also the data is available in different formats which can lead to empirical examination and evaluation.
- Efficiency Measurement Techniques
The concept of efficiency measurement has received a great deal of attention in many countries and organizations in recent years. In an organizational context, efficiency measurement reflects overall performance. This could lead to increases or decreases in shareholders’ wealth. Hence, governments, economists and professionals are concerned with defining and measuring the concepts of efficiency. Efficiency measurement at a basic level examines the relationship between input and output in a given production process (Coelli, Rao et al. 1998). Thus, efficiency measurement is expressed in an output versus input formula for measuring production activities. It does not merely define the volume of output, but output obtained in relation to the resources employed. In this context, the productivity of the system can be defined as a ratio (Coelli, Rao et al. 1998) as shown in equation 1.
Efficiency measurement = Output(s)/Input(s) (1)
As Coelli, Rao and Battese (1998) further suggest that efficiency reflects the ability of a firm to obtain maximum productivity’s output from a given set of inputs. There are two main approaches to estimating relative efficiency across firms: the parametric approach (or, more strictly, the statistical approach) and the non-parametric approach. The main difference between these two approaches is that the former specifies a particular functional form for the production or cost function while the latter does not. In fact, the degree of “parameterization” of the production, services or cost function can have serious implications in comparative efficiency analysis, and can be considered to be responsible for the different advantages and disadvantages that each approach has.
The parametric approach relies on econometric techniques and includes simple regression analysis and Stochastic Frontier Analysis (SFA). Whilst simple regression analysis typically seeks to estimate a production or cost function, SFA is an extension of that methodology to estimate the “frontier” of a set of functions with different underlying levels of efficiency. The non-parametric approaches use mathematical programming techniques, and the main nonparametric frontier analysis technique, known as Data Envelopment Analysis (DEA), can be seen as an extension of the simple technique of index numbers. A possible taxonomy of efficiency techniques is illustrated in Figure 1.
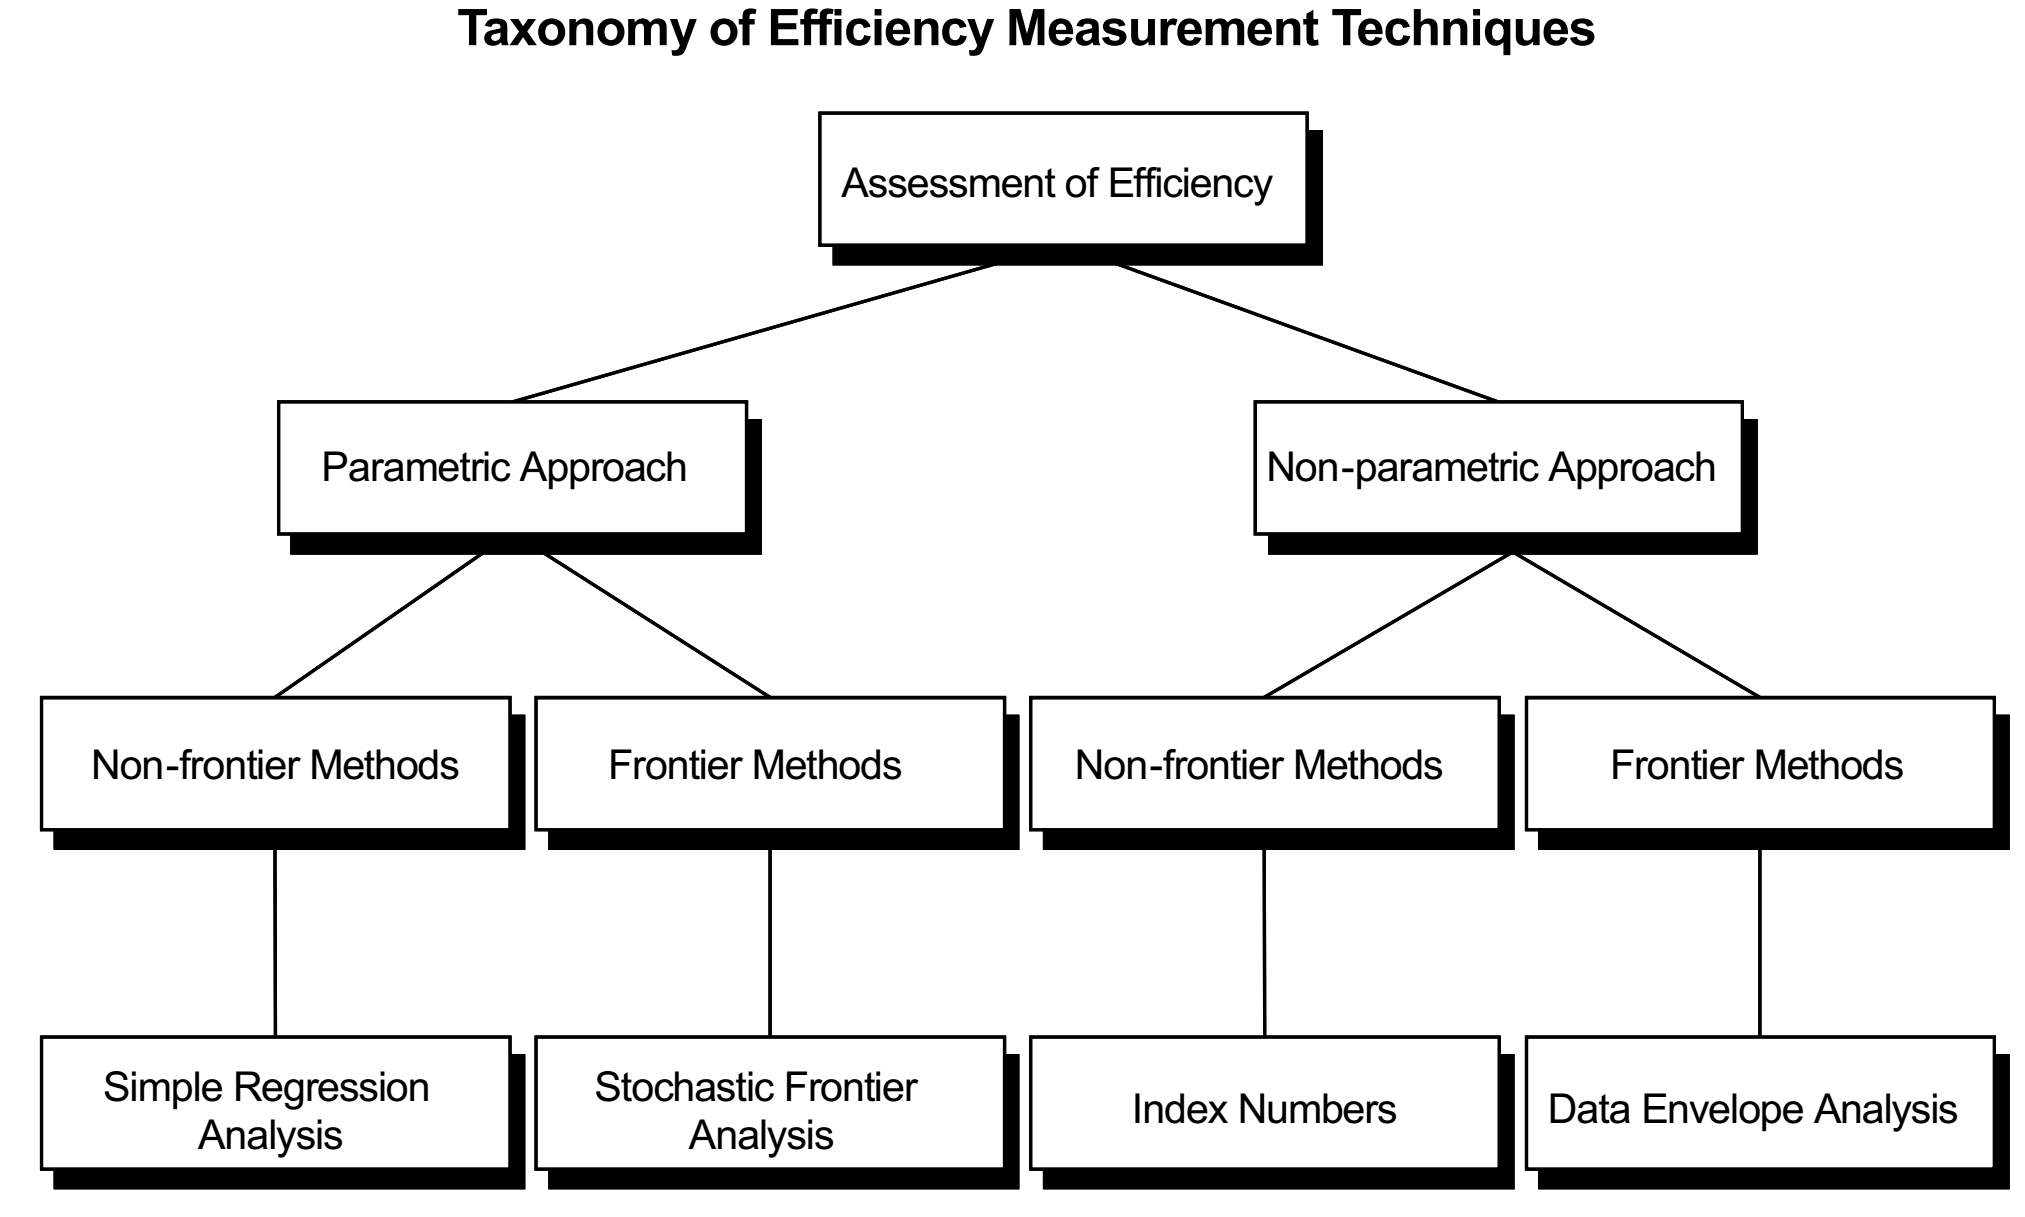
Figure 21 : Taxonomy of efficiency Measurement Techniques
Comparing to COLS and SFA, DEA has the advantage that it does not need to employ an assumption for the functional form of the frontier other than the minimum piecewise and linear condition. As a result, there is no danger of mis-specifying the frontier in this way. On the other hand, this lack of parameterization is also a disadvantage, as it is very difficult to use the data to guide mode choice – for example, there is no proper definition of goodness of fit that would enable comparison of different models during the modeling procedure. DEA is computationally less intensive than SFA (at least in its basic form) and for this reason the method has been more widely used, especially in operations research. Moreover, compared to regression analysis and partly SFA, DEA has the advantage that it takes into account only the most efficient companies in shaping the frontier.
DEA adopts the weights for each firm that maximizes each firm’s relative performance. One of the main shortcomings of DEA for relative efficiency analysis therefore is that rather too many of the firms may appear to be efficient, even if this is not truly the case. This problem can be intensified when the sample of comparators is small and the number of outputs large. This is because the dimensions in which a particular firm can be unique increase and therefore its potential peer group is narrower.
In practice, weight restrictions can be used to ensure that neither exceptionally high weight is placed on a number of relatively unimportant outputs, nor that a relatively important output plays only a minor role in the determination of the efficiency measure. However, there is no single way of selecting weight restrictions and each of them has its own limitations when being applied.9
A major drawback of DEA is that it attributes all deviations from the frontier to inefficiency. Yet, as with regression analysis, deviations from the frontier may be due to a number of factors other than inefficiency such as omitted cost drivers and measurement errors. These factors are not testable. As a result, interpreting DEA scores as measures of efficiency requires a high degree of “blind” faith in the model. In fact, the most that one can argue objectively is that DEA scores show the amount of allowable costs that the model has justified. The remaining gap between the observation and the frontier remains unexplained.
The deterministic nature of DEA can cause significant problems in the measurement of efficiency when there are outliers in the industry because the method envelops the outermost observations without asking whether these observations are genuine or the result of an error. Even a single outlier can result in finding huge inefficiencies for most comparators without this being necessarily true. To remedy this problem and find “sensible” scores of inefficiency, one could take these outliers out of the analysis and proceed without them, although there is no clear way of deciding which companies should be regarded as outliers and which not. Therefore, we can see that outliers can cause problems in both SFA and DEA but for completely different reasons: while SFA can fail to find any inefficiency at all, DEA is likely to find too much inefficiency in the sample.
Data Envelopment Analysis
Data Envelopment Analysis is a non-parametric approach and relies on mathematical programming, rather than econometric techniques. By this we mean mainly the resolution of a set of problems via the maximization/minimization of a given objective subject to some constraints. DEA can perhaps be best explained by first introducing what are called “index numbers”.
Data envelopment analysis (DEA) has been widely used to evaluate the comparative efficiencies of system processes[11].it involves the use of linear programming methods to construct a non-parametric piecewise surface (or frontier) over the data, so as to be able to calculate efficiencies relative to this surface. Most of the DEA applications assume that system processes consist of one stage. However, in e-government system circumstances, the investments and policy changes are exiting along with development of e-government projects. In such cases, using single-stage DEA may result in inaccurate efficiency evaluation. To address such problems, DEA models assuming two-stage processes have been developed. The primary propose of this section is to outline an efficiency measurement concept and discuss how they may be calculated relative to an efficient technology, which is generally represented by some form of frontier function.
For our evaluation, we considered two-stage DEA models by considering input and output slacks.
3.1 DEA concept
There is an increasing concern with measuring and comparing the efficiency of organizational units such as local authority departments, schools, hospitals, shops, bank branches and similar instances where there is a relatively homogeneous set of units.
Efficiency=OutputInput
With multiple inputs and outputs the difficulty of comparing the efficiency of target unit becomes apparent. Therefore, The measurement of relative efficiency where there are multiple possibly incommensurate inputs and outputs was addressed and developed by Farrell and Fieldhouse [12], focusing on the construction of a hypothetical efficient unit, as a weighted average of efficient units, to act as a comparator for an inefficient unit.
Efficiency=weighted sum of outputsInweighted sum of inputs
Which introducing the usual notation can be written as
Efficiency of unit j=u1y1j+u2y2j+… v1x1j+v2x2j+…
Where
u1
: weight given to output i
y1j
: Amount of output 1 from unit j
v1
: the weight given to output 1
x1j
: Amount of output 1 from unit j
(Note efficiency is usually constrained to the range [0,1]).
Charnes, Cooper and Rhodes [13] recognized the difficulty in seeking a common set of weights to determine relative efficiency. They recognized the legitimacy of the proposal that units might value inputs and outputs differently and therefore adopt different weights, and proposed that each unit should be allowed to adopt a set of weights.
This flexibility in the choice of weights is both a weakness and strength of this approach. It is a weakness because the judicious choice of weights by a unit possibly unrelated to the value of any input or output may allow a unit to appear efficient but there may be concern that this is more to do with the choice of weights than any inherent efficiency. This flexibility is also strength, however, for if a unit turns out to be inefficient even when the most favorable weights have been incorporated in its efficiency measure then this is a strong statement and in particular the argument that the weights are incorrect is not tenable.
DEA model may be appropriate where units can properly value inputs or outputs differently, or where there is a high uncertainty or disagreement over the value of some input or outputs. One key assumption of classical DEA model (or radial) is a system’s relative efficiency depends on how much it can proportionally expand all of its inputs given its input or vise-versa (reducing all of its inputs given its output). However the classical “radial” DEA model has been known for having two primary limitations. First, some decision-making units (DMUs) may be measured against a weakly efficient input-output point in the possibility set, which also serve as the reference points for their corresponding DMUs, have positive input or output slacks with respect to strongly pareto-efficient points. Second, a high proportion of DMUs can turn out to be efficient due to a small sample size relative to the number of inputs and outputs.(dyson et al 2001) (chen 2012).
Regarding to the issue of referencing non-pareto-efficient targets, and as a non-radial approach, Tone [14,15], based on SBM, and proposed another model to rank efficient DMUs. Tone ‘approach has two stage, first one is by running standard SBM to classify efficient and inefficient DMUs, and the second stage will use super SBM for only efficient DMUs.
3.2 Mathematical formulation
For our purpose, we highlight the slacks-based measure for technical efficiency in DEA model. Suppose there are n DMUs, {
DMUK
(K=1,2,..n)}, LET
xk=(x1k,..,xmk)
and
yk=(y1k,..,ysk)
denote the input and output vectors of kth DMU.
The ith input of kth DMU is denote as
xik
and the rth output of the kth DMU is denote as
yrk
, respectively.
The slacks-based measure SBM is defined to be optimal value of the following problem:
min
ρk= (1-1m∑i=1msi-/xki1+1s∑r=1ssr+/ykr)
(1)
Subject to
∑j=1nδjxji
=
xki-si-
for i= 1,..,m
∑j=1nδjyjr
=
ykr-si+
for r = 1,..,s
δj
≥ 0 for j = 1,…..,n
si- ≥0
for I = 1……,m
sr+ ≥0
for r = 1,….,s
The variable
δj
indicates the intensity under which DMU j takes part in forming the efficient frontier.
si-
,
sr+
, are two vectors indicate the input excess and output shortfall, respectively.
The problem (1) given above is a nonlinear programing problem, it can be transform into a linear programing problem by using (Tone & The Charnes et al.,) transformation, which can be solved by efficient algorithms:
min ρk=t- 1m∑i=1msi-xki (2)
subject to t+ 1s∑r=1ssi+ykr=1
∑j=1nδjxji= txki-si- for i=1,….,m
∑j=1nδjyjr= tykr+si+ for r=1,….,s
3.3 DEA computer program
The center for Efficiency and Productivity Analysis (CEPA) in New England University has describes a computer program which has been written to conduct data envelopment analyses (DEA). The technique requires the use of linear programming methods to build a non-parametric piecewise surface over the data, so as to be able to calculate efficiencies relative to this surface. The working paper has described a variety of models that are available in either an input or an output orientation.
This program is written in FORTRAN for IBM compatible PCs. It is a DOS program but can be easily run from WINDOWS using FILE MANAGER. The program involves a simple batch file system where we can create a data file and a small file containing instruction, and then we can start the program by typing “DEAP” at the DOS prompt and is then prompted for the name of the instruction file. The program then executes these instructions and produces an output file which can be read using a text editor, such as NOTEPAD or EDIT, or using a word processor.
Following the working paper descriptions, the execution of data envelopment analysis program (DEAP) version 2.0 on our personal computer Lenovo generally requires five files:
- The executable file DEAP.EXE
- The start-up file DEAP.000
- A data file (TEST.DTA)
- An instruction file (TEST.INS)
- An output file ( TEST.OUT)
The executable file and the start-up file are supplied on the disk. The start-up file, DEAP.000, is a file which stores key parameter values which we need to alter time to time to test comparative values. The data and instruction files have been created as prior for execution. The output file is created by DEAP during execution.
DEA and E-government
Measurement of output is probably one of the easiest tasks when the firms under consideration are commercial entities that produce tangible goods and services that are sold in market place. It is more difficult to identify the outputs of an entity involved in delivering services, in particular, in e-government realm. Benchmarking the performance of e-government such as public service delivery, policy decision process, citizen engagement and other services has attracted considerable interest over the last decade. This is attributable to the availability of methods such as the DEA that can be applied where the output measures are in the form of output indicators.
In e-government system environment, what are the output measures that accurately reflect the role and function of the system?
Efficiency Measurement Framework
Collecting Data
Data source
It must be noted that the weighting scheme applied to the three major e-Government readiness sub-indices, as well as their elements, were chosen on the basis of their assumed contribution toward the indices. One can argue that the contributions of the sub-indices toward the overall index, as well as the contribution of the individual variables toward the sub-indices, can be substantively different when subjected to more rigorous methodological examination. As Ojo et al. (2007) demonstrated.
we focus on the UNPAN index and employ DEA to specifically address the key scope and constitution issues related to benchmarks. The UNPAN data have been collected by UNDESA since 2002. The choice of UNPAN data in our research is primarily dictated by the fact that it has one of the widest coverage of nations and is one of the most current records of e-Government assessment.
Defining inputs and outputs
First approach
In DEA technique environment, we have set up the EGDI sub-index as the input variables, and EPI index as the output variable. As we explain in previous section, the UN’s purpose of EPI measure is not to prescribe any particular practice, but rather to offer insight into how different countries are using online tools to promote interaction between citizen and government, as well as among citizens, for the benefit of all. In fact we consider it as a key trigger of how the citizen are walling to use the e-government system and interact with their government, therefore, it can be the outcome of the efforts to make the e-government system work well somehow, and the EPI is not intended as an absolute measurement of e-participation, but rather, it attempts to capture the e-participation performance of counties relative to one another at a particular point in time.
To analyses the feasibility of DEA technique for our approach, a given government’s overall operational performance for providing efficient e-government services is an approximation from a comprehensive index, which objectively assigns three inputs and one output to the DEA efficiency function.
Table 17 : one-output and three outputs
| Index | Description | Index attribute |
| OSI | Online service index | Input |
| HCI | Human Capital Index | Input |
| TII | Telecommunication Index | Input |
| EPI | E-participation Index | Output |
Second approach
The ability to deliver online services to their citizens using a five-stage model representing the levels of sophistication of a country’s online presence is also a trade-off of e-government projects investment. The Whole of e-government, Multichannel service delivery, Bridging the digital divide, Increasing usage, and Open government are the five main elements of online service index, with qualitative assessment within a rigorous quantitative methodology we opt to see it as offspring of e-government system development. Therefore in our second approach and in order to apply DEA, we consider human capital index and telecommunication infrastructure as inputs and online service index and e-participation are output.
Table 18: Two inputs with two outputs
| Index | Description | Index attribute |
| OSI | Online service index | Output |
| HCI | Human Capital Index | Input |
| TII | Telecommunication Index | Input |
| EPI | E-participation Index | Output |
DEA Program implementation
For multiple reasons that we have been explored in previous section, we choose to use the composite e-government development index as input variables and e-participation index as the output of e-government system. We randomly choose 14 nations among 193 united nation members, there are top ranked e-government development index in their region. Our experience involving observation on 14 nations that use three inputs to produce a single input. The data are as follows:
Table 19:United nation readiness index data
| DMU | EPI | OSI | HCI | TII | EGDI |
| United kingdom | 1 | 1.0000 | 0.9402 | 0.8177 | 0.9193 |
| Australia | 0.98305 | 0.9783 | 1.0000 | 0.7646 | 0.9143 |
| republic of Korea | 0.9661 | 0.9420 | 0.8795 | 0.8530 | 0.8915 |
| Singapore | 0.91525 | 0.9710 | 0.8360 | 0.8414 | 0.8828 |
| Mauritius | 0.66102 | 0.7029 | 0.7067 | 0.4596 | 0.6231 |
| Tunisia | 0.69492 | 0.7174 | 0.6397 | 0.3476 | 0.5682 |
| south Africa | 0.55932 | 0.5580 | 0.7253 | 0.3807 | 0.5546 |
| Morocco | 0.83051 | 0.7391 | 0.4737 | 0.3429 | 0.5186 |
| USA | 0.89831 | 0.9275 | 0.8815 | 0.7170 | 0.8420 |
| Canada | 0.91525 | 0.9565 | 0.8572 | 0.6717 | 0.8285 |
| France | 0.89831 | 0.9420 | 0.8445 | 0.7502 | 0.8456 |
| Spain | 0.9322 | 0.9130 | 0.8782 | 0.6493 | 0.8135 |
| china | 0.81356 | 0.76812 | 0.686 | 0.36727 | 0.60713 |
| Turkey | 0.62712 | 0.60145 | 0.79096 | 0.37745 | 0.58995 |
Before we execute the DEAP computer program we need to construct a data file and an instruction file, both files need to be written in text file format, the data file for our implementation, EG1-DTA.TXT contains 14 nations as DMU with the first column present the output and three next columns present inputs for our first approach (table), and for second approach, we used multi-output DEA method and set up two inputs and two outputs. (table)
Table 20: listing of Data file, EG1-DTA.TXT
| EPI | OSI | HCI | TII |
| 1 | 1.0000 | 0.9402 | 0.8177 |
| 0.98305 | 0.9783 | 1.0000 | 0.7646 |
| 0.9661 | 0.9420 | 0.8795 | 0.8530 |
| 0.91525 | 0.9710 | 0.8360 | 0.8414 |
| 0.66102 | 0.7029 | 0.7067 | 0.4596 |
| 0.69492 | 0.7174 | 0.6397 | 0.3476 |
| 0.55932 | 0.5580 | 0.7253 | 0.3807 |
| 0.83051 | 0.7391 | 0.4737 | 0.3429 |
| 0.89831 | 0.9275 | 0.8815 | 0.7170 |
| 0.91525 | 0.9565 | 0.8572 | 0.6717 |
| 0.89831 | 0.9420 | 0.8445 | 0.7502 |
| 0.9322 | 0.9130 | 0.8782 | 0.6493 |
| 0.81356 | 0.76812 | 0.686 | 0.36727 |
| 0.62712 | 0.60145 | 0.79096 | 0.37745 |
As soon as we define data file, we need to set up a construction file EG1-INS.TXT, and due to the comments that has been listed on the right-hand side of the file in Table 21, and for second approach we keep data file that we have set up early except the number of output and input settled to be 2. The majority of entries in the file are a self-explanatory. The comments in the instruction file are not read by program.
Table 21: listing of instruction file, EGEM1-INS.TXT.
| Eg1-dta.txt
Eg1-out.txt 14 1 1 3 0 0 0 |
DATA FILE NAME
OUTPUT FILE NAME NUMBER OF NATION (DMU) NUMBER OF TIME PERIOD NUMBER OF OUTPUTS NUMBER OF INPUTS 0= INPUT AND 1= OUTPUT ORIENTED 0=CRS AND 1=VRS 0= DEA (MULT-STAGE), 3=DEA (1-STAGE), 4=DEA (2-STAGE) |
Table 22: listing of instruction file, EGEM1-INS.TXT.
| Eg1-dta.txt
Eg1-out.txt 14 1 2 2 0 0 0 |
DATA FILE NAME
OUTPUT FILE NAME NUMBER OF NATION (DMU) NUMBER OF TIME PERIOD NUMBER OF OUTPUTS NUMBER OF INPUTS 0= INPUT AND 1= OUTPUT ORIENTED 0=CRS AND 1=VRS 0= DEA (MULT-STAGE), 3=DEA (1-STAGE), 4=DEA (2-STAGE) |
When we have data and instruction files in hands, we execute DEA computer program by typing the name of instruction file. The process is done as it depleted in the following picture
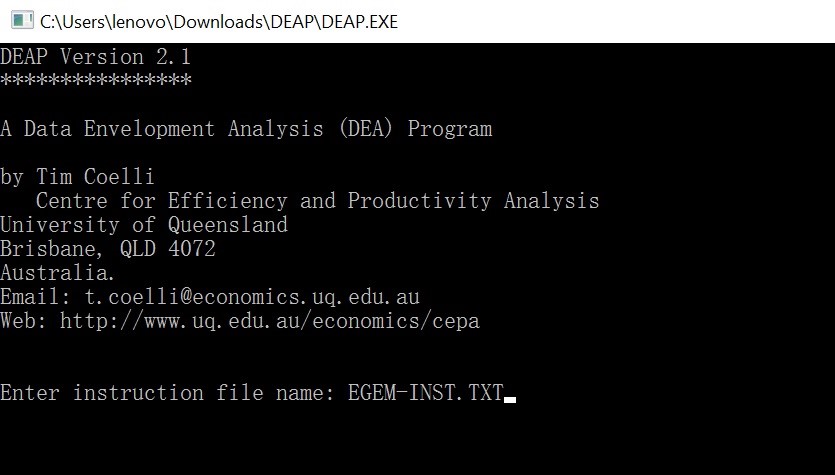
Figure 22: DEAP executing process
The full outcome of DEA program is listed in our last chapter, what we are going to present here is only the efficiency measurement summary.
Table 23: Results of DEA of the 14 UN members e-government readiness
| DMU | Efficiency Measurement | Ranking |
| United kingdom | 0.890 | 8 |
| Australia | 0.894 | 6 |
| republic of Korea | 0.913 | 3 |
| Singapore | 0.839 | 13 |
| Mauritius | 0.837 | 14 |
| Tunisia | 0.862 | 10 |
| south Africa | 0.892 | 7 |
| Morocco | 1.000 | 1 |
| USA | 0.862 | 9 |
| Canada | 0.852 | 11 |
| France | 0.849 | 12 |
| Spain | 0.909 | 5 |
| China | 0.943 | 2 |
| Turkey | 0.928 | 4 |
Table 24: Second approach result
| DMU | Efficiency Measurement | Ranking |
| United kingdom | 0.682 | 10 |
| Australia | 0.627 | 14 |
| republic of Korea | 0.686 | 9 |
| Singapore | 0.744 | 4 |
| Mauritius | 0.710 | 8 |
| Tunisia | 0.958 | 3 |
| south Africa | 0.680 | 11 |
| Morocco | 1.000 | 1 |
| USA | 0.674 | 12 |
| Canada | 0.715 | 6 |
| France | 0.715 | 7 |
| Spain | 0.666 | 13 |
| China | 0.970 | 2 |
| Turkey | 0.739 | 5 |
In regard to the formation of input and output, table 1 shows that the overall efficiency measurement differences between all 14 nations has given difference raking in term of efficiency. Suggesting that threes e-government development sub-index as input demonstrate the fact of how governments allocate their sources to get better e-government system. When we examine the result of DEA technique approach and e-government readiness index, we noted that as much as E-participation index performance high, the measurement efficiency is also high regardless to the performance of EGDI sub-index.
Its obvious result if we consider the e-government system as private-firm where the productivity is exceeds the maximum. Regarding to efficiency measurement, and for two approaches, Morocco and Chine have gained first and second place where United Kingdom ranked 8 and 10, noting that UK has gained the first place among 192 United Nation members for online service index and e-participation index.
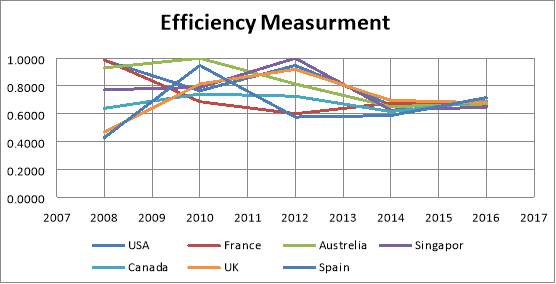
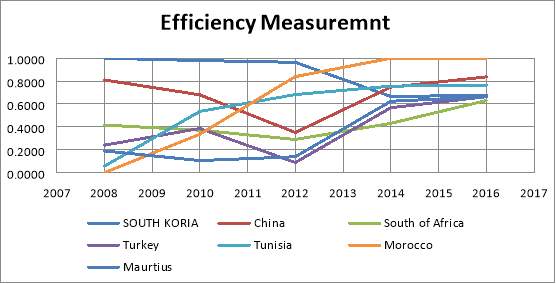
In other side, we have measured the e-government system efficiency for developed and developing countries during last 10 years to examine how the performance of e-government system is changing over time. Fig 23 and 24 presents the development of e-government system efficiency for developed and developing nations successively.
As the curbs describe itself, as soon as the countries lunched e-government projects, many citizens engaged to use it and participate. But since 2012 many developed countries have decline to reach a standard performance, in contrast with developing countries, curb shows some difficulties in the beginning and come back to rise again to reach high level. What we can notice here is the countries experience the same performance with little change for emerging nation as well as developed countries.
Efficiency measurement results
The results obtained in previous section provide critical insights regarding united nation ranking readiness index. We examine e-government system outcomes for united nation member base on their sub-index by using two approaches. We must affirm and emphasis here that we basically treat the e-government readiness index for DEA variables within given principle components as their weight or relative contributions toward the overall index.
The efficiency measurement results provides more useful information when e-participation index viewed as the output of e-government system performance,the results are less sophisticated when we seize OSI and EPI as the outcomes of e-government system. For e-government readiness, as critics have routinely point out
What we should or should not be involved to assess e-government system development is a debate issue, but in our test we address and treat the evaluation problem from an entirely empirical perspective.
As we mentioned in the previews section, the challenges that developed and developing countries are facing are different and also depend on the purpose of e-government projects, where the first one have lunched the projects to served citizens needs and make public services more efficiency, developing nation aims was to boost economic and create information society. And that what the two figures explain as they show the development of e-government system last decade. Boosting economic and creating jobs is ongoing progress where more e-government projects and initiatives should be apply to follow up the societies shifting in emerging countries and the efficiency of e-government system will increase as much as the plans and roadmaps much more the purposes.
Conclusion
The preliminary study of our dissertation provided a basic understanding of the nature of e-government, its history, development and the challenges it faces in building and during implementation of e-government projects in emerging nations.
The research has focused on the implementation of e-Government projects in developing countries. In the first phase of the research the literature review has focused on the wide range of definitions of e-Government. a public sector use of the Internet and other digital devices to deliver services and information, the use of new information and communication technologies (ICT’s) by government as applied to full range of government functions (OECD, 2001). The literature review later focused on the types of services and benefits provided by e-Government. According to the UNDP (2004), the services can be classified as government to citizen (G2C), Government to business (G2B), government to employee (G2E) and government to government (G2G). Electronic government should enable high-performance government to deliver better outcomes for lower cost. ICT (Information and Communication Technology) provides a channel for enhanced or extremely new customer services, i.e. services that may not have been implemented previously.
Implementation
Providing public services enhances governments transform service delivery so they fulfill citizens ‘needs in the most efficient and cost-effective way possible. However, there has been growing evidence that e-Government initiatives are not providing what they promised. Countries are trying to solve this problem by looking at new strategies that will move them forward in order to deliver high performance in a more cost-effective manner and transform all their services. There is a direct relationship between, increasing take-up of online services verses offline services, and saving time and money (which creates value). However, the take-up rates are still low; most of emerging countries are under the world average indexes for e-government development readiness.
The impact of e-government on the citizen has also been varied. In the developed world, online services have increased significantly in the last decade some countries reaching full connected level, and transactional services are widespread between government to citizen and government to business. However, recent reports highlighted problems facing e-government in the developed world too. There has been a slowing down of the rate of growth of e-Government, and where a gap exists between the national e-Government programs, which have achieved better efficiency, some savings and better e-services and the local level e-Government which is slow to happen, and there are a calls for innovative solutions to further advance e-government from the provision of e-services to increasing the performance and implemented in better manner.
How the governments in developing countries can implement the e-government system while the serious challenges are still remain, was our main research question that helps to look into an extensive literature review on e-Government and on the implementation of IT projects in the public sector.
The answers to the research questions assisted to articulate the research problem more clearly, the study has sought to investigate the barriers and challenges behind the successful implementation of e-Government projects. In the study, an implementation framework model was developed based on extensive examination of implementation strategies in developing countries in general and Morocco e-government as conduct case study and on the implementation of IT projects in the public sector.
To provide a better understanding of the affordability, the government in developing countries needs to lunch e-government initiatives gradually, starting by the shareholders who has adapted ICT early (‘G2G’ and between government entities). Preparing interaction and transaction stages before getting in interaction with business and citizen, and as soon as G2G getting more mature (interaction and transaction level) G2C will serve the initiatives in better way. Therefore, Developing Countries can consider GBC implementation strategy as road map to lunch their e-government projects initiatives, and adapted in the way could match the current condition for each countries.
E-government evaluation
The evaluation model explained in Chapter 5, which is based on the Data envelopment analysis DEA technique and united nation e-government readiness indexes, is a model to evaluate the performance and the efficiency of e-Government system in emerging nations. The study highlights the issue of evaluating the performance and the progress of e-government system. Most of developing countries have not developed yet a technique or model to examine the development of ongoing e-government project; a few models have been discussed in our investigation like
Gartner (2001), which recommends a metrics for determining e-Government success such as Administer stakeholder satisfaction and value surveys before and after service delivery. Quantify Web channel usage relative to other channels (e.g. walk-in, phone or mail). Analyze costs and improved service for delivering services. Itemize the extent that processes have been improved Identify how government has been transformed. All those metrics comes to assess special projects that have especial tasks.
A holistic approach have been introduced by united nation throughout it division Department of Economic and Social Affairs (UNDESA), It is based on comparative assessment of the all united nation member states response to the ever-pressing demand of citizens and business for quality government services and products. The approach has developed to assess trends in infrastructure development, online access, citizen participation and inclusion, and each Member State’s ranking with different phases of delivering e-government services. Some of the developed countries are beginning to migrate beyond e-government to i-government, or ‘connected government’, which provides the basis for the transformation from a bureaucratic government to a citizen-centered one. The Survey evaluates the application of information and communication technologies by governments. The aims to which these technologies are put to use vary, but include: better access and delivery of services to citizens, improved interaction with citizens and business, and the empowerment of citizens through access to information. Overall, they result in a more effective and efficient government in general. This evaluation of e-government readiness places citizens at the forefront, by focusing on the governmental services and products that primarily affect them.
But the UN approach is far to be realistic in view of evaluation assessment of e-government projects, because we cannot compare what is not incomparable, therefore we need to evaluate e-government projects as a system that have sources as inputs and examine the outputs, this approach can only highlight if we build and implement e-government system in efficiency and effective manner or not.
In order to answer our research question about evaluation issue, we opt to present e-government as system that have some recourses as inputs and output, to do so we heavily rely on UN e-government readiness sub-index data, where EGDI sub-index used to be e-government system input and EPI as output. As we have explained in chapter 5, our arguments were based on the fact that how far the governments could engage their citizen to participate and interact with the system. In this approach, we could evaluate each e-government project within allocate resource that have been invested in order to reach governments, businesses, or citizen’s goals and needs. It also enables us to examine the performance to the system along with implementing progress.
Finding
Our research findings based on two man aspects, the literal review that is conduct along with case study and evaluation tests that we have experienced to assess the development of e-government system. In the following, we highlight the main points of our research findings.
Literal review led us to resume that e-government is not only a delivering services electronically; it is about the reform of the public sector. Therefore, e-government is a tool but not an ultimate goal. This is very important for gaining a clear understanding of the vision of e-government. Providing an online service is only one goal for a government, but the ultimate vision is to create transparent and participative democracies. However, the ICT does not lead to administrative reform but rather to reinforcing existing administrative arrangements. For reform to happen, leadership must establish clear goals for reform and then bring ICT in. Some researchers warn of expecting too much from improving public services. Unrealistic expectations among government employees and users of government services may backfire and undermine the longevity of any reform effect.
The literature highlights the extent of the implementation of e-government has been varied. The Western world has been more successful than the developing world in terms of implementation. Nonetheless, there are exceptions such as in the case of Morocco. There are a few countries where business and citizens are beginning to feel the impact of e-government. Some Countries in particular have moved e-government services from the informational stage to the transactional stage (UN, 2014). In Morocco, engaging citizens to develop e-government projects has helped and raised e-participation to high level (EPI leader in region), collecting tax from business and citizen can now be carried out online. Also, there have been signs of government commitment to move from e-Government to e-governance.
The implementation of e-Government has hit a plateau. The leap from a stage to stage has been the most difficult. This is because e-government involves the participation of all segments of society. On the other hand, the impact of e-government has been less felt in the developing world. In some regions, online services have yet to take-off. A reason for that is the low level of IT infrastructure which is similar to that of the low income countries. Also, in developing countries there is a need for e-government on a national level to support development of local e-government in order to bring more segments of societies into the information society. Any implementation approach should take into account issues relating to digitizing process and ICT infrastructure as well as policy regulation. Along with three dimension, building e-government system could be achieved gradually with cost-effective and in best manner.
E-government Comparative assessment that has been adapted by UN could only serve the position of e-government progress toward other nations, but is not a critical evaluation process that will picture an accurate development stage that achieves by any countries. Measuring the outcomes of e-government system may serve the goal; they will not be full comprehensive implications if there is no measurement that sizes the outputs. Therefore, e-government could be ranked base on effects that change the way its serve their citizen as well as business and how far this change is transforming to reach full information society.
Research limitation
Examine and investigate e-government implementation and evaluation needs an extensive works to collect information and data. Our research relies heavily on literature review and virtual examination of e-government systems in developing countries. Through many organization surveys to academic research papers we could highlight the issue of data; consulting government’s web portal did not serve the purpose of research outlines. The emphasis our research questions we opt to use United Nation e-government readiness as main source to start with.
The UNPAN project encompasses an extensive data collection effort, particularly on the Web measure index due to the survey involved in obtaining the data for this component. This could be a bottleneck for the regular availability of the index as an indicator of e-Government progress. The proposed technique has traditionally been used by practitioners as a variable reduction procedure by transforming a large set of correlated variables into a smaller set of uncorrelated variables or principal components that account for most of the variation in the original set of variables. Our current study and the technique we apply here can have implications for similar index building exercises beyond the UNPAN index. As many local, provincial, and national governments embark on e-Government initiatives, our study provides some critical guidelines for index composition and application. First, as our results demonstrate, empirical evaluation of the indices might be a necessary step to evaluate the efficacy of the index.
While scope and constitution of the index can be theoretically or conceptually determined, whether or not they truly represent the observed phenomenon can be more appropriately ascertained through empirical evaluation. For example, though the UNPAN index assumed adult literacy twice as important as school enrollment, data collected from the target population showed both to be equally important.
Second, as our findings highlight, it might be worthwhile to focus on capabilities of technology rather than technologies themselves. As technology evolves rapidly, any specific medium, or the technology artifact through which information is accessed, can quickly become irrelevant. For instance, with rapid increases in the capabilities of handheld devices, including PDAs and cell phones, a technology indicator like PC use becomes irrelevant with time. Hence, one should focus on the relevant capability, which is the ability to connect to the Internet in this case, rather than on the device which provides the capability.
Third, building on the specific empirical results of this study, it can be recommended that policymakers should not emphasize the supply aspects of e-Government at the expense of nurturing the demand side. As our results show, variances in index values were largely accounted for by the infrastructure and human resource constructs than by the Web measure construct. The results imply that while governments can choose to rely on supply or push factors like creating superior online features and functionalities, the uptake of such services is critically dependent on the ability of the citizens to exploit the services and the infrastructure necessary to make those services widely available. Hence, it is important for policymakers to be attentive to the needs of delivery and absorption facilitators like educated citizenry and the underlying telecom infrastructure for ushering in e-Government.
This study has limitations which relate to two aspects of our analysis. The first aspect relates to the variables used in the development of the index. Our index development is based on the set of variables that are used in the UNPAN project. We believe that there may be other variables that are potential determinants of e-Government readiness. While our method primarily aims at providing empirical justification for the choice of the weighting schemes, it also inherits any limitation related to the completeness or scope of the variables included in the index development.
Our study, however, provides opportunities for additional research and expanding the scope of variables that will further enhance the contribution of the proposed methodology. Based on our earlier arguments, we propose that expanding the scope of index items or constructs can follow two complementary paths.
First, since the demand side factors are important, readiness measures should tap into accessibility and benefit factors including ease of use, ease of access, reliability of services, and usability, among others.
Second, given the permanence of change in the technology sphere, policymakers must be prepared to constantly refresh the basket of technologies that create the information infrastructure and are incorporated in the index. Hence, it would require constant attention to new technology features like Web 2.0 and interactive capabilities, enhanced media capabilities, and evolving mobile or anywhere service capabilities, among others.
If technology or infrastructure measures do no evolve over time, the indices can quickly lose relevance. The second limitation relates to benchmarking of our results. Given that there are no other techniques available in the literature that could be used as benchmarks for our analysis and results, we cannot conclude that our indices are superior to the existing index. However, we would like to highlight that the proposed indices and the weighting scheme used to develop these indices are derived from the internal structures of the data.
Cite This Work
To export a reference to this article please select a referencing stye below:
Related Services
View all


Related Content
All TagsContent relating to: "Government"
A Government is a collection of people in the position to govern a country or region. Governments have the power and authority to debate and make decisions on behalf of their people.
Related Articles

DMCA / Removal Request
If you are the original writer of this dissertation and no longer wish to have your work published on the UKDiss.com website then please: