Dissertation on Effective HGV Fleet Management
Info: 10065 words (40 pages) Dissertation
Published: 15th Nov 2021
Tagged: Transportation
1. Introduction & Background
In Ireland there are 48,800 employed within the Freight Transport, Distribution & Logistics (FTDL) sector. As Irelands economy continues to grow, there is increasing demand for the transportation of various goods. I got the inspiration for this project from S. Cooper and Sons Ltd, who operate a fleet of 50 articulated units for general haulage in Cheshire, UK. I was doing my work placement there and when discussing how their vehicles were replaced with the financial director, he stated that they had no structured system. After speaking to other companies I concluded that this is the case with haulage firms across Ireland and the UK, and despite my online and library research, there does not appear to be a set matrix or method in which a transport company can decide when is best to replace a HGV.
Correct HGV asset management (fleet management) is a process which allows the owner or fleet manager to minimize the risks associated with vehicle investment and disposal. This process done correctly will improve the fleet efficiency, productivity and reduce overall transport costs. It may be carried out by either an in-house fleet-management department or an outsourced fleet-management provider.
Effective fleet management also aims at reducing and minimizing overall costs through maximum, cost effective utilization of resources such as vehicles, fuel and spare parts.
In this report, the process used to carry out effective HGV selection will be examined in the following sections:
2. Literature Review
- The scale of Irish road freight activity
- Vehicle Purchasing
- Vehicle Disposal
3. Research Methodology
- Survey explanation and candidates chosen
- HGV Initial cost New/Used
- Explanation of depreciation and lifetime cost
4. Findings and Analysis
- Survey Results
- Depreciation findings
- Costs associated with existing replacement models
- Optimal cost saving model
5. Conclusion
- Potential Savings
- Recommendations
- Acknowledgements
2. Literature Review
This literature review will examine current information and data currently available. It will examine the scale of Irish road freight activity, examining the growth of tonne-kilometres in Ireland and Northern Ireland and will show the volume of freight tonnes transported by road between different regions. This is compiled from haulier surveys of Irish and Northern Irish registered goods vehicles. The majority of this literature will come from ‘Inter-Trade Ireland’
The current data surrounding vehicle purchasing considerations will also be examined under vehicle acquisition methods and the various advantages and disadvantages of each. The vehicle layout will also be examined, illustrating the differencebetween ‘6×2’ and ‘4×2’ configurations. This information will come from Irish revenue as well as accountancy papers.
Literature surrounding fuel efficiency will also be examined showing the economic impact fuel efficiency has on finances. This information will include a table.
The current data regarding the difference of gearboxes in terms of fuel efficiency will also be shown and will include a table in this literature review.
Environmental literature from the SEAI will also be reviewed, as well as Operator licence considerations as outlined by the ‘Road Transport Operators Licence’ guidelines.
Vehicle disposal and replacement considerations information will also be reviewed, and the various methods in which a haulage operator may replace a vehicle. The advantages of each method will be examined with the difference between direct and indirect costs.
The licencing considerations will also be examined for adding, deleting or replacing a vehicle. This information will be based on the Department of Transport and the ‘Road Transport Operators Licencing’ association.
2.1 Scale of Irish road freight activity
In 2016, 98% of all of the internal merchandise trade is carried on the road network. The lack of any significant infrastructure from alternative models such as rail or waterway is uncommon elsewhere in the EU. Due to the current economic structure combined with the limited volume of bulk transportation, does not allow an Ireland to act against the economic viability of road transport.
Consequently, the central role served by road freight for inland transport in both jurisdictions appears to be unlikely to change significantly into the future, without the advent of major economic, political or technological changes. This dependence on road freight has potentially important future environmental implications, along with an ever increasing requirement for a high quality road network with sufficient capacity to carry both freight and passenger traffic, throughout the day.
According to the national institute for transport and logistics, the rapid growth in industrial output in Ireland has meant that its freight demand has grown very rapidly for many years. In the 10 years from 1996 to 2006, tonne-kilometres carried by Irish registered vehicles increased by 180 per cent whereas vehicle kilometres increased by 115 per cent, this lower rate being due to a switch to larger vehicles. However Fig.1 shows that since 2001 in Ireland, all 3 series: tonnes, tonne kilometres and vehicle kilometres, increased at similar rates. This is due to the rapid expansion in materials carried for the building and road construction industry. Since 2013, high levels of growth in road freight tonnes lifted have also occurred in Northern Ireland, again this is strongly related to increased carriage of construction materials.
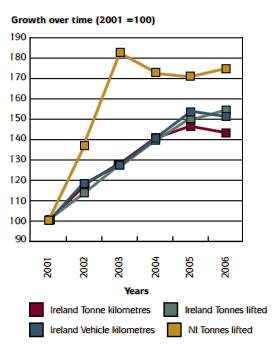
[Fig.1] In general this trend to use larger vehicles is beneficial from a road transport point of view, provided that the average proportion of vehicle kilometres that are fully loaded does not reduce. For operators the efficient use of larger vehicles will be more cost-effective in terms of fuel usage, capital cost and driver costs than the use of smaller vehicles. It will also reduce the total number of vehicles on the road needed to carry a given tonnage of goods, which is beneficial in terms of easing
The growth rate in road congestion for all other travellers. The main counter force lies in the growth of Just-in-Time (JIT) deliveries and of Internet based retail (e-commerce), both of which use small consignment sizes that are better suited to smaller vehicles. The eventual size of the e-commerce market is difficult to estimate for the present but it does have the potential to lead to a major increase in traffic volumes, particularly in urban areas, which would only be partly offset by some reductions in car trips to retail. As e-commerce increases in scale it would, however, also provide opportunities for more efficient logistic systems using cost pressures and economies of scale to achieve efficient usage of a range of vehicle sizes. Long haul movements would take place in larger vehicles and the use of smaller vehicles would primarily be for local deliveries based on efficient routing systems. There is growing interest elsewhere in Europe in Large Heavy Vehicles LHVs. Ireland in the past has tended to follow UK changes in maximum lorry weights and dimensions. The UK government will soon be publishing a report examining the case for allowing LHVs onto UK roads. The issue may also have to be reviewed by the Irish Government. As there is a relatively small proportion of dual carriageway / motorway on the island of Ireland, the movement of LHVs might have to be tightly restricted if they were to be legalised.
[Figure 2] Shows the volume of freight tonnes transported by road between different ‘NUTS3’ regions. This is compiled from haulier surveys of Irish and Northern Ireland registered goods vehicles and therefore excludes the tonnes on vehicles registered outside the island of Ireland. For reasons of clarity of illustration, the map shows all movements originating at a single point
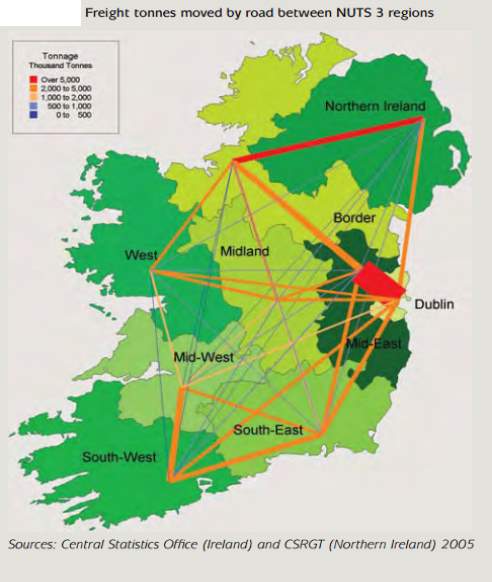
[Fig 2] http://www.nitl.ie/_fileupload/ITI_Freight_Report.pdf
2.2 Vehicle Purchasing Considerations
Acquiring the optimal HGV for a haulage firm is a complex process. The vehicle’s ability to carry out the service as effectively as possible must be considered along with, the vehicle price and running costs, comfort, image and branding suitability need to be considered alongside.
2.2.1 Vehicle acquisition methods
The methods in which a haulage operator may acquire a vehicle can be broken down into various methods with their various advantages and disadvantages. The three most commonly used methods are, purchasing the vehicle outright, vehicle contract hire and finance leasing.
http://www.revenue.ie/en/tax/it/leaflets/it52.html
Purchase Vehicle Outright
This method involves a simple transaction where the haulage company purchases a vehicle using its own available funds. It has a number of benefits if the capital is available if cash is available. When a vehicle is financed or leased, interest charges and leasing fees are added to the vehicle’s acquisition costs. When a fleet purchases a vehicle outright, those fees are not charged. The haulage company also has greater control over depreciation as when a company owns a vehicle outright, it controls the resale pricing, with the potential to sell it at retail pricing versus wholesale.
| Purchase Outright | ||||
| Initial Cost | Years Kept | Sell Price (5 Years) | Value lost | Total Monthly Cost |
| € 88,500.00 | 5 | € 20,000 | € 68,500 | € 1,141.67 |
Vehicle Contract Hire/Purchase
This method involves renting vehicles for a set period, normally three to five years, while making fixed monthly payments. It is often considered more flexible, convenient and cost-effective than buying vehicles outright. A haulage operator may benefit using this method as there are fixed monthly payments which allows simple budgeting. These monthly payments are treated as a business expense, the business can deduct it from profits when filling out the end-of-year tax return. Contract hire is a tax deductible expense and the truck is not considered an asset. Maintenance and repair costs are the responsibility of the hirer. This includes CVRT/MOT costs, Road tax and tyres. The vehicle is returned to the hire company when it reaches the end of the term or is not needed. http://www.westerntruckrental.co.uk/contract-van-hire-cost-effective-hassle-free-way-run-van-fleet/
Finance Lease
A finance lease is a type of lease in which a finance company is the legal owner of the vehicle during the duration of the lease (Normally 5 years), while the lessee not just has operating control over the asset, but also has a substantial share of the economic risks and returns from the change in the vehicles valuation.
The haulage company will select a vehicle and the finance company will purchase it, giving the haulage company use of the vehicle during the lease. The haulage company will pay a series of instalments, typically paying €20 interest for every €1000 of the vehicles value. The maintenance of the vehicle may be included in the price, depending on the finance company and the haulage company has the option to buy the vehicle outright or refinance it, once the last instalment has been made.
| Finance Lease | ||||||
| Initial Cost | Interest Rate | Term (Months) | Interest | Monthly Interest | Total Monthly Cost | |
| € 88,500.00 | 3% | 60 | € 2,345.25 | € 39.09 | €1,514.09 | |
Vehicle Layout
A fundamental stage of the HGV selection process is to determine what the vehicle will be used for, the conditions it will regularly be operating under and any other operational or legal constraints. This information will provide the basic requirements for the vehicle including the type of loads that it will be able to carry, how much deck space is required, the type of body to be fitted and how loads will be secured. The gross weight of the vehicle and the vehicle’s dimensions must also be considered due to various height and weight restrictions. These will affect the vehicle’s configuration including the number of axles, deck length and suspension. Choose the lightest possible vehicle to do the job you want done. Every kilogram of extra vehicle weight is a kilogram extra you pay for in fuel and is effectively dead-weight, as opposed to payload (goods carried for profit).
Unit Configuration
Articulated units most commonly come in 4×2 or 6 x2 layouts. 4×2 implies that the unit has 4 wheels and two driving wheels as shown below in Fig.3 and Fig.4.
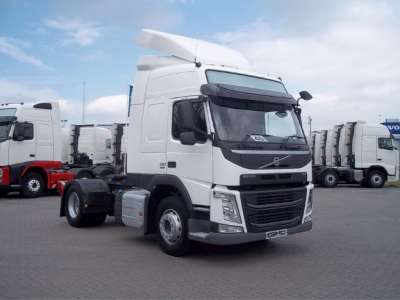
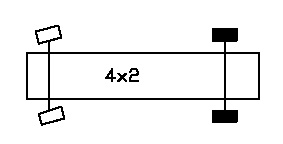
[Fig.3] [Fig. 4]
The UK rules differ slightly to those on the continent which means that over recent years, the 4×2 format has become less popular than the 6×2, since three axle tractor units (6×2) are more tax efficient and are able to carry an extra four tonnes in the UK. International operators will have to opt for the 4×2, as there is no benefit to operating a 6×2 abroad. The maximum permissible GTW for a 4×2 tractor unit in the UK and abroad is 40 tonnes, although many will run lower than this and pay a reduced road fund licence. If an operator does not need to run at full weight, plastics, polystyrene, clothing etc. weighs relatively little and therefore a 4×2 tractor unit operating at 28 tonnes would do the trick. Local urban deliveries to supermarkets may use an ‘urban artic’ – a downsized 4×2 tractor unit and trailer to make deliveries into tight spots.
The three-axle tractor unit segment has overtaken the 7.5 tonne truck to become the largest in the UK and Ireland. When combined with a three-axle trailer, these units are able to have a combined weight of 44 or 46 tonnes (GTW) in the UK and Ireland respectively. As with a 6×2 rigid, a 6×2 artic can have the additional axle added between the main axles – a Midlift, or behind the rear, drive axle – a rear lift. It is usually part of the standard fitment that the axles can be lifted to save fuel and rubber when running empty or part-loaded. For a 6×2 tractor unit to operate at 44 tonnes, the weight on each drive axle may not to exceed 10,500kg, and drive axles have to have ‘road friendly’ (air) suspension or not to exceed 8,500kg axle weight, the trailer to have road friendly suspension and the trailer has to be a triaxle. Shown below in Fig.5 and Fig.6 is an example of a 6×2 configuration.
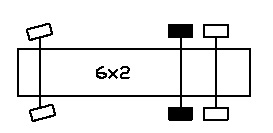
[Fig.5] [Fig.6]
https://www.trucklocator.co.uk/hub/search-help/axleconfiguration/
2.2.2 Fuel efficiency
Commercial vehicles often do not have published fuel efficiency figures as they vary depending on the nature of work being carried out. A true, realistic figure will be achievable by hiring out a demo model if a new vehicle is being considered. If a vehicle uses 38L/100Km (7.5 MPG) and the intended use is 50,000Km per annum, a vehicle capable of 30L/100Km (9.5 MPG) at €1.21 per litre of diesel will save € 4,800 per annum ex VAT. Adblue consumption is also a factor to be examined, with every EURO 6 vehicle fitted with the system. Adblue consumption is generally .5% of fuel consumption. Tyres must also be considered when choosing a new unit. A 25% reduction in tyre pressure increases fuel consumption by 3%. 38% of all vehicles checked across Europe (in a 2007 survey by Bridgestone) were 25% or more underinflated. Low rolling resistance tyres should be considered.
| Fuel Consumption (MPG) | Litres Used* | Annual Fuel Bill* |
| 7.06 | 33333.33 | €40,000.00 |
| 6.94 | 33898.31 | €40,677.97 |
| 6.82 | 34482.76 | €41,379.31 |
| 6.70 | 35087.72 | €42,105.26 |
| 6.59 | 35714.29 | €42,857.14 |
| 6.47 | 36363.64 | €43,636.36 |
| 6.35 | 37037.04 | €44,444.44 |
| 6.23 | 37735.85 | €45,283.02 |
| 6.12 | 38461.54 | €46,153.85 |
| 6.00 | 39215.69 | €47,058.82 |
| 5.88 | 40000.00 | €48,000.00 |
*Fuel Cost = €1.20 per litre 100,000Km Per Anuum
[Table.1]
Gearbox
For many years manual gearboxes have been considered more fuel efficient than automatic gearboxes but this is no longer the case. The development of electronically controlled manual gearboxes (also known as double clutch gearboxes) has delivered savings of 3% over manual gearboxes regardless of the type of work that you do, or your driving style. Specify a double clutch automatic, where available and suitable for your operations.
| Gearbox | Efficiency | MPG | KM/L | Annual KM | Litres Diesel Used | Fuel Cost | Annual Fuel Cost |
| Manual | 97% | 7.985549 | 3.395 | 150000 | 44182.6215 | €1.20 | €53,019.15 |
| Automatic | 100% | 8.232525 | 3.500 | 150000 | 42857.14286 | €1.20 | €51,428.57 |
| Extra Fuel Cost | €1,590.57 |
[Table.2]
Environmental Impact/Emissions Regulations
Requirements such as congestion charges and ‘clean air zones’ (if operating in the UK) must be considered.
Carbon footprint is becoming more and more important. To reduce it you may need to cut down your fuel usage or consider using alternative fuels. The European Union has set emission standards, often referred to as Euro I to V, for all heavy-duty diesel engines. The regulations apply to all motor vehicles with a gross weight over 3.5 metric tonnes. The aim of these regulations is to improve air quality by reducing emissions, and although the standards themselves don’t measure CO2 , CO2 is reduced as a by-product of reducing emissions generally. The maximum emission limits seen below are based on the age of the vehicle, so a vehicle bought in 2003 is and cannot emit more than 2.1g/kWh of Carbon Monoxide.
Operator Licence Considerations
When adding or replacing a HGV to a fleet, the department of transport must be notified. The owner of vehicles being operated as part of a road haulage operation must hold a certified true copy of the licence that relates to each vehicle in their fleet and must also display a vehicle transport disc on each vehicle. When including a vehicle on the licence, the Road Transport Operator Licencing (RTOL) form must be filled in on the form showed below:
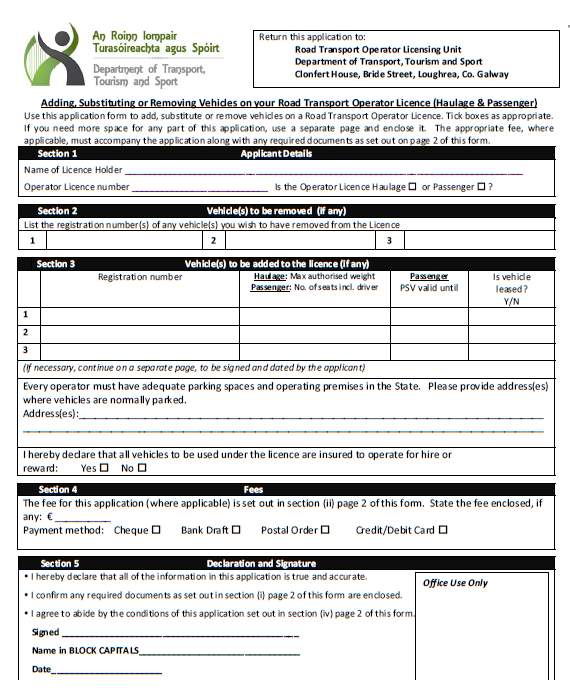
[Fig.6]
Where the vehicle is being substituted, the licencing documents for that vehicle such as the transport disc, certified copy of the operator licence and the certified true copy of the Community licence must be returned with the application. When a vehicle on an older style licence issued before July 2013, is being replaced, the original licence must also be returned so the vehicle can be cancelled on the rear of the transport document.
When a vehicle being purchased increases the number of vehicles on a licence, the financial standing details must also be submitted to the department proving that the operator has an extra €5000 in assets or finance, signed by a qualified accountant.
When deleting a vehicle from the licence, the same form must be completed, filled in with the relevant details. The transport disc, certified true copy of the operator and community licence (where appropriate), must also be returned in the application.
https://www.rtol.ie/rtol-online/
2.3 Vehicle Disposal
Replacement Cycles and Depreciation Considerations
There are many considerations to be made regarding replacement cycles. These include cash flow and brand image as well as vehicle type, costs and how the vehicles are being used. Many fleet operators believe extending the replacement cycle will automatically lower a fleet’s fixed costs. Depreciation is highest in the first year of a vehicle’s life, and the slope of the depreciation curve flattens moving forward. Depreciation is only one factor affecting a vehicle’s total cost of ownership (TCO), and extending hold times does not always result in a better TCO.
The following are three approaches that may be used in determining when to replace a vehicle:
- Conducting an economic lifecycle analysis to estimate the optimum replacement point that results in the lowest total overall cost over the vehicle’s life. While this approach is flexible and comprehensive, it requires extensive amounts of data and can be complicated to implement. It also involves quantifying many parameters such as vehicle downtime, obsolescence, and other cost factors. It is also based on the assumption that future maintenance costs can be forecasted based on analysis of historical maintenance costs. External consultants may be needed to help fleet managers with the process.
- Replace at an established age and or mileage. This is a method used in many fleet operations, such as eight years/100,000 miles. It is simple to use and objective. This method’s main disadvantage is that, by relying on age or mileage criteria alone, variations in vehicle condition within the class are not accounted for.
- Replace when the cost to repair exceeds a threshold amount. The idea of this is to replace the vehicle when its repair costs exceed a threshold amount. Examination of historical trends in repair costs over time should reveal at what point they start to increase significantly.
Both the direct and indirect costs associated with operating a heavy vehicle need to be considered when selecting the required unit.
Direct costs may include the original purchase price, the depreciation and resale value, the insurance costs, charges and interests, fuel costs and tyres and maintenance.
Indirect costs are those which do not have an instant financial effect such as the company’s driver turnover, the company image/brand, the effects of not maximising transport space and load, vehicle safety and the vehicles environmental impact.
Indirect costs are those which do not have an instant financial effect such as the company’s driver turnover, the company image/brand, the effects of not maximising transport space and load, vehicle safety and the vehicles environmental impact.
3. Research Methodology
This research will utilize both quantitative and qualitative data collection tools, while also recognising the importance of locating the research within the haulage Industry.
The data collection will consist of surveys and interviews with transport managers. Data will be gathered using relevant information from scientific journals and books, and compiling databases in order to examine the industry methods. A survey will be sent out to Irish haulage companies asking a variety of questions to measure the use of vehicle purchasing and disposal strategies. This will be sent to a broad spectrum of small, large and medium sized operators.
Interviews are planned with two senior management participants, who operate using articulated vehicles to provide a range of services within the European haulage industry. This will allow me to achieve a more complete understanding of what considerations Irish haulage companies use when purchasing or disposing of a vehicle. Figures on the running costs of the vehicle as it gets older will also be obtained from these interviews.
The depreciation rates of a common articulated HGV unit will also be researched. These figures will be obtained using commercial vehicle sales figures and finding the average value of this vehicle based on its age and mileage. This will be presented on a table and a graph, clearly showing the depreciation rates as a vehicle ages and as its mileage increases.
The answers to the following questions will be obtained through the research:
- How many operators have a definitive vehicle replacement policy, and what factors are considered before replacement?
- Do the majority of operators obtain new or used vehicles and the methods in which they acquire them?
- What criteria do operators use to decide when a vehicle should be replaced with new or used vehicles?
- What is the optimal time to replace a vehicle, based on depreciation factors, and the rising cost of maintenance as the vehicle gets older?
- Is vehicle leasing a viable option for haulage companies considering purchasing a vehicle?
3.1 Quantitative Method
Definition: Quantitative methods emphasize objective measurements and the statistical, mathematical, or numerical analysis of data collected through polls, questionnaires, and surveys, or by manipulating pre-existing statistical data using computational techniques – University of California (2015)
The quantitative method that will be used is a survey questionnaire sent to a variety of operators. This will enable a more scientific result to be obtained, which is used to represent the general industry trend. From the 150 short surveys sent out, I aim to receive 50 responses. The respondents will be sent the survey via email to answer the questionnaire and this process will be continued until the desired number of 50 respondents is reached.
The questionnaire requires information about the strategy (if any) that the operator has in place to purchase and disposal of the vehicles in the fleet. It also has questions related to the considerations taken when purchasing additional vehicles. The survey will require the respondent to give the following information.
- How many vehicles are in the respondent’s fleet
- The methods in which the majority of these vehicles are acquired.
- If their company have a definitive vehicle replacement policy?
- If their company purchase new or used vehicles.
- When and why vehicles in their fleet are replaced
- Which factor is of greatest priority when purchasing any additional vehicles

[Fig.7] https://olivershuter93.wordpress.com
3.2 Qualitative Method
Definition: Qualitative Research is primarily exploratory research. It is used to gain an understanding of underlying reasons, opinions, and motivations. It provides insights into the problem or helps to develop ideas or hypotheses for potential quantitative research – Snap Surveys (2011)
Two in-depth interviews will be held with two Financial Directors of medium-sized haulage companies (between 50-100 articulated vehicles). To obtain a broad collection of information, both companies will operate in different countries and carry out different services.
One company is a General Haulage operator, which operates domestically in the UK only. This company has a variety of clients, from Pharmaceutical wholesalers, to construction material factories. Because of the numerous load weights and volumes, this company exclusively use one type of articulated unit and one model of curtain-sider trailer.
The other company mainly offers container transportation and bulk liquid logistics. This company operates using a variety of articulated units, and a variety of trailer types (Skeletal, Curtain-sider and tanker).
During these interviews the methods of vehicle acquisition will be discussed, as well as the considerations taken when purchasing a vehicle. The considerations taken when disposing of a vehicle will also be discussed, and the servicing and maintenance costs associated with new and ageing vehicles.
3.3 Online Data Gathering
In order to obtain information on realistic depreciation rates and the difference in costs when purchasing a new or used vehicle, research will be carried out using the actual cost of articulated tractor units. These figures will allow the most cost effective method of purchasing a vehicle outright to be analysed. The prices of an articulated 6×2 unit will be researched, as it is the most common articulated tractor unit for sale online. This allows the most accurate depreciation figures to be obtained.
The vehicles depreciation and value based on age and mileage will be researched, and the findings will be analysed and discussed in the next chapter.
4. Findings/Analysis
This chapter will bring in the presentation of the findings and analysis derived from the quantitative online survey, as well as the interviews conducted and the online research carried out. A total of 51 responses were received from the targeted 150 potential respondents, which constitutes a 29.4% response rate for the survey. The questionnaire was finalized after meetings with the project supervisor, Mr. Clive Atkinson and the survey was promoted on the Irish Hauliers Association on Facebook and LinkedIn. Out of 51 respondents, 100% have completed all of the questions that were required to be answered and no respondents have either exited the survey half way or have not attempted to answer some of the questions. The responses gathered from the online survey have been analysed using the embedded tool from Survey Monkey and Microsoft Excel software. This chapter solely focuses on presenting the gathered data in a meaningful way, in order to find the conclusions.
Two in-depth interviews were held with the two Financial Directors of medium-sized haulage operations. These results will be analysed and discussed. The results of the online unit depreciation research will also be analysed, under the vehicles age and mileage.
4.1 Qualitative Findings
From the two interviews carried with senior haulage directors I was able to obtain information on their vehicle replacement strategies. Both participants were qualified accountants with extensive experience in the transport industry, whilst being responsible for the acquisition and disposal of roughly 100 HGV’s each. Both participants manage companies domestically inside the EU, one in Ireland and the other in the UK.
The first participant was in the process of designing replacement strategy for the fleet. This company traditionally bought used articulated units from other haulage operations who purchased their vehicles new. This provided a lower initial cost price compared to purchasing a new vehicle, however the maintenance costs on these were higher than a new vehicle, despite the operator having on-site maintenance facilities. The participant was also investigating the possibilities of finance leasing vehicles.
The second participant also traditionally purchased used vehicles outright, and maintained the vehicles on the premises. This provided the haulier with expensive repair costs, high fuel costs, extensive vehicle downtime and a less optically pleasing fleet of vehicles. More recently this company had started to use contract hire to acquire the vehicles, in order to maintain a more modern, efficient fleet. The participant displayed the telematics information on fuel consumption, and had figures on the fleet’s average fuel economy and how it decreased with age.
Both participants also ran the same tractor unit specification, with each unit covering 100,000km’s on average per annum.
The figures both participants stated for the increasing costs of vehicle maintenance, as well as vehicle running costs were recorded and plotted on a graph using Microsoft Excel.
4.1.1 Key analytical points of the interviews
Like many medium sized operators, both participants traditionally bought used vehicles outright, with the intention of disposing at the vehicles end-of-life.
“Even before I started here, the philosophy was always to buy older trucks off the larger operators once they reach three or four years old” – Quote from the first participant
The concept of hire purchase was being explored by both participants as an alternative method of acquiring a vehicle, specifically contract hire.
“Myself and the board have been crunching the numbers on vehicle contract hire, and going forward – we are going to stop purchasing older vehicles outright” – Quote from the first participant
Neither participant had a set vehicle replacement strategy and agreed that a replacement strategy would be advantageous for any haulage operator
“It’s something we are currently looking into, but with the extra work we have just taken on, we still haven’t found the time to sit down and establish the optimal method to replace our vehicles” – Quote from the second participant
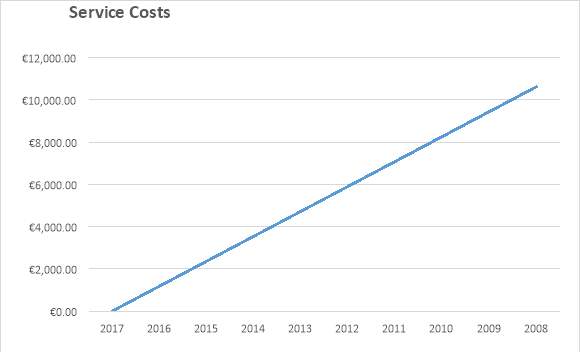
Both participants agreed that the maintenance costs of one of their 6×2 articulated units increase by an average of €1000 per annum. This data is shown in the graph below.
[Graph.1]
Both participants had concerns about the costs associated with running an older vehicle in terms of fuel consumption and maintenance costs and this data is also shown in table and in the graph below
| Vehicle Age | Fuel Consumption (Km/l) | Litres Used | Annual Fuel Bill* | Fuel Costs Vs New Vehicle |
| 2017 | 3 | 33333.33333 | €40,000.00 | €0.00 |
| 2016 | 2.95 | 33898.30508 | €40,677.97 | €677.97 |
| 2015 | 2.9 | 34482.75862 | €41,379.31 | €1,379.31 |
| 2014 | 2.85 | 35087.7193 | €42,105.26 | €2,105.26 |
| 2013 | 2.8 | 35714.28571 | €42,857.14 | €2,857.14 |
| 2012 | 2.75 | 36363.63636 | €43,636.36 | €3,636.36 |
| 2011 | 2.7 | 37037.03704 | €44,444.44 | €4,444.44 |
| 2010 | 2.65 | 37735.84906 | €45,283.02 | €5,283.02 |
| 2009 | 2.6 | 38461.53846 | €46,153.85 | €6,153.85 |
| 2008 | 2.55 | 39215.68627 | €47,058.82 | €7,058.82 |
| 2007 | 2.5 | 40000 | €48,000.00 | €8,000.00 |
*Diesel = €1.20 Per Litre *100,000Km’s P.A
[Table.3]
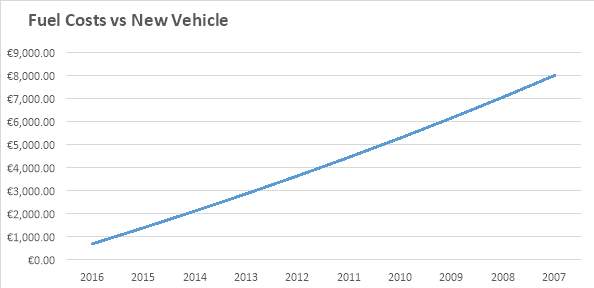
[Graph.2]
As shown in the graph above, fuel costs increase gradually as the vehicle gets older by almost €700 per year. This was a great concern to both participants, and a major factor in deciding when a vehicle should be replaced.
“We estimate that on average we lost half a kilometre per litre for every year the vehicle gets older (0.12MPG). This works out to roughly €700 extra per vehicle, per annum” – Quote from the second participant
4.2 Quantitative Finings
The survey of 51 transport managers and planners was conducted from the 29th till the 31st of March. The questionnaire asked the respondents eight questions regarding purchase and disposal of the vehicles in the fleet. It also has questions related to the considerations taken when purchasing additional vehicles. This section provides an overview and summary of key analytical points of the survey under the following headings)
- Respondent Fleet Size and Profile
- Acquisition Method
- Fleet Replacement Strategy
- Fleet Purchasing Considerations
4.2.1 Sample Fleet Profile
The aim of the survey was to target a broad range of transport operators, in order to obtain an accurate overview of the methods used in Ireland. This was achieved and as shown below, an equal share of small, medium and large sized haulage companies responded. The slight majority of respondents (23.5%) were operating between 21 and 50 vehicles, with respondents operating over 100 vehicles, between 51 and 100, and between 1 and 10 each accounting for 19% respectively. Only 17% of respondents stated that they were operating between 11 and 20 vehicles as shown in Fig 4.1 below.
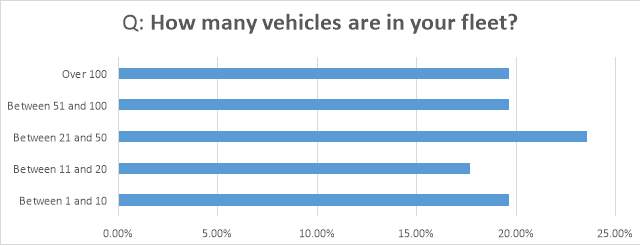
[Chart.1]
4.2.2 Acquisition Method
As shown in Fig 4.2 below, of the 51 respondents, the vast majority (76%) purchased their vehicles outright, as shown in the chart below. 16% of respondents said they were on a contact hire plan, and only 8% of respondents leased the majority of their vehicles from the manufacturer.
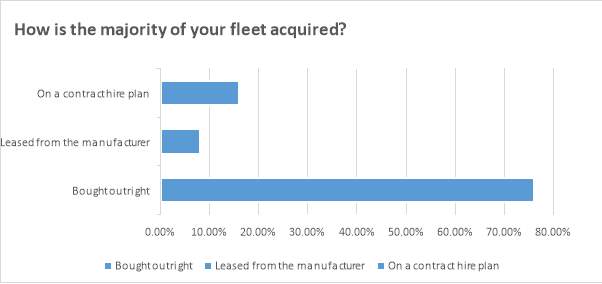
[Chart.2]
The data shown below in Fig 4.3 highlights that the 70% majority of respondents purchased new vehicles, with the remaining 30% purchasing used vehicles
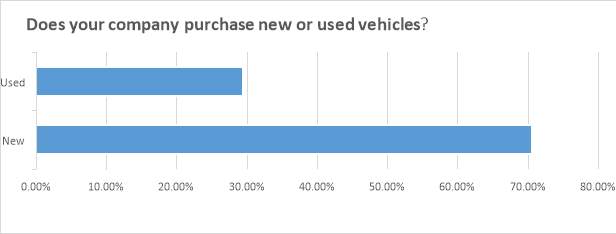
[Chart.3]
4.2.3 Fleet Replacement Strategy
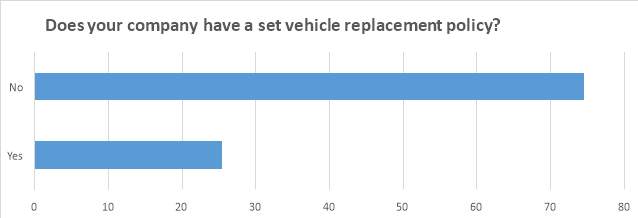
The questionnaire revealed that of the 51 respondents, only 25% of them had a set vehicle replacement policy in place. The remaining 75% stated that they did not have a policy in place, as the data shows in Fig 4.4 below.
[Chart.4]
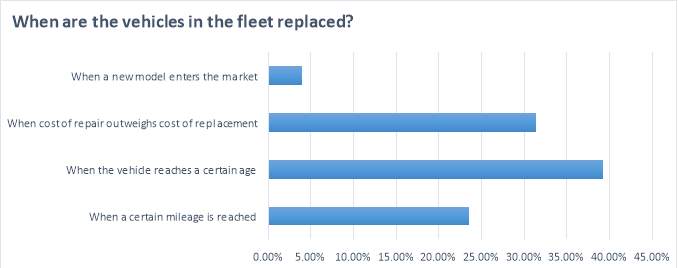
When asked for the criteria in which vehicles are replaced, the respondents gave a mixed response. The most popular method used was replacing when the vehicle reaches a certain age (39%). The next most common method was replacing when the cost of repair outweighs the cost of replacement (31%), followed by the vehicle being changed once a certain mileage is exceeded (24%). The least common method used was replacing the vehicle when a new model enters the market (4%). This is shown in the bar chart Fig 4.5 below.
[Chart.5]
Once establishing that the majority of operators with a set replaced their vehicles based on age, the survey revealed which age the vehicles reach when replaced. The data from the questionnaire reveals that most common age a transport manager who changes their fleet based on vehicle age is between 2 and 4 years old (26%). This is followed by between 8 and 10 years old (16%) and between 4 and 6 years old (6%). The least common age chosen by an operator using age as a catalyst for change is between 6 and 8 years old. This data is shown in the bar chart Fig 4.6 Below.

[Chart.6]
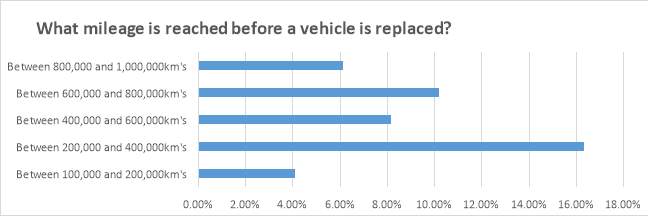
This questionnaire also revealed that the 24% of operators replace their vehicles based on mileage, with the minority of respondents who use this method (4%) replacing between 100,000km’s and 200,000km’s. The most common mileage chosen was between 200,000km’s and 400,000km’s (16%), followed by between 600,00km’s and 800,000km’s (10%) and again by 400,000km’s and 600,000kms’s.
[Chart.7]
4.2.4 Fleet Purchasing Considerations
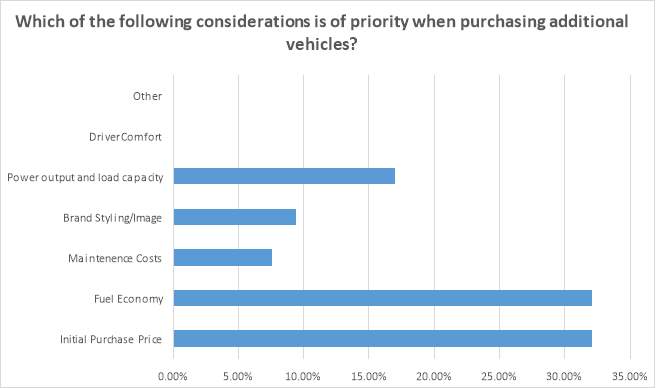
The final question in the survey asked respondents to state their most important consideration when purchasing an additional vehicle. The most common considerations were the vehicles initial purchase price, and the vehicles fuel economy (30% each). Power output and load capacity was the third most common choice with 17% of respondents considering it the most important consideration. 9% of respondents stated that brand image and styling was the most important factor, and just 7% of respondents rated maintenance costs as their priority. No respondents considered driver comfort as the most important consideration.
[Chart.8]
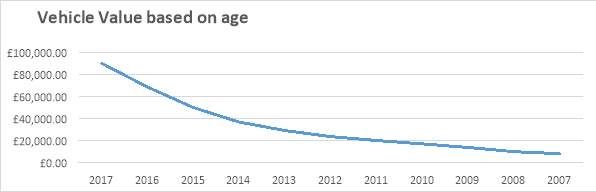
4.3 Depreciation Findings
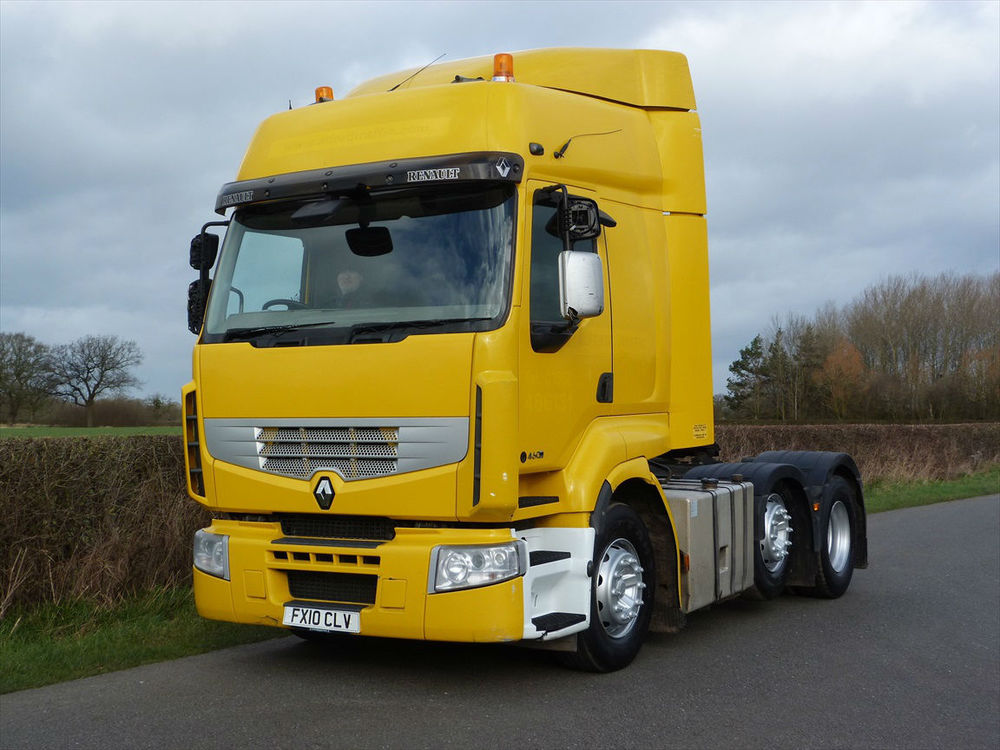
These findings were based on figures from Autotrader.co.uk, and other commercial vehicle sales websites. The figures shown below are the average prices of 6×2 460bhp articulated units. This type of unit was chosen as it is the most commonly advertised online, and will provide an accurate general overview of HGV depreciation. As shown in the fourth column, the vehicle depreciates by over 50% in its first 3 years. It is also shown that the vehicle depreciation rate decreases as the vehicle gets older. The average unit purchased new is £89000 and after the 10 Year period it becomes worth less than £8000 on average.
| 6×2 DAF XF 460 Articulated Unit | |||
| Year | Mean Book Value/Cost | Depreciation | Depreciation % |
| New | €106,082.00 | €21,470.00 | 23.88% |
| 2016 | €80,747.40 | €18,560.00 | 20.65% |
| 2015 | €58,846.60 | €13,150.00 | 14.63% |
| 2014 | €43,329.60 | €7,720.00 | 8.59% |
| 2013 | €34,220.00 | €5,500.00 | 6.12% |
| 2012 | €27,730.00 | €3,516.00 | 3.91% |
| 2011 | €23,581.12 | €3,064.00 | 3.41% |
| 2010 | €19,965.60 | €3,270.00 | 3.64% |
| 2009 | €16,107.00 | €3,798.00 | 4.22% |
| 2008 | €11,625.36 | €1,855.00 | 2.06% |
| 2007 | €0.00 | ||
| Total Depreciation | €81,903.00 | 91.10% |
[Table.4]
Below is a graph showing the relationship of the vehicles age relative to its value. The curve flattens as the vehicle gets older with the depreciation rate falling. This shows that it is most expensive to own a vehicle at the start of its life, and that the cost of depreciation gradually falls as the vehicle gets older.
[Graph.3]
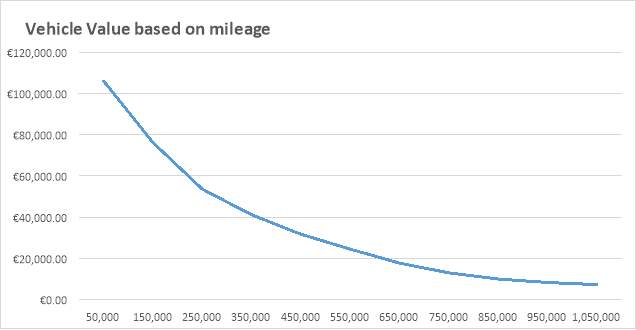
The mileage based depreciation figures for the same lorry are shown below. This also shows that a vehicle depreciates most heavily within the first 300,000km’s of its life, and it gradually falls as the vehicles mileage increases.
| 6×2 DAF XF 460 Articulated Unit | |||
| Km between | Mean Book Value/Cost | Depreciation | Depreciation % |
| 0 and 100,000 | €106,082.00 | €29,865.80 | 28.15% |
| 100,000 and 200,000 | €76,216.20 | €22,626.50 | 21.33% |
| 200,000 and 300,000 | €53,589.70 | €12,437.20 | 11.72% |
| 300,000 and 400,000 | €41,152.50 | €9,444.72 | 8.90% |
| 400,000 and 500,000 | €31,707.78 | €7,246.38 | 6.83% |
| 500,000 and 600,000 | €24,461.40 | €6,767.30 | 6.38% |
| 600000, and 700,000 | €17,694.10 | €4,747.14 | 4.47% |
| 700,000 and 800,000 | €12,946.96 | €2,973.60 | 2.80% |
| 800,000 and 900,000 | €9,973.36 | €1,694.48 | 1.60% |
| 900,000 and 1,000,000 | €8,278.88 | €1,010.08 | 0.95% |
| 1,000,000 and 1,100,000 | €0.00 | ||
| Total Depreciation | €83,740.00 |
[Table.5]
Below is a graph showing the relationship of the vehicles mileage relative to its value.
[Graph.4]
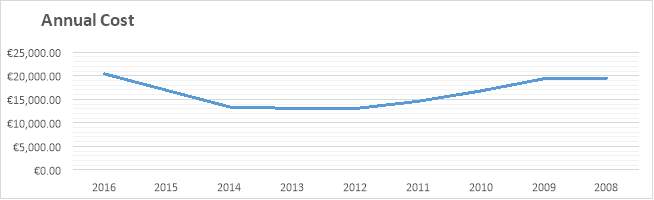
When the cost of maintenance, fuel and depreciation are added, the annual overall cost of the vehicle can be calculated. Based on the findings, a one year old articulated unit will cost the operator €20,417.97 per year. This figure gradually drops down to €13,052.36 when the vehicle reaches five years old. The cost then begins to climb back up to €19,533.82 when the vehicle reaches eight years old. This shows that the ownership of a vehicle is most expensive in its first two years, falling by roughly 25% only to rise in the later years back up 90% of the original annual cost.
| Vehicle Age | Depreciation + Running Costs |
| 2016 | €20,417.97 |
| 2015 | €16,889.31 |
| 2014 | €13,365.26 |
| 2013 | €13,077.14 |
| 2012 | €13,052.36 |
| 2011 | €14,588.44 |
| 2010 | €16,813.02 |
| 2009 | €19,391.85 |
| 2008 | €19,533.82 |
[Table.2]
[Graph.5]
5. Conclusion
The primary goal of this report is to identify a cost-effective vehicle selection model that is viable for Heavy-Vehicle operators in Ireland whilst also analysing the current methods used for vehicle acquisition and disposal. The scale of Irish road freight activity was analysed in chapter one, showing that 98% of all of the internal merchandise trade is carried on the road network. The methods in which a haulage operator may acquire a vehicle were also analysed and broken down into the various methods with their different advantages and disadvantages.
The considerations haulage operators analyse was also broken down into unit layout and vehicle weight, running costs, emissions, driver comfort and legal requirements.
The research chapter of this project fully utilized both the quantitative and qualitative data collection tools, allowing for an accurate overview of the attitudes towards vehicle acquisition and disposal within the Irish haulage industry. The research carried out on HGV depreciation rates allows for accurate figures to be obtained on the depreciation cost of a vehicle, based on its age and mileage.
The key finding of the research establishes that the majority of Irish operators do not have a set vehicle replacement strategy currently in place, and that a replacement strategy would be advantageous for any haulage operator.
The quantitative findings clearly show that the many Irish haulage operators purchase used vehicles outright, with the intention of disposing of these vehicles when they reach an age limit, or the cost of repair outweighs the cost of replacement. The findings of this project also show that the process of hire purchase and finance leasing, is being increasingly explored as an alternative method of acquiring a vehicle. It also shows that many operators have concerns regarding the costs associated with running an older vehicle.
5.1 Recommendations
Based on the quantitative and qualitative findings clearly it can be concluded majority of haulage operators do not currently have a structured method in replacing the vehicles in their fleet. The findings also show that such a structured method may be a method used to retain profits and avoid unnecessary spending on the fleet.
The data below was taken from the annual cost of the vehicle, based on depreciation and maintenance costs. It shows three various vehicle replacement time cycles:
| Replacement cycle | Total Cost | Average Annual Cost |
| A)Purchasing new and keeping for 8 years | €147,129.18 | €18,391.15 |
| B) Purchasing 3 years old and keeping for 5 years | €70,896.23 | €14,179.25 |
| C) Purchasing 6 years old, keeping for 2 years | €31,401.46 | €15,700.73 |
As highlighted in green, (B) the optimal time of the three is to purchase the vehicle when it is three years old, selling when it reaches eight years old. This would cost the operator a total of €70,896.23 in depreciation and running costs, which works out to €14,179.25. A company which purchases a vehicle new (A), with the intention of keeping for eight years would cost €147,129.18, working out to €18,319.15 per year. This works out to a saving of €4,211.90 per vehicle per annum. The bottom line (C) in the table shows a six year old unit being purchased and kept for two years. Despite the initial saving in initial cost and depreciation, the higher running costs restrict (C) from being cheaper than the cycle (B).
If a small sized haulage company operating a fleet of five HGV’s purchase 5 brand new vehicles outright, and sells eight years later, the total annual cost will be €91,955.74 for the fleet. If the same company were purchase three year old vehicles and keep for five years, the total annual cost would be €70,896.23 for the fleet. This would bring an annual saving of €21,059.50.
| Replacement cycle | Annual Cost (Fleet of 5 HGV’s) | Potential Annual Savings |
| A) Purchasing new and keeping for 8 years | €91,955.74 | €0.00 |
| B) Purchasing 3 years old and keeping for 5 years | €70,896.23 | €21,059.50 |
5.2 Limitations
Due to the highly competitive nature of the Irish haulage industry, I would recommend that a vehicle selection model is designed by the Transport Manager, which is customised to suit the vehicle cost, mileage and maintenance costs. The model outlined is specific for a haulage operator using a specific truck combination operating in specific conditions. These specifics will change depending on the nature of the haulage company and the work they carry out, but the principles of depreciation, efficiency and maintenance costs will remain.
The data gathered and analysed on decreasing fuel economy and increasing fuel costs will also change with the type of unit used and the work being carried out.
Prices in fuel will also fluctuate, as will maintenance and depreciation. This guide does not take into account costs such as driver’s wages, CVRT costs (Currently €200 per annum), Road tax and the cost of raising financial funds in order to purchase vehicles.
Appendix
Survey for General Haulage Operators:
How many vehicles are in your fleet?
- 1-10
- 11-20
- 21-50
- 51-100
- 100+
Are the majority of vehicles in your fleet?
- Bought outright
- Leased from the manufacturer
Does your company have a definitive vehicle replacement policy?
- Yes
- No
Does your company purchase new or used vehicles?
- New
- Used
When are the vehicles in the fleet replaced?
- When a certain mileage is reached
- When the vehicle reaches a certain age
- When a new model enters the market
If Mileage, What mileage is reached before a vehicle is replaced?
- Between 100,000 and 200,000km’s
- Between 200,000 and 400,000km’s
- Between 400,000 and 600,000km’s
- Between 600,000 and 800,000km’s
- Between 800,000 and 1,000,000km’s
If age, what age is reached before replacement?
- 1-2 Years Old
- 2-4 Years Old
- 4-6 Years Old
- 6-8 Years Old
- 8-10 Years Old
Please rank the following considerations in order of priority when purchasing additional vehicles
- Initial purchase price
- Fuel Economy
- Maintenance costs
- Brand Styling/Image
- Power and load capacity
- Driver Comfort
- Other (Please Specify)
References
National Institute for Transport and Logistics (2008) Freight Transport Report for the Island of Ireland. Available at: http://arrow.dit.ie/cgi/viewcontent.cgi?article=1000&context=nitlrep (Accessed: 15 February 2017).
https://www.trucklocator.co.uk/hub/search-help/axleconfiguration/
http://www.seai.ie/Your_Business/Technologies/Transport/Buying_a_Truck_Transport_Guide.pdf
https://www.nationaltransport.ie/downloads/Survey-of-Commercial-Vehicle-Freight-Manager.pdf
[Fig 1][Fig.2] National Institute for Transport and Logistics (2008) Freight Transport Report for the Island of Ireland. Available at: http://arrow.dit.ie/cgi/viewcontent.cgi?article=1000&context=nitlrep (Accessed: 15 February 2017).
[Fig.4] https://www.trucklocator.co.uk/hub/search-help/axleconfiguration/
Cite This Work
To export a reference to this article please select a referencing stye below:
Related Services
View all


Related Content
All TagsContent relating to: "Transportation"
Transportation refers to the process of goods, people or animals being moved from one place to another. There are multiple methods of transport, including train, boat, bus, plane, lorry, and more.
Related Articles
DMCA / Removal Request
If you are the original writer of this dissertation and no longer wish to have your work published on the UKDiss.com website then please: