Biofuel Production from Sugarcane and Corn
Info: 13084 words (52 pages) Dissertation
Published: 25th Jun 2021
Tagged: Energy
Contents
Chapter Two: Literature Review
Chapter Three: Lifecycle Analysis of sugarcane and corn
Lifecycle Analysis for Sugarcane
Sugar Cane Harvesting and processing
The steps and brief description of the harvesting and plantation stages.
The steps and brief description of the sugar production stages.
The steps and brief description of the ethanol production stages
Chapter Five: Comparative Analysis
Comparison in production rates
Introduction
A constant growth and interest has been diverted to the production of energy, as the use of energy is a fundamental key to everyday lives. Production of biofuels energy sources come from different feedstock’s such as sugarcane and corn and many other products however the main focus in this report is sugarcane and corn. Sugarcane is known to be grown in Brazil as they have the largest production rates in the world, exporting either sugar or biofuels to many different nations.
Brazil is centred around building up a competitive sugarcane industry and making ethanol a key variable, this has as of now been executed as ethanol has supplanted gasoline by right around 42% making gasoline a substitute fuel in the nation.[1] Brazil being the pioneer in sustainable power source have expected to roll out improvements to three variables which are to decrease oil reliance, increment energy security and add to a successful economy. Brazil being the leading nation to grow sugarcane stalks have accumulated 121, 4274 thousand tons from the harvesting season of 2016/2017, from which some are turned to sugar and other turned to ethanol depending on demand.[2]
The main reason Brazil has become the leading producers of sugarcane is to improve the economy, this was done as sector grew job availability expanded.[3] The sector growth went up annually at a rate of 10% between the years of 2005-2009 resulting in more than 100 mills being used for operational purposes. This then slowed down as global financial impact had crushed the economy with little progression this started to lift up to 3% growth annually. According to official statics from the ministry of labour and employment annual report of social information stated that the sugar cane industry in Brazil was a rise employing around figure of 1.09 million workers. As productions of sugarcane is highest in the south central regions this meant that the workers would earn more as they genuinely had a higher work load to maintain.[4]
Another reason Brazil became the leading producers of the renewable energy was to reduce harmful emissions, this has been put to practice since the production of ethanol in Brazil started in 1975 more than 600 million tons of carbon dioxide emissions have been avoided. A strategical approach in containing these emissions was the introduction of the transportation fleet where vehicles had an option in which sort of fuel they could refilled their vehicles with, many customers leaned to the sugarcane ethanol for fuel as its cheaper in price, environmental friendly, cleaner air, reduces greenhouse gases, better performance and has lower petroleum usages. On average a litre of ethanol consumed in these vehicles is equivalent to 1.7 kg in reduction in regards to carbon dioxide emitted.[5]
In addition to the following advantages mentioned the most important one is to be mentioned which is the economic impact the production of sugarcane has in Brazil. Official reports mentioned that the sugarcane industry contributes to a large total annually 86 billion US Dollars, this total benefits the general public of Brazil as this money can go towards productive and educational purposes such as schools and parks or even more farming lands which can employ many jobless people.[6]
Over the past decades starting from 1936 till 2016 the production of corn has increased in America, as demand for the renewable energy source increased.[7] Being the largest producers of corn exports of this product go to countries which may not grow it due to size, climate or even availability. America producing the largest sum of world corn consumption produced 12,360 million bushels from which a large quantity is transformed into ethanol or left as an edible product.[8] Official statistics have proven that America export the largest amount of corn to many nations at total sum of 39.8% to countries such as Japan, Mexico, Europe, South Korea, Egypt and Vietnam as well as many different countries.[9] The increase in demand has had and created a number of advantages to America such as providing a renewable energy, creating jobs, reducing environmental effects.
The advantages which prospered from producing large quantities of corn has had a positive effect on the American economy as the production of ethanol provided thousands of jobs which means the countries total revenue goes up together, statics have proved that on average ethanol industry hire up to 12000 employees with direct jobs and a grand total of 383,260 jobs which support the production of ethanol.[10]
Another advantage which stood out was the dependency of foreign oil was reduced this was an effective transition as the reduction of these foreign would only result to the use of ethanol being more environmental friendly. These reductions where calculated to be 45% less since the upcoming of the ethanol industry in America leading to using few barrels per day. In 2012 the reduction of foreign oil was at all-time low as 870,000 fewer barrels where required per day, this was estimated to fuel roughly 23.5 million cars.[11]
Also adding to the list of advantages for the production of ethanol from corn in America is the environmental effects this product carries, ethanol is a renewable fuel releasing a lower amount of carbon dioxide in the atmosphere. In addition to this the production of corn is more reliable as a form of fuel as petroleum takes millions of years to form as an oil substance.[12]
Literature Review
What is lifecycle Analysis?
Life cycle analysis which also abbreviated to LCA is a systematic approach which is recurrent in almost every industry. Life cycle analysis is an approach which looks into the life span of a product, this covers the stages of production until the end of life stages.[13] This approach was first established in the 1960s but implemented in 1963 at a world energy conference which reported the calculations of cumulative energy requirements for the production of chemical intermediates and products and ever since have been used a measuring tool to the environmental effects of a product.[14]
This approach has started to be used in many different countries as an up rise on renewable energy is visible, the dependency on petroleum and foreign oils are a decrease as renewable energy have become a substitute. Due to this factor many countries have started to produce their own crops in hopes to transform these into biofuels crops such as corn, sugarcane, soybeans and vegetable oil. All these crops can be transformed into either biodiesel or bioethanol however the production of bioethanol is greater as it contains much more benefits.
The main steps in the life cycle analysis consists of four which are the main goal and scope, inventory analysis, impact analysis and interpretation. These four steps are the outline of what life cycle analysis and how it should be implemented this is listed as such;
- Goal and Scope – for this step you have to select the product or activity which you want to run a life cycle analysis on and whether your study is for comparison or improvements.
- Inventory Analysis – this step allows you to identify all relevant input and outputs, this include energy consumptions and emission amount.
- Impact Analysis – at this stage we determine the environmental impacts which may be cause during the production.
- Interpretation – this final stage you either make improvements or judgements to assess in relation to the objectives of the study, this simply means either try to make improvements or make judgements in relation to the energy analysis of sugar cane or corn.[15]’[16]
The significance of using this method is a great deal as many either negative or positives effects of the product will be discovered. This analyst approach allows you to look into;
- The environmental effect of the product
- Positive or negative impacts of the product
- Opportunities for improvements
- Look at and break down a few procedures in view of their environmental impacts
- Make adjustments in production processes techniques
How does life cycle analysis work?
As mentioned above life cycle analysis consists of stages a product goes through before final production stages, these are separated into 5 cycles which are the acquisition of the raw material, which is then passed to processing stage, which then leads to the manufacturing sites, then the product life span stage and the final stage being the waste management stage. All these stages must be covered in order to run a life cycle analysis.
- Raw material – This stage is the harvesting and transportation stage
- Processing – which Includes processing of the material and transportation to production sites
- Manufacturing – which includes the steps in which the product is made and assembled, this includes packing and transportation (if it goes to store or home delivery)
- Product life span – which includes how much energy this product may be using, the maintenance of the product and the reuse which is when the product is refurbished and ready to use again.
- Waste management – which includes every stage until this product is either thrown away, recycled, whether it is liquid waste or gas.[17]’[18]
What are the benefits of conducting a Life Cycle Analysis (LCA)?
Life cycle analysis helps manufacturing company’s pick which product is best to use when taking into consideration the environmental effects which may occur. This systematic tool of analysis looks into much more than the environmental effects but also every aspect in which will make a product a success. The other factors which are taken into consideration cost, maintenance cost, emission. Product life span as well as performance. The benefits of using this analysis technique is that modifications can be applied where necessary. Once these steps or areas of concern are looked into these products are then ready to be released. This form of analysis is effective as it can help distinguish between two of the same products but from different feedstock’s and which one is more effective to use or more reliable to use.[19]’[20]
What are the limitations of conducting a Life Cycle Analysis (LCA)?
The benefits of conducting a life cycle analysis over weighs the limitations most of the time however different circumstances this systematic approach is not applicable as this approach is time consuming. This analysis approach is not applicable if the project is time sensitive as research and gathering data is very time consuming, data gathering is time consuming as accuracy of these figures are essential as using wrong figures will impact the final results. Another limitation which is linked to data gathering is the fact in some cases data is not accessible which defeats the purpose of using life cycle analysis.[21]’[22]
What are biofuels?
Biofuels are a form of renewable energy which have been used as a substitute for fossil fuels, biofuels are fuels which have been derived from organic matter or waste. Organic matters or better known as biomass are living particles in which are converted to fuel, these living particles are materials such as trees, crops, grass and waste.[23] From these materials the production of biofuels is formed fuels such as ethanol, biodiesel, methanol and bio-butanol. [24]
The main focus of production being ethanol which are classed as first generation biofuel. First generation biofuels are the production of ethanol from food crops, ethanol can be derived from these crops as some contain starch, sugar, animal fats and vegetable oil. The most common of food crops which are used in the production of ethanol are corn, sugarcane, soybeans, vegetable oil and other candidate crops (wheat, sugar beets, and peanuts).[25]
Corn being the primary source of the world’s ethanol production in America produced 12,360 million bushels from which more than 40 percent was turned to ethanol. The advantage of using this form of crop as a source of renewable energy is that the conversion of corn starch to ethanol is fairly simple making production easy and fast. Another advantage is that planting, harvesting and processing of the corn are already in place as farmers are already growing these crops these are then sent to mill houses that’s when the production starts. On the other hand, the disadvantages using corn is that as a large quantity are being harvested at a time that pesticides and fertilizers are a necessity, the use of the fertilizers and pesticides can contaminate the soil and water which will damage the corn. The fertilizers and pesticides used are also expensive and a large quantity is required. Another disadvantage of using corn is that food prices have increased worldwide.[26]’[27]
Sugarcane being the second in lead to the production of ethanol is produced by Brazil from where the majority of the world sugarcane comes from. Brazil produces a rough estimate of 5 billion gallons of ethanol fuel annually. The conversion of sugarcane to ethanol is easier than corn as this crop provides sugar unlike corn which provide starch. The advantages of using this crop is that whereas corn needed heating and fermentation sugarcane only needs to be fermented this makes production quicker and easier. Another advantage of using this crop is that the harmful emissions of carbon dioxide can be reduced by 90% rather than the use of gasoline. However as well as having advantages the limitations which occur from using this crop includes the cultivation regions are limited as the harvesting of this crop has many requirements the major one being a good warm climate. Another limitation in regard to the cultivation is the diseases which are found on the plant these are then sprayed with pesticides and fertilizer which damage and contaminate the plant.[28]
How are biofuels formed?
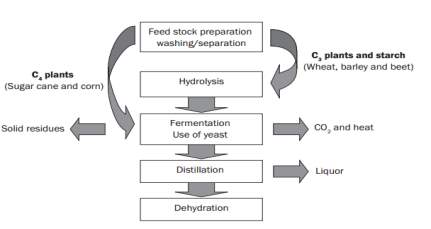
Biofuels are formed through a conversion method from where some of the food crops used are turned to sugar and other parts to ethanol an example of this is the sugarcane stalks produced by Brazil. The basic steps which are required in the conversion stages are that the biomass are broken down, which are then boiler cooked and liquefied. This is then added with enzymes and yeast which go through a fermentation stage, this then lead to the distillation stage which is then passed to the final stage. The dehydration stage producing pure ethanol that is then stored before sent out to suppliers.
The use of biofuels has increased between many nations, countries such as America and Brazil produce the largest amount ethanol from which they distribute to many other countries. The sense of producing their own biofuels gives the nation energy independence meaning not relying on other country for oil. The benefits of using biofuels have had a better impact on the environment as to the use of fossil fuels, the reduction in use of fossil fuels means the lower the amount of harmful emissions which enter the atmosphere. Other benefits in regards to the production of biofuels include the following:
- Availability of biofuels – The availability and production of biofuels is unlimited as they come from food crops. The production of biofuels is quicker and easier than fossil fuels as some fossil fuels take up to millions of years to become oil whereas biofuels go through simple stages from which either sugar or starch particle are turned into ethanol.
- Environmental Impacts – The environmental impacts which come with biofuels are friendlier compared to the affects that come with use of fossil fuels as with the use of fossil fuels harmful emissions such as hydrocarbons, carbon monoxide and carbon dioxide. Exposure of these chemical compounds can be severally dangerous and even fatal in some cases.
- Spills and Surface Contamination – The use biofuels are not 100% safe however are not as harmful as fossil fuels. Large quantities of spill could be dangerous and could kill all living organisms but exposure to bacteria and other living organisms that live in the soil and water are not exposed to this as biofuels are biological molecules which means they are biodegradable so they can use the biofuels as a source of energy.
- Greenhouse gases and global warming – the use of biofuels reduce the amount of greenhouse gases which go into the atmosphere only if they are produced the correct way. The crops used to make the ethanol use carbon dioxide and this takes the amount of carbon dioxide out of the atmosphere decreasing global warming. Global warming can also be an issue if the mills are producing ethanol in the incorrect manner and the combustion chambers let out harmful emissions.
- Energy independence – energy independence seems to be the greatest benefits as the production of ethanol makes a country more reliant on its own product rather than importing petroleum from different country. This is an economical advantage as production of ethanol can make a country the biggest distributer which increase the countries net income and expenditure lowers as they are more dependent on their own product.[29]
Disadvantages of using biofuels
As the increase of the use of biofuels have emerged there also some disadvantages when it comes to use and production of these biofuels these include the following:
- Global warming – Biofuels will contribute to the amount of global warming, the burning of biofuels will release carbon dioxide into the atmosphere which could affect the ozone layer even it’s a small amount.
- High cost – As production of ethanol has increased to maintain and produce ethanol high investments is required, this would include building mills or even for transport purposes.
- Food prices – As the production of food crops increase and are used for the production of biofuels the price in food staples could also increase as demands are high for the crops.
- Water use – Water irrigation is a key factor in regards to the growth of the food crops, as the farming fields have also increased this caused the amount of water used to increase
Which could affect the local’s water supplies.[30]
Lifecycle Analysis of sugarcane and corn
We have a clear understanding that sugar is a source in the production of ethanol, this section looks into the life cycle analysis from the two sources the sugar cane and corn. The lifecycle analysis will start from the first stages which is the harvesting process up until the disposal of the wastes remaining. The life cycle analysis of both sugar cane and corn has to be subjected to a country or continent for that reason we will be looking at sugar cane production from Brazil and corn from America.
Lifecycle Analysis for Sugarcane
Sugar Cane Harvesting and processing
The production of sugar cane has taken a vast interest to many individuals and nations however the production of sugar cane has been followed back to Brazil being the leading producing country. Brazil has become the largest producers of sugar cane, producing a round figure of exactly 666.82 million tons whereas the world production of sugar cane is at 1.6 billion tons.
A very high percentage of the sugar cane production has been located to south-central Brazil producing 90% of the countries sugar cane and the remaining 10% has been located to north-eastern Brazil. The production period for the south central fields start from April till December and the north east sugar production starts September till March. [31]
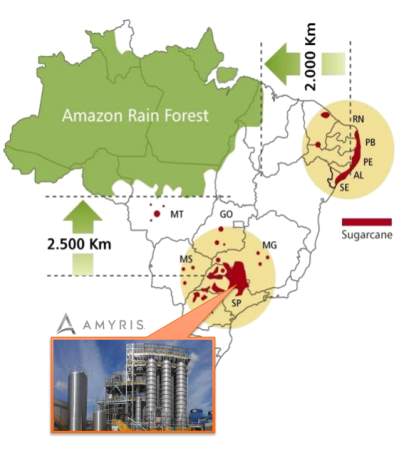
Brazilian production fields have expanded by 3% since the 1970’s as production of sugar has brought the countries revenue up. Sugar cane production in Brazil is at 8.5 million hectares this is equivalent to 2.5% of the country’s total area. As production expanded for the Brazilians, the lands which they produce on had to also expand this made the farming fields get close to the amazon rain forest an example of this is shown below.[32]’[33]
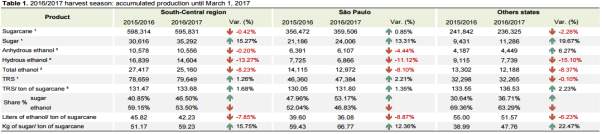
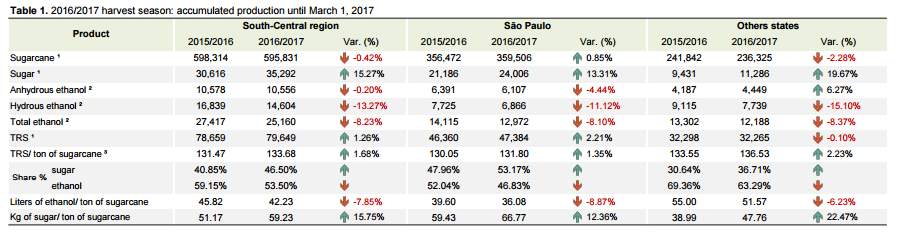
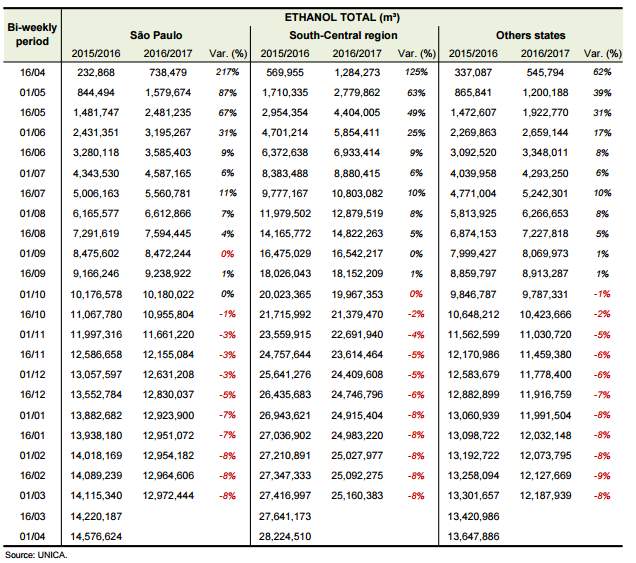
The production of sugar cane stalks has increased vastly over the year’s official Brazil statics have produced a table showing the difference between the years of 2015-2017 and how much each region produced. This table is shown below the units for this table is thousand tons.
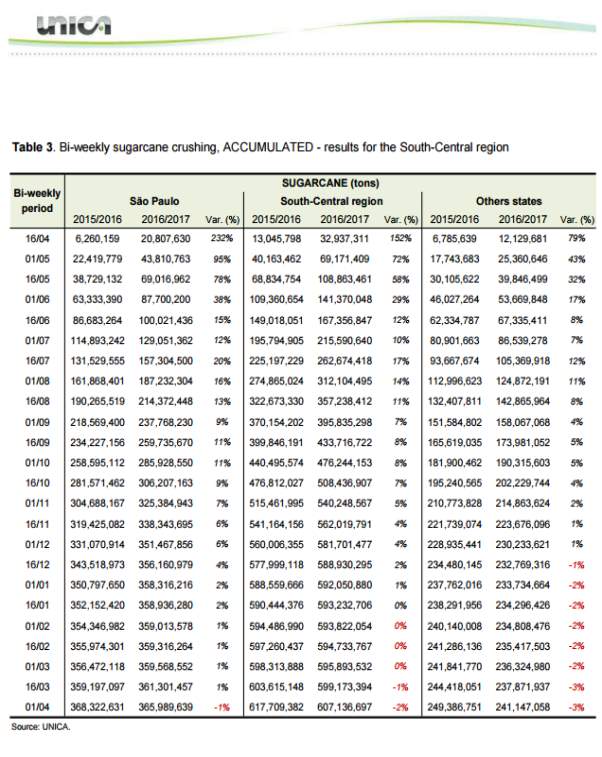
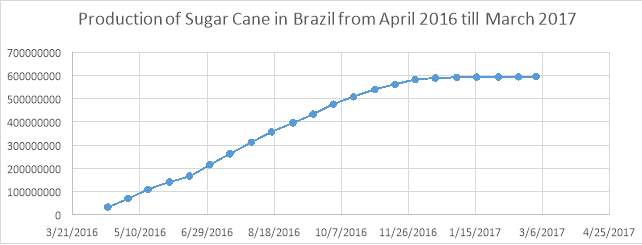
The table and graph above illustrates the difference in production rates in the years 2015/2016 and 2016/2017 from this table a judgement is made simply by looking at the figures which suggest that the production has increased. These figures emphasise the fact and importance and popularity of sugar cane in Brazil, these figures are also proof on how Brazil produce’s a majority of the world population of sugar cane.
Brazil’s productions rate for sugar cane has risen this due to Brazil being the perfect location for sugarcane cultivation as many factors fall in as an advantage for Brazil such as the amount rainfall, temperature and sunlight.
Brazil’s rainfall totals to 1100 and 1500 mm, the rain fall period is the plantation period giving the seed and soil enough water for growth. Once the rain fall season is over then coming the dry period in Brazil which is used for ripening of the sugarcane. Farmers in brazil harvest and plant sugar cane according to when the rain fall period is about to start this mainly due to the fact the watering plants will take time, money and men power. This reduces the amount of water used in the production of sugarcane.[34]
Sugar cane needs a warm climate for them to harvest and produce sugarcane, Brazils climate differs throughout year thus production is at its high in the south central region where production season starts from April till December. Other factors come into advantage to how Brazils production rate are so high, factors such the average hours of sunlight in Brazil. Brazil’s sunlight averages from 11-13 hours a day depending the time of year with this amount of sunlight this helps to produce sugar cane as the sugar cane plant is a photosynthesis plant which can take energy from the sunlight.[35]
The steps and brief description of the harvesting and plantation stages.
Sugarcane is harvested by either hand or mechanical machinery; this process consists of the spreading of the seed. However, many other techniques have been introduced like cane setts and bud chips which also being used but the first ever stages in order to grow these crops come from the seeds. The spreading of the seeds is also known as settlings; this process can be planted in either beds or polythene bags.[36] The difference between these two processes are explained below, settlings which are planted in beds oblige to be in cultivated land where as polythene bags can be placed anywhere.[37]
Another harvesting technique is known as cane setts this refers to the cutting of stems, this technique has started to be used in many countries around world. This harvesting technique consists cutting the stems which contain numeral buds however an average of three buds are planted together at once. The reason three buds are planted together is mainly due to the success of these germination, the middle bud is known to produce highest quantity of sugar cane this is due the protection which lays on each sides of the bud as the middle bud moisture is protected whereas the other two outer bud’s moisture is not protected as the nodes are still open.
Bud chips have now become a form of harvesting this process consists small stems which have one bud’s which are then placed in nursery beds. This form of harvesting has started to get the attention and popularity this is mainly due to fact that the production of good crops has been noticed when these bud chips are planted in the field amongst other sugar cane plants. This planting technique has been getting attention around world this is because when this technique is used a reduction of the amount of seeds used is minimised, this is used as a form of maximising profits with very little expenses.[38]
The processing of the sugar cane is done in two different ways one being setting the cane field alight to remove dead leaves from cane which then harvested. On the other hand, the second approach is globally safer which is the sugar cane is harvested which then only is the leaves dead or alive taken off manually. The first process sets off harmful emission into the atmosphere which destroys the ozone layer whereas the second one has no direct effect to the ozone layer. After these sugar cane stalks are harvested they are washed to remove excessive soil or rocks which are still attached, only when this stage is done do the cane stalks enter the refinery which crushes and strips the stalks which is then ready to produce sugar.[39]’[40]
Sugar production
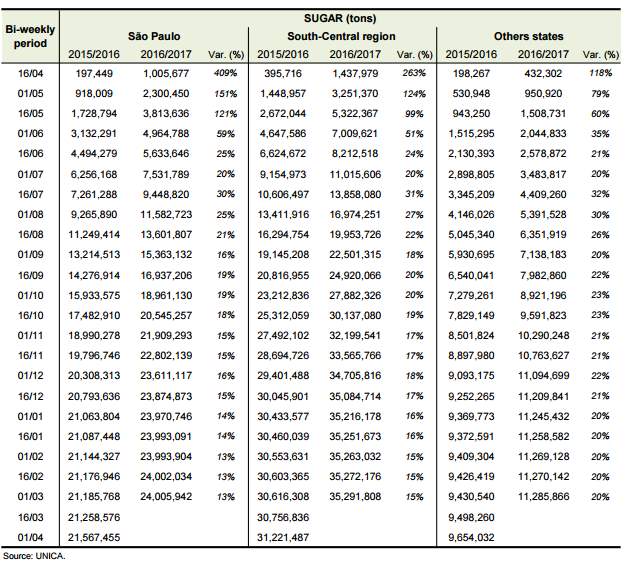
Sugar production in Brazil has become one of the country’s main source of income as production is at its peak producing a large percentage of the world’s sugar. The higher the amount of sugar cane harvested the more sugar which produced weekly. Official statics was compiled and analysed by UNICA, the Brazilian sugarcane industry association confirmed that there has been a rise in production of sugar when compared the month of March 2016 and March 2017. A rise of exactly 15.27% has been calculated by official reports which are shown below.
The table below illustrates how the two harvesting periods rotate depending on what month in the year it is, south-central brazil produces 90% of sugarcane but this harvesting period starts from April till the end of the year and currently the statistics provided from the UNICA for the month march 2017 show how Sao Paulo Brazil are producing more sugar cane than south brazil.
The steps and brief description of the sugar production stages.
The production of sugar is fairly simple to understand as every production site use the same steps required to do so, these steps start from the harvesting stages and ends with the waste stages which are left over’s from the production line.
The first stages into the production of the sugar starts from the harvesting stages which is briefly mentioned in the processing stages. The harvesting stages include both the burning of the excessive and dead leaves and the physical man power of cutting the leaves then harvesting the stalks, which is then loaded onto vans which are sent to the refinery. Once these stalks reach the refinery they are washed to remove excessive soil and rocks only for then to enter large roller mills for them to be cut into pieces or shredded before entering large roller mills for them to be crushed.
These crushed pieces let out juice which is known as raw sugar cane juice or even sucrose juice, this juice contains sugar, dirt and pieces of sugar cane pol. After this stage the mixture in the juice is added with calcium hydroxide which then only carbon dioxide is bubbled through the mixture. The calcium hydroxide is added to raise the Ph. level of the sugar. This juice then enters a filter which removes impurities which then flows to another filter that’s treats it with activated carbon. Then only is the juice sent into an evaporator to remove the liquids which allows the sugar to thicken.
This is then sent down to a boiler which then the sugar is heated the completion of this stages allows the seed crystal to be added to the sugar to aid and form sugar crystals. Sugar crystals leave us with a substance known as molasses. The last stage in the production of sugar is that the sugar crystals enter a centrifuge which gives us a raw sugar which then can be transformed into white sugar.[41]’[42]
Ethanol Production
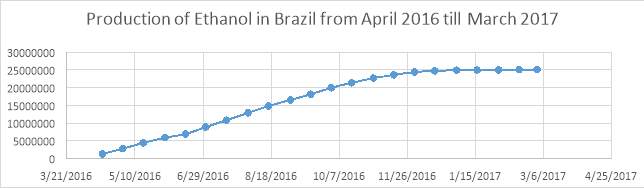
The figures shown in the table above are for the production of sugar cane and all the secondary source of energy which may come from sugar cane. These statics have been calculated for Brazil as this research is based on the sugar cane provided by Brazil. From the table above there’s a clear understanding that the production of ethanol from sugar cane has fallen by 8.23% in the month of March 2017 compared to the same month last year. This could be due many reason such as the demand of sugar may be higher than the demand of ethanol for this month. The table below shows the comparison of the production rate between the two years 2015-2016 and 2016-2017, the table below also shows how ethanol was actually produced from April 2016 to march 2017.
The steps and brief description of the ethanol production stages
From the paragraph above we have a clear understanding on how sugar is converted from sugar cane in this section we will be looking into the production of ethanol from sugar cane. The production of ethanol includes the same steps as the production of sugar however deviates towards the end where you have a choice of either sugar crystals or ethanol.
The production of ethanol includes the following steps the plantation of the sugar cane seed which is then harvested and taken to the refinery were it is washed for excessive soil and rocks. Once this process is completed it moves on the crushing or shredding of the sugar cane stalk which gives us two elements one being sucrose juice and the other being bagasse. In order to move forward to make our ethanol we need to extract sucrose from the sucrose juice as it also contains water which not needed in this case. Once this extraction is done we have a substance known as sucrose molasses which then is mixed with a form of acid that kills the remaining bacteria this is done mainly because the bacteria could turn the ethanol into yeast.[43]
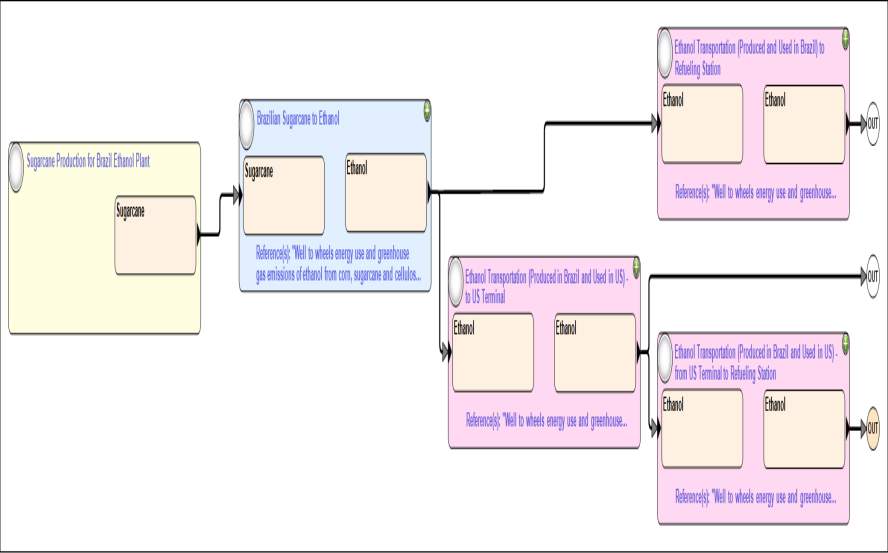
This then goes into a fermentation chamber which contains the sucrose which is shortly mixed with yeast in hopes to break down the sugar particles, this form of yeast is known as saccharomyces cerevisiae. This form of yeast main use is to ferment the sucrose into ethanol, from this fermentation chamber we produce a form of ethanol. The ethanol in this chamber contains a high percentage of water for that reason a distillation process is required to purify the ethanol by removing the remaining water. The final step of the production of ethanol contains a step know as dehydration this removes all remains of water in the substance giving us pure ethanol. The image below shows a clear structure of the process required for the production of ethanol from sugar cane.[44]’[45]
Transport
The transportation of the sugar cane is similar to most of the farmers around the world. The difference could only be the harvesting techniques stage where some sugar cane stalks are cut mechanically where as some places sugar cane stalks are cut physically. For the sugarcane that’s cut mechanically they are cut and placed into the steel/aluminium bins with the assistance of machinery’s such as the wheeled bulldozers. Whereas the ones cut physically they have to be picked up and placed into the bins.
As international sugar markets have taken a decrease in pricing the sugar industry have looked to ways to reduce expenditure. Transportation is a key factor in the production of both sugar and ethanol as they move the products from the farmers to the mills where production starts off. There are currently three methods of transportation for sugarcane which is through the truck/lorry, railway and barge.
The transportation of trucks is the most used form of transportation as it most resourceful, the use of transportation is the simplest of all as routes are already calculated on which path to take to reduce fuel costs. The use of railways as a form of transporting the sugarcane is only used when it more convenient, the railways are at times faster and cheaper to use rather than the truck. The barge is form of transportation between states this form of transportation is only used when it’s cheaper to use or when the critical path calculated suggest the barge is best form of transport for that journey.
Mathematical calculations and algorithms have been accumulated to perform equations to solve fastest routes from farms to mills where production starts, these equations have started to receive a lot of attention as the main goal is it to minimise costs of fuel and maximise the amount of sugarcane transported to the mills. These mathematical calculations known as decision calculate the critical path which works out the fastest route to use whilst keeping expenditure low.
Reference
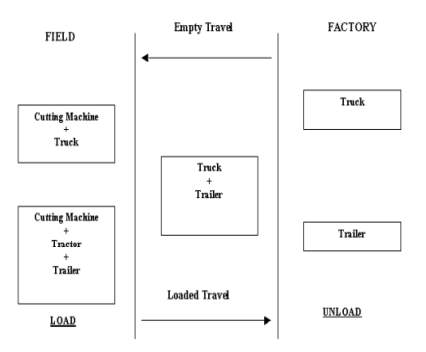
This image illustrates the route and cycle the transportation of the sugarcane industry in Cuba are accustomed by. This systematic approach was invented so that time can be utilized properly, this is shown in the image as it shows a truck leaves the field to the mill whilst the other truck that unloading is finishing up another truck goes back to the field to load more sugarcane stalks. This was set out like this so that no time is wasted for trucks to come back the farms to load again as there are already standby trucks waiting. However, depending on situation uncontrollable and controllable factors may arise at any time these include uncontrollable factors such as break downs and mechanical faults. Controllable factors which may arise include entry into the fields may not accessible as blockage from a tractor this is a situation which can be dealt with without going through a hassle.[47]
Use
Sugar cane has many different uses from it being a source for sweeteners too having benefits for both the skin and health. Sugar cane has become a main ingredient in many different types of fields and industries such as skin care, alcohol, bio-plastics, tobacco, ethanol and fertilizers. [48]
Sugar cane has been used a form of sweetener for over many years, the use of this type of sugar are in all types of food as it’s known for its texture and flavour. The use of sugar cane in food has expanded this is mainly due to the fact that it retains moisture and preserves freshness.[49]
Sugar cane has been found to be basis and final results in many government officials debates in order to create a healthier and cleaner planet, this is mainly done as sugar cane has been replaced with many harmful sources to ozone layer. The use of sugar cane as source for ethanol has had a reduction in greenhouse gases, sugar cane ethanol has reduced greenhouse gases by an average of 90% compared to gasoline.[50]
In regards to the skin and health uses of sugar cane, sugar cane has been included into the ingredients of many products as it contains a number of chemical compounds such as carbohydrates, protein’s, calcium, vitamins A, B and C. Due to the number of chemicals compounds it has been found that the uses of sugar cane have expanded in the health and skin industries as they have been included in many products which are listed below as such;
- Fat burning supplements
- Cancer fighting herbs
- Vitamin E foods
- Increases metabolism naturally
- Black head removal
- Eliminate dark spots[51]
Waste
As sugarcane productions increased the amount of remains of the sugarcane stalk also increased. These remains are known as bagasse, have two purposes which are the use energy purposes and non-energy uses. For every tonne of sugarcane produced 0.3 tonne of this becomes bagasse from which some are burned to form electrical power. Bagasse has a wide range of uses from edible purposes to the conversion of electrical power.
The production of sugarcane stalk has two main purposes which the production of sugar and production of ethanol however from the sugarcane stalk waste substances are left behind which are used to make many other products such as alcoholic beverages as well as Indian sweets. The traditional Brazil beverage cachaça known as the white rum is the most consumed alcoholic beverage in the world. A fairly popular sweet is produced from the remains which is known as rapadura which is sold throughout Asia.
The remains of the sugarcane stalk have also been used for energy purposes such as being burned for electrical usages through the mills. These remains came in handy as paying for these from other companies could be expensive and this maximises profit as income would not be leaving the company as its very own product is being used. Other benefits which came from the usage of bagasse are stated as such:
- Energy which generated from the usage of bagasse has become a second business to many farmers as the sugarcane industry become more competitive.
- All the electrical equipment required to process the sugarcane can be fuelled from the energy bagasse provides.
- Electrical energy can be sold to many competitors as the bagasse provides surplus electricity.
- The usage of the bagasse can fuel the boilers in which the fermentation stages happen.
- The remains of the sugarcane are used to feed the livestock’s.
- The increase in the pricing of electricity the usage of cogeneration in bagasse has become more attractive.[52]
Lifecycle Analysis for Corn
Corn cultivation
Corn is known to grow best in warm climates conditions, many countries have taken up the production of corn to be the main source of income however America has dominated that trade producing a large percentage of the world’s corn. Official statics provided from national corn growers association have produced a sum of how much corn is produced throughout the world which comes to a total of 40,429 million bushels. From this sum the largest producers in the world where America producing 12,360 million bushels, the production of corn has expanded in America and the demand for corn has increased this is due to it being a source of energy.[53]
The harvesting stages of corn can be achieved both mechanically and physically, this process consists of first checking the soil to see plantation can be carried out. The soil required must be fertile, deep and drained soils.
Ethanol production
The production of corn has been given a great amount of attention as corn can be used as a form of biofuels to be more precise, the production of ethanol from corn. The growth in this industry is expanding rapidly and America being the largest nation growing corn have been also being producing these biofuels.
The production of ethanol starts from when the corn is harvested which is then transported to the mills in which the transformation of the sustainable, affordable and environmentally friendly energy source is produced. The first stages of this process is known as corn storage, this stage consists of a test to see if the corn is ready and healthy for the process to continue. This is known as a corn moisture content test if the desired moisture content is found this dropped onto a conveyer belt which delivers to the hammer mill. The corn passes through the hammer mill which grinds it to a powdery substance known as meal, this powder like substance contains starch which is then added with enzymes to break down the starch to sugar. The next stage is the jet cooking which consists of mixing the meal with water and alpha-amylase which then passed through the jet cooker where the starch particles are liquefied, heat is also applied to enhance liquid faction these high temperatures are used to eliminate bacteria’s. Once this stage is complete the next stage is fermentation where yeast is added to the substance to ferment the glucose to ethanol and carbon dioxide, this process takes up to 48 hours to complete. The next stage is distillation process where the fermented substance known as mash or beer contains roughly up to 15% ethanol and non-fermentable residues and yeast which is then passed through a distillation column where the ethanol is separated from the solid residues and water leaving only ethanol. The unfermented residues called stillage are collect then passed to the centrifuge separating the solids and liquids, the solids known as wet grains are further dried which are then sold as animal feeds. The final stage of the ethanol goes through a molecular sieve where the remaining water is removed leaving ethanol at a level known as 200 proof which is pure ethanol.[54]’[55]
Transport
As production of the corn industry takes a huge rise the transportation becomes a fundamental key to maintain as no transportation would equal to no production of ethanol or any other product in that case. America being the leading nation in regards to production of corn have tried to maintain their form of transport by not only relying on one source of transportation, the product has been transported in four forms in trucks, barge, ocean and even rail.
The trucks being the primary source of transportation in America for the farmers to move corn the mills where production starts of either corn or ethanol, this is the primary form of transportation as it is the most cost effective form of transport. Another transportation form known as barge is a flat bottom boat which transports heavy goods through rivers and canals, this transportation form is most effective when large quantities of corn are being transported from one state to another between America.
Barge
The ocean has also become a form of transportation as America exports corn to many different nations the leading two being Mexico and Japan, these export products go through the Mississippi gulf to reach Japan. The final form of transportation is via rail where products get transported on trailers which are connected to train heads, these trailers are then connected to truck heads to deliver the product.[56]
Methodology
Lifecycle analysis is a systematic approach which used to investigate the stages throughout a products life, starting from the raw material acquisition to the recycling stages. The purpose of conducting a life cycle analysis in this case is to differentiate which source (corn, sugarcane) is a better platform for the production ethanol. Life cycle analysis studies all stages of a product from raw material acquisition, processing stages, manufacturing techniques, product life span, waste and recycling strategies. All these stages are required to run an analysis as all these stages have some sort of inputs and outputs such in the fermentation chambers sugarcane stalks are mixed with hot water to extract sucrose, so the input was the water and output was the sucrose. The importance of covering all stages can differentiate which product is better to use as positive and negative factors will arise from this.
This approach has been established in many different industries as this technique is used on many products as the four steps required can outline whether a product is a success or if further works are required. The four steps are goal and scope of the product, inventory analysis, impact analysis and interpretation, these steps are firstly required when running this form of analysis as they outline what your analysis is based on. So the goal and scope is what your trying to understand from the product once this is main point inventory analysis is up next which is where all the inputs and outputs of the products are listed. This then moves onto to the impact analysis where all emissions released are calculated which is then interpreted to make a final judgement on whether improvements are needed or if the product stays the same.
The advantages of running a life cycle analysis is that data required from the products are accessible whether it’s on the internet or in books. Another advantage on of conducting a lifecycle analysis is that a comparative analysis can be done in all stages in this case. Another advantage of using lifecycle analysis is that there’s always room for improvements.
The limitations of using this form of analysis is that its time consuming so if this was a last resort and needed to be done in a short period it would not be possible, as data needs to be obtained. Another disadvantage is obtaining of data as some may not be released or even published in some cases making the life cycle analysis void due to not having data.
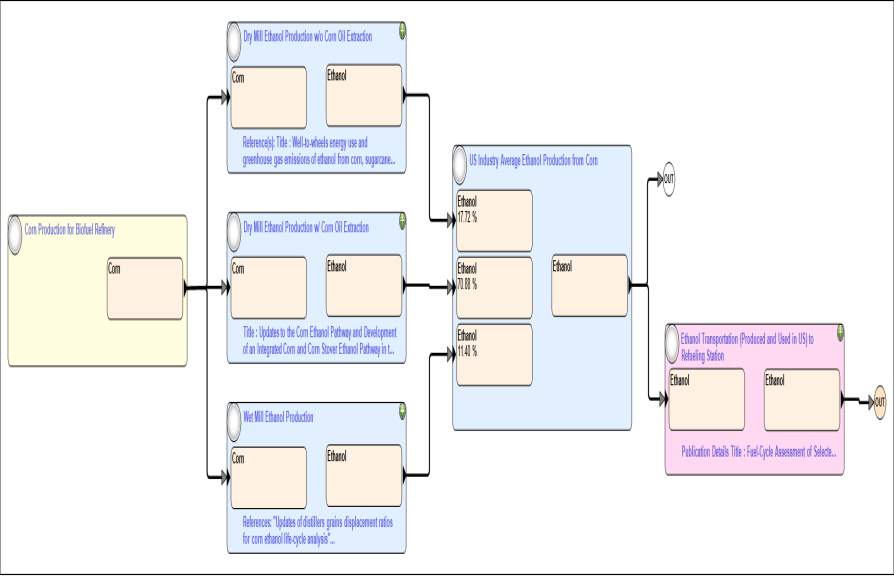
Another approach which was used to evaluate the inputs and outputs of the production of ethanol was a program called GREET which is abbreviated for greenhouse gases regulated emissions and energy use in transportation. This programme was made by Keith Cronin with help from Dane McFarlane and GREET development team, this project was over looked and founded by the Argonne National Laboratory since 2010. This programme analysis’s over 100 fuel paths from a variety of different feedstock’s in this case two path ways one for ethanol from corn and the other ethanol from sugarcane.
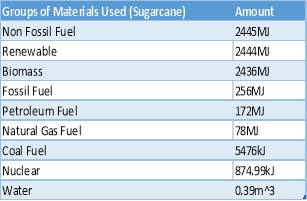
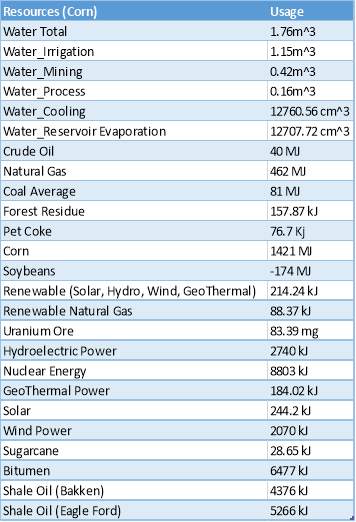
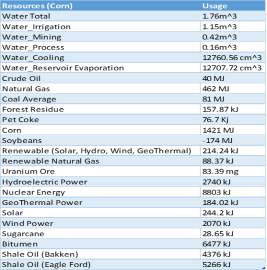
GREET provides the data required to construct a lifecycle analysis which from their comparison and conclusion can be made. GREET provides calculations for ethanol from pumps which are produced from different feedstock’s. In this case GREET was used to calculate all the inputs and outputs used to form ethanol, inputs such as materials and resources used and outputs such as emissions released. Materials such as non-fossil fuels, renewable energy, and biomass and fossil fuels usages are calculated this is done for both source which are then compared. Resources such as how much water, solar energy, sugarcane or corn is needed to produce ethanol. Harmful emissions such as the total carbon dioxide, carbon monoxide and sulphur dioxide are also calculated and from all this analysis a conclusion can be formed to as which source is best to use.
Results
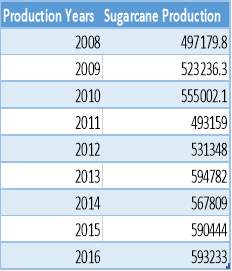
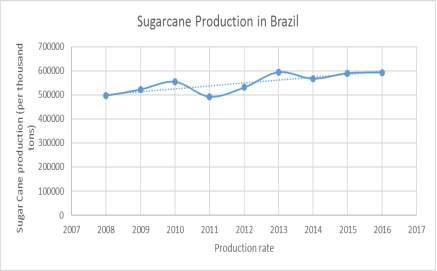
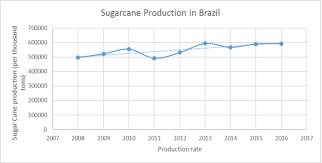
The graph above indicates the growth in production of sugarcane in Brazil, from this it is clearly visible that production increased over the years. This could be due to many reasons but the main two being demand for sugar has increased as well as demand for bio-ethanol. The trend line in the graph above specifies what a steady production would look like however from the graph above production rises which then drops at one point then steadily pick up again. This decline in production could be due few reasons such as production expanding, as production expanded sugarcane fields also increased and to maintain hundred thousand sugarcane stalks at a time is difficult with all the fertilizers and pesticides needed to reduce deceases. Without these fertilizers and pesticides being used in the production of sugarcane plants can initially die and be ruined, not being able to use them for any purpose.
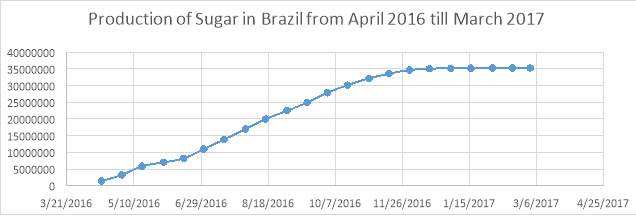
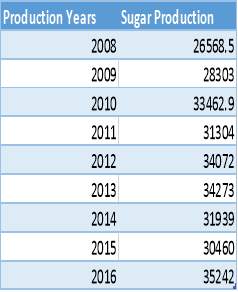
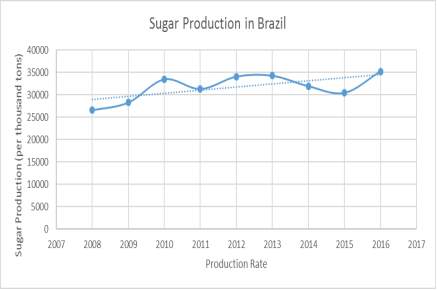
From the production of sugarcane two variables can be derived one being ethanol production and sugar production, the graph above illustrates how production of sugar either increased or decreased. However, it is visible that as production of the sugarcane expanded in Brazil the demand for sugar crystals also increased. From looking at graph it clearly stands out that production of sugar has increased throughout the years except in the 2011 and 2015. From the previous graph production of sugarcane decreased also in the year 2011 leading to the production of sugar to also be low.On the other hand, the production of sugarcane in 2015 increased which should initially mean that production of sugar should also increase but in this case only reasonable suggestion is that production sugar decreased as demand for biofuels where higher than demand for sugar in 2015. The trend line included in the graph shows what a steady increase in sugar production would look like but as sugar comes from sugarcane which also provides bio-ethanol this trend line would not be applicable as demands for both sugar and bio-ethanol change each year.
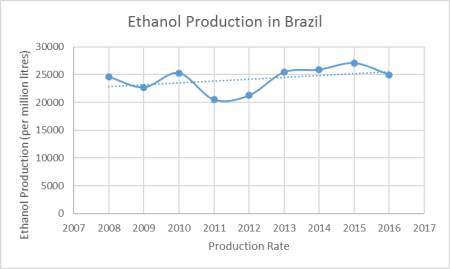
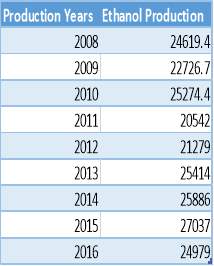
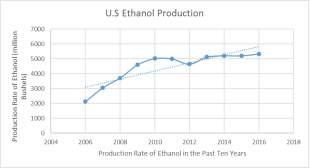
As an increase of sugarcane production in Brazil is visible the production of ethanol also increased. The likes of fossil fuels have started to be substituted with renewable energy source such as bio-ethanol and bio-diesel, however this report looks into bio-ethanol. From the graph above we see that production of ethanol over the past ten years has not been a steady increase rather it varies in different years as production is high in 2010 but decreases in 2011. From this graph produced its clearly visible to see what years production increased and decreased but as mentioned before 2011 is an anomaly as production of sugarcane stalks where low which also means production of both sugar and ethanol would be low. The production of ethanol and sugar differed in years depending on demand an example of this is in 2016 the demand for sugar was higher than the production of ethanol, this is visible on both graphs as the production of sugar in 2016 increased the production of ethanol decreased. A trend line has been added to this graph to see a steady slope in increased however this is not applicable in this case as demand varieties between years.
Corn
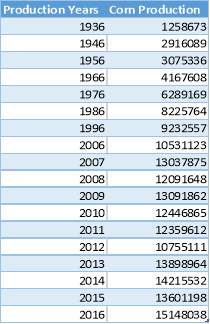
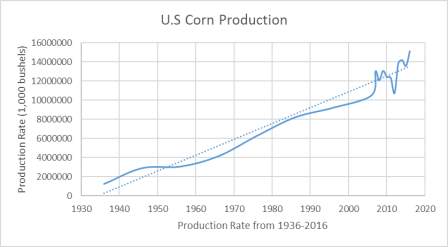
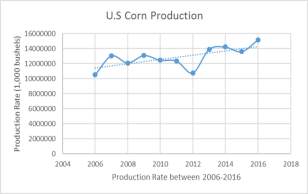
The production of corn started to increase in the early 1900 and ever since production has continued as America is the largest producers of corn in the world. For analysis purposes a second graph has been produced showing the production rate over a period of 10 years.

The production of corn has increased as demand for this product is high for various purposes from corn being an edible source to corn also being a producer of renewable energy. From the graph it is clearly visible that production increased except the anomaly which appeared during 2012 where production was at an all-time low. This could be due many factors such as climate change, climate change is linked to the growth of a crop as low rainfall will account to the crop and soil not being watered meaning the crop may die. Another factor which may occur that may have also caused this anomaly is the fact that with increase in demand of the product the farming fields also expand, this expansion could mean some crops did not receive the attention needed for them to grow properly (not being watered, fertilizers, pesticides).
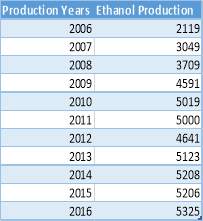
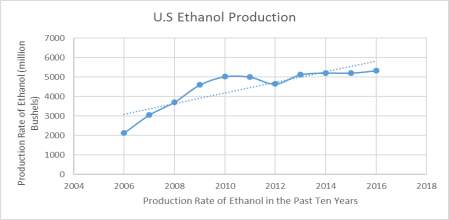
The graph above shows the production rate of ethanol made in America from corn. Corn initially started being produced for edible purposes but has now also been used for ethanol production. The graph above is a clear indication that the production of ethanol has increased within America the anomaly is in the year 2012 where production decreased either because of demand of corn being high as a form of an edible substance or that production errors may have occurred such as crops dying. The trend line include shows an average increase should look like from the figures produced however this is not applicable in this case as the production of ethanol works on demand, an example of this is shown in the table above it states that in 2009 ethanol produced from corn was at 4591 whereas the following year there was a significant increase where production was at 5019. This increase is roughly about 500 more than the previous year whereas the gap in other years where less than 150. The production of ethanol cannot be assumed or worked out as an average as it works on demand rather than a fixed production rate.
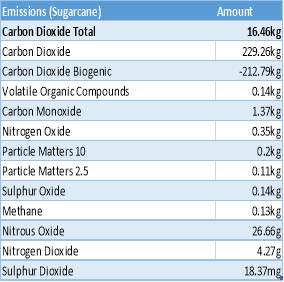
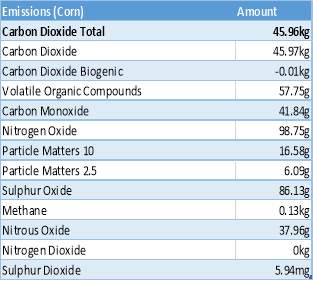
Analysis and suggestions can be done from using the GREET data base which calculates how much emissions released, as well as how many resource’s and materials are used. The emissions which are calculated are for per mega-joule of ethanol, so per mega-joule of ethanol used 15.6g of carbon dioxide is released into the atmosphere.

Comparative Analysis
As demand in the ethanol industry increased productions of first generation biofuels also increased but specifically sugarcane and corn productions. Production of these sources have been used to produce ethanol, which have been linked to various different countries but the leading two being Brazil, and America. Although the products differ (corn, sugarcane) they produce ethanol, in this section of the report a comparative analysis will be discussed to see which product produces a more environmental friendly form ethanol. In order to construct a comparative analysis on which source of ethanol is better to use we must look into a few points such as availability, production rate, materials used, resources used and emissions released.
Comparison in production rates
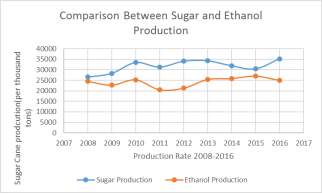
Part of running a life cycle analysis data is required to investigate production rate, data for production rate of corn was produced by the national corn growers’ association’s and sugarcane was produced UNICA with assistance from many Brazilian organisations. From the graphs the increase in sugarcane production is visible excluding the anomaly in 2011, production rate could have increased this could be due two reasons one being demand for sugar increased or demand for ethanol increased. Brazil is one of the largest producers of sugarcane which exports over 40% to many different countries including the largest dependants to Brazilian sugars which are Russia, India, Iran and the United Arab Emirates as well as many other countries where export values are significantly high. Official statistics states that production of Brazilian sugar exports two thirds of production. On the other hand, the production of ethanol is also produced from Brazilian sugarcane however production of ethanol is not as high as many countries are more dependant to sugar rather than the ethanol. The graph illustrates the difference between sugar and ethanol production in Brazil this graph indicates that the production of sugar is more important to Brazil rather than ethanol as demand for this is not as high.
The production of corn increased as use the renewable energy was replacing the use of fossil fuels. Corn being a source of ethanol has received a lot of attention as demand for ethanol was being directed from corn rather than sugarcane. This is due to fact that use of sugarcane was being used for sugar whereas corn was being used for ethanol. Corn was being used for the use of ethanol as production rates for corn where much higher than the production rate of sugarcane. This could be due to many reasons such as more farming fields, climate differences, demand of ethanol rather than corn or the main factor being that ethanol derived from corn is more effective and environmentally friendlier than one produced from sugarcane this statement can only be justified once the lifecycle analysis is complete. The production of ethanol is mainly linked to America as the graph [Figure] indicates how much is produced annually just from looking at the graph only in 2016 over 5000 million bushels of ethanol has been produced whereas brazil only produced about 25000 thousand tons this backs up the point that America is the main producers of ethanol but does not answer the question why? To answer this question a further investigation is needed as to how much materials each product use to form ethanol, how much resources are needed and how much emissions each sources release.
Comparisons on materials used
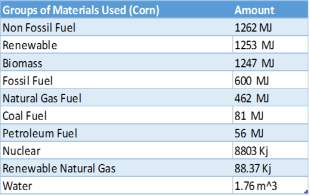
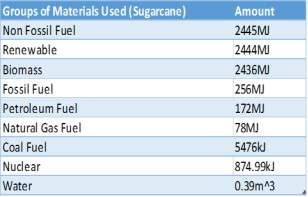
From looking at the two tables a simple judgement and predication can be made to which source is provides the best and most effective form of ethanol as the figures provided are significantly different. The use of ethanol from sugarcane use many materials in the conversion process some more harmful than others, materials such as fossil fuels are used in the conversion stages which contribute to a great amount of harmful emissions which destroy the ozone layer. Although the use of fossil fuels is higher in the conversion of ethanol from corn rather than sugarcane, sugarcane uses a larger amount of different materials such as more renewable energy, biomass and non-fossil fuel particles. These materials mentioned contribute to global warming as the burning of biomass released carbon dioxide into the atmosphere which has a negative effect on the ozone layer. From looking at this table many would make the judgement that the use of sugarcane is a more effective tool to use rather corn as sugarcane has a lower figure in some of the materials used such as water, fossil fuel as well as natural gases which are used in the fermentation chambers. For this main reason further analysis required to see what and how many other resources are required in the transformation section.
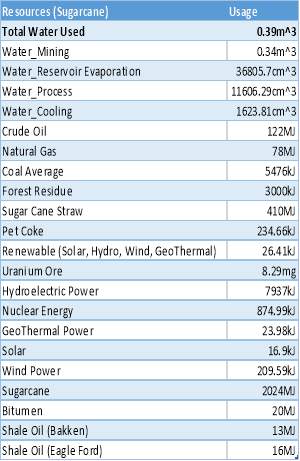
Comparison of resources used
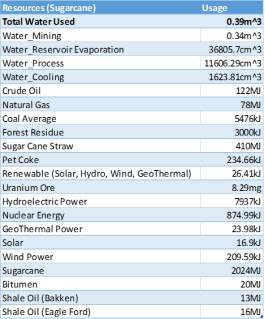
Whilst running a comparative analysis the resources used must be added as it contains inputs used to form ethanol. Resource’s used include total water used this includes all the water used from the beginning of the conversion stages to the final stage which is the pure ethanol. Resources include how much sugarcane or corn ethanol contains. From looking at the tables just by comparing the figures provided sugarcane looks like it’s the best source to use as corn needs more water as corn needs to be water which calculated where as Brazil rely on the rainfall to minimise the use of water hence why total water is higher for corn rather than sugarcane. However, in the production of sugarcane and corn solar energy is a key factor as the sun is needed to harvest and grow these plants, especially sugarcane being a photosynthesis plant but according to data provided corn needs more sunlight for the crop to grow. To form ethanol from corn also requires more resources than sugarcane, this is shown in the table below as to produce ethanol from corn sugarcane stalks are required. In reverse to this statement corn is not needed in the production of ethanol from sugarcane.
Comparison between emissions
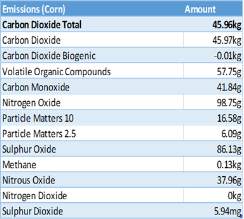
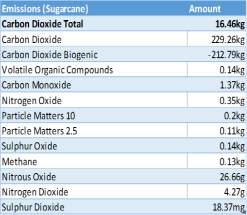
The purpose of doing a lifecycle analysis was to investigate which source would be most environmentally friendly, in this section of the discussion emissions from ethanol have been calculated from both sources. The use of ethanol was reducing harmful emissions as much as possible carbon dioxide being the key factor however the use of ethanol contains traces of carbon dioxide but not as much as fossil fuels would have. The table provided shows how many chemical compounds are used and once again sugarcanes total carbon dioxide figures are better than corn. The only figure which stands out in the sugarcane emissions is sulphur dioxide. Although sulphur dioxide figures are high emissions produced from sugarcane look better than corn.
[1] Kutas, Geraldine, and Leticia Phillips. “Brazil’s Diverse Energy Matrix — Sugarcane.Org”. Sugarcane.org. Web. 20 Apr. 2017
[2] Sugarcane Harvest Update in South-Central Brazil For The Second Half Of March 2017 — Sugarcane.Org”. Sugarcane.org. N.p., 2017. Web. 20 Apr. 2017.
[3] Kutas, Geraldine, and Leticia Phillips. “Sugarcane Benefits — Sugarcane.Org”. Sugarcane.org. Web. 20 Apr. 2017.
[4] Kutas, Geraldine, and Leticia Phillips. “Impact on Brazil’s Economy — Sugarcane.Org”. Sugarcane.org. N.p., 2017. Web. 20 Apr. 2017.
[5] Kutas, Geraldine, and Leticia Phillips. “Reduced Emissions — Sugarcane.Org”. Sugarcane.org. Web. 20 Apr. 2017.
[6] Kutas, Geraldine, and Leticia Phillips. “Impact on Brazil’s Economy — Sugarcane.Org”. Sugarcane.org. N.p., 2017. Web. 20 Apr. 2017
[7] “World of Corn 2017”. Worldofcorn.com. N.p., 2017. Web. 20 Apr. 2017. (u.s corn production)
[8] “World of Corn 2017”. Worldofcorn.com. N.p., 2017. Web. 20 Apr. 2017. (world corn production)
[9] “World of Corn 2017”. Worldofcorn.com. N.p., 2017. Web. 20 Apr. 2017.(world corn export)
[10] Fuelling the Future. 1st ed. National Corn Growers Associations, 2015. Web. 21 Apr. 2017.
[11] Fuelling the Future. 1st ed. National Corn Growers Associations, 2015. Web. 21 Apr. 2017.
[12] Fuelling the Future. 1st ed. National Corn Growers Associations, 2015. Web. 21 Apr. 2017.
[13] Williams, Aida Sefic. “Life Cycle Analysis: A Step by Step Approach”. Hdl.handle.net. N.p., 2009. Web. 21 Apr. 2017.
[14] Vigon, B.W et al. “Life-Cycle Assessment Inventory Guidelines and Principles”. Web.
[15] U.S. Environmental Protection Agency and Science Applications International Corporation”. Life-Cycle Assessment 101 (2001): n. pag. Web. 21 Apr. 2017.
[16] Williams, Aida Sefic. “Life Cycle Analysis: A Step by Step Approach”. Hdl.handle.net. N.p., 2009. Web. 21 Apr. 2017.
[17] Life-Cycle Assessment (LCA) What It Is How To Perform One. 1st ed. Dartmouth University. Web. 21 Apr. 2017.
[18] Williams, Aida Sefic. “Life Cycle Analysis: A Step by Step Approach”. Hdl.handle.net. N.p., 2009. Web. 21 Apr. 2017.
[19] Williams, Aida Sefic. “Life Cycle Analysis: A Step by Step Approach”. Hdl.handle.net. N.p., 2009. Web. 21 Apr. 2017.
[20] U.S. Environmental Protection Agency and Science Applications International Corporation”. Life-Cycle Assessment 101 (2001): n. pag. Web. 21 Apr. 2017.
[21] Williams, Aida Sefic. “Life Cycle Analysis: A Step by Step Approach”. Hdl.handle.net. N.p., 2009. Web. 21 Apr. 2017
[22] U.S. Environmental Protection Agency and Science Applications International Corporation”. Life-Cycle Assessment 101 (2001): n. pag. Web. 21 Apr. 2017
[23] “What Are Biofuels? | Biofuels”. Learnbiofuels.org. Web. 20 Apr. 2017.
[24] “Biofuels – Biofuel Information – Guide to Biofuels”. Biofuel.org.uk. Web. 20 Apr. 2017.
[25] “Biofuels – First Generation Biofuels”. Biofuel.org.uk. Web. 20 Apr. 2017.
[26] “World of Corn 2017”. Worldofcorn.com. Web. 20 Apr. 2017.
[27] “Biofuels – First Generation Biofuels”. Biofuel.org.uk. Web. 20 Apr. 2017.
[28] “Biofuels – First Generation Biofuels”. Biofuel.org.uk. Web. 20 Apr. 2017.
[29] “Biofuels – Advantages of Biofuels”. Biofuel.org.uk. Web. 20 Apr. 2017.
[30] “Biofuels – Disadvantages of Biofuels”. Biofuel.org.uk. Web. 20 Apr. 2017.
[31] Kutas, Geraldine, and Leticia Phillips. “Preserving Biodiversity and Protecting Precious Resources — Sugarcane.Org”. Sugarcane.org. Web. 21 Apr. 2017.
[32] Brazilian Sugarcane. 1st ed. Amyris Biotechnologies, 2013. Web. 21 Apr. 2017.
[33] Outlook for the Brazilian Sugarcane Industry: Time to Raise Some Cane. 1st ed. Amyris Biotechnologies, 2011. Web. 21 Apr. 2017.
[34] “Sugarcane”. Sugarcanecrops.com. Web. 21 Apr. 2017.
[35] “Sugarcane”. Sugarcanecrops.com. Web. 21 Apr. 2017.
[36] http://www.sugarcanecrops.com/agronomic_practices/planting_material/ (Accessed: 19 February 2017).
[37] http://www.nijalingappasugar.com/PolybagTechnology.pdf (Accessed: 19 February 2017).
[38] http://www.sugarcanecrops.com/agronomic_practices/planting_material/ (Accessed: 19 February 2017
[39] How sugar is made – manufacture, used, processing, parts, components, composition, steps, product (no date) Available at: http://www.madehow.com/Volume-1/Sugar.html (Accessed: 19 February 2017).
[40] How is cane sugar processed? (2011) Available at: https://www.youtube.com/watch?v=vCLEYmugfDw (Accessed: 19 February 2017).
[41] Imperial Sugar (2015) how cane sugar is made. Available at: https://www.youtube.com/watch?v=EP_fgp7zYKk (Accessed: 19 February 2017).
[42] How is cane sugar processed? (2011) Available at: https://www.youtube.com/watch?v=vCLEYmugfDw (Accessed: 19 February 2017).
[43] Sweeter Alternative (2010) Ch. 6 – making ethanol from sugarcane. Available at: https://www.youtube.com/watch?v=XgbOy0JVw64 (Accessed: 19 February 2017).
[44] Let’s learn science (2011) 8. Production of ethanol from sugar cane (HSC chemistry). Available at: https://www.youtube.com/watch?v=y8UrDvLBsJw (Accessed: 19 February 2017)
[45] Clifford, C.B., Research, S., Institute, E. and State, T.P. (2016) 7.2 sugarcane ethanol production. Available at: https://www.e-education.psu.edu/egee439/node/647 (Accessed: 19 February 2017).
[46] Zuurbier, P. and Van de Vooren, J. (2008) Sugar Cane Ethanol. Available at: http://sugarcane.org/resource-library/studies/Wageningen.pdf (Accessed: 19 February 2017).
[47] SIMULATION AND OPTIMIZATION OF SUGAR CANE TRANSPORTATION IN HARVEST SEASON
In-text: (“SIMULATION AND OPTIMIZATION OF SUGAR CANE TRANSPORTATION IN HARVEST SEASON”)
Your Bibliography: “SIMULATION AND OPTIMIZATION OF SUGAR CANE TRANSPORTATION IN HARVEST SEASON”. N.p., 2000. Web. 19 Apr. 2017.
[48] Timmons, B. (2010) Uses of sugarcane. Available at: https://www.leaf.tv/articles/uses-of-sugarcane/ (Accessed: 19 February 2017).
[49] Sugar, I. (2012) Imperial sugar products. Available at: http://www.imperialsugar.com/sugar-products/ (Accessed: 19 February 2017).
[50] Greenhouse gas reductions — sugarCane.org (no date) Available at: http://sugarcane.org/sugarcane-benefits/greenhouse-gas-reductions (Accessed: 19 February 2017).
[51] Incnut and Choudhary, T. (2016) Top 23 benefits of sugarcane juice (Ganne Ka Ras) for skin and health. Available at: http://www.stylecraze.com/articles/benefits-of-sugarcane-juice-for-skin-hair-and-health/ (Accessed: 19 February 2017).
[52] BRAZILIAN SUGARCANE BAGASSE: ENERGY AND NON-ENERGY CONSUMPTION
In-text: (“Brazilian Sugarcane Bagasse: Energy And Non-Energy Consumption”)
Your Bibliography: “Brazilian Sugarcane Bagasse: Energy and Non-Energy Consumption”. Ac.els-cdn.com. N.p., 2012. Web. 19 Apr. 2017.
[53] World Corn Consumption. 1st ed. National Corn Growers Association, 2017. Web. 23 Apr. 2017.
[54] Grewell, David. “Research: Biofuels”. Dgrewell.public.iastate.edu. Web. 23 Apr. 2017.
[55] Dutton, John A. “7.3.2 How Corn Is Processed to Make Ethanol | EGEE 439:”. E-education.psu.edu. Web. 23 Apr. 2017.
[56] Denicoff, Marina R, Marvin E Prater, and Pierre Bahizi. Corn Transportation Profile. 1st ed. United States Department of Agriculture, 2014. Web. 23 Apr. 2017.
Cite This Work
To export a reference to this article please select a referencing stye below:
Related Services
View all


Related Content
All TagsContent relating to: "Energy"
Energy regards the power derived from a fuel source such as electricity or gas that can do work such as provide light or heat. Energy sources can be non-renewable such as fossil fuels or nuclear, or renewable such as solar, wind, hydro or geothermal. Renewable energies are also known as green energy with reference to the environmental benefits they provide.
Related Articles
DMCA / Removal Request
If you are the original writer of this dissertation and no longer wish to have your work published on the UKDiss.com website then please: