Failure of Critical Infrastructure: Black Swans and Stress Tests
Info: 20771 words (83 pages) Dissertation
Published: 16th Dec 2019
Tagged: Engineering
Abstract
Black Swan events are low probability, high impact events that cannot be predicted. These events are typically unprecedented so they are often not accounted for in traditional risk analysis. In civil engineering, these events are of particular importance because their unpredictability can lead to catastrophic consequences. Without the knowledge of the possibility of such events, there is no way to prepare for them or design against them.
Many events have been referred to as Black Swans, such as 9/11 and the Tacoma Narrows bridge collapse, but the term can be used loosely and is sometimes used as an excuse to justify failures attributed to poor design. Therefore, a clearer framework is required for classifying events as Black Swans. True Black Swans are those events that could not possibly have been predicted beforehand, but this specification can be subjective depending on the observer. The nature of what is considered predictable is largely person dependent and will vary depending on the level of expertise. As a result, the classification of events as Black Swans is usually based on judgement and there is no formal method.
The methods of predicting and mitigating Black Swan events are severely limited. There is lots of uncertainty surrounding these events but their impact is severe and a greater understanding is required to try to reduce their occurrence. The literature review highlights the recommendation of using stress tests as a method to attempt to account for Black Swan events during risk analysis. Stress tests are often used in the finance industry as a method for measuring the resilience of a system under different failure mechanisms. Simulations are undertaken of all the different potential failure scenarios in order to calculate the probability of each scenario occurring and to recognise the weakest points of the system.
The effectiveness of stress testing was analysed through the use of the 2011 Fukushima Nuclear Disaster case study. The stress test was used to calculate the probability of this event happening and to inform the classification of this event as a Black Swan or not. The sequence of events that led to the nuclear reactor meltdown included flooding caused by the tsunami and numerous power failures. The probabilities of each of the possible failure scenarios were calculated using event tree analysis, to understand whether this event should have been anticipated. Sensitivity tests showed the importance of including historical data in analysis because it had a significant impact on the calculated probability of the event. The process of gathering the information required for the stress test, alongside the calculation of the 109 million year return period of the event, led to a strong case for the event being a Black Swan.
The use of a stress test proved to be an extremely useful tool in this risk analysis. It encourages the use of imagination to try to anticipate as many possible failure scenarios as possible, which is the only way to attempt to prevent a Black Swan event. Furthermore, the formation of a stress test requires understanding of the failure probabilities of each component in the system, which in turn emphasises the weakest parts of the system. This promotes more resilient design and building of systems that can cope better with potential Black Swan events. Lastly, the process allowed for sufficient knowledge of the event to be gathered in order to confidently make a judgement about the classification of an event as a Black Swan.
Overall, this dissertation recommends the use of stress testing in risk analysis to attempt to minimise the chances of Black Swans. Although it cannot anticipate Black Swan events, it gives the best chance of preparing the system to be robust enough to cope with one should it occur. In order to produce the most reliable and informative stress test possible, more historical and modern data collection within the industry about failures and failure probabilities is encouraged.
Table of Contents
List of Figures……………………………………………………….
List of Tables………………………………………………………..
Symbols……………………………………………………………
Abbreviations………………………………………………………..
1. Introduction…………………………………………………….
2. Literature Review…………………………………………………
2.1. Black Swans………………………………………………….
2.2. Risk Analysis in Civil Engineering……………………………………
2.3. Acceptable Risk……………………………………………….
2.4. The Fukushima Nuclear Disaster, Japan (2011)…………………………
2.5. Black Swan Mitigation Strategies……………………………………
2.6. Summary…………………………………………………….
3. Methodology……………………………………………………
3.1. Outline and Aims……………………………………………..13
3.2. Data Collection and Assumptions………………………………….14
3.2.1. Modern Tidal Gauge Data……………………………………….14
3.2.2. 2011 Tsunami……………………………………………….15
3.2.3. Historical Events……………………………………………..16
3.2.4. Power Failures………………………………………17
3.3. Return Periods of Tidal Data…………………………………….18
3.4. Probability Distributions for Tidal Data………………………………18
3.5. Maximum Likelihood Estimation…………………………………..18
3.6. Goodness-of-fit………………………………………………19
3.6.1. Tide Height Frequency Curve…………………………………….19
3.6.1.1 Rayleigh Distribution…………………………………..20
3.6.1.2 Gumbel Distribution…………………………………..21
3.6.1.3 Log-Normal Distribution………………………………..21
3.6.2. Gumbel Plotting Paper…………………………………………22
3.6.3. Chi-squared Test……………………………………………..22
3.7. Inclusion of Historical Data………………………………………23
3.8. Return Period……………………………………………….25
3.9. Risk Over Design Life………………………………………….26
3.10 Stress Test Design……………………………………………26
4. Results and Discussion…………………………………………..29
4.1. Return Period of Tsunami Event…………………………………..29
4.1.1 Return Period Excluding Historical Data…………………………….29
4.1.2. Return Period Including Historical Data……………………………..29
4.1.3. Conclusion…………………………………………………30
4.2. Risk Over Design Life………………………………………….30
4.3. Stress Testing……………………………………………….31
4.3.1. Stress Test Excluding Historical Data………………………………31
4.3.2. Stress Test Including Historical Data……………………………….32
5. Conclusions…………………………………………………..33
5.1. The 2011 Fukushima Disaster……………………………………33
5.2. Stress Testing……………………………………………….34
5.3. Black Swans………………………………………………..35
5.4. Limitations………………………………………………….35
5.5. Recommendations……………………………………………36
References………………………………………………………37
List of Figures
Figure 1: The corresponding action required for each level of risk (Health and Safety Executive, 1992)…….
Figure 2: The Farmer Curve for risk (Nuclear Energy Agency, 1992)…………………
Figure 3: Sequence of events on 11th March 2011 in Fukushima……………………
Figure 4: The design of the Fukushima plant during the event (Acton, Hibbs, 2012)………
Figure 5: Example of an event tree used in a probabilistic safety assessment (Nuclear Energy Agency, 1992)…….
Figure 6: A summary of the methodology implemented in this dissertation……………..
Figure 7: The layout of the stress test, showing all the possible outcomes during the 2011 Fukushima Nuclear Disaster. The actual sequence of events is shown with red arrows……..
Figure 8: Location of the tidal gauge at Soma in relation to the Fukushima nuclear power plant (Google Maps, 2017)…….
Figure 9: Annual Maximum Series of Tide Height at Soma, Japan (JOCD, 2016)………..
Figure 10: The tidal gauge data from 1974 – 2010 (JOCD, 2015) compared with the 2011 tide height…….
Figure 11: Plot showing the historical events, tidal gauge data and the 2011 event……….
Figure 12: Maximum likelihood estimation process……………………………..
Figure 13: Tide Height Frequency Curve using the Rayleigh Distribution………………
Figure 14: Tide Height Frequency Curve using the Gumbel distribution……………….
Figure 15: Tide Height Frequency Curve using the Log-Normal Distribution……………
Figure 16: Comparison of the Gumbel and Log-Normal distributions on Gumbel Probability Paper…….
Figure 17: Frequency curve showing the Gumbel distribution fit to both the modern and historical data…….
Figure 18: Scenarios that form the stress test of the 2011 Fukushima Nuclear Disaster……
Figure 19: Stress test results without including the historical data……………………
Figure 20: Stress test results with the inclusion of historical data……………………
List of Tables
Table 1: Examples of events referred to as Black Swans in literature…………………
Table 2: Coordinate locations of tidal gauge at Soma, Fukushima nuclear power plant and the epicentre of the 2011 earthquake…….
Table 3: Description of the historical tsunami events and the 2011 event (NGDC/WDS, 2015 and Smits, 2011)…….
Table 4: Probability of failure for each power source in the nuclear power plant…………
Table 5: Probability distributions suitable for tidal data…………………………..
Table 6: Values of parameters calculated through maximum likelihood estimation……….
Table 7: Standard deviation of T-year design event for the Gumbel and Log-Normal distribution…….
Table 8: The upper bin level for Chi-squared calculation………………………….
Table 9: Calculated chi-Squared values for goodness-of-fit test…………………….
Table 10: Parameters for the Gumbel distribution, when historical events were included and a perception threshold of 690cm was used…….
Table 11: The variables in the 2011 Fukushima Nuclear Disaster……………………
Table 12: Probability of tide height exceeding the sea wall………………………..
Table 13: Calculation of the return period of the 2011 event based on the modern tidal gauge data only…….
Table 14: Calculation of the return period of the 2011 tsunami tide height based on the tidal gauge and historical data…….
Table 15: Calculation of the magnitude of the tide height for an exceedance risk of 10% over 50 years…….
Symbols
| e | Number of records from modern data that exceed threshold value |
| h | Number of years from first historical data record to first modern data record |
| i | Number of current bin for chi-squared test |
| k | Total number of bins for chi-squared test |
| kT | Number of events exceeding the threshold value |
| L | Likelihood function |
| LD | Design life |
| n | Number of events in series |
| ni | Number of observed events in each bin |
| p | Number of parameters in distribution |
| pi | Plotting position |
| r | Ranking of magnitude within series |
| rL | Risk over design life |
| s | Number of records from modern data |
| sxT | Standard deviation of T-year design event |
| T | Return Period |
| X0 | Perception threshold value |
| xi | Upper bin level for chi-squared test |
| xT | Magnitude of T-year design event |
| yT | Gumbel reduced variate |
| z | Standard score for a normally distributed random variable |
| α | Gumbel distribution scale parameter |
| αP | Plotting position constant |
| αS | Significance level |
| δ | Rayleigh distribution scale parameter |
| λ | The failure rate, relating to the Poisson distribution |
| μ | Gumbel distribution location parameter |
| μLN | Log-Normal distribution location parameter |
| σ | Log-Normal distribution scale parameter |
| χ2 | Chi-squared value for goodness-of-fit |
Abbreviations
| 9/11 | 11th September 2001 Terrorist attacks on the World Trade Centre |
| AC | Alternating Current |
| CDF | Cumulative Density Function |
| DC | Direct Current |
| JOCD | The Japan Oceanographic Data Centre |
| NISA | Nuclear and Industrial Safety Agency |
| Probability Density Function | |
| SAIFI | System Average Interruption Frequency Index |
| TEPCO | Tokyo Electric Power Company |
1. Introduction
The civil engineering industry is responsible for designing and maintaining significant networks of infrastructure. This infrastructure is built and designed to cope with the known risks it faces. However, there are also unknown risks that infrastructure cannot be protected from. These unknown risks are referred to as Black Swans and are described as rare events with an extreme impact that only become predictable after the fact (Taleb, 2007). The term originates from the finance industry to refer to unexpected and unprecedented events that lead to failure of financial systems. Conversely, in civil engineering, these types of scenarios can result in much more catastrophic effects and even loss of life. Therefore, it is important to gain a greater understanding of these events and to configure risk analysis methods to best cope with them. Currently, risk analysis is limited to covering events that have already occurred, and does not consider those that have not happened before. The uncertainty and randomness of such events means that eliminating Black Swans is unrealistic, but the knowledge gained from past events may enable the development of methods to reduce their possibility.
Defining an event as a Black Swan is difficult because the criterion is extremely vague. Determining whether an event is rare or has an extreme impact is a matter of judgement and can be subjective. Therefore, a framework is required that can be implemented to all events to classify them as Black Swan events. The concern surrounding the subjectivity of the descriptors of a Black Swan is that the term can be used for events that were not truly unpredictable. This can lead to inadequate investigation of the incident because it is deemed too unpredictable to have been prevented.
Although the main characteristic of Black Swan events is their unpredictability, this dissertation aims to explore a method to reduce the frequency of them occurring. The financial industry has implemented stress testing as a tool to aid the discovery of Black Swan events before they happen. This procedure will be analysed to assess the suitability of its application in civil engineering. Performing a stress test involves a thorough scenario analysis, which will identify all the possible scenarios a system can face. This encourages the use of the imagination to identify events that have not happened before, rather than just basing the risk assessment on past, known events. The stress test calculates the probability of each scenario occurring and this informs the design of the system.
This method will be investigated using a case study, the 2011 Fukushima Nuclear disaster. It was an unexpected event that was not prepared for; thus it is a potential Black Swan. However, there have been criticisms of the risk analysis that informed the design of the power plant and there was suspicion that the events could have been predicted. The omission of historical events from the risk analysis and the insufficient height of the sea wall protecting the nuclear power plant are some of the flaws mentioned (Paté-Cornell, 2012). This incident provides a complex case study that will be used to assess the effectiveness of a stress test as a framework for classifying Black Swans and whether it could be a tool for preventing them.
The 2011 Fukushima Nuclear disaster was an intricate event made up of many elements. Some of the contributors include human error and political bias, which cannot be quantified or analysed simply. Therefore, the scenario analysis will be simplified to only consider the tsunami and the power failures that occurred. The stress test will be carried out to calculate the probability of the sequence of events that occurred. This will be found using event tree analysis and the probabilities of each of the components of the failure. Data and failure rates of each of the components were collected to model their failure probabilities. The probability of the event will be used to categorise the nuclear disaster as a Black Swan or not.
The objective is to conclude whether a stress test provides a suitable framework for classifying events as Black Swans and whether the process has any attributes that would be useful in minimising the possibility of Black Swans. This will allow for a recommendation of whether it is suitable for implementation in the civil engineering industry and its potential role in risk analysis.
2. Literature Review
2.1. Black Swans
The term ‘Black Swan’ originates from when black swans were discovered in Australia in the 17th century. Before this time, people believed that all swans were white and black swans were used as a metaphor to describe impossible events. Following their discovery, this belief was invalidated and the term is now used to represent unlikely and unpredictable events that do actually occur. The idea of Black Swan events has become popularised in the financial sector by Nassim Taleb. Taleb (2007, p xviii) describes Black Swan events as having three attributes, “rarity, extreme impact, and retrospective predictability”. These attributes can have severe consequences because they cannot be accounted for in traditional risk analysis. Risk assessments tend to be based on statistics that are informed by historical data and consequently, any potential unprecedented events will not be acknowledged (Paté-Cornell, 2012). Considering Black Swan events is particularly important within civil engineering because they could result in the failure of critical infrastructure and ultimately, a loss of life. These events will not have been encountered before and therefore, there would be no knowledge to prepare for or mitigate them.
A large number of events have been labelled as Black Swan events but they are supposed to be extremely rare, so questions arise as to whether the term is being used correctly. Paté-Cornell (2012) suggests that some events are titled Black Swans in order to justify a lack of proactive risk management. Therefore, the concept of a Black Swan can be used as an excuse and simply labels an event as being too unpredictable to be accounted for. Similarly, other events are justified as Black Swans because they were seen as being unpreventable. However, this is not a quality recognised as an attribute of a Black Swan, and alone is not enough to classify an event as a Black Swan. Table 1 shows examples of events referred to as Black Swans in literature and the justification provided for why they fulfil the criteria of a Black Swan.
Table 1: Examples of events referred to as Black Swans in literature
| Black Swan Example | Black Swan Characteristics |
| 9/11 (Taleb, 2007) | Unprecedented
High impact |
| 2008 Financial Crisis (Runde, 2009) | The event was unpreventable
Catastrophic effect |
| Rise of the internet (Taleb, 2007) | Changed the world
Was unexpected |
| Fukushima Tsunami and Nuclear Accident (Paté-Cornell, 2012) | Combination of events had not occurred before
High impact |
The September 11th 2001 terrorist attacks on the World Trade Centre are commonly used as an example of a Black Swan event. Taleb (2007, p xix) mentions that the risk of the event occurring was inconceivable and because it was so rare that it had never occurred before, it could qualify as a Black Swan. Furthermore, it resulted in 2823 deaths (Templeton, Lumley, 2002) and is unanimously recognised as having an extreme impact. Therefore, 9/11 fits the criteria of a true Black Swan event.
In contrast, the 2008 Financial Crisis has been referred to as both a Black Swan and not a Black Swan. Paté-Cornell (2012) identifies that whether the event was a Black Swan or not “depends on one’s perspective”, because most people were unaware of the possibility of such an event but a number of people with expertise were able to predict its occurrence (Paulson, 2010). This highlights the issues with the concept of defining a Black Swan, because it is observer dependent (Runde, 2009). Taleb (2012) states that Black Swans “lie outside the realm of regular expectation” but a person’s “regular expectation” will vary depending on their past experiences and knowledge. Similarly, there is no way of defining an “extreme impact” that is observer independent. This review has established that the criteria currently used to classify a Black Swan event are extremely vague. It can be difficult to decide if an event qualifies as a ‘rare event’ or ‘outlier’, when these terms are very subjective and will be defined differently depending on the person. As a result, there is no way to decide if the 2008 Financial Crisis was a Black Swan event or not without considering the position of the person making the judgement (Runde, 2009).
2.2. Risk Analysis in Civil Engineering
In Civil Engineering, risk is analysed by assessing the probability of different events occurring. This analysis requires the identification of potential hazards and only those that are identified can be taken into account. Therefore, Black Swan events will not be accounted for in risk analysis because their existence is unknown and they cannot be included in quantitative assessments. However, proactive measures such as recording near misses may allow for identification of potential hazards and prevent Black Swans. Once hazards are identified, event trees are created to allow for further analysis of overall risk. This method allows for the different possible events to be identified and for their consequences to be assessed. This can be limited in providing accurate predictions of risk because future events are not always related to past events, especially in the case of Black Swan events (Faber, Stewart, 2003).
Difficulties in assessing risk accurately in Civil Engineering include the impact of human error. Faber and Stewart (2003) identify human error as “an important source of risk” which can be incredibly difficult to quantify. Human errors can include “errors involving diagnosis, high level decision making or management of organisations”, which cannot be predicted and as a result, are usually omitted from risk analysis.
Correspondingly, the dependency and interaction between different events and sequence of events can be equally difficult to analyse. When using event trees to analyse risk, the probability of two events occurring together is equal to the product of the probability of each event. However, if the events are dependent, the probability of them occurring together will be greater than their product. Therefore, not accounting for the dependency of events can result in an underestimation of their likelihood and may mean they are assumed to be too unlikely to require mitigation and implementation of safety strategies (Paté-Cornell, 2012).
2.3. Acceptable Risk
Most risk analysis centres around calculating values and probabilities to define the likelihood of an event happening. However, it is difficult to distinguish the significance and impact of these numbers. All the potential scenarios that are investigated during risk analysis are not always directly comparable. The non-quantifiable elements of these situations, such as the context and consequences of these events, can be of even more importance than their likelihood.
The Health and Safety Executive (1992) defines risk as having three components: the probability, the event and the severity of the consequences. These elements must be considered together when deciding whether the risk is insignificant enough to continue or not. Figure 1 illustrates the actions the Health and Safety Executive recommends based on each level of risk.
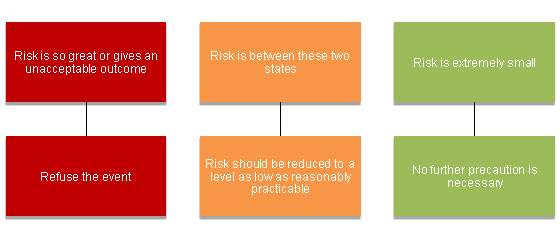
Figure 1: The corresponding action required for each level of risk (Health and Safety Executive, 1992)
The criterion for classifying risks is extremely vague and subjective. There are no quantifiable or comparable methods for classifying a risk as ‘so great’ or ‘extremely small’ because this will depend on the three elements discussed previously. Similarly, the action suggested for scenarios that are between these extremes, is reducing the risk to as ‘low as reasonably practicable’, which again is not a measurable characteristic. The vagueness and lack of clarity in regulations highlights the need for advances and development in the field of risk analysis. The subjectivity involved in evaluating the appropriate actions required for mid-range risks provides ample opportunity for organisations to justify a lack of action.
The Nuclear Energy Agency (1991) also recognises that the concept of the “acceptable risk” is a completely subjective notion. The “Farmer curve”, shown in Figure 2, expresses the relationship between acceptable risk, frequency and consequences of events. The general trend shows that as the frequency of an event increases, the severity of its consequences is reduced. Events that have both a high frequency and severe consequences, and lie in the prohibited zone, demonstrate the highest risk. Any events found to lie in the prohibited zone of risk must be reduced to a level as low as reasonably practicable. It is not specified for the risk to be minimised to 0 because this is highly unlikely as there will always be some residual risk that cannot be controlled.
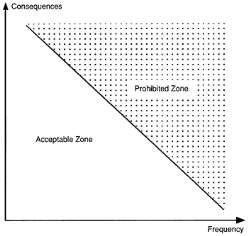
Figure 2: The Farmer Curve for risk (Nuclear Energy Agency, 1992)
In summary, there is no universal definition for acceptable risk because there are many contributors to the level of risk and these will differ from case to case. As a consequence, it is expected that sound engineering judgement will be used to determine when a risk is great enough to need mitigation and when it is acceptable and does not require any additional safety measures. This issue is mirrored in the problem of defining a Black Swan because there are numerous factors that inform the decision and there is no clear framework or criteria that can be applied to all events.
2.4. The Fukushima Nuclear Disaster, Japan (2011)
The Fukushima Nuclear Disaster in 2011 is an example of a low probability, high consequence event, which is thought of by many as a Black Swan. However, this can be controversial as there was evidence of similar historical events that were not considered in risk analysis and may indicate the disaster could have been foreseeable.
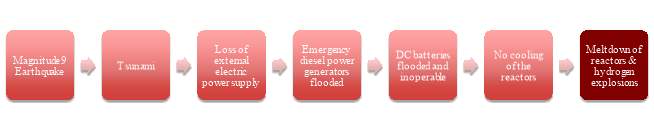 A magnitude 9.0 earthquake triggered the events on 11th March 2011, the largest ever recorded in Japan. In response to the earthquake, the control rods were inserted into the reactor cores to suppress nuclear fission in the nuclear power plant. However, the cores still required cooling, as the radioactive material would continue to decay and produce heat. The earthquake damaged all six external power lines supplying the power plant with electricity from Japan’s grid but there were a number of back up power sources to continue powering the cooling of the nuclear reactor cores. Less than an hour after the earthquake, the power plant was inundated by a number of tsunami waves that destroyed the seawater pumps. These seawater pumps were used to cool the back up diesel generators, so this resulted in a complete loss of alternating current (AC) power to the power plant, known as a station blackout. The direct current (DC) batteries kept in the plant as a further back up were also flooded and became inoperable. Without power to drive the cooling systems and no seawater pumps to dissipate the heat from the reactor cores, the reactors overheated causing three nuclear meltdowns and a release of radioactive material into the atmosphere (Acton, Hibbs, 2012). The sequence of events that occurred are summarised in Figure 1.
Figure 3: Sequence of events on 11th March 2011 in Fukushima
The case supporting the event being a Black Swan surrounds the magnitude of the earthquake. It was an unprecedented size and its possibility was inconceivable. However, this is from the point of view of the plant’s owner, Tokyo Electric Power Company (TEPCO), and the Japanese regulator, the Nuclear and Industrial Safety Agency (NISA). These two parties were responsible for the design of the power plant and its defence against tsunami events but their risk assessment methods did not follow international best practices and standards (Acton, Hibbs, 2012). This led to the magnitude of the 2011 event being inconceivable rather than just highly unlikely, so no action was taken to mitigate its effects. By not considering its possibility, there was no reason for TEPCO and NISA to enhance their sea defences or consider the resilience of their power systems.
The limitations of the risk assessments used to inform the design of the Fukushima nuclear power plant include TEPCO ignoring the evidence of large tsunamis in the region occurring every thousand years, the inadequacy of TEPCO’s computer modelling of the tsunami and the failure of NISA to review the simulations and implement appropriate computer modelling tools (Acton, Hibbs, 2012). The simulations carried out by TEPCO of potential events only considered much smaller magnitude earthquakes, so the size of the worst case tsunami that was predicted was much smaller than actually followed. As a result, the consequences of this magnitude event were never considered and a station black out where all the back-up systems were destroyed was never accounted for in design (Aven. 2013).
Investigations following the event have identified a number of flaws in the design of the power plant and dispute whether the event was a Black Swan. The main consideration that was ignored in the design of the power plant was historical events. The risk analysis of potential earthquake and tsunami events only included recent data and ignored the higher magnitude historical events that were most similar to the size of the actual event. The simulations undertaken were based on the Chilean tsunami of 1960, which resulted in a maximum water level of 3.12m (INPO, 2011). The 869 Sanriku earthquake with a magnitude of 8.6 and the 1611 Sanriku earthquake with a magnitude of 8.1 and a maximum tsunami wave height of 20m were unaccounted for in design (NGDC/WDS, 2015). These events were similar to the magnitude 9 event at Fukushima, where the tsunami waves reached heights of 14m. By excluding this information from risk analysis, the analysis became biased and the plant was designed to only withstand a tsunami with a height of 5.7m (Paté-Cornell, 2012).
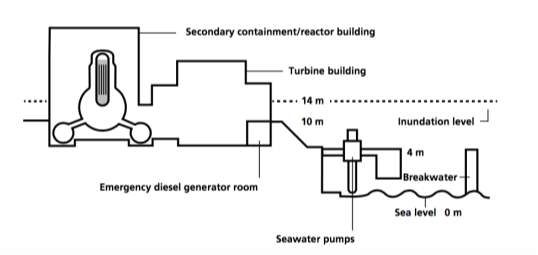 The plant was designed with the seawater pumps 4m above sea level, the main plant buildings 10m above sea level and a surrounding sea wall of 5.7m. The tsunami waves reached 14m as a result of the run up from the slope on which the main buildings of the plant sit (Acton, Hibbs, 2012). This arrangement is shown in Figure 4.
Figure 4: The design of the Fukushima plant during the event (Acton, Hibbs, 2012)
There was overconfidence in the safety of the power plant coupled with an avoidance of disaster response planning, which led to an ill-equipped team of plant operators to attempt to minimise the effects of the situation. The Japanese nuclear industry was keen to avoid disaster response planning in order to not undermine public support for nuclear power (Park et al, 2012). In response to climate change, Japan’s government and industry wanted to increase the country’s reliance on nuclear energy in order to meet the demands of the densely populated, highly industrialized country with few natural energy sources (Acton, Hibbs, 2012). Consequently, there may have been an element of political bias that played a part in the lack of preparation and consideration of an event such as the 2011 Fukushima disaster. The priorities of the government and nuclear industry were to promote nuclear energy and this meant they were more lenient about plants being designed to regulations and allowed for the historical data to be omitted from the design of the Fukushima nuclear power plant.
This lack of preparation meant that there were a number of human errors that contributed to the disaster. The power plant operators were not educated on the correct procedure and in combination with the station blackout and the extraordinary stress from the events that transpired, they were not in the best position to prevent the nuclear meltdown (Acton, Hibbs, 2012).
In conclusion, it can be seen that a sequence of unlikely, high impact events led to a nuclear meltdown at Fukushima. However, there are a number of factors that influenced the amount of impact these events had, including poorly informed risk analysis, inadequate safety margins in design, political bias and human error. These factors are able to dispute the event being a Black Swan because they show it may have been possible for the Fukushima Nuclear Disaster to be anticipated and for the impacts of the event to be reduced.
2.5. Black Swan Mitigation Strategies
It is difficult to account for Black Swans in risk analysis because their existence is unknown. In order for risk assessments to become more useful in accounting for Black Swans, imagination is required in order to anticipate unprecedented scenarios and identify any unusual signals (Paté-Cornell, 2012). Therefore, recording near misses and precursors is important to allow for a greater number of potential scenarios to be included in the risk assessment. The credibility of these signals must be assessed in order to weigh up the impacts of a false alert being implemented because this could cause more detrimental impacts than the event itself. Overall, Paté-Cornell (2012) deems that the best approach to mitigate Black Swans includes “alertness, quick detection and early response”.
In contrast, Park et al (2012) emphasise the need for more resilience-based strategies to deal with Black Swans. Rather than trying to forecast and predict future events, the approach should be to prepare for the unexpected. Resilience acts as protection against unanticipated events and allows for better capability of such events. This approach was not favoured by the Japanese nuclear industry because they felt this drew attention to the risk surrounding nuclear power, but by increasing their safety margins in the design of the Fukushima nuclear plant, the nuclear meltdown may have been prevented.
Aven (2015) identifies scenario analysis as the solution to anticipating Black Swan events. Inventing failure events and scenarios and trying to understand the processes that would cause them to occur, could allow for suitable prevention strategies to be implemented. This is a technique used by the finance industry known as stress testing. Simulations are undertaken of different scenarios identified in the scenario analysis, in order to understand how resilient a system is under different failure mechanisms. This draws attention to areas of weakness in the system and calculates the probabilities of the different failure scenarios occurring.
The Nuclear Energy Agency (1992) recognises the importance of probabilistic safety assessments, which correspond with the stress tests implemented in the finance industry. The process focuses on determining all the possible situations and sequences of events that may lead to severe core damage in a nuclear power plant. This requires vast amounts of data about the facility to inform the assessment. First, the events that could initiate core damage or a meltdown are identified and categorised based on whether they are a result of human error or a safety system failure. These events are then investigated to understand the probability of failure linked to each. This is particularly insightful, because the events can be ordered based on probability of failure to recognise where the weaknesses are in the system and where risk needs to be minimised. However, these values will be largely dependent on the data used, which should be as reliable and representative as possible. Finally, an event tree can be formulated to recognise the sequences of events that will lead to a meltdown. This will allow for calculation of the probability of different combinations of events that will lead to failure, by following the procedure outlined in Figure 5.
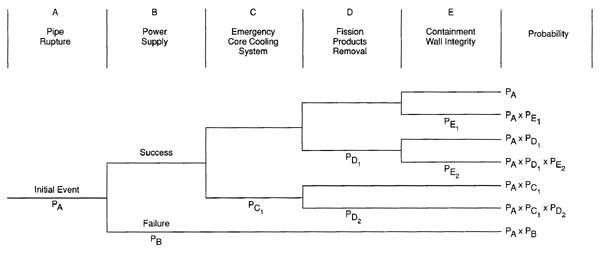
Figure 5: Example of an event tree used in a probabilistic safety assessment (Nuclear Energy Agency, 1992)
The main limitation of probabilistic safety assessments within the nuclear industry is the uncertainty related to the lack of data. There is insufficient knowledge about the possible situations that lead to failure, and this may result in oversight of potentially catastrophic events. Without any information or historical records of these situations, there is still a risk for Black Swan events to occur. Similarly, the lack of data concerning the reliability of different plant components, failure modes and failures from human actions, makes it difficult to formulate an accurate risk assessment. There are also significant gaps in knowledge about how the different components and events react during an accident situation; therefore assumptions have to be made about their behaviour in order to formulate the risk assessment.
Despite these limitations, the Nuclear Energy Agency (1992) emphasises the importance of this type of risk assessment and the knowledge that can be gathered from it. Although the numbers may not be perfectly accurate, the modelling of the system helps identify areas of weakness in a system and informs strategies for effectively mitigating risks. It also encourages for identification of the possible failure modes and as more knowledge is gathered, the risk of a Black Swan event occurring can be minimised.
2.6. Summary
Literature has shown that the unpredictability of Black Swans means they are often omitted from traditional risk analysis. An element of imagination is required in order to have a chance of anticipating such uncertain events. When classifying an event as Black Swan, it will depend on the judgement of the observer because the descriptors of a Black Swan are extremely subjective.
Stress tests and probabilistic safety assessments are one way of attempting to account for Black Swans in risk analysis. They require an analysis of potential scenarios and their probabilities and consequences are assessed. However, there is no clear framework for classifying a probability or consequence as acceptable or unacceptable, so the information will need to be analysed and judgement is required to decide on the implications. These methods will illustrate weaknesses in infrastructure and allow for more resilient design that is better equipped to handle unexpected events. This technique is being introduced in the nuclear industry but may be an appropriate solution to risk analysis for all types of infrastructure.
Using Fukushima as a case study, this dissertation will assess whether use of a stress test prior to the event would have helped in its prediction. By completing a stress test using the historical data available and understanding the possible chains of events, a judgement can be made as to whether the event should have been anticipated and if it should be categorised as a Black Swan. This analysis should provide greater understanding of Black Swan events and may inform a framework for classifying such events. However, there are a great number of complexities involved in the events that transpired at the Fukushima nuclear plant in 2011, such as the political aspects and the dependencies between different events, so the focus will be narrowed down to predicting the tsunami tide heights and the power failures involved.
3. Methodology
3.1. Outline and Aims
The aim of this dissertation is to identify a framework that can be utilised to classify failure events as Black Swans. The literature has indicated that the definition and categorisation of Black Swan events is very vague and needs further clarification. However, there are suggestions that a stress test or probabilistic safety assessment could be a useful tool in mitigating Black Swans and improving the resilience of design. Therefore, the methodology used in this dissertation centres on performing a stress test for the 2011 Fukushima Nuclear Disaster and determining whether it should be classified as a Black Swan. The process of using a framework to assess events after they have occurred, will allow for greater understanding of how these events could have been prevented beforehand. Consequently, the results from the following experiments will indicate whether stress testing should be utilised more in predicting and preventing Black Swans. The methodology is summarised in Figure 6.
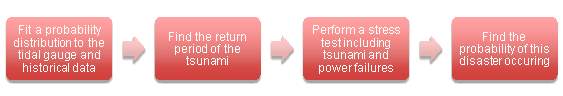
Figure 6: A summary of the methodology implemented in this dissertation
The case study was analysed and simplified to focus on the events surrounding the tsunami and the power failures that occurred. Firstly, the return period of the tsunami was calculated and this allowed for a judgement to be made on whether the magnitude of this tsunami event should have been considered in the design of the nuclear power plant. In order to do this, modern tidal gauge data and historical findings were analysed and a probability distribution was fit to the series.
Following this, a stress test was performed using the probability distribution of the tide height and the failure rates of the different power sources. This enabled for calculation of the probability for the exact sequence of events that led to the core melt, as shown in Figure 7, and allowed for a decision of whether it should have been predicted or not. Furthermore, the probabilities of each component were analysed to understand the contribution of each element in the disaster. Similarly, criticisms related to the omission of historical data from risk analysis when designing the sea wall at Fukushima were addressed by checking the impact on the probability of the event when the data was included compared to when it was not.
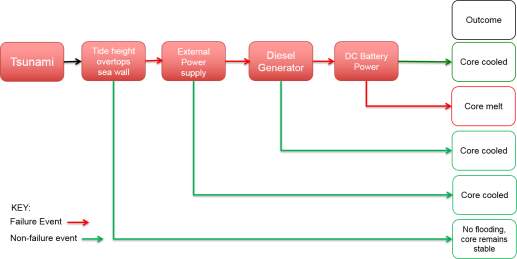
Figure 7: The layout of the stress test, showing all the possible outcomes during the 2011 Fukushima Nuclear Disaster. The actual sequence of events is shown with red arrows.
3.2. Data Collection and Assumptions
- Modern Tidal Gauge Data
The Japan Oceanographic Data Centre (JOCD, 2016) has hourly tidal data from 207 tidal gauge stations around Japan. The tidal gauge nearest to the Fukushima nuclear power plant was located at Soma, 45km north of the Fukushima nuclear power plant (Google Maps, 2017). The data for Soma spanned from 1974 to 2015 reporting the height of the tide. For the purpose of analysing the potential of predicting the 2011 event, only the tidal data prior to 2011 was relevant. Therefore, the data series from 1974 to 2010, consisting of 37 values of tide height was used in this analysis.
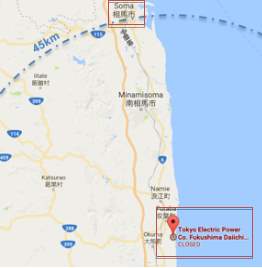
Figure 8: Location of the tidal gauge at Soma in relation to the Fukushima nuclear power plant (Google Maps, 2017)
 The data was analysed to find the peak tide height values for each year, giving a representation of the most extreme events each year rather than the average values. The annual maximum series of tide height at the Soma tidal gauge station is shown in Figure 9.
Figure 9: Annual Maximum Series of Tide Height at Soma, Japan (JOCD, 2016)
Although the tidal gauge is not located at the Fukushima nuclear power plant, based on the coordinates of the tidal gauge shown in Table 2, the tidal gauge and the power plant were almost equidistant from the epicentre. Therefore, it was assumed that the effects of the tsunami and the corresponding tide height would be similar at both locations.
Table 2: Coordinate locations of tidal gauge at Soma, Fukushima nuclear power plant and the epicentre of the 2011 earthquake
| Point of Interest | Location (Latitude, Longitude) | Distance to 2011 earthquake epicentre |
| Tidal gauge at Soma | 37.50°N, 140.58°E (NGDC/WDS, 2015) | 166.1km |
| Fukushima nuclear power plant | 37.42°N, 141.03°E (Google Maps, 2017) | 167.1km |
| 2011 Earthquake epicentre | 38.3°N, 142.4°E (JOCD, 2015) | – |
The process of a tsunami involves extremely complex and intricate mechanisms that will be simplified for the purpose of this dissertation. The data available refers to the tide height at Soma, so it will be assumed that the nature of the tide during a tsunami is comparable to the regular tide patterns, although it is acknowledged that in reality this is not the case.
- 2011 Tsunami
Unfortunately, the tidal gauge at Soma was damaged during the 2011 tsunami so a measurement was not taken for the magnitude of the tide during the event. Therefore, the value for the tsunami tide at the Soma coastline was found from other sources. The height of the tsunami tide at Soma was reported as 9.3m and this was recognised as the location of the maximum recorded tsunami tide height (Bissel et al, 2016). This was corroborated by Ozaki (2011), who gave a preliminary assessment of the tide height at Soma based on the surrounding tidal gauges that survived the event, and reported the tsunami tide height to be approximately 9.3m.
These values are lower than the inundation height of 14m referred to in section 2.4, because these are the tsunami tide heights at the coastline, whereas the 14m value describes the run up height after the wave had reached the shore and was amplified by the slope of land. In order for the data from the 2011 event and the tidal gauge to be comparable, only the height of the tide at the coastline was considered for analysis.
The values for the 2011 event needed to be calibrated with the modern tidal gauge data, because they were not taken from the same zero tide level. The values for the 2011 event were taken from the datum, but the zero of the tide height measured by the tidal gauge was approximately 0.6m below the datum (JOCD, 2015). Therefore, 9.3m quoted as the tide height for the 2011 event became a tide height of 9.9m when taken from the same point as the tidal gauge at Soma. All tide height data mentioned in this dissertation uses the zero tide height of the tidal gauge.
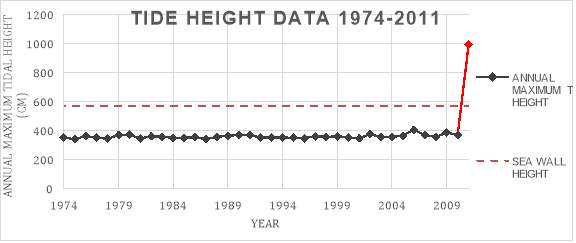
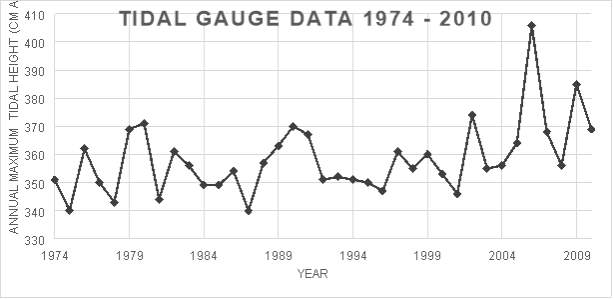
Figure 10: The tidal gauge data from 1974 – 2010 (JOCD, 2015) compared with the 2011 tide height
Figure 10 compares the annual maximum tide heights from 1974 to 2010 measured by the tidal gauge, with the 2011 tsunami tide height found from research. It is clear to see the extreme nature of the 2011 event and the inadequacy of the height of the sea wall.
- Historical Events
As referred to in the literature review, Paté-Cornell (2012) mentioned two historical events of similar magnitude to the 2011 tsunami that were omitted from risk analysis. These events were as a result of the 869 and 1611 Sanriku earthquakes. The magnitudes of these earthquakes were 8.6 and 8.1 respectively, making them similar size events to the magnitude 9.0 earthquake of 2011 (NGDC/WDS, 2015).
Table 3: Description of the historical tsunami events and the 2011 event (NGDC/WDS, 2015 and Smits, 2011)
| Year | Epicentre Location (Latitude, Longitude) | Earthquake Magnitude | Tsunami Tide Height |
| 869 | 38.5°N, 143.8°E | 8.6 | 8.0m |
| 1611 | 39.0°N, 144.5°E | 8.1 | 6.9m |
| 1896 | 39.5°N, 144.0°E | 8.3 | 8.0m |
| 2011 | 38.3°N, 142.4°E | 9.0 | 9.9m |
The tide height for each the historical events are very approximate because there was little available data about those events (Smits, 2011). However, the description of the events and comparisons with available data allowed for inference of the tsunami tide heights, which were then adjusted to calibrate with the zero tide level of the tidal gauge.
Figure 11 shows the magnitudes and resultant tsunami tide heights of the historical events are comparable to the 2011 event and when included alongside the tidal gauge data and the 2011 event, the 2011 event does not seem as extreme as it seemed in Figure 10. The large distances in time between the tidal gauge data and the historical data are clear in the plot and does show why the data may not have been included in the risk analysis.
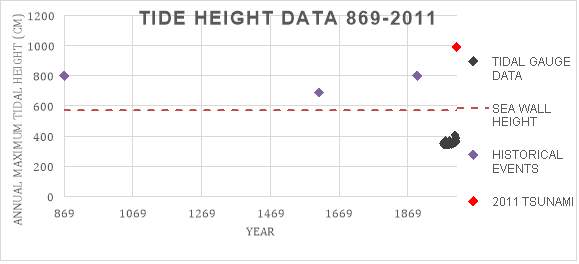
Figure 11: Plot showing the historical events, tidal gauge data and the 2011 event
- Power Failures
The sequence of events that led to the nuclear disaster, as shown in Figure 3, highlight three stages of power failures:
- Loss of the external power supply
- Failure of the emergency diesel generators
- Failure of the back up DC batteries
The loss of power prevented the nuclear rods being cooled and led to the catastrophic meltdown of the power plant. The likelihood of these power failure events occurring independently was required for the performance of the stress test.
The reliability of a country’s power grid is assessed through the use of System Average Interruption Frequency Index (SAIFI) indicators. The Board on Energy and Environmental Systems et al. (2012) recognise the SAIFI indicator for Japan to be 0.05 based on the period from 1992 to 2001. In other words, the failure rate for the Japanese power grid is 0.05 times per year. This is corroborated by TEPCO (2009), the suppliers of Japanese power, who emphasise their maintenance of “an extremely high level of power supply reliability compared to other countries” by minimising their power outage frequency to 0.05 times per year.
Failure data was compiled for the different components of a light water reactor, a type of nuclear reactor, based on event reports from 1982 until 1998. The reactors in the Fukushima power plant were all boiling water reactors, a variety of light water reactor (Acton, J., Hibbs, M., 2012). The emergency diesel generator is recognised as having two different failure modes: failure to start and failure to run. These each have different failure rates of 1.60 x 10⁻⁶ per hour and 7.60 x 10⁻⁵ per hour, respectively. This corresponds to an overall failure rate of 0.68 per year for the diesel generator. The storage battery has a failure rate of 2.10 x 10⁻⁸ per hour or 1.84 x 10⁻⁴ per year (Matsuzaki, A., Kirimoto, Y., 2008).
In order to find the corresponding probabilities for the failure rates, it was assumed that the power failures are Poisson distributed. The Poisson distribution is often used when a rate of success or failure is known for a particular interval of time. The probability mass function for the Poisson distribution is given by:
| PX=e-λλxx! | (1) |
Where λ is the failure rate and x is the number of failure events. To simulate the events of the nuclear disaster in the stress test, the probability of at least one failure occurring was required. This is equal to:
| PX≥1=PX>0=1-P(X=0) | (2) |
Table 4 shows the probability of failure for each power source, calculated by using the failure rates from literature, equation (1) and equation (2).
Table 4: Probability of failure for each power source in the nuclear power plant
| Power Source | Failure Rate, λ (per year) | Probability of no failures, P(X=0) (per year) | Probability of at least one failure, P(X>0) (per year) |
| Offsite Power | 0.05 | 0.9512 | 0.0488 |
| Diesel Generator | 0.68 | 0.5067 | 0.4933 |
| DC Battery | 0.000184 | 0.9998 | 0.0002 |
3.3. Return Periods of Tidal Data
In order to convert the tidal data from a time series to a frequency distribution, the return periods related to each tide height was required. This was calculated using the Gringorton’s plotting position formula, shown below:
| PX≥xr= r-0.44n+0.12 | (3) |
This defines the annual exceedance probability of each tide height based on its ranking, r, within the data series. The return period was then found from the inverse of the annual exceedance probability, as described in equation (4), for each value in the data set.
| T= 1P(X≥xT) | (4) |
3.4. Probability Distributions for Tidal Data
In order to understand the probabilities associated to the different magnitudes of the tide height, it was required for a probability distribution to be fit to the tidal gauge data and the historical data. This allowed for the return period of the 2011 tsunami to be evaluated and for a probability to be assigned to the tsunami overtopping the sea wall at the Fukushima nuclear power plant, based on all the available data.
After investigating literature, several suitable probability distributions for tidal data were identified. Table 5 shows the probability distributions that have been used in this dissertation and the sources from which they were deemed suitable.
Table 5: Probability distributions suitable for tidal data
| Probability Distribution and Source | Probability Density Function (PDF) | Cumulative Density Function (CDF) | ||
| Rayleigh (Balakrishnan et al., 2004) | fx=1δ2x exp-12xδ2 | (5) | Fx=1-exp-12xδ2 | (6) |
| Gumbel (D’Onofrio et al., 1998) | fx=1αexp-x-μα-exp-x-μα | (7) | Fx=exp-exp-x-μα | (8) |
| Log-Normal (Allan et al., 2010) | fx=1xσ2πexp-12logx-μLNσ2 | (9) | Fx=Φlnx-μLNσ | (10) |
3.5. Maximum Likelihood Estimation
Each of the probability distributions identified in Table 5 had unknown parameters that had to be calculated based on the data series. This was done using maximum likelihood estimation where the parameters were found that maximise the log-likelihood function shown in equation (11).
| lnLθ; x1,…,xn= ∑i=1nlnfxθ | (11) |
The log-likelihood function expresses the probability of a series of data occurring under a certain probability distribution, given the value of the unknown parameter, θ. The unknown parameters vary for each probability distribution. Using computational methods, the value of the unknown parameter was found that maximised the likelihood of the time series occurring. This identified the values for the parameters that made the data set most likely to fit the given distribution.
For the 2011 tsunami at Fukushima, the Rayleigh, Gumbel and Log-Normal distributions were fit to the tidal gauge data using maximum likelihood estimation. The process of calculating the unknown parameters is summarised in Figure 12, where f(x) refers to the PDFs in Table 5.
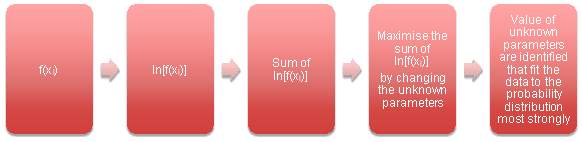
Figure 12: Maximum likelihood estimation process
The stage requiring maximisation of the log-likelihood function by changing the unknown parameters was completed using the solver function in Microsoft Excel. The results of the maximum likelihood estimation for each of the probability distributions are shown in Table 6.
Table 6: Values of parameters calculated through maximum likelihood estimation
| Probability Distribution | Unknown Parameter 1 | Unknown Parameter 2 |
| Rayleigh | δ = 253.48 | – |
| Gumbel | α = 9.37 | μ = 352.72 |
| Log-Normal | σ = 0.0347 | μLN = 5.88 |
3.6. Goodness-of-fit
From the three probability distributions investigated, one would fit more strongly with the tidal data than the others. Therefore, it was important to analyse the goodness-of-fit of each of the distributions to find out which was most appropriate to use for stress testing and calculating the return period.
- Tide Height Frequency Curve
Firstly, a visual assessment of the goodness-of-fit was undertaken for each of the probability distributions. This was done by plotting the tide heights, from the tidal gauge data, against their return period, calculated from the Gringorton’s plotting position. On the same axes, each distribution was plotted using the parameters calculated in Table 6. This allowed for a direct comparison between the real data and the probability distribution that was being used to model it. A 95% confidence interval was also plotted to account for the uncertainty in the probability distribution, due to the limited number of events it was based on. The upper and lower bounds for the 95% confidence interval are displayed in equation (12) and (13).
| Upper Bound= xT+ Z1-q2SxT | (12) | |
| Lower Bound= xT- Z1-q2SxT | (13) |
For the 95% confidence interval, q is equal to 5%, and the value of z0.975 is found from statistical tables to be approximately equal to 2. This assumes the uncertainty in the values is normally distributed. The standard deviation for the T-year design event, sxT was calculated differently depending on the distribution as shown in Table 7. The confidence interval was not required for the Rayleigh distribution because it became clear it was not a suitable distribution.
Table 7: Standard deviation of T-year design event for the Gumbel and Log-Normal distribution
| Probability Distribution | Standard deviation of T-year design event, sxT | |
| Gumbel | sxT = αn1.11+0.52yT+0.61yT2 | (14) |
| Log-Normal | sxT= xT2σ2n1+12zT2 | (15) |
- Rayleigh Distribution
It is clearly visible in Figure 13 that the tidal gauge data is not compatible with the Rayleigh distribution. There is no correlation between the distribution and the data, showing that it is not a suitable model for the annual maximum tide heights at Fukushima.
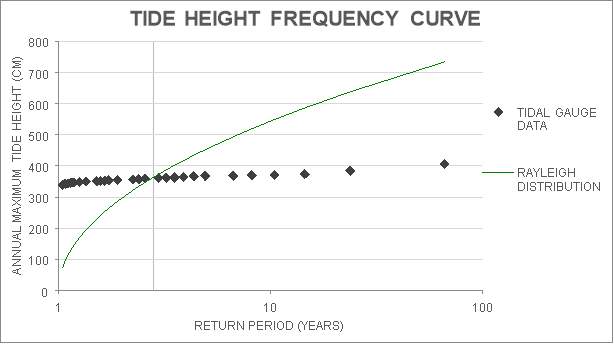
Figure 13: Tide Height Frequency Curve using the Rayleigh Distribution
- Gumbel Distribution
Figure 14 shows the strong correlation between the tidal gauge data and the applied Gumbel distribution. All of the tidal gauge data points, except one, are contained within the 95% confidence interval of the Gumbel distribution, so it is likely to be a good fit for modelling the tide height at Fukushima.
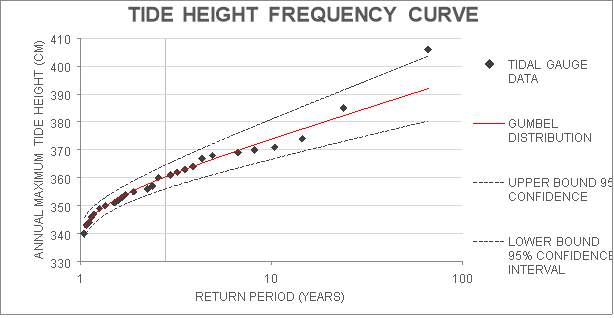
Figure 14: Tide Height Frequency Curve using the Gumbel distribution
- Log-Normal Distribution
Similarly to the Gumbel Distribution, the Log-Normal distribution also shows very strong correlation with the tidal gauge data. Figure 15 shows all of the data points, except one, lying within the 95% confidence boundaries of the Log-Normal distribution. The proximity of the data to the Log-Normal distribution line shows this would also be a suitable distribution to model the tide heights at Fukushima.
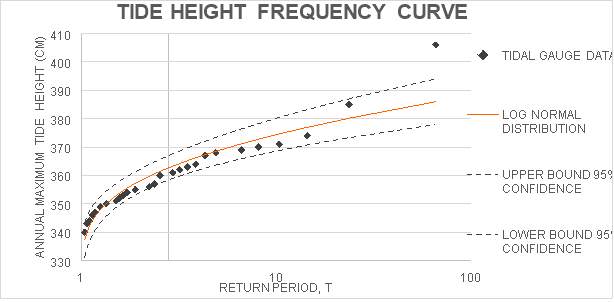
Figure 15: Tide Height Frequency Curve using the Log-Normal Distribution
- Gumbel Plotting Paper
To further distinguish between the goodness-of-fit of the Gumbel and Log-Normal distribution to the tidal gauge data, they were plotted on Gumbel probability paper. On Gumbel probability paper, the Gumbel distribution is plotted as a straight line, allowing for easier visual comparison to the data than the frequency curve. The Log-normal distribution would not plot as a curve on Gumbel probability paper, but could also be compared to the data simultaneously. Rather than plotting the tide height against the return period, on Gumbel probability paper, the Gumbel reduced variate is used on the x-axis instead. This is a transformation of the return period, T, to enable the Gumbel distribution to be plotted as a straight line. The Gumbel reduced variate, yT, is defined in equation (16).
| yT=-ln-ln1-1T | (16) |
Figure 16 shows the tidal gauge data fitting both the Gumbel and Log-Normal distribution extremely well. However, it is visible that the tidal gauge data has aligned more closely as a straight line as per the Gumbel distribution than the curve of the Log-Normal distribution.
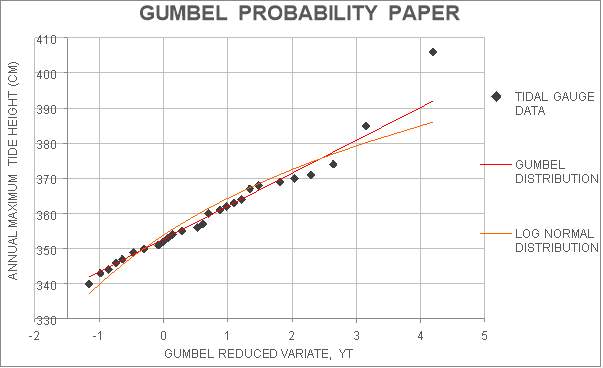
Figure 16: Comparison of the Gumbel and Log-Normal distributions on Gumbel Probability Paper
- Chi-squared test
Using the Gumbel plotting paper, it seemed as though the tidal data was slightly more strongly correlated with the Gumbel distribution. However, it was not clear enough to confidently make this conclusion, so another statistical test was undertaken to confirm this estimation. The χ2test for goodness-of-fit was undertaken for the Gumbel and Log-Normal distributions to give numerical values that could easily be compared. The χ2 value was calculated by separating the range of values in the data set into a number of bins with an observed value of events and an expected value of events for each bin. The upper bin level, xi, was found as the
ikquantile of each distribution as shown in Table 8. It is expected for the data to split equally between each of the bins if the distribution is a good fit for the data.
Table 8: The upper bin level for Chi-squared calculation
| Probability Distribution | Upper Bin Level, xi | |
| Gumbel | xi= μ- α-ln-lnik | (17) |
| Log-Normal | xi=expμLN+ σΦ-1ik | (18) |
For the tidal gauge data set with 37 values, 7 bins were chosen in order to carry out the χ2 test, where χ2 is defined in equation (19). The parameter k refers to the number of bins, and ni is the observed number of events in each bin.
| χ2= kn∑i=1kni- nk2 | (19) |
The value for χ2 was checked against the χ2 distribution with a significance level, αS, of 5% and 4 degrees of freedom. The degrees of freedom were calculated using equation (20).
| Degrees of freedom = k – p – 1 = 7 – 2 – 1 = 4 | (20) |
Where p was the number of estimated parameters, which was 2 for both the Gumbel and the Log-Normal distribution. For a χ2 distribution with 4 degrees of freedom and a 5% significance level, the upper bound value of χ2 for the distribution to be accepted as a suitable fit is 9.49.
Table 9: Calculated chi-Squared values for goodness-of-fit test
| Probability Distribution | Chi-squared value, χ2 |
| Gumbel | 1.41 |
| Log-Normal | 4.05 |
Table 9 shows that both distributions have a value of χ2 below the acceptable limit so they are both suitable. However, the χ2value for the Gumbel distribution is lower than for the Log-Normal distribution, which corresponds to a higher probability of goodness-of-fit according to the probability density function of the χ2 distribution. Consequently, the Gumbel distribution appeared to be the most well fitting distribution to the tidal gauge data and was used to model the tide heights at Fukushima during the experiments of this dissertation.
3.7. Inclusion of Historical Data
As stated in section 2.4, the exclusion of historical data in TEPCO’s risk assessment of the nuclear power plant was seen as a vital flaw in the design of the sea wall and may have been to blame for the extent of the disaster. Paté-Cornell (2012) argues that the inclusion of this information would have prepared the power plant better for the magnitude of the 2011 event. Therefore, the parameters of the distribution were estimated again including the historical data so then the effect of omitting this data on the stress test results could be assessed. This was a sensitivity test that allowed for further understanding of whether the event was a Black Swan or not, and which factors contributed to this.
Macdonald et al. (2014) specify a modified maximum likelihood estimation method to include historical data. Equation (21) shows the modified likelihood function where the likelihood is comprised of three elements to represent (a) the known tidal gauge data, (b) the events we cannot account for in the years between the historical events and the modern tidal gauge data, and (c) the known historical events. It is assumed that all events above the perception threshold are known, and therefore, the events in the unknown years are all of a lower magnitude than this threshold. This allowed for an estimation of the magnitude of events from the first historical tsunami event in 869 to the final annual maximum tide height from the tidal gauge data in 2010. By maximising the likelihood of those events all occurring, the parameters for the Gumbel distribution were calculated.
| L= ∏i=1nfxxinkTFxX0h-k∏j=1kfxyi
|
(21) |

Equation (21) includes use of both the probability density function and the cumulative density function for the distribution, which were specified in equation (7) and equation (8) respectively. The parameter h refers to the number of years between the first historical event and the first record from the modern tidal gauge data and kT references the number of events above the threshold value in that period.
The perception threshold, X0, was chosen as the value for which there was confidence that all the events exceeding this value were known. This meant that the formula would be able to accurately assume that all tide heights in the years with data missing were definitely below this value. The 1611 tsunami had a height of 690cm, which was considered to be a significant event compared to the usual tide heights from the tidal gauge data that ranges from 340 – 406cm. Therefore, it was assumed that any events with a magnitude greater than 690cm were known and anything below this value may not have been deemed significant enough to record as a historical event. As a result, the perception threshold was chosen to be 690cm. Sensitivity tests were carried out and within 100cm of this value, the value for α varied by less than 7%, therefore, 690cm seems like a suitable estimate for the perception threshold. Table 10 shows the parameter values calculated using the modified maximum likelihood function for the Gumbel distribution when historical events were considered too.
Table 10: Parameters for the Gumbel distribution, when historical events were included and a perception threshold of 690cm was used
| Probability Distribution | Unknown Parameter 1 | Unknown Parameter 2 |
| Gumbel | α = 33.67 | μ = 358.78 |
In order to plot this Gumbel distribution alongside the tidal gauge data and historical data, the return periods for this data was required. A revised formula for the plotting position was necessary because of the inclusion of the historical data. Instead of using Gringorton’s plotting position formula, the formulas of Bayliss and Reed (2001) were used.
| pi= r-αPkT +1-2αP kTn | (22) | |
| pi= kTn+n-kTnr-kT-αPs-e+1-2αP | (23) |
Equation (22) was applied to the tide heights above the threshold value, and equation (23) was for the tide heights below the threshold. The value of αP, the plotting-position constant, was taken as 0.44. The total number of years of the historical and modern data is symbolised as n, with kT as the number of tide heights greater than X0. The number of records from the modern tidal gauge data is shown as s in the formula and the number of values exceeding the threshold within this data are denoted by e.
Following the assignment of return periods to the modern tidal gauge data and the historical events, the frequency curve was plotted. Figure 17 shows how the curve for the Gumbel distribution has straightened out over the large scale of return periods covered. Although it is not a perfect fit, the data fits close to the 95% confidence band and it is clear to see how the distribution has accounted for the extreme events that were added.
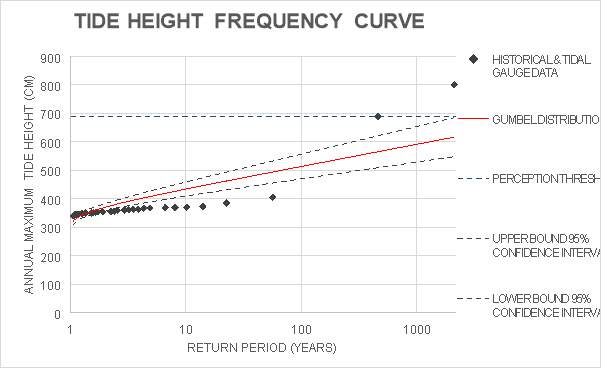
Figure 17: Frequency curve showing the Gumbel distribution fit to both the modern and historical data
By creating this plot with all the available information, it was possible to extrapolate and calculate a return period for the event in 2011. The magnitude of the 2011 event had a tide height 990cm, which is higher than anything on the plot so an extremely large return period would be expected.
3.8. Return Period
In addition to using the Gumbel distribution to model the tide height in the stress test, a probability distribution was assigned to the data in order to calculate the return period of the tide height of the 2011 tsunami. The quantile of the frequency distribution relates the magnitude of the T-year event to the return period, as shown in equation (24).
| xT= F-11-1T | (24) |
By incorporating the cumulative density function of the Gumbel distribution from equation (8) into equation (24), the tide height, xT, could be written as shown in equation (25).
| xT= μ+ αyT | (25) |
Where yT is a function of the return period, T, as specified in equation (16). Equation (16) was combined into equation (25) to find T as per equation (26).
| T= 1-exp-exp-xT- μα-1 | (26) |
This calculation was undertaken twice, using the different values for the parameters α and μ in order to compare the sensitivity of including and excluding the historical data.
3.9. Risk Over Design Life
Finally, the height of the sea wall was analysed by considering the risk of exceeding the design height over the design life of the nuclear reactor. The Fukushima Nuclear Power Plant began operating in 1970 and had reached its 40-year design life in 2010. This is the usual design life for a nuclear reactor but often they are reviewed and renovated in order to extend their licence for another 20 years. In 2010, the Fukushima nuclear reactors were granted a license extension of 10 years, giving them a total design life of 50 years (World Nuclear Association, 2016).
From this knowledge of the design life, it was possible to calculate the height of the wall required to minimise the chance of it being overtopped to 10%. Minimising the risk, rL, to 0 would be unrealistic and extremely expensive; therefore 10% is a reasonable value to aim for. The return period for the event that only had a 10% chance of being exceeded, during the 50 year design life, LD, was calculated using equation (27).
| T= 1-1-rL1LD-1 | (27) |
The corresponding tide height for this return period was found using the return period in equation (16) and inputting the yT value into equation (25).
3.10. Stress Test Design
Calculating the return period of the tsunami allowed for evaluation of the probability of that particular element of the disaster. However, to understand the probability of all the elements of the disaster occurring together, a stress test was required. This allowed for the contribution of the power failures discussed in section 3.2.4 to also be considered, which is useful because these are elements that may respond to human interaction and could be managed to prevent future accidents.
The stress test was designed by identifying all the different combinations of events that could have occurred at Fukushima nuclear power plant and their corresponding outcomes. This was largely configured using the information collected during the literature review. The literature review identified the different variables at each stage of the event to be the tide height from the tsunami, the external power supply, the back-up diesel generator power supply and the DC battery power. Each of these variables could have either had a failure or non-failure event during the 2011 disaster. These variables are described in Table 11 and a description is given of what the failure and non-failure event is for each of these systems.
Table 11: The variables in the 2011 Fukushima Nuclear Disaster
| Variable | Non-Failure Event | Failure Event |
| Tsunami Tide Height | Tide height < Height of sea wall | Tide Height > Height of sea wall |
| External Power Supply | No loss of external power | Loss of external power |
| Back-up Diesel Generator | No loss of diesel generator power | Loss of diesel generator power |
| DC Battery Power | No loss of battery power | Loss of battery of battery power |
The sequence of events that occurred at Fukushima in 2011 was shown in Figure 3, at every step in the process the variables failed. This describes the actual scenario that occurred but the other possibilities included some of the elements not failing and therefore, the situation being prevented. The scenarios that could have taken place are shown in Figure 18 and the probability of each of these scenarios was calculated through the stress test. Scenario 5 refers to the actual events in the 2011 nuclear disaster.
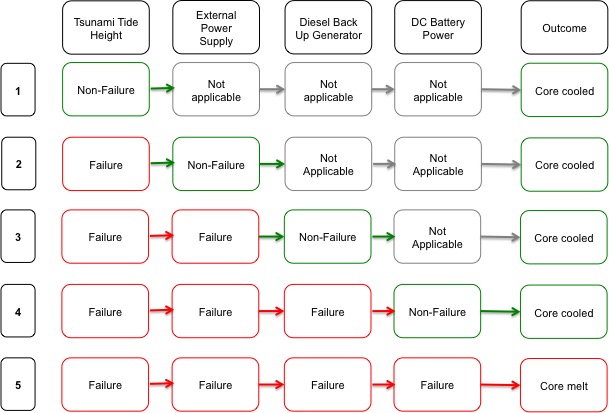
Figure 18: Scenarios that form the stress test of the 2011 Fukushima Nuclear Disaster
Each of these variables was considered independently from one another, so the probabilities of the different combinations of events occurring were calculated using simple event tree analysis. Therefore, the probability of a sequence of events occurring was found as the product of each of the individual events occurring, as described in the method shown in Figure 5.
The probability of the tsunami tide height overtopping the sea wall was calculated using the cumulative density function of the Gumbel distribution. The sea wall had a height of 5.7m (570cm) so this was inserted into equation (8) and used to find the probability of the tsunami tide height exceeding this as shown in equation (28). A sensitivity test was performed by considering the inclusion of historical data in comparison to the exclusion of the data. Therefore, the probability of the tsunami tide height exceeding the sea wall height was calculated twice by using the parameters of the Gumbel distribution found through the maximum likelihood estimation with the historical data included (Table 10) and without (Table 6). The values that were calculated are shown in Table 12.
| PX>570= 1-PX<570
= 1- exp-exp-570-μα |
(28) |
Table 12: Probability of tide height exceeding the sea wall
| Historical Data | Probability of Failure | Probability of Non-Failure |
| Included | 0.0019 | 0.9981 |
| Excluded | 8.504 x 10⁻¹¹ | 0.99999999991 |
The table shows that by including the historical data, the probability of failure increased by ten million times. Without the historical data, the probability of the tsunami overtopping the sea wall is close to 0, which shows why TEPCO had such confidence in their design of the power plant. This difference will have a significant impact on the results of the stress test.
The probability of failure of the different power sources were also incorporated into the stress test and the values were as calculated in section 3.2.4 and displayed in Table 4.
4. Results and Discussion
4.1. Return Period of Tsunami Event
The return period for the 2011 tsunami at Fukushima was calculated based on the information gathered from tidal gauge data and historical data. The return period was compared when the historical information was included and when it was not, to understand its impact on predicting the possibility of an event with the magnitude of the 2011 event. The nuclear power plant designers, TEPCO, were criticised for their exclusion of the historical data so it was important to assess whether this was a critical factor in the insufficient height of the sea wall protecting the power plant. The methodology specified in section 3.8 was followed to calculate the return period for the 2011 tsunami, which had a tide height of approximately 9.9m at Fukushima.
4.1.1 Return Period Excluding Historical Data
The return period was calculated using the parameters for the Gumbel distribution that were found based on the tidal gauge data only, specified in Table 6. The calculated return period excluding the historical data is shown In Table 13.
Table 13: Calculation of the return period of the 2011 event based on the modern tidal gauge data only
| Tide Height Magnitude, xT(cm) | Gumbel Reduced Variate, yT | Return Period, T (years) |
| 990 | 68.01 | Infinity |
The results show that the return period could not be calculated for this event, this was as a result of a ‘dividing by 0’ error. This shows that the annual exceedance probability, the inverse of the return period, for this magnitude event was close to 0. Therefore, the return period tended to infinity, indicating that the event was near impossible. This result supports the claim that the 2011 Fukushima nuclear disaster was a Black Swan event, because the return period is so high that a tsunami of this size could be considered possible. Therefore, it seems reasonable that this magnitude event was not considered during the design of the nuclear power plant.
- Return Period Including Historical Data
The return period was calculated a second time using the parameters for the Gumbel distribution that were found based on the tidal gauge data and the historical events identified in the literature review. The values of these parameters are specified in Table 10. The calculated return period with the historical data included is displayed in Table 14.
Table 14: Calculation of the return period of the 2011 tsunami tide height based on the tidal gauge and historical data
| Tide Height Magnitude, xT(cm) | Gumbel Reduced Variate, yT | Return Period, T (years) |
| 990 | 18.75 | 13.8 x 10⁷ |
The results show that by including the historical data, a value can be calculated for the return period of the 2011 tsunami tide height. However, the return period is extremely large, in the realm of hundreds of millions of years, which makes it very unlikely. To consider an event so unlikely in the design of the nuclear power plant would have been impractical and excessive. The size of the return period in relation to the typical design life of a nuclear power plant, 40 years, supports the tsunami event being a Black Swan.
- Conclusion
In conclusion, it is clear from the calculation of the return period, that the magnitude of the 2011 event was extremely unlikely. The design of a nuclear power plant would not reasonably or practically consider events of such large return periods. Although the inclusion of the historical data did have a significant impact on the calculated return period for the event, the return period still remained above what should be anticipated in design. Therefore, the criticisms of the design of the nuclear power plant that refer to the exclusion of the historical data as the cause of the disaster, appear to be invalid. Based on the low probability (rarity) and the extreme impact of the tsunami tide height, the calculation of the return period of the tsunami supports the classification of the 2011 nuclear disaster as a Black Swan.
4.2. Risk Over Design Life
The risk over the design life of the power plant was assessed using the methodology described in section 3.9. The aim was to calculate the required height of the sea wall for the probability of the tide height exceeding it to be limited at 10%.
Table 15: Calculation of the magnitude of the tide height for an exceedance risk of 10% over 50 years
| Probability of exceeding T-year design event | Design Life, L (years) | Return Period required, T (years) | Magnitude of T-year event, XT (cm) |
| 0.1 | 50 | 475 | 566 |
Table 15 shows that the required height of the sea wall for a risk of only 10% was 566cm. This confirms that the sea wall height of 570cm was a suitable size to protect the nuclear power plant during its design life of 50 years. Therefore, the sea wall height cannot be considered as a factor that could have prevented the 2011 disaster and can support the event being classified as a Black Swan.
4.3. Stress Testing
The stress testing was completed using the methodology as specified in section 3.9 and following the stress test design shown in Figure 18. The aim of the stress test was to work out the probability of the sequence of events that occurred in 2011 and use that to inform the classification of the event as a Black Swan or not. The test was completed twice with the inclusion of the historical data and without to further assess the sensitivity of omitting this data from the analysis.
4.3.1 Stress Test Excluding the Historical Data
The stress test configuration and results are shown in Figure 19. Failure events are displayed in red and non-failure events are shown in green. The probability of the tsunami tide height causing failure and non-failure were found in Table 12 and the power source’s failure and non-failure probabilities were found in Table 4.
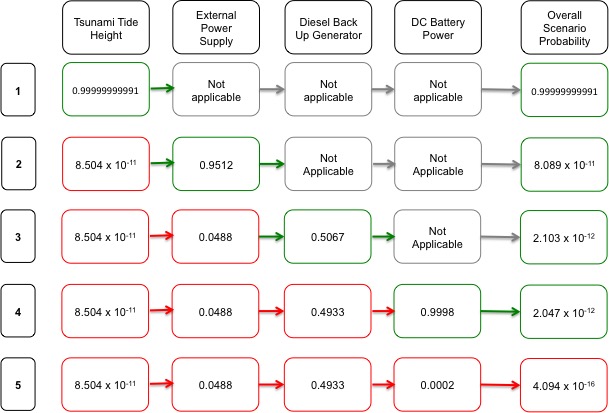
Figure 19: Stress test results without including the historical data
The results show that the probability of the tsunami tide height exceeding the sea wall was extremely small and as a result, any scenarios involving this event also have an extremely low probability. Therefore, scenario 5, which represents the actual events of the 2011 disaster, has a negligible chance of occurring. The probability is calculated as 4.094 x 10⁻¹⁶, which is far too small to consider as a possible outcome in the design of the nuclear power plant. Therefore, based on this stress test, the 2011 Fukushima nuclear disaster should be classified as a Black Swan.
4.3.2 Stress Test Including the Historical Data
The stress test was repeated using the probabilities of the tsunami tide height failure and non-failure events calculated with the inclusion of the historical data. The results in Figure 20 show the probability of each scenario based on the individual probabilities of each event that comprise the scenario. Failure and non-failure of each element are illustrated in red and green respectively.
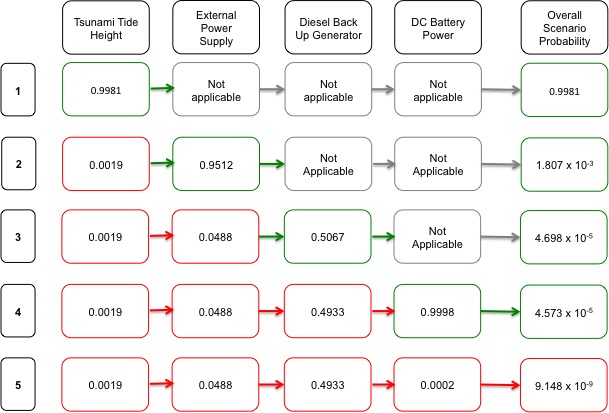
Figure 20: Stress test results with the inclusion of historical data
Similarly to the results excluding the historical data, the probability calculated for scenario 5 is extremely small. The value of 9.148 x 10⁻⁹ is too small to suggest that the event should have been anticipated beforehand and further supports the claim of the disaster being a Black Swan event. However, by including the historical data in the analysis, the probability of the event occurring became ten million times more likely. Therefore, this suggests that excluding historical data can have a significant impact on probability and risk analysis.
The stress test also displays the probability of failure of each element and allows for identification of the weak spots in the system. In comparison to the other elements, it is clear that the probability of failure of the diesel back up generator is 10 – 1000 times greater than the other elements. This shows that this is an area of the system that could be focused on and adapted to reduce the chance of a similar event. The stress test also highlights the DC battery as the element that is least likely to fail. However, it did fail during the 2011 event as a result of the flooding from the tsunami. This indicates weaknesses in the design of the system because the most reliable power source was not placed high enough to protect it from flooding damage.
5. Conclusions
5.1. The 2011 Fukushima Disaster
Throughout this dissertation, the 2011 Fukushima disaster has been assessed in order to determine whether the event should be classified as a Black Swan event or not. Although the case study refers to a past event, it was used to determine the usefulness of stress testing in Black Swan prediction.
As mentioned in the literature review, there is no consensus for whether this disaster should be classified as a Black Swan or not. The extreme magnitude of the tsunami was identified as an element in support of the event being a Black Swan. However, Paté-Cornell (2012) and Acton and Hibbs (2012) identified a number of flaws in the design of the nuclear power plant, which they believe were responsible for the disaster. The insufficient height of the sea wall protecting the nuclear power plant and the exclusion of historical data from the risk analysis were seen as preventable causes of the disaster.
However, the results show that neither of these elements were significant contributors to the probability of this event occurring. As described in section 4.2, the height of the sea wall was sufficient to provide protection to the power plant for the duration of its design life. Similarly, the return periods calculated for the tsunami tide height in section 4.1 show that the event was extremely rare and unlikely. The return period of a tsunami of that size was 138 million years, so it would have been unreasonable to expect the height of the sea wall to accommodate for such a rare event.
In addition, sensitivity tests were carried out to assess the impact of omitting the historical data from the risk analysis. The results showed that the return period of this tide height occurring did reduce from infinity to 138 million years, but this was still too unlikely an event to be considered in risk analysis. Similarly, the stress test to calculate the probability of the sequence of events that occurred in 2011 Fukushima nuclear disaster, made up of the tide height overtopping the sea wall and the numerous power failures, was completed with both the inclusion and exclusion of the historical data. Both values of the probability of the event were extremely small, even with the inclusion of the historical data. Therefore, it is not a sequence of events that would be considered a reasonable possibility and would need to be accounted for in design. However, the inclusion of the historical data did increase the probability of the event occurring by ten million times, even though it was still an extremely small number, the impact of including the data was significant. This emphasises that even though for this particular event it was not a contributor to the failure, this is something that should be considered in risk analysis. In other situations and types of infrastructure, predicting the probability of an event as ten million times less likely than it is could be catastrophic.
The results from the stress test show that the probability of the 2011 event, with the inclusion of the historical data, was 9.15 x 10⁻⁹ which corresponds to a return period of 109 million years. Considering the design life of the nuclear power plant was 50 years (World Nuclear Association, 2016), this kind of event seems unimaginable during the lifetime of the plant. Therefore, the stress test indicates that the Fukushima nuclear disaster was a Black Swan. This judgment is based on the small probability associated with the event but this emphasises the lack of clarity in classifying events. There is no quantitative definition for what a ‘small’ probability or ‘rare’ event is, so even if the probability was 1000 times bigger or smaller it may have no impact on its Black Swan categorisation. This highlights the subjective nature of classifying Black Swans and the difficulty in forming a universal framework for classification.
The criteria for a Black Swan requires the event to be rare, cause an extreme impact and become predictable in hindsight. The 2011 Fukushima disaster appears to fulfil this criteria; the 109 million year return period of the event would classify the event as rare. Furthermore, the evacuation of 300 000 residents from the area surrounding the plant due to the radioactivity released into the environment would qualify as an extreme impact (Acton, J., Hibbs, M., 2012). Finally, by completing this analysis, it is clear that the event became predictable in hindsight. However, predictable in this case refers to it being possible to calculate a probability for this event, not that it had a significant probability that made it more likely than was thought beforehand. By comparing this criteria laid out by Taleb (2007), it appears that the disaster should be classified as a Black Swan event. However, as mentioned in section 2.1, Runde (2009) recognises the dependence of the observer when classifying Black Swans. Although, the results of this dissertation emphasise the extreme and unlikely nature of the event, these probabilities may not seem as negligible to someone else. Moreover, people with greater knowledge of the nuclear industry and the 2011 Fukushima event may have a different understanding of the data presented. This dissertation does support the classification of the event as a Black Swan but it should be understood that this is a judgement and not an absolute classification.
By performing the stress test for this event, a number of weak spots in the design were highlighted. The process of formulating the stress test and gathering information, allowed for different components of the system to be compared and for the weakest parts to be recognised. It was clear to see which component of the event sequence had the highest probability of failure, the diesel back up generator, and the component that was least likely to fail, the DC battery. By identifying these components, the resilience of the design could have been improved. The diesel back up generator could have been replaced with another source that had a lower likelihood of failure and the DC battery that was very unlikely to fail, could have been placed at a higher position in the power plant to prevent it being flooded. This would have ensured that the most reliable power source was protected and therefore, maximised the security of power to the cooling systems. It is evident that the stress test is a useful tool in risk management. Besides calculating the probabilities associated with the potential scenarios in the nuclear power plant, it was able to display the system in terms of risk and display where the weaknesses lay in the system. This is extremely informative when trying to prevent a Black Swan event because it encourages resilient design of infrastructure.
5.2. Stress Testing
As discussed in section 2.5, Aven (2015) recommended scenario analysis in the form of stress tests, such as those performed in the finance industry, as the best way to understand and prevent Black swan events. He also recognised the ability for these stress tests to draw attention to the weaknesses in the system.
The process of completing stress testing of a system requires a lot of information in order to form a reliable and complete test that covers all the possibilities. The omission of potential scenarios is the reason why Black Swan events occur, so it is important to gather as much information as possible to inform the design of the stress test. This was recognised as a limitation of stress testing in the nuclear industry because there is insufficient data about failure sequences and component failure probabilities (The Nuclear Energy Agency, 1992). However, despite the lack of numerical data, the understanding of the system gained from producing and performing a stress test is invaluable. This tool would be a beneficial contribution to risk assessments because it encourages understanding of how failures occur and where weaknesses are. This may lead to more resilient designs and recognition of potential Black Swan events before they occur. Completing the procedure to classify Black Swan events after they have occurred would also be beneficial because it will give a greater understanding of the components involved in the failure and this can inform the design of future infrastructure,
Another limitation of stress testing is that it is restricted by the limits of the imagination. Black Swan events are unprecedented events that have not occurred before so they are difficult to predict. Therefore, in order to predict them beforehand, a degree of imagination is required to consider events that have never happened before. This may limit the extent to which Black Swans can be mitigated because they cannot be prepared for if their possibility is never considered. However, by performing a stress test and encouraging the recognition of all possible events, there is a greater chance of accounting for events that may otherwise become Black Swans.
Overall, through the performance of a stress test to analyse the 2011 Fukushima Nuclear disaster, it is apparent that this is a process that should be used in risk analysis. It allows for the probabilities of sequences and combinations of events to be calculated, rather than considering single events only. It also encourages quantification of the value of risk associated with highly unlikely events that may otherwise be omitted from risk analysis. In addition, it allows the resilience of the system to be assessed and understanding of the critical points in the system and encourages more robustness in design. These qualities are important in preventing and mitigating against Black Swan events. When using stress tests to assess past events, a stress test does not provide a clear framework for classifying Black Swans but it does encourage a thorough investigation of the event. By performing the stress test, the likelihood and predictability of the event will become apparent and allow for a reasonable judgement to classify the event. The subjective nature of the characteristics of a Black Swan makes it unlikely for there to be a single procedure for classifying all events, but instead they can be evaluated on a case-by-case basis using all the information found during the stress test. Therefore, stress testing should be encouraged in all areas of civil engineering to evaluate the risk of failure of infrastructure and as a tool to assist the classification of Black Swan events after they have occurred.
5.3. Black Swans
This dissertation has proven that defining a Black Swan is not necessarily something that can be defined quantitatively. There are many elements that contribute to Black Swan events and these need to be evaluated individually to inform a classification of the event. Therefore, rather than aiming to produce a framework to objectively classify a Black Swan, a framework should be formed to examine and assess potential Black Swan events. The process of creating and performing a stress test allows for enough examination and understanding of the event for a judgement to be made. There is no framework that could automatically classify such events as a Black Swan or not because there are so many factors which contribute to its classification and these will differ from case to case.
The focus should be on discovering as much information about the event to create a strong enough case to classify the event as a Black Swan or not. As shown in section 4.2.2, the exclusion of historical data from the risk assessment of the Fukushima disaster resulted in the probability being predicted as ten million times less likely than it would have been if it were included. Therefore, the most informed decision about an event being a Black Swan will include all the available information and this will give the best chance for prevention too.
In conclusion, it is clear that the term ‘Black Swan’ is an ambiguous one and its definition will vary from person to person. However, it is an area that requires more research because the impacts of Black Swan events occurring can be catastrophic. Therefore, it is worth trying to understand how they can be predicted and prevented because currently, there is very limited information. Risk analysis at present cannot account for unknown events but stress testing may be a way of improving the resilience of infrastructure design so it can cope better with Black Swans.
5.4. Limitations
There were a number of limitations to the methods used in this dissertation. Firstly, the processes involved in the 2011 Fukushima Nuclear disaster were simplified considerably and do not account for all the elements that contribute to a nuclear meltdown. Only the tide height of the tsunami and the power failures were considered and other contributors such as political bias, human error, the components of the cooling systems or the nuclear reactor were not included. This may have contributed to the extremely low probabilities calculated for the 2011 event because other elements of the system, which may have made the event more likely, were ignored in analysis. Similarly, the dependencies between different events were not considered. For example, the likelihood of a power failure would be much greater following a tsunami, but these events were considered independently in order to simplify the methodology. This will have resulted in an underestimation of the probabilities of the power failures and subsequently, the whole event sequence.
Furthermore, the modelling of the tide height at Fukushima was also simplified. Firstly, the tidal gauge station that provided the information, was located at Soma rather than at the Fukushima nuclear power plant. This was 45km away from the power plant, but the tide heights were assumed to be comparable. More significantly, the tide height data represented the normal day to day tide heights rather than for the tide height during tsunamis. This may have led to an overestimation of the return period for the tide height during the 2011 tsunami because it is unlikely that the tidal gauge station would have collected information during tsunami events. There were many instances where the tidal gauge data was invalid because the station was damaged during an extreme event such as a tsunami. It is understood that tsunamis are made up of complex systems but these were simplified in order to find single values for the tide height at Fukushima.
The limitations of this dissertation do undermine the accuracy of the probabilities calculated, but for the purpose of assessing the use of a stress test, the specific values were not the main aim. The objective was to evaluate the usefulness of applying a stress test in risk analysis and the simplified case study has enabled this to be achieved.
5.5. Recommendations
To summarise, this dissertation has used the case study of the 2011 Fukushima nuclear disaster in order to investigate the effectiveness of stress testing in predicting and classifying Black Swan events.
Through investigation of the event and the performance of a stress test, it appears that the 2011 Fukushima nuclear disaster should be classified as a Black Swan. The event could not have been reasonably expected or considered during the design of the power plant. The case study proved that stress testing provides a strong framework for assessing and examining potential Black Swan events. The process allows for identification of failure scenarios and their probabilities and also identifies weaknesses in the system. This should be used to inform the design of infrastructure and reduce the risk of failure. Although a stress test cannot predict unknown events, it encourages the consideration of events that have not occurred yet and may reduce the possibility of a Black Swan. In order to implement stress testing as a framework for classifying Black Swans, there should be a fixed amount of research and understanding of the event required before a judgement can be made. This will allow for a better-informed decision that is based on enough evidence to make a strong case.
Stress testing should be encouraged in civil engineering and emphasis should be made on the need for collection of data to inform stress tests. The benefits of stress testing are limited to the available information used to inform it. Therefore, if enough modern and historical information is gathered about failures in infrastructure and their associated probabilities, stress testing can become an accurate tool at classifying and mitigating Black Swan events. By increasing the available information about past failures, there will be fewer unknown scenarios left and less chance of an unexpected Black Swan occurring.
The vast uncertainty within the field of risk analysis means that further research should be encouraged. The large amount of assumptions and the vague criteria applied in risk management, means that resilience is the best defence for infrastructure. If unknown events cannot be predicted beforehand, it is important to design infrastructure that is resilient enough to cope with the unexpected.
References
Acton, J., Hibbs, M., 2012. Why Fukushima Was Preventable, 1st ed.Washington DC: Carnegie Endowment for International Peace.
Allan, J., Komar, P., Ruggiero, P., 2010. Increasing wave heights and extreme value projections: The wave climate of the U.S. Pacific Northwest. Coastal Engineering, 57, p539–552.
Aven, T., 2013. On The Meaning Of A Black Swan In A Risk Context. Safety Science, 57, p44-51.
Aven, T., 2015. Implications Of Black Swans To The Foundations And Practice Of Risk Assessment And Management. Reliability Engineering & System Safety, 134, p83-931.
Balakrishnan, N., Castillo, E., Hadi, A.S., Sarabia, J.M., 2004. Extreme Value and Related Models with Applications in Engineering and Science. Wiley.
Bayliss, A.C., Reed, D.W., 2001. The Use of Historical Data in Flood Frequency Estimation. Oxfordshire: Centre for Ecology & Hydrology.
Bissel, R., Jensen, S. and Feldman-Jenson, S., eds., 2016. Preparedness and Response for Catastrophic Disasters. CRC Press.
Board on Energy and Environmental Systems; Committee on Enhancing the Robustness and Resilience of Future Electrical Transmission and Distribution in the United States to Terrorist Attack; Division on Engineering and Physical Sciences; National Research Council, 2012. Terrorism and the Electric Power Delivery System. USA: National Academy of Sciences.
D’Onofrio, E.E., Fiore, M.M.E., Romero, I., 1998. Return periods of extreme water levels estimated for some vulnerable areas of Buenos Aires. Continental Shelf Research, 19, p1681-1693.
Faber, M., Stewart, M., 2003. Risk Assessment For Civil Engineering Facilities: Critical Overview And Discussion. Reliability Engineering & System Safety, 80(2), p173-184.
Google Maps, 2017. Map of the Tokyo Electric Power Co. Fukushima Daiichi Nuclear Power Plant [Online]. Google. Available from: https://www.google.co.uk/maps/place/Tokyo+Electric+Power+Co.+Fukushima+Daiichi+Nuclear+Power+Plant/@37.4213402,141.0258843,17z/data=!3m1!4b1!4m5!3m4!1s0x6020dd3801b3fc69:0xa6090708f3cbc4cd!8m2!3d37.421336!4d141.0280783 [Accessed: 21/03/2017].
Institute of Nuclear Power Operations (INPO), 2011. Special Report on the Nuclear Accident at the Fukushima Daiichi Nuclear Power Station. Atlanta: INPO, (11-005).
Japan Oceanographic Data Center (JOCD), 2015. Tide Station: Soma [Online]. Japan: Japan Oceonagraphic Data Center. Available from: http://jdoss1.jodc.go.jp/cgi-bin/1997/tide_data [Accessed: 26/11/2016].
Japan Oceanographic Data Center (JOCD), 2016. Sea Level Data [Online]. Japan: Japan Oceonagraphic Data Center. Available from: http://www.jodc.go.jp/data/tide/sea-level.html [Accessed: 26/11/2016].
Macdonald, N., Kjeldsen, T.R., Prosdocimi, I., and Sangster, H., 2014. Reassessing flood frequency for the Sussex Ouse, Lewes: the inclusion of historical flood information since AD 1650. Natural Hazards and Earth System Sciences, 14, 2817-2828.
Matsuzaki, A., Kirimoto, Y., 2008. Estimation of Component Failure Rates for PSA on 49 Japanese LWRs 1982-1997. Japan: Central Research Institute of Electric Power Industry.
National Geophysical Data Center / World Data Service (NGDC/WDS), 2015. Global Significant Earthquake Database, 2150 BC to present [Online]. National Geophysical Data Center. Available from: https://www.ngdc.noaa.gov/nndc/struts/form?t=101650&s=1&d=1 [Accessed: 12/02/2017].
Nuclear Energy Agency, 1992. Probabilistic safety assessment: an analytical tool for assessing nuclear safety [Online]. OECD. Available from: https://www.oecd-nea.org/brief/brief-08.html [Accessed: 25/03/2017].
Ozaki, T., 2011. Outline of the 2011 off the Pacific Coast of Tohoku Earthquake (Mw 9.0). Earth Planets Space, 67, p827-830.
Park, J., Seager, T.P., Rao, P.S.C., Convertino, M., Linkov, I., 2012. Integrating Risk And Resilience Approaches To Catastrophe Management In Engineering Systems. Risk Analysis, 33(3), p356-367.
Paté-Cornell, E., 2012. On “Black Swans” And “Perfect Storms”: Risk Analysis And Management When Statistics Are Not Enough. Risk Analysis, 32(11), p1823-1833.
Paulson, H.M., 2010. On The Brink, 1st ed. New York: Business Plus.
Runde, J., 2009. Dissecting the Black Swan. Critical Review, 21(4), p491-505.
Smits, G., 2011. Danger in the Lowground: Historical Context for the March 11, 2011
Tōhoku Earthquake and Tsunami. The Asia-Pacific Journal, 9 (20).
Taleb, N.N., 2007. The Black Swan: The Impact of the Highly Improbable. New York: Random House.
Templeton, T., Lumley, T., 2002. Statistics From 9/11 And The Aftermath. [Online]. The Guardian. Available from: https://www.theguardian.com/world/2002/aug/18/usa.terrorism [Accessed 13 Dec 2016].
The Health and Safety Executive, 1992. The Tolerability of Risk from Nuclear Power Stations. London: HMSO.
Tokyo Electric Power Company (TEPCO), 2009. The Energy Situation and Stable Energy Supply [Online]. Japan: TEPCO. Available from: http://www.tepco.co.jp/en/challenge/csr/sustainability/energy-e.html [Accessed: 12/03/2017].
World Nuclear Association, 2016. Nuclear Power in Japan [Online]. Available from: http://www.world-nuclear.org/information-library/country-profiles/countries-g-n/japan-nuclear-power.aspx [Accessed 04/11/16].
Cite This Work
To export a reference to this article please select a referencing stye below:
Related Services
View all


Related Content
All TagsContent relating to: "Engineering"
Engineering is the application of scientific principles and mathematics to designing and building of structures, such as bridges or buildings, roads, machines etc. and includes a range of specialised fields.
Related Articles

DMCA / Removal Request
If you are the original writer of this dissertation and no longer wish to have your work published on the UKDiss.com website then please: