Effects of Fatty Acid Composition and Microstructure of Fats and Oils on Cookie Quality
Info: 7940 words (32 pages) Dissertation
Published: 9th Dec 2019
Tagged: Food and Nutrition
EFFECTS OF FATTY ACID COMPOSITION AND MICROSTRUCTURE OF FATS AND OILS ON COOKIE QUALITY
Abstract
The fatty acid composition and microstructure properties of butter, hydrogenated fat, palm oil, coconut oil, groundnut oil, and sunflower oil were analyzed. Sunflower oil was found the most unsaturated oil with 88.39 % USFA content while coconut oil was the most saturated oil with 91.2 % SFA content and palm oil has almost equal saturated (50.45 %) and unsaturated fatty acid (49.55 %) composition. The microstructure was also observed by the latest Laser microscopy technique in order to understand the differences in morphology of fats and oils microstructures. According to the microscopic images, microstructure size of all fats and oils were ranged from 2 to 20 m being the largest for coconut oil microstructures and the smallest for palm oil microstructures. It was observed that the cookie dough containing sunflower oil had relatively softer dough while hydrogenated fat produced the stiffest dough. The results revealed that the dough prepared using oils were more cohesive, adhesive and softer. Sunflower oil was reported to produce cookie of more spread and stiff texture whereas cookie prepared by hydrogenated fat had least spread. Statistical analysis depicted that palmitic acid and oleic acid induced a positive correlation with dough hardness (r = 0.550, 0.576) respectively. It was inferred from the data that the spread ratio, which is one of the important quality parameters had the highest correlation with LA (r = 0.836), followed by SFA and USFA (r = -0.749, 0.749), and PA (r = 0.686). Breaking strength, which is a major textural parameter, was significantly and positively related to USFA(r = 0.834) and LA (r = 0.792), highlighting higher breaking strength values delivered by cookies containing sunflower oil and groundnut oil. Statistical analysis revealed that the size of the fat and oil microstructure had a relationship with their functional performance in cookie making, indicating a positive correlation of microstructure size with cookie dough density (r = 0.792). Among all fatty acids, palmitic acid content and linoleic acid content were the most important parameter to predict cookie quality.
Keywords: FAC, Fats/oils, cookie, dough rheology, cookie quality, microstructure
Introduction
Fats and oils are indispensable constituents in baked products and baked products serve as one of the staple food. Some of their pivotal functions include improving palatability, assisting in lubrication of the various components, incorporating air, adding moisture barrier, producing structures, and increasing shelf-life of the products (Nor Aini et al., 1989).In baking, the specific properties of the fat are important because of the fact that fats are directly incorporated into the dough. Besides to the nutritional profiles, fats and oils are selected according to their specific performance in the finished product (Wainwright, 1999). During processing, fats and oils influence air incorporation, lubrication and heat exchange in the baked products (Wainwright, 1999; Baldwin et al., 1971; Ghotra et al., 2002; Rogers, 2004). For consumers, textural characteristics of fats that emanate from their molecular states are of prime concern. Food texture is influenced by fats by developing structures of crystalline networks and by interruption of the structure by intervening with non-fat systems.
Polymorphism is the quite significant feature of oils and fats. Morphology of fat and oil microstructures plays a decisive function in the ultimate qualities of fat products (Heertje and Leunis, 1997). Smaller crystals will provide a smoother texture while larger crystals may result in a grainy texture (Rodriguez. et al., 2001). The morphology of fat crystals (microstructures) can affect the rheological behavior and melting profile (Mulder and Walstra, 1974). Microstructural studies of fats are emerging as significant subject, since with the understanding of the microstructure, a more sophisticated sense of the product qualities and ways to influence these can be carried out (Juriaanse and Heertje, 1988). The mechanical attributes of edible fats can be affected by a set of aspects, involving solid fat content (SFC), the polymorphism of the solid phase as well as the microstructure of the network of crystalline particles (Marangoni and Narine, 2002). The solid-like behavior of plastic fats is owing to the existence of a fat crystal network (Marangoni and Narine, 2002). All selected fats and oils are edible and used in cooking, bakery, and confectionary.
Fats and oils are multicomponent mixes of triacylglycerols (TAGs) with specific properties that are considered important in foods. The functionality of fats and oils in the finished product depends on their fatty acid composition (FAC). It is imperative to consider the fatty acid composition and the morphology of microstructures of fats and oils order to further predict their functionality in more complicated food systems. Therefore, this research was conducted to assess the fatty acid composition and morphology of microstructures of butter, hydrogenated fat, palm oil, coconut oil, sunflower oil, and groundnut oil. These characteristics influence the physicochemical qualities of the end food products. Therefore, it is of immense significance to examine these properties of fats and oils. Relatively little work has been done on the relationship among these properties of fats and oils. The present investigation was undertaken to investigate the same.
Materials and Methods
Materials
Six different types of edible fat and oil samples were examined both from plant and animal origin. Palm oil was obtained from Ruchi Soya Industries Ltd., Gurgaon. Butter (Amul), hydrogenated fat (Dalda), sunflower oil (Nature Fresh), groundnut oil (Dhara), and coconut oil (Parachute) were procured from local retailers.
Fatty Acid Composition (FAC)
Fatty acid composition of fresh vegetable oils was investigated by using GC–MS (Thermo Scientific TRACE 1300). Fatty acid methyl esters were obtained by transesterification of fats and oils with methanol: toluene: SO4H2 (88:10:2 v/v) at 80 °C for 1 h. 1μL of FAME sample was injected into the gas chromatograph. GC separation was conducted on a capillary column (TG-5ms). The carrier gas was nitrogen and the column flow rate was 1.0 mL·min–1. Initially, the oven temperature was calibrated at 165 °C for 2 min, increased from 165 to 305 °C at a rate of 2 °C·min–1 and then maintained at 305 °C for 5 min. The temperatures of the injection port and detector were 240 and 250 °C, respectively. The peaks were identified on the chromatogram according to retention data from analyzed standard samples run under the same operating conditions. The results were expressed as relative percentages of total FA.
Microstructure Morphology of Fats and Oils
The newest technique was used to study the microstructure’s morphology of all samples. The crystal morphology of the butter, hydrogenated fat, palm oil, coconut oil, groundnut oil, and sunflower oil, crystallized under static conditions at 25℃ was observed by Nikon Real-Time Laser Scanning Confocal Microscope (Model A1R). The fat samples were melted at 80℃ for 10 min. A small droplet of about 20 μL of the melted fats was placed on a glass slide preheated to 80℃. A pre- heated glass cover slip was carefully placed over the sample to produce a film of uniform thickness. The slides were incubated for 24 h at 25℃ in a temperature-controlled cabinet.
Cookie Preparation and Evaluation
Cookies were prepared with slight modification to standard method 10-50D of AACC (2000) using flour (100 g), sodium bicarbonate (2.0 g), salt (1.5 g), skim milk powder (10 g), shortening (50 g), sugar (45 g) and water according to requirement. Shortening and sugar were mixed to cream followed by mixing of flour, sodium bicarbonate and skim milk powder to form dough. The dough was kneaded and sheeted to a uniform thickness of 5 mm and cut using a circular die of 60 mm diameter. Baking was carried out at 205°C for 15 min in the baking oven. The cookies were cooled and stored in airtight containers. Cookie preparation was done in triplicate.
Textural Analysis of Cookies Dough
The cookie dough was prepared in a Hobart mixer according to AACC Approved method 10-50D (American Association of Cereal Chemists, 2000) with slight modifications. The textural characteristics of the cookie dough were analyzed using a texture analyzer (TAXT2i Stable Micro Systems, Surrey, UK) equipped with a 5-kg load cell in compression mode with a cylindrical probe (25 mm diameter). Pretest and posttest speeds were 2.0 mm/sec, while test speed was 1.0 mm/sec. Cookie dough piece of 50 cm diameter and 10 cm height was used to measure the hardness, adhesiveness, cohesiveness, and springiness. The force required to compress the dough by 80% was recorded and the average value of six replicates is reported. The above experiments were conducted at ambient temperatures.
Physical Analysis of Cookies
Cookies were subjectively evaluated for diameter, thickness, spread ratio, and density, Diameter, and thickness of six cookies were measured with a vernier caliper at two different places in each cookie and the average was calculated. The spread ratio was calculated by dividing diameter (mm) by the thickness (mm). The density was determined according to the method used by Hasmadi et al., (2010) using solid replacement technique. A container of known weight and volume was filled with rapeseed and excess rapeseeds were trimmed off slowly. The bottom of the container was covered with rapeseed and biscuit of measured weight was placed in the container with the flattest surface downwards. The container was filled with rapeseed and the total weight was measured. For every cookie, the mean of six determinations was taken as the density.
Textural Analysis of Cookies
The texture of cookies was determined by using texture analyzer (TA-XT2i, Stable Micro Systems, UK) in a compression mode in terms of the breaking force required to fracture the cookies using the three-point bending test. The probe used was Knife Edge Insert (HDP/BS) with 5 kg load cell Heavy Duty Platform (HDP/90) at pre-test speed, test speed and post-test speed of 2.5, 2.0 and 10.0 mm/s respectively with a data acquisition rate of 400. The peak force, an index of cookie break strength, was measured for at least eight cookies per batch.
Statistical analyses
The experimental data collected was analysed for significant differences with the help of analysis of variance (ANOVA) conducted using SPSS 16.0 software. The correlation matrix was obtained using SPSS 16.0.
Results and discussion
Fatty acid composition
A very important parameter of the vegetable oils is the degree of unsaturation of the fatty acids that are present in the chemical structure of the oil (Lazos and Kalathenos, 1988). The functional properties of commercial fats/oils are closely related to their fatty acid composition. Both the physical and chemical characteristics of fats are influenced greatly by the kinds and proportions of the component fatty acids.
The fatty acid composition of fats and oils, improve the understanding of the fats and oils quality, stability and applicability. Table 1displayed the fatty acid composition obtained for all six samples. The results express the average of two determinations and are in accordance with the limits found in the literature. A range of major saturated and unsaturated fatty acids was presented in all fats and oils. The percentage of the total saturated fatty acid content changed from 11.61 % (sunflower oil) to 91.2 % (coconut oil) of the eight fatty acids determined, three were unsaturated. Palm oil presented almost equal composition of saturated and unsaturated fatty acids, with 42.14 % as palmitic acid. Coconut oil was found most saturated one and lauric acid alone constitute 59.36. So, coconut oil is also known as lauric acid. The major part of the saturated fatty acids in coconut oil were medium-chain fatty acids (MCFA) (>59 %). Oleic (C18:1) and linoleic (C18:2) acids were the major unsaturated fatty acids present in all oils, being the others present only in trace amounts. Among the evaluated fats and oils the highest contents of saturated fatty acids were found in the coconut (91.2 %). Sunflower oil had the highest content of unsaturated fatty acids (88.39 %) and followed by groundnut oil by possessing 80.55 % unsaturated fatty acids.
Butter’s fatty acid composition is important for several reasons. It contains butyric acid (18 %). The significant amount of short-chain fatty acids contributes to butter’s quality as a softer fat with a lower melting point. This, in turn, ensures a quick flavour release when melting, which is desirable in numerous foods. Hydrogenated fat also possessed a considerable amount of oleic acid (44.32 %) and palmitic acid (39.46 %) followed by butter by possessing 24.56% of palmitic acid.
Soft oils like groundnut oil and sunflower oil which are rich in unsaturated fatty acids can easily oxidize, thus they become chemically unstable. As a rule, the increase in the saturated fatty acid content of soft oils reduces the degree of chemical oxidation. Hard oils such as palm oil and coconut oil that are generally composed of triglycerides containing two or three saturated fatty acids may be a solid or semi-solid state at ambient temperatures.
Table 1 Fatty acid composition (%) of fats and oils
| Amount (%) | ||||||
| Fatty Acids | Butter | Hydrogenated fat | Palm Oil | Coconut oil | Groundnut oil | Sunflower oil |
| 4:0 (Butyric acid) | 18±0.08 | – | – | – | – | – |
| 12:0 (Lauric acid) | 3.58±0.03 | 0.37±0.00 | 0.4±0.07 | 59.36±0.15 | – | 0.7±0.00 |
| 14:0 (Myristic acid) | 18.99±0.07 | 0.42±0.07 | 1.1±0.04 | 11.39 | – | 0.87±0.00 |
| 16:0 (Palmitic acid) | 24.56±0.07 | 39.46±0.09 | 42.14±0.13 | 7.76±0.02 | 10.23±0.07 | 5.29±0.02 |
| 18:0 (Stearic acid) | 9.07±0.02 | 7.25±0.04 | 4.4±0.01 | 1.7±0.02 | 4.78±0.01 | 4.75±0.05 |
| 18:1 (Oleic acid) | 18.09±0.11 | 44.32±0.06 | 38.23±0.2 | 6.49±0.02 | 36.20±0.34 | 11.37±0.08 |
| 18:2 (Linoleic acid) | 1.6±60.04 | 0.26±0.00 | 10.78±0.02 | 1.91±0.04 | 19.83±0.07 | 73.24±0.35 |
| 18:3 (Linolenic acid) | – | – | – | – | 24.52±0.07 | – |
| Other Minors | 6.05±0.07 | 7.92±0.14 | 2.95±0.00 | 11.39±0.06 | 1.98±0.02 | 3.78±0.04 |
| SFA | 80.25 | 47.50 | 50.45 | 91.2 | 19.45 | 11.61 |
| USFA | 19.75 | 52.5 | 49.55 | 8.8 | 80.55 | 88.39 |
Values are reported as the average ± standard deviation of the replications. Means followed by the same letter within a line indicate significant difference (p 0.05) by Tukey’s test.
SFA- Saturated fatty acids; USFA- Unsaturated fatty acids
Microstructure Morphology
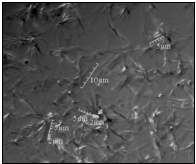
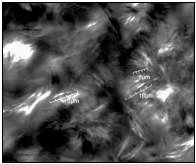
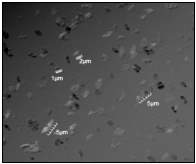
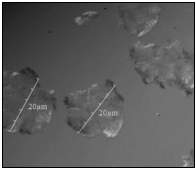
The microstructure was additionally observed by the latest Laser microscopy technique to figure out the peculiarities in the morphology of fats and oils microstructures. Plastic fats consist of a three-dimensional network structure of crystals in which liquid oil is trapped. The plasticity of a fat is determined by the shape, average size and size distribution of the crystals (Chawla and De man, 1990). The characteristics of shortenings, such as spread ability, hardness, and mouth feel, are highly dependent on the structure of the underlying fat crystal networks (Marangoni and Narine, 2002 2002). Watanabe et al., (1992) found that the crystal size was important for the quality of the final products. Characteristics of crystal size are very important in the consistency and acceptability of the final product. Small crystals can form a more rigid product and crystals that were 30–200 μm in size cause a sandy mouth feel. Meanwhile, Piska et al., (2006) and Narine and Marangoni, (1999b) observed that the size of the β′ (beta prime) crystal was 1–5 μm, and the size of the β (beta crystal was 20–100 μm. Smaller and finer beta prime crystals can stabilize more air and more liquid component than larger and coarser beta crystals (Podmore, 2002).The larger crystal size increases the interaction between the particles, decreasing the value of solid fat content and reducing the crystals formed in space (Rye et al., 2005). Coconut oil, groundnut oil, sunflower oil and hydrogenated fat had beta from. Butter and palm oil possessed beta prime polymorphic form.
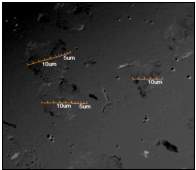
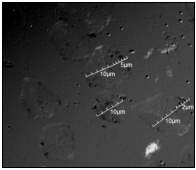
After concluding the previous research of macroscopic physical properties of solid lipids, Narine and Marangoni (1999) found that compared with other crystallization behaviours, the microstructure of fat is more significant to the macroscopic physical properties. According to the microscopic images, microstructure morphology of all fats and oils were different. Fig.1 showed that the microstructure size ranges from 2 m to 20 m. The microstructure size in palm oil was found the least (1-5 m) which implies the presence of beta prime crystals only and shape of microstructures were found small rod-shaped and randomly arranged, which can hold a massive volume of air. The microstructural network of palm oil was less dense (Fig. 1C) than that of butter and hydrogenated fat (Fig. 1B) but much denser than other oils. Butter crystal ranged from 5-10 m as shown in Fig 1 A. Crystals are long needle-like, opaque framed and tightly packed.
(A)
(B)
(C)
(F)
(D)
(E)
Fig. 1 Microscopic Microstructure Morphology of Butter (A), Hydrogenated Fat (B), Palm Oil (C), Coconut Oil (D), Sunflower Oil (E), and Groundnut Oil (F)
Hydrogenated fat contained crystal of the same size that of butter i.e. 5-10 m but crystal network is most dense showing highest crystal interactions. Coconut oil had the largest crystal size (20 m) and symmetrically arranged (Fig 1D). Sunflower oil and groundnut oil crystal’s had same size 10-15 m, ovule shaped, and scattered as observed in Fig 1E and F. In coconut oil, sunflower oil, and groundnut oil independent, few and larger crystals with no crystal interactions were found and it results into the poor creaming performance of these oils. It is might be due to their highly unsaturated fatty acid composition in the case of sunflower and groundnut oil. Although, coconut oil is most saturated oil and possessed the largest crystals. So, crystal size is not solely dependent upon fatty acid composition. Larger crystals 20-30 m gives the sandy impression to the tongue.
Cookie Dough Rheological Properties
Rheological properties of wheat flour dough is essential for the successful manufacturing of baked products because they affect the behavior of dough during mechanical handling, thereby influencing the quality of the finished product (Khatkar et al., 2002a, b). Handling properties of the dough especially during the kneading and sheeting procedure showed visible differences. Subjective observation showed that during dough preparation, the dough made with sunflower oil was too soft to handle and difficult to sheet and mould. The TPA results (Hardness, adhesiveness, cohesiveness, springiness) of the six types of fats and oils are summarized in Table 2.
Table 2 Effect of Fats and Oils on the Rheological Characteristics of Cookie Dough.
| Fat/Oil | Hardness (N) | Adhesiveness (N/s) | Cohesiveness | Springiness |
| Butter | 7.07b | -85a | 0.59a | 0.37a |
| Hydrogenated fat | 13.5f | -110b | 0.61a | 0.40a |
| Palm oil | 7.56c | -304d | 0.93b | 0.89c |
| Coconut oil | 8.75e | -256c | 0.95c | 0.90d |
| Groundnut oil | 7.72d | -344e | 0.94b | 0.85b |
| Sunflower oil | 5.03a | -446f | 0.95c | 0.92e |
Values with the same letter are not significantly different (p < 0.05).
It can be interpreted from the results that different fats and oils significantly influenced the textural properties of cookie dough. Among the different types of fat and oil used, hydrogenated fat was found to produce the hardest dough (13.5 N). On the other hand, dough prepared by sunflower oil was the softest (5.03N). These results are in accordance with Manohar and Rao, (1999); Mamat and Hill, (2014), and O’Brien et al., (2003), they reported that hydrogenated fat produced the hardest dough in comparison to bakery shortening and oil.
Fats having higher solid component produce stiffer dough. Baltsavias et al., (1997) reported that stiffness of cookie dough markedly decreased when fat content of the dough was decreased, or when liquid oils were substituted for solid fats. This explains the lower hardness observed in dough containing sunflower oil and groundnut oil. When the liquid oil is used in the dough, it gets dispersed on mixing all through the dough in the form of miniature globules, which are far deprived effective in their shortening and aerative performance. Manohar and Rao, (1999) also investigated that difference in dough hardness produced by fats and oils was due to variation in the solid fat index (SFI), which is the empirical value of SFC. Fats having a higher SFI produced stiffer dough. Adhesiveness is a surface property and depends on a combined effect of adhesive and cohesive forces. The adhesiveness ranged from 85 to 446 N/s being maximum for sunflower oil and the minimum for butter. Again, adhesiveness of oils was observed higher than fats, indicating their sticky nature.
Cohesiveness followed a similar trend to adhesiveness. It was evident from the results that the dough samples containing oils were more cohesive than fats. Sunflower oil and coconut oil were most cohesive. On the contrary, butter was least cohesive. Cohesiveness was a measure of the difficulty in breaking down the internal structure. Gluten network is formed by strong inter and extra disulphide bonds which provide resistance to breakdown which in turn leads to increase in cohesiveness. It has been well acknowledged that fats and oils play a shortening function in the dough by eliminating gluten development via breaking the continuity of the protein and starch structure. It possibly attributes to inferior shortening ability of oils that enhanced dough resistance. Cookie dough prepared using sunflower oil had the highest springiness) whereas butter had the least springiness. Springiness values describe the recovery behavior between two cycles. The present study revealed that the dough made with oils is more cohesive, adhesive and softer. Similar results were reported by Manohar and Rao, (1999) and Jacob and Leelavathi, (2007), they reported that dough samples made with oil were generally more cohesive and viscous, thus softer.
- (b)
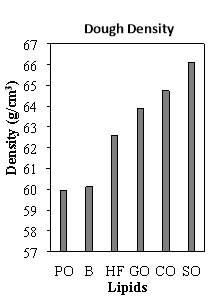
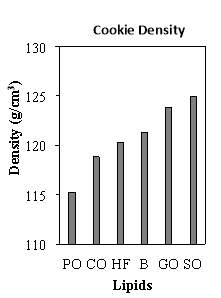
Fig. 2 Effect Palm oil (PO), Hydrogenated fat (HF), of Butter (B), Coconut oil (C), Groundnut oil (GO), and Sunflower oil (SO) on the Density of Cookie Dough (a) and Cookie (b).
Manohar and Rao, (2002) investigated that density is the best predictor of the sensory texture of biscuits. Lower density means greater crispiness and higher textural value. Fig. 2 (a) depicts that the cookie dough made with sunflower oil had the highest density whereas palm oil had the least value for density. These observations are in accordance with Baltsavias et al., (1997). Oils do not have the capability to keep the air until mixing is finished. The insignificant volume of air leads to deprived volume of the dough and end product and consequently results into higher dough density It can also be speculated here that the cookie dough containing oil was less aerated because unlike the solid or plastic fats liquid oil do not aid in aeration of the dough or batter in which they are present (Pyler, 1988). Dough density depends on the type of fat and oil used. The Less aerated dough is denser than aerated dough resulting in the stiffer dough.
Dough density and cookie density did not follow the similar trend. Butter had comparable dough density to palm oil whereas butter exhibited much higher density than palm oil in a final baked cookie. Among these oils palm oil had the highest SFC (Devi and Khatkar, 2017) which leads to more air incorporation at the dough stage (Maache-Rezzoug et al., 1998) and expansion of the gas cells during baking is more pronounced (Pareyt et al., 2009b).
Subjective observation during dough preparation with butter, hydrogenated fat, palm oil, and coconut oil in the Hobart mixer showed that the fat and sugar form a very light, fluffy, well-aerated cream and with the addition of flour transformed into a soft dough. Whereas, sunflower oil and groundnut oil resulted into heavy, poor aerated cream, oil smear out the sugar.
Cookie Quality
The results regarding physical parameters of cookies are presented in Table 3. Cookie diameter was significantly affected by different fats and oils (Table 3). Cookie diameter varied from 87.00 to 91.65 mm among cookies made using different fats and oils. The diameter was found to be the highest in sunflower oil cookies while lowest in cookies made using butter. Jacob and Leelavathi, (2007) reported that cookie diameter was higher for sunflower oil and lesser for hydrogenated fat. Similar results were observed in this study. Oils were proved to be the greater source of variation in cookie diameter. No remarkable difference was observed in diameters in cookie prepared with palm oil and coconut oil. However, results are in contrast with Abboud et al., (1985) who reported that with the use of oil there was not any noticeable increase in the diameter of the cookies.
Table 3 Effect of Fats and Oils on the Cookie Quality.
| Cookie Quality | ||||
| Fat/Oil | Diameter (mm) | Thickness (mm) | Spread Ratio (D/T) | Breaking Strength (kg f) |
| Butter | 87.00a | 8.40c | 10.36b | 3.04b |
| Hydrogenated fat | 88.50bc | 8.60e | 10.29a | 3.03a |
| Palm oil | 89.25d | 8.44d | 10.57cd | 3.06b |
| Coconut oil | 88.00b | 8.35a | 10.54c | 3.12c |
| Groundnut oil | 91.25e | 8.35a | 10.93e | 5.19d |
| Sunflower oil | 91.65ef | 8.30b | 11.04ef | 5.21e |
Values with the same letter are not significantly different (p < 0.05).
Results revealed that the effect of different fats and oils on the thickness of cookies was insignificant (Table 3). The thickness of cookies ranged from 8.30 to 8.60 mm. The results of present study are in accordance with the previous studies conducted by Pareyt et al., (2009) who reported thickness ranged from 7.1 to 9.9 mm. Cookie thicknesses were the highest in cookies made using hydrogenated fat while it was the lowest in cookies made by using sunflower oil. These observations were in agreement with Jacob and Leelavathi, (2007) who reported that there was non-significant effect of fat types on cookie thickness. Similar investigations were also reported by Manohar and Rao, (1999) who reported that no significant difference was observed in thickness of biscuits made of hydrogenated fat and oil. Though, cookie thickness was observed to be higher for cookies prepared from fats and lower in oils.
Generally, expansion due to leavening and the flow rate of the cookie dough affects cookie spread (Hoseney and Rogers 1994). Cookie spread, in turn, affects cookie height. After cookie dough is put in the oven, it starts to expand until it reaches its setting time (the point at which the dough stops spreading due to protein coagulation and starch gelatinization). Previous research suggests that lipid type is not an essential variable for cookie spread (Rogers 2004; Vetter et al., 1984). However, it does affect cookie spread by providing a lubricant effect, which in turn affects flow rate. The effect of different fats and oils on cookie spread factor was found to be significant (Table 3). Spread ratio of cookies ranged from 10.29 to 11.04. The mean value for spread ratio was the highest in sunflower oil followed by groundnut oil cookies while the lowest spread values were observed in cookies made from hydrogenated fat. Basically, the earlier the lipid melts during the baking process, the larger is the cookie spread and flatter cookie produced. Therefore cookies made from liquid oils, such as sunflower oil and groundnut oil used in this study, tend to have larger spreads and lower heights. The results of the present investigation are in line with the previous findings (Jacob and Leelavathi, 2007; Mert and Demirkesen, 2016). The result showed that cookies containing sunflower oil had relatively higher spread value. Cookies containing palm oil and coconut oil had similar spread values. On the other hand, a cookie containing butter had significantly less spread comparable to hydrogenated fat. The present observations are in contrast to the findings by Finney et al., (1950) and later Abboud et al., (1985), who concluded that fat type is not an important variable for cookie spread. The cookie breaking force showed significant differences for different fats and oils. Breaking force of cookies ranged from 3.03 to 5.21 kg f. Measurement of the breaking strength showed that cookies containing oils were the hardest. On the other hand, breaking strength of cookies containing the palm oil, butter, and hydrogenated fat was not significantly different from each other. It was of interest to observe here that hardness of the dough (Table 2) did not necessarily control the texture of the cookies (Table 3). As observed earlier cookie dough containing hydrogenated fat was the hardest and the least dough hardness was observed for that containing sunflower oil. The texture of the cookie dough containing sunflower oil was similar to that containing the butter. In contrast, cookies made using sunflower oil were the hardest while those containing the butter were the lesser hard. Abboud et al., (1985) also reported that it is not possible to obtain a satisfactory creamed mass with oil due to improper aeration. Greethead, (1969) claimed that more plastic and smooth textured the fat greater it’s shortening power. Softer the worked fat, lower the breaking strength of the cookies.
Interrelationship of Fatty Acid Composition and Microstructure Characteristics of Fats and Oils Rheology of Cookie Dough
Correlations of thermal characteristics of different fats and oil with the cookie dough rheological parameters and cookie quality are summarized in Table 4. There is scanty number of research data that studied the effect of fatty acid composition and microstructure properties properties of fat and oils on the cookie dough properties.
The impact of fat on dough elastic properties has been related to lubrication, which limits the formation of a gluten network (Maache-Rezzoug et al., 1998). The resultant dough is referred to as short dough. The rheological characteristics of dough are critical as they affect the handling and processing of the dough as well as the quality of the final products. Dough that is too firm or too soft will not process satisfactorily on the appropriate dough forming equipment and will not yield a satisfactory product (Wade, 1988).
The rheological attributes of dough are vital because they influence the handling and processing of the dough in addition to the quality of the ultimate products. Palmitic acid, oleic acid, and SFA was observed to induce a positive correlation with dough hardness (r = 0.550), (r = 0.576) ( r = 0.247) while linoleic acid and USFA contributed negatively to dough hardness as indicating by their negative link (r = -0.641, and r = -0.247 ) respectively. Lauric acid, myristic acid, stearic acid, and microstructure size did not demonstrate any significant link with dough hardness. It can be concluded form the results that SFA of fats and oils favored dough hardness. These results were expected as sunflower oil had most unsaturated fatty acid composition (Table 1) and produced the softest dough as shown in Table 2. It can be inferred that dough hardness does not solely depend upon the FAC. As; coconut oil had the heights SFA (Table 1) whereas cookie dough hardness prepared by using coconut oil was much lesser than hydrogenated fat, butter, and palm oil which have lower SFA than coconut oil. SFA and USFA had an inverse correlation with dough and cookie quality parameters. Adhesiveness, which is a surface property, linked negatively with fatty acids expect USFA which induce positive impact on dough adhesiveness (r = 0.670). Microstructure size (MS) displayed poor positive link with dough adhesiveness. It may be concluded from the above statistical analysis that the unsaturated nature of liquid oils contributed to their sticky nature. Similar results were found earlier by Mamat and Hill, (2012) who observed that oils produced dough with higher adhesiveness Cohesiveness, springiness, and cookie density influenced by FAC and MP characteristics of fats and oils in similar trend with adhesiveness. MS was observed to exhibited strong positive influence on the cookie dough density (r = 0.792).
Association of Fatty Acid Composition and Microstructure Characteristics of Fats and Oils with Cookie Quality
Fat and oil is the foremost ingredient responsible for tenderness, mouthfeel, lubricity, flavor, spread, general product appearance and shelf life. Cookie spread is the most eminent quality characteristic. Bigger cookie diameter and greater spread are the alluring quality features in cookies (Yamamoto et al., 1996). Correlations of major fatty acids, saturated fatty acid content, unsaturated fatty acid content and microstructure size (MS) of fats and oils with the cookie quality have been summarized in Table 4.
Cookie density established negative correlation with palmitic acid (r = -0.686), and saturated fatty acids (r = -0.575) whereas positive association with linoleic acid (r = 0.625) and USFA (r = 0.575). These results were expected. Higher palmitic acid content supports higher air incorporation during mixing stage, air leaves during baking make cookies less dense and consequently lowered the density of final baked cookies. Results reflected that unsaturation composition of fats and oils elevated cookie density. Due to higher USFA composition of sunflower oil and groundnut oil (Table 1) conferred higher cookie density as presented in Fig. 2 (b) which is undesirable sensory texture quality parameters for cookies.
Cookie diameter, which is crucial cookie quality parameter. Larger diameters are desirable for superior cookie quality. These results shown in Table 6.2 reflected that most of the fatty acids linked negatively to the cookie diameters except LA and USFA which associated positively to the cookie diameter ( r = 0.799, r = 0.928 respectively). However, OA and MS did not demonstrate any marked relationship with diameter. Again, LA and USFA indicating unsaturation level of fats and oils. It is worth to mention here that though coconut is oil yet displayed lower diameter than other oils as shown in Table 3. This may be probably attributed to the least USFA composition of coconut oil (1). Previous study reported that oil conferred higher diameters than fats Jacob and Leelavathi (2007), similar results reported in this research work (Table 3). Whereas, among oils which factor controlled their baking performance was not completely clear.
Cookie thickness followed the opposite trend with diameter. Cookie thickness exerted a pronounced alliance with PA (r = 0.840), SA (r = 0.455), and OA (r = 0.727). LA and MS induced a negative correlation coefficient with cookie thickness (r = -0.580) and (r = -0.491) respectively. Higher spread ratio is the prime desirable cookie quality property. Most of the FAC parameters contributed negatively to the cookie spread. Cookie spread was favoured by LA (r = 0.836), USFA (r = 0.749), and MS (r = 0.312). These observations are in line with Zhong et al., (2014), who reported that when cookie dough formulated with a shortening with more crystallized material and smaller crystals results in the lower spread.
Table 4 Correlation Matrix for Cookie Quality and FAC and Microstructure Properties of Fats and Oils
| Dough Rheological Properties | Cookie Quality | ||||||||||
| HD | AD | CH | SP | DD | CD | D | T | SR | BS | ||
| FAC | LuA | ns | ns | 0.304* | 0.301* | 0.338* | -0.267 | -0.376* | -0.267 | ns | -0.312* |
| MA | ns | -0.570* | -0.430* | -0.427* | -0.325* | ns | -0.768** | ns | -0.478 | -0.486* | |
| PA | 0.550* | -0.548* | -0.515* | -0.490* | -0.802** | -0.686* | -0.430* | 0.840** | -0.686* | -0.671** | |
| SA | ns | -0.635* | -0.878** | -0.877** | -0.545* | 0.204 | -0.334* | 0.455* | -0.437* | ns | |
| OA | 0.576* | -0.238 | -0.278 | -0.296 | -0.470* | -0.263 | ns | 0.727** | -0.252 | ns | |
| LA | -0.641* | 0.804** | 0.483* | 0.505* | 0.630** | 0.625* | 0.799** | -0.580* | 0.836** | 0.792** | |
| SFA | 0.247 | -0.670* | -0.345* | -0.336* | -0.408* | -0.575* | -0.928** | ns | -0.749** | -0.834** | |
| USFA | -0.247 | 0.670* | 0.345* | 0.336* | 0.408* | 0.575* | 0.928** | ns | 0.749** | 0.834** | |
| MP | MS | ns | 0.260 | 0.403* | 0.374* | 0.792* | 0.386* | ns | -0.491 | 0.312* | 0.303* |
**,* Significance at p <0.01 and p <0.05, respectively.
FAC- Fatty acid composition; MP- Microstructure properties; LuA: Lauric acid; MA: Myristic acid; SA: Stearic acid; PA: Palmitic acid; OA: Oleic acid; LA: Linoleic acid; SFA: Saturated fatty acid; USFA: Unsaturated fatty acid; MS: Microstructure size; HD- Dough hardness; AD- Dough adhesiveness; CH- Dough cohesiveness’ SP- Dough springiness, DD- Dough density; CD- Cookie density; D-Diameter; T-Thickness; SR- Spread ratio; BS- Breaking strength.
The size of the fat and oil microstructure has a significant relationship with their functional performance during baking. As smaller crystals have a more surface area compared to bigger ones and so is more capable of holding massive amounts of liquid oil inside the crystal network. Lauric acid, which is major fatty acids in coconut oil, did not exert any noticeable correlation with cookie thickness. Thickness was negatively influenced by MA (r = -0.478), PA (r = -0.686), SA (r = -0.437), and SFA (r = -0.749). The hardness of the cookies measured in terms of breaking strength increased as the LA content and USFA content increased as indicated by their positive correlation with BS (r = 0.792) and (r = 0.834) respectively, highlighting higher breaking strength values delivered by cookies containing sunflower oil and groundnut oil. It was also observed that as the microstructures size increased, the cookie breaking strength, which is major textural parameter also increased (r = 0.303). This was probably due to the fact that larger microstructures size could not hold air and led to the stiff texture of the cookie. It has been found that small and firmly knit crystals have superior creaming capability (Baldwin et al. 1971; Pyler 1988). Cookie breaking strength was negatively associated with LuA (r = -0.312), MA (r = -0.486), and SFA (r = -0.834). Stearic acid and oleic acid content did not contribute significantly to cookie hardness.
Higher values of Palmitic acid contributed to softer cookies as indicated its negative association with cookie hardness (r = -0.671). It is well known that palmitic acid contributed to superior creaming ability of fats and oils. Higher the air incorporation during mixing stage, air leaves during baking consequently softer cookies resulted. In this study, it was evident from the data obtained that fats and oils with different fatty acid composition and microstructure size influenced remarkably the cookie dough properties and cookie quality parameter. It can be concluded from the results obtained that sunflower oil and groundnut oil characterized as unsaturated oils by gas chromatography had harder cookie texture which makes them unsuitable for cookie preparation. The desirable cookie texture which includes a relatively softer bite was reported dependent on the higher proportion of saturated fatty acids, and smaller microstructure size as observed in hydrogenated fat, butter, and palm oil cookies.
Conclusion
Fat is an important ingredient in baking products and it plays many roles in providing desirable textural properties of baking products, particularly cookies. TPA results showed that the type of oil significantly influenced dough textural properties. Cookies made from semi-solid fats (butter and hydrogenated fat) and oils (palm oil and coconut oil) are quite different from those made with liquid oils (groundnut oil and sunflower oil). Hardness measurement showed that cookies produced with sunflower oil and groundnut oil had higher breaking force. Cookies made from sunflower oil had the highest spread while hydrogenates fat cookies had the least spread. Oils were observed to bring about the greatest changes in rheological characteristics of dough and quality of cookie. Fatty acid composition, as well as microstructure morphology, implied a significant variation among the fats and oils samples in terms of lauric acid, palmitic, linolenic acid, saturated and unsaturated fatty acid contents, size and structural network of microstructures. Sunflower oil and groundnut oil characterized as unsaturated oils by gas chromatography were found unsuitable for cookie preparation in term of a harder cookie texture. The desirable cookie texture which includes a relatively softer bite was observed to be associated with higher proportion of saturated fatty acids, and smaller microstructure size which was observed in palm oil, hydrogenated fat, and butter and led to soft cookies. The quality aspects studied here are crucial for selecting the suitable fat and oil for cookie preparation. Functional characteristics of fats and oils may further clarify the differences which make the fats and oils perform better for cookie preparation.
Cite This Work
To export a reference to this article please select a referencing stye below:
Related Services
View all


Related Content
All TagsContent relating to: "Food and Nutrition"
Food and Nutrition studies deal with the food necessary for health and growth, the different components of food, and interpreting how nutrients and other food substances affect health and wellbeing.
Related Articles

DMCA / Removal Request
If you are the original writer of this dissertation and no longer wish to have your work published on the UKDiss.com website then please: