Diet Quality and BMI of Women with Low incomes
Info: 6845 words (27 pages) Dissertation
Published: 6th Jul 2021
Tagged: HealthFood and Nutrition
Abstract
Obesity is a public health problem that disproportionately affects low-income populations. Moreover, participation in the Supplemental Nutrition Assistance Program (SNAP) has been associated with obesity among low-income women.
The goal of this study was to determine the impact of intrapersonal, home environment, community and social factors on diet quality and body mass index (BMI) of low-income women participating in SNAP.
This study also aimed to examine the role of these factors in mediating the relationship between food insecurity and diet quality, and BMI.
A total of 152 women receiving SNAP benefits were recruited from low-income neighborhood centers and housing communities, and administered a demographics questionnaire, the United States adult food security scale, food frequency questionnaire, and multi-dimensional home environment scale (MHES).
They also were measured for height and weight to calculate BMI.
The Dietary Guidelines Adherence Index 2015 was used to measure diet quality. Regression analyses were conducted to determine the MHES subscales that were significant predictors of diet quality and BMI.
The Preacher and Hayes mediation model was used to evaluate the mediation of the relationship between food insecurity and diet quality, and BMI by the MHES. Emotional eating resistance and favorable social eating behaviors were positively associated with diet quality; whereas emotional eating resistance, lower availability of unhealthy food at home, neighborhood safety and favorable social eating behaviors were inversely associated with BMI in women participating in SNAP. The MHES significantly mediated the relationship between food insecurity and BMI.
These results emphasize the importance of intrapersonal, home environment, community and social factors in mediating the relationship between food insecurity and BMI in low-income women.
Keywords: Food insecurity; diet quality; body mass index; low-income women; home environment
Introduction
The Supplemental Nutrition Assistance Program (SNAP), formerly known as the Food Stamp Program, is the largest food assistance program in the United States (U.S.). Households with a gross income of ≤130% of the Federal Poverty Level are eligible to receive benefits from this program to purchase food (1).
In contrast to the Special Supplemental Nutrition Program for Women, Infants and Children (2), the SNAP does not require purchasing of foods that are aligned to the Dietary Guidelines for Americans.
Moreover, adult SNAP participants have been reported to consume diets of lower quality characterized by fewer whole grains and more red meat, potatoes and fruit juice as compared to income-eligible nonparticipants (3).
Additionally, the majority of research has shown that women participating in SNAP have a greater risk for obesity (4-7). Thus, it is important to identify determinants of diet quality and weight status in this population of women.
The Social Ecological Model (SEM) was used as the theoretical basis for this study since it proposes that health behaviors are governed by a variety of intrapersonal, home environment, community and social factors (8). The intrapersonal component was the first aspect to be explored within the context of the SEM.
Factors to be studied within this domain included emotional eating resistance, self-efficacy, healthy eating attitudes and mindless eating. Eating in response to emotion and environmental cues, rather than hunger, was selected as it negatively impacts diet quality and body mass index (BMI) of low-income women (9).
Self-efficacy, the confidence in one’s abilities to engage in a certain action (10), also is as a key predictor for adopting healthful practices associated with weight loss (11, 12) and management (13).
Another critical factor is a positive attitude towards healthy eating, as this has been strongly correlated to BMI of low-income women (14).
Finally, mindless eating has been associated with consumption of greater than intended quantities of food (15), and also may influence diet quality and weight status.
The second major component of the SEM considered was the home environment, as it plays a vital role in shaping health behaviors.
The home is critical for nutrition, as a major portion of energy intake is accounted by home food sources (16), and the type of foods available are key determinants of dietary intake (17). Gorin et al. have shown that availability of healthy foods at home was lower, and that of unhealthy foods was higher, in overweight individuals when compared to those who were normal weight (18).
Additionally,perceptions of thecommunity environment, such as physical characteristics of the built environment and neighborhood safety were evaluated in this research since low-income populations often reside in neighborhoods that may limit opportunities for physical activity (19, 20).
Finally, social factors such as regulation of family meals, social eating, social support, and descriptive norms for healthy eating were included due to their associations with dietary behaviors (21).
The primary goal of the study was to assess the influence of intrapersonal, home environment, community and social factors on diet quality and BMI of female SNAP participants.
This objective tested the hypothesis that favorable intrapersonal, home environment, community and social factors will be associated with better diet quality and lower BMI in women.
Food insecurity is a public health problem that affects economically disadvantaged households (22). Although the SNAP has been successful in reducing food insecurity in the U.S., more than half of SNAP-participating households remain food insecure (23). Since food insecurity has been shown to adversely affect dietary intake and weight status in women (24-31), it is important to explore mediators of this relationship. Willis et al. have provided evidence for non-nutritional mechanisms that link food insecurity and weight status in children (32).
However, relatively little is known about the pathways by which food insecurity impacts dietary intake and weight status in women. A secondary goal was to explore how intrapersonal, home environment, community and social factors mediated the relationship between food insecurity and diet quality, and BMI in women participating in SNAP. Additionally, the mediating influence of diet quality on food insecurity and BMI was explored.
Materials and methods
Study design and participants
A convenience sample of 152 women was recruited for this cross-sectional study. Recruitment was conducted in a total of nine low-income neighborhood centers and housing communities in Central Texas. Anthropometric measurements and questionnaire administration were conducted at these sites. Primary enrollment criteria included: participation in the SNAP program, ages 18-50 years old, and Hispanic, non-Hispanic White or African-American ethnicity. Participation in the SNAP program for any other ethnicity was estimated to about 1% in Texas (33). In order to focus on the predominant ethnic groups, this factor was used as an enrollment criterion.
This study was granted an exempt status by the Institutional Review Board at The University of Texas at Austin, based on 45 46.101 (b)(2) Code of Federal Regulations. Participation in the study was voluntary and informed consent was obtained from all.
Instruments and data collection
Participants were measured for height and weight, and administered the demographics questionnaire, food frequency questionnaire (FFQ), and Multi-dimensional Home Environment Scale (MHES). In addition, women completed the U.S. Adult Food Security Scale. A monetary incentive was provided to participants to complete the study. All the questionnaires were made available in English and Spanish. Bilingual graduate and undergraduate research assistants were involved in the data collection process.
Anthropometrics
A stadiometer (Health O Meter, McCook, Illinois) and digital weighing scale (Health O Meter, McCook, Illinois) were utilized to measure height and weight, respectively. BMI, calculated as weight (kg)/height (m) 2, was used to group women according to their weight status. A BMI of ≤24.9 kg/m2, 25-29.9 kg/m2, and ≥30 kg/m2 indicated healthy, overweight and obese status, respectively.
Demographics
A demographics questionnaire (34) tailored to a population of low-income women was modified to collect information pertaining to age, household size, number of children, ethnicity, monthly income, and amount of monthly benefits received from SNAP.
Food frequency questionnaire
A 95-item FFQ that has been evaluated for validity and reliability in a sample of women in SNAP was used to collect dietary intakes (35). The mean validity correlation between the FFQ and reference instrument was 0.61; whereas, the test-retest correlation between the two FFQ administrations was 0.66.
The FFQ was based on a reference period of one week, with frequency options ranging from never or less than once per week to 2+ times per week. It has been shown that SNAP participants experience intra-month variations in their dietary intakes (36-39). Thus, an FFQ based on a reference period of one week was used in an effort to reduce recall bias in participants.
This FFQ was interviewer-administered four times; a 1-week interval was used between each administration in order to obtain dietary intake reflective over a period of four weeks. Interview-completion of the FFQ was conducted due to greater validity of this approach over self-administration (40). The serving size options of the FFQ were small, medium, large and extra-large.
Trained nutritionists provided detailed instructions and showed food models and measuring cups and spoons in order to facilitate estimation of portion sizes. The FFQs were checked for completeness and accuracy.
Dietary quality
The Dietary Guidelines Adherence Index 2015 (DGAI 2015) (41) was used as a measure of diet quality. A score from 0 to 19 was assigned based on adherence of dietary intakes to 20 main dietary recommendations. Of the 20 subgroups, 11 components of the DGAI 2015 assess energy-specific food intake recommendations (fruits, dark green vegetables, red/ orange vegetables, legumes, starchy vegetables, other vegetables, variety of fruits and vegetables, grains, meat and beans, dairy and added sugar); and nine components evaluate healthy choice nutrient recommendations (whole grains, fiber, total fat, saturated fat, cholesterol, low fat dairy, low fat meat, sodium and alcohol).
The Estimated Energy Requirement (EER) for each individual was calculated from one of the eight United States Department of Agriculture (USDA) energy patterns, ranging from 1800-3200 kcal (41). The maximum possible score that represents the healthiest diet in this scale is 19. The 95-item FFQ addressed all of the DGAI 2015 components that were related to energy-specific recommendations. Line items in the FFQ were classified into food groups, according to the DGAI 2015. Intake for each food group was determined by multiplying the daily frequency of consumption of individual foods in the food group by the chosen serving size, and summing across individual foods. FoodWorks 17 software (Long Valley, NJ) (42) was used for calculation of nutrient data.
This program includes nutrient information for 40,000 foods from databases such as the USDA Standard Reference 27 (43), Food and Nutrient Database for Dietary Studies (44) and the Canadian Nutrient File 2010 (45). Scores were assigned to each component of the DGAI 2015 by linear equations (46), and summed to represent the diet quality for each week of the FFQ administration. The diet quality was then averaged over four weeks to calculate the overall diet quality score.
Multi-dimensional Home Environmental Scale
The MHES was created to comprehensively measure intrapersonal, home environment, community and social domains from the perspective of mothers and their adolescent children (47, 48). The performance of this instrument was evaluated in a sample of 114 mother-child dyads, and demonstrated high construct validity, internal consistency reliability(α=0.83) and test-retest reliability (r=0.91) (47). The version of the MHES developed for mothers was slightly modified in order to exclude subscales that assessed the relationship between the mother and adolescent. The resulting questionnaire was applicable to women with and without children, and was utilized for this research.
The intrapersonal component of the MHES includes the subscales: emotional eating resistance, self-efficacy, healthy eating attitudes, and mindless eating. Subscales used to assess the environmental influence were availability of healthy foods at home and availability of unhealthy foods at home, as measured by questions related to household availability of specific food items.
Physical characteristics of neighborhood and neighborhood safety also were used to assess the environmental domain. The former subscale referred to the availability of recreational space within the built environment; whereas the latter subscale indicated women’s perceived safety of their neighborhood. Finally, social aspects of the scale comprised of questions related to regulation of family meals (i.e. perceived importance of family meals), social eating (i.e. healthy eating behaviors while in the company of family and friends), social support (i.e. support provided by family and friends for healthy eating) and descriptive norms (i.e. perceptions of health-related behaviors of other individuals).
The questions were based on a Likert scale with response options ranging from ‘Strongly agree’ to ‘Strongly disagree’, and scores ranging from 1 to 5. Items were reverse coded, as necessary, such that a lower score indicated a less favorable environment. For example, a response of ‘Strongly agree’ to an item that represents ‘availability of unhealthy foods at home’ was provided a score of 1.
The response to each item within a subscale was summed to calculate the subscale score. Thus, a lower score for the subscale, availability of unhealthy foods at home, is indicative of higher availability of these foods in the home environment. Furthermore, the percentage score for each MHES subscale was calculated using the formula: (Score obtained/ Maximum possible score)*100.
United States (U.S.) Adult Food Security Scale
Food security status of participants was evaluated by the U.S. Adult Food Security Scale (49). The summation of affirmative responses to the ten questions in the scale represented the total score, with higher scores representing lower food security. Women with scores ranging from 0 to 2 were classified as food secure; whereas, those with scores between 3 and 10 were categorized as food insecure.
Statistical analyses
Descriptive statistics were utilized to indicate demographic characteristics. A univariate regression was conducted using the MHES subscale scores as the independent variable and diet quality as the dependent variable (Model 1). In model 2, a multiple regression was conducted, using the MHES subscale scores as predictor variables and diet quality as the outcome variable. The standardized β coefficient and p-value for each subscale were determined. Independent variables with p
The intrapersonal, home environment, community and social subscales of the MHES were aggregated to indicate the total score. A mediation analysis was conducted to explore the relationship between food insecurity and diet quality, and BMI, using the total MHES score as the mediator variable. The Preacher and Hayes mediation model (50, 51) was chosen for this analysis since it utilizes the bootstrapping technique and does not assume a normal distribution for the indirect effect.
This analysis consisted of food security status as the independent variable, diet quality as the dependent variable, and the total MHES score as the mediator. Another analysis was performed using food security status as the independent variable, BMI as the dependent variable, and the total MHES score as the mediator. Additionally, diet quality was used as the mediator variable to explore the relationship between food security status and BMI in a separate analysis.
The following conditions were tested in order to develop the mediation model: 1) significant association between the independent and mediator variables; 2) significant association between the independent and outcome variables; and 3) significant association between the mediator and outcome variables.
If the above criteria were met, the total, direct and indirect effects of the model were analyzed. Total and direct effects denote the influence of the independent variable on outcome before and after inclusion of the mediator, respectively; whereas indirect effects represent the effect of the independent variable on mediator multiplied by that of the mediator on the outcome. All analyses were performed using the Statistical Package for the Social Sciences (SPSS 22, Armonk, NY, 2013).
Results
Demographic characteristics
The demographics of the study participants are shown in Table 1. The sample was predominantly Hispanic with age ranging from 19 to 50 years. The average household size and number of children in the household were 3.4 and 1.9, respectively. Monthly income and amount of benefits received from SNAP ranged from 0 to $3000 and $16 to $570, respectively. The proportion of women classified as healthy, overweight and obese, according to BMI, were 28.9%, 36.2% and 34.9%, respectively. The average BMI of the population was 29.6 kg/m2.
| Demographic characteristic | Median±SDa |
| Age, yrs | 35±8.30 |
| Household size | 3±1.39 |
| Number of children | 2±1.11 |
| Monthly income, $ | 1402±732.71 |
| Amount of benefits received from SNAPa, $ | 240±111.53 |
| Body mass index, kg/m2 | 28.6±6.51 |
| Ethnicity | % |
| Non-Hispanic White | 10 |
| Hispanic | 72 |
| African American | 18 |
Table 1. Demographic characteristics of women participating in Supplemental Nutrition Assistance Program (n=152)
Diet quality
Multi-dimensional radar plots were utilized to illustrate the percentage of participants demonstrating compliance for the “food intake” and “healthy choice” components of the DGAI 2015 (Figures 1a and 1b). A score of ≥ 0.5 of the maximum score was used to represent greater compliance to DGAI 2015 components, and was reported for 31%, 4.2%, 45.1%, 31.7%, 7.7%, and 23.2% of participants for fruits, dark green vegetables, red/orange vegetables, legumes, starchy vegetables, and other vegetables, respectively (Figure 1a).
A second plot showed that the proportion of participants with lesser compliance (
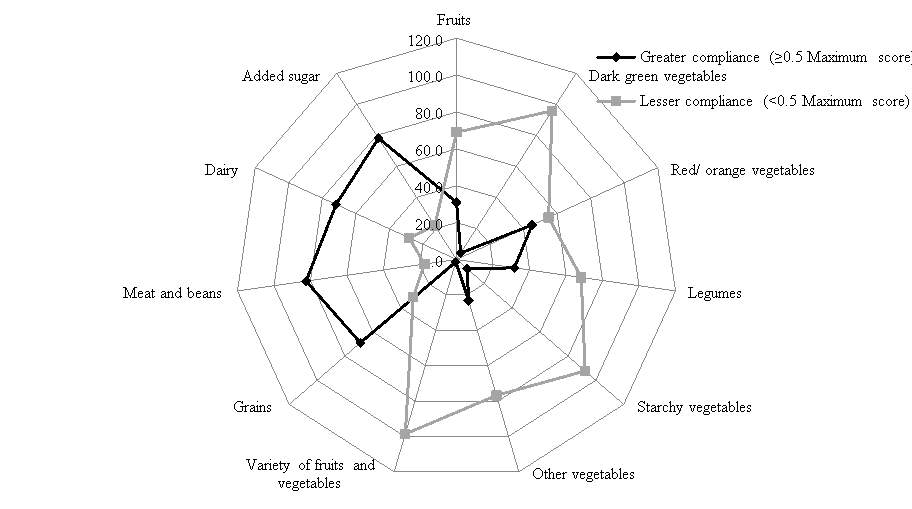
Figure 1a. Percentage of participants with greater and lesser compliance for the “food intake” subgroup components of the Dietary Guidelines Adherence Index 2015.
Each spoke of the plot represents a DGAI “food intake” component, and each line represents either greater or lesser compliance to the component. The largest outer circle represents 100% of participants, and the smallest circle represents 0% of participants. For example, participants with greater and lesser compliance to fruits were 31% and 69%, respectively.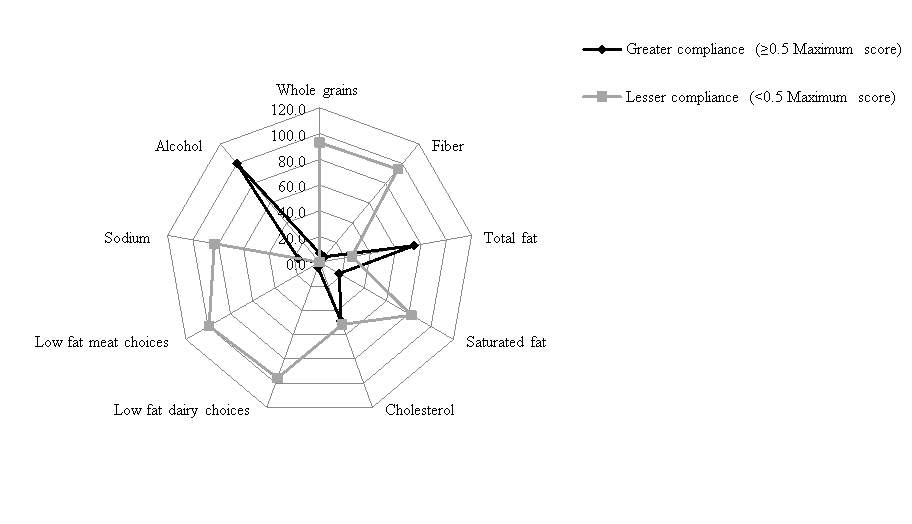 Figure 1b. Percentage of participants with greater and lesser compliance for the “healthy choice” subgroup components of the Dietary Guidelines Adherence Index 2015.
Each spoke of the plot represents a DGAI “healthy choice” component, and each line represents either greater or lesser compliance to the component. The largest outer circle represents 100% of participants, and the smallest circle represents 0% of participants. For example, participants with greater and lesser compliance to whole grains were 7% and 93%, respectively.
Influence of food insecurity on diet quality and BMI
The percentage of women who were food secure and food insecure in this population were 39.5% and 60.5%, respectively. Food insecurity was inversely related to diet quality of study participants (Adjusted R2 = 0.048; β = -0.235; p2 = 0.039; β = 0.213;p2 and 30.7 kg/m2, respectively.
Multi-dimensional Home Environmental Scale
The mean percentages of the maximum possible score obtained for the intrapersonal, home environment, community and social components of the MHES were 73.6%, 65.6%, 67.9%, and 61.4%. The two subscales with the lowest average percentage scores were descriptive norms for healthy eating (54.1%) and availability of unhealthy foods at home (58.3%).
Association of MHES factors to diet quality and BMI of women participating in SNAP
Table 2 presents the influence of intrapersonal, home environment, community and social factors, as measured by the MHES, on diet quality and BMI. The relationship of MHES subscales to diet quality and BMI were tested in model 1, based on univariate regression analysis. Factors that were significantly linked to diet quality from the univariate regression analysis were emotional eating resistance, self-efficacy, healthy eating attitude, mindless eating, social eating and descriptive norms. In model 2, emotional eating resistance and social eating remained significant.
All factors measured by the MHES were significantly associated with BMI in model 1, with the exception of physical characteristics of neighborhood, regulation of family meals and descriptive norms. The predictors that remained significant in model 2 included emotional eating resistance, availability of unhealthy food at home, neighborhood safety, social eating and social support.
| Component | Diet quality | Body mass index | |||||||||
| Model 1a | Model 2b | Model 1a | Model 2b | ||||||||
| Β | p-value | β | p-value | β | p-value | Β | p-value | ||||
| Intrapersonal factors | |||||||||||
| Emotional eating resistance | 0.290 | 0.000 | 0.218 | 0.044 | -0.422 | 0.000 | -0.239 | 0.007 | |||
| Self-efficacy | 0.176 | 0.038 | 0.048 | 0.672 | -0.278 | 0.001 | 0.018 | 0.842 | |||
| Healthy eating attitude | 0.212 | 0.012 | 0.074 | 0.538 | -0.256 | 0.002 | 0.155 | 0.106 | |||
| Mindless eating | 0.168 | 0.046 | 0.054 | 0.586 | -0.302 | 0.000 | -0.034 | 0.671 | |||
| Home environment | |||||||||||
| Availability of healthy food | 0.164 | 0.052 | 0.079 | 0.414 | -0.306 | 0.000 | -0.141 | 0.073 | |||
| Availability of unhealthy food | 0.135 | 0.112 | -0.099 | 0.388 | -0.550 | 0.000 | -0.227 | 0.017 | |||
| Community environment | |||||||||||
| Physical characteristics of neighborhood | -0.029 | 0.729 | -0.104 | 0.256 | -0.128 | 0.117 | 0.009 | 0.898 | |||
| Neighborhood safety | 0.087 | 0.303 | -0.010 | 0.924 | -0.496 | 0.000 | -0.237 | 0.007 | |||
| Social factors | |||||||||||
| Regulation of family meals | 0.011 | 0.897 | 0.004 | 0.968 | -0.129 | 0.116 | -0.016 | 0.821 | |||
| Social eating | 0.314 | 0.000 | 0.257 | 0.003 | -0.258 | 0.002 | -0.176 | 0.012 | |||
| Social support | 0.006 | 0.945 | -0.102 | 0.293 | -0.251 | 0.002 | -0.172 | 0.027 | |||
| Descriptive normsc | 0.185 | 0.028 | 0.151 | 0.080 | -0.137 | 0.098 | -0.018 | 0.792 | |||
Table 2. Influence of multi-dimensional home environmental scale (MHES) factors on body mass index and diet quality in women participating in SNAP (n=152)
aUnivariate linear regression with each MHES factor regressed on BMI and diet quality
bMultiple regression with MHES factors regressed as independent variables on BMI and diet quality
cDefined as perceptions of health-related behaviors of other individuals
Food security status and MHES
Participants classified as food secure scored higher than food insecure women in each component of the MHES, with the exception of regulation of family meals (Figure 2). Moreover, a significant difference between the two groups was observed for availability of unhealthy food at home (p
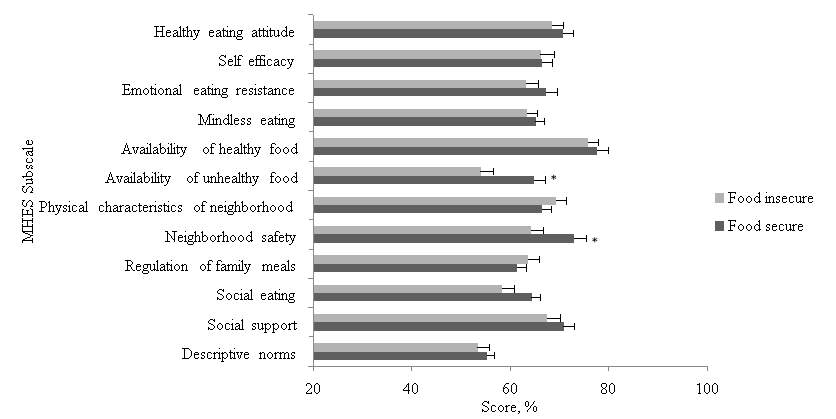
Figure 2. Multidimensional Home Environmental subscale scores (expressed as percentages) according to food security status in women participating in Supplemental Nutrition Assistance Program (n=152). *Significant differences between food secure and insecure women was obtained for two subscales, availability of unhealthy foods at home (p
Mediation models
The results of the mediation analysis between food insecurity and diet quality are presented in Figure 3a. The impact of food insecurity on diet quality (β=-0.46, p

A

B
Reduction in β = 17.4%
Estimate of indirect effect = -0.08 (-0.22-0.00)
Figure 3a. A mediation analysis where (A) represents the direct effect model for the association between independent variable (food insecurity) and dependent variable (diet quality) and (B) represents the mediation model for the influence of independent variable (food insecurity) on dependent variable (diet quality), accounting for the mediator variable (Multidimensional Home Environment Scale score)
In Figure 3b, the total effect of food insecurity on BMI was significant (β=0.42, p

A

B
Reduction in β = 47.6%
Estimate of indirect effect = 0.19 (0.01-0.42)
Figure 3b. A mediation analysis where (A) represents the direct effect model for the association between independent variable (food insecurity) and dependent variable (body mass index) and (B) represents the mediation model for the influence of independent variable (food insecurity) on dependent variable (body mass index), accounting for the mediator variable (Multidimensional Home Environment Scale score)
In Figure 3c, the total effect of food insecurity on BMI was significant (β=0.36, p

A
B
Reduction in β = 13.4%
Estimate of indirect effect = 0.05 (-0.02-0.18)
Figure 3c. A mediation analysis where (A) represents the direct effect model for the association between independent variable (food insecurity) and dependent variable (body mass index) and (B) represents the mediation model for the influence of independent variable (food insecurity) on dependent variable (body mass index), accounting for the mediator variable (diet quality)
Discussion
The results of this study suggest that the MHES (intrapersonal, home environment, community and social factors) significantly mediated the relationship between food insecurity and BMI of women participating in SNAP.
In contrast, diet quality did not significantly explain the association between food insecurity and BMI. These findings underlie the significance of exploring the influence of food insecurity on weight status based on a socio-ecological perspective. Food insecurity appeared to be associated with a lower MHES score, which in turn, was related to higher BMI.
Of note, neighborhood safety and availability of unhealthy foods at home were the subscales that were significantly related to both food insecurity and BMI. The prevalence of food insecurity in the recruited sample, 60.5%, is comparable to that found in a nationally representative sample of SNAP households (60.7% in urban areas; 61.3% in rural areas) (23). An inverse association between food insecurity and diet quality in women also was observed, thereby corroborating results from previous studies (52-54).
However, the MHES did not mediate the observed relationship between food insecurity and diet quality. This could be attributed to the fact that the MHES subscales that were related to diet quality did not significantly differ according to food security status.
This research indicated that majority of the participants showed lesser compliance for DGAI 2015 components, including dark green vegetables, legumes, starchy vegetables, other vegetables, variety of fruits and vegetables, whole grains, low fat dairy, low fat meat and fiber. Thus, the multi-dimensional radar plots illustrated reduced consumption of these food groups. More than half of the participants showed lower compliance for saturated fat, cholesterol, and sodium, thereby indicating greater intakes of these nutrients.
The MHES helped to identify psychosocial factors that influence diet quality and BMI of female SNAP participants. Parallel to earlier investigations in low-income women in the U.S. (55, 56), this research also observed that resistance to emotional eating was linked to higher diet quality and lower BMI. ‘Availability of unhealthy foods at home’ was one of the subscales for which the lowest percentage of maximum possible score was found.
This finding is particularly important since a lower score in this subscale was significantly linked to a greater BMI. Low-income women have been shown to use several strategies to manage their food resources, such as purchasing of energy-dense food items (57). Presumably, these purchases are due to their perceived lower cost, and non-perishable nature (58-61). A tendency to purchase foods high in energy, fat and sugar may be greater in food insecure women due to financial constraints. This could explain the higher home availability of unhealthy foods among food insecure women observed in this study. The negative impact of the availability of unhealthy foods on BMI, as demonstrated in the present investigation, reinforces the need for strategies to help create a healthier home environment among SNAP families.
The relationship between neighborhood safety and BMI in the present research is consistent with that observed by Burdette et al. in a population of women with young children (62). Since Bennett et al. have shown that lower levels of neighborhood safety negatively affects physical activity in women (63), future investigations could focus on physical activity as the mediating link between neighborhood safety and BMI. The present study also observed that food insecure women lived in an environment with lower perceived safety, as compared to those who were food secure. This finding implies that perceptions of neighborhood safety may influence food accessibility in low-income women.
Favorable social eating behaviors positively influenced diet quality and BMI in this sample. This result suggests that eating in the company of family and friends influences food choices. Thus, adoption of optimal social eating practices could be emphasized to positively influence diet quality and presumably, BMI of women. Finally, the association between social support and lower BMI is comparable to other studies that have indicated the important role of this factor in weight management of adults (64, 65).
A limitation of this research is that the cross-sectional design could not capture changes over time. Also, the use of an FFQ to assess dietary intakes has been associated with a lack of specificity (66). Furthermore, this investigation did not take into account of genetic determinants of weight status. The mode of participant recruitment utilized for this study (i.e. convenience sampling) could have introduced a bias through selection of a non-representative sample. For example, in contrast to the overall SNAP participation rates by race/ethnicity (33), the sample recruited for this study was predominantly Hispanic.
This limits the generalizability of the findings to the larger population of women participating in SNAP. However, convenience sampling enables accessibility to disadvantaged populations that could otherwise be difficult to reach (67). Moreover, the high Hispanic participation in this research could be reflective of the geographic distribution of this population in the U.S., with Texas being one of the states reported to have the largest Hispanic population (68).
Conclusions
These results are intended for use in public health interventions that aim to improve health behaviors in low-income women. The relationship between food insecurity and obesity was partially mediated by intrapersonal, home environment, community and social factors, as measured by the MHES. Furthermore, food insecure women had greater availability of unhealthy foods at home and lower levels of perceived neighborhood safety when compared to food secure women.
These subscales of the MHES also were related to BMI of women. Thus, home environment and community factors could play a vital role in mediating the relationship between food insecurity and weight status in this population. Future investigations could focus on other aspects related to the social ecological theory in order to further understand the association between food insecurity and excess weight. The measurement of diet quality by the DGAI 2015 enabled identification of key food groups that did not meet the recommended intakes, including fruits, vegetables, whole grains, low fat dairy, low fat meat and fiber.
This research suggests that diets of low-income women might be improved by interventions that emphasize emotional eating resistance through healthier coping mechanisms, and adoption of favorable social eating behaviors. Programs also should evaluate strategies that reduce the availability of unhealthy foods in the home environment and improve social support. Finally, the association between neighborhood safety and BMI implies that residing in an unsafe environment may limit physical activity in women. Encouragement of home- or group-based exercise could promote healthier weight status in women who live in neighborhoods perceived to be unsafe.
Cite This Work
To export a reference to this article please select a referencing stye below:
Related Services
View all


Related Content
All TagsContent relating to: "Food and Nutrition"
Food and Nutrition studies deal with the food necessary for health and growth, the different components of food, and interpreting how nutrients and other food substances affect health and wellbeing.
Related Articles

DMCA / Removal Request
If you are the original writer of this dissertation and no longer wish to have your work published on the UKDiss.com website then please: