Comparison of JD Sports and Sports Direct Financial Statements
Info: 15075 words (60 pages) Dissertation
Published: 2nd Sep 2021
Introduction
The purpose of this financial report is to analyze, compare and evaluate the financial statements of JD Sports Fashion PLC with its competitor Sports Direct International PLC which are the most successful sports brand retailer firms in UK. The study uses Ratio analysis, Horizontal and Vertical Analysis to evaluate and compare the company performances based on the last five years[1] financial information. The evaluation and comparison of these two firms to understand the performance and implication of potential investments shows that JD Sports PLC is recommended for potential investments as the firm is performing well when compared to Sports Direct PLC.
Summary of JD Sports PLC
JD Sports is a sports fashion retail company based in Greater Manchester, UK .Started with one store in 1981, the firm has grown up and currently has 800 stores. From year 2001, the firm started expanding its business with acquisition strategy. In year 2001, the firm entered in to other European markets with the acquisition of champion sports[2](JDPLC, 2017). JD Sports is also an official sponsor of numerous association football teams[3] (JDPLC, 2017).Recent acquisition of ‘Go Outdoor’ for 112M GBP has bought thee firm more reputation (Reuters, 2016) .Over the past 3 decades many players entered the industry and the competition has been increased. Sports Direct PLC and WH Smith PLC are the major competitors for JD Sports(Morningstar, 2017a).Despite of extreme competition, the firm has made a Net profit of 178.9 Million GBP with a Growth rate of 83.25%. Below is the key financial information of JD Sports[4]

Source :(Morningstar, 2017d)
Summary of Sports Direct International PLC
Sports Direct PLC is a sports goods retailer based in Maidenhead, UK. The firm was established in 1982 and currently operating 670 stores worldwide. In year 2000, the firm started expanding its operations to other parts of Europe. It entered Belgium by forming a Joint Venture with 22 local stores (SportsDirectPLC, 2017).The firm is successful and operated at high Revenue till 2013. However, the legal breach on Employee conditions in the year 2013 has badly affected the firm reputation. In August 2016, the firm admitted breaking the law and agreed to pay the unlawfully with help wages of about 1Million GBP to the affected workers(BBC, 2016). In year 2017, the firm has reported Net Profit of 229 Million GBP (17.13% decline in profit) [5]
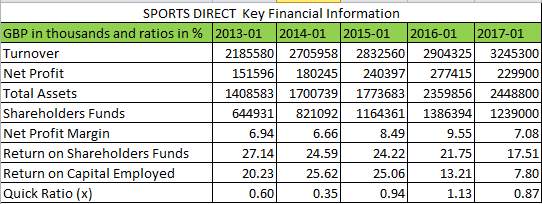
Source :(Morningstar, 2017h)
Above is the key financial information of the firm.
Evaluation of Financial Statements : A Comparitive Analysis
This section provides the analysis, evaluation and comparison of Income Statement, Balance Sheet[6] using Horizontal, Vertical and Ratio Analysis.
Horizontal and Vertical Analysis (Bamber and Parry, 2014)
- Income Statement Analysis
JD Sports
Below table provides Horizontal and Vertical Analysis over the 5 year period[7].The firm has reported a good growth in Revenue and net profits over the years. In 2017, the firm has reported a significant revenue growth rate of 30.58% which is 19.67% in 2016.This inurn boosted the Operating and Net Profit Growth rates which is 80.06% and 83.25% respectively.

Source:(Morningstar, 2017d)
Evaluation:
The growth in profit is majorly due to the growth on Revenue over the years. From the vertical analysis, it is clear that there are no significant changes in the cost of revenue margin over the years. However, the operating expense margin is in decreasing trend from 44.48% to 38.91% [8] which mean that the firm is controlling its expenses with respect to revenue[9].The decline in the operating expense margin has boosted the operating income and Net income margins.
Sports Direct
Over the 5 year period[10] , the firm has reported inconsistent Revenue Growth. Growth in Gross Profit, Operating Profit and Net Profit are in declining trend

Source:(Morningstar, 2017h)
Evaluation:
The decline in Profit Growth is mainly due to the growth in cost proportional to revenue growth. In 2017, the growth in cost of sales (18.24%) is more than the Revenue Growth (11.24%).Also, the operating expenses growth is inconsistent (majorly increasing) which resulted in the negative net profit growth in year 2017.Vertical analysis shows that the cost of revenue margin and operating expenses margin is very high resulting in low operating income and Net profit margins
Comparative analysis
Above evaluation of the firms shows that JD sports achieved good profit growth and margin by controlling the expenses (operating expense margin) whereas Sports Direct failed to achieve the profit growth as its revenue growth is inconsistent and operating expense margin and cost of sales margin are out of control
- Balance Sheet Analysis
JD Sports
Below table provides the Horizontal and Vertical Analysis over the 5 year period[11].The firm has reported a steady growth of assets over the 5 year period. Total assets has a growth rate of 44.99% in 2017 which is 16.08% in 2016.There is an decrease in Liability growth from year 2014 to 2016 which is a good sign for the firm. However, in 2017 the firm reported a Liability growth of 53.27%. There is a steady growth in the Stockholder Equity over the 5 year period. The firm reported Equity growth of 44.41% in 2017 which is 16.08% in 2016

Source: (Morningstar, 2017b)
Evaluation:
As discussed, there is an significant growth in Assets in 2017.However, the growth is mainly due to the growth in prepaid expenses and inventories[12] which mean that the firm is purchasing more inventory. Also, PPE[13] is also grown significantly which means the firm is investing much in PPE. This made the decline in the growth of cash[14]. The increase in Liability growth in 2017 is due to the capital leases. Increase in Stock holder equity growth is a good sign for the firm and it is due to the increase in the retained earnings growth
Sports Direct
Over the 5 year period[15], the firm has reported an inconsistent growth in Assets .The firm has reported 3.77% Asset growth where as it is 33.05% in 2016.Growth in liabilities also shows an inconsistent trend. The firm has reported high long term debt in year 2016 and 2017.Equity growth is in declining trend from year 2015 to 2017.The firm reported negative equity growth[16] in 2017
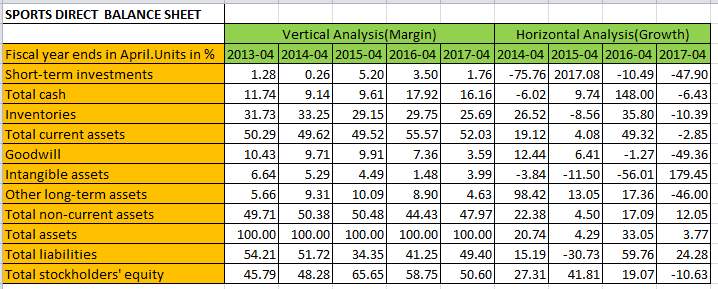
Source: (Morningstar, 2017f)
Evaluation:
Decrease in Asset Growth in 2017 is mainly due to the decrease in Long term assets, Inventory and Short term Investments. Even though there is decrease in inventory, thee total cash available has negative growth of “-6.43%” .The firm is investing more in Properties which resulted in +ve Growth of non-current assets and –ve growth of current assets. The decline in Liability growth is mainly due to the decline in Account Payable. The equity growth has been declined in 22017 mainly due to the decline in retained earnings growth and increase in comprehensive income.
Comparative analysis
Above evaluation of the firms shows that there is a steady growth of Assets and Equity for JD sports whereas the growth is declining for Sports direct. Over all, JD Sports is managing their assets and equity better than Sports direct. In case of Liabilities, JD Sports has increase in Liability growth only in 2017.Over all 5 year trend shows that JD Sports is well managing their liabilities when compared to Sports direct.
Ratio analysis (Atrill and McLaney, 2006)
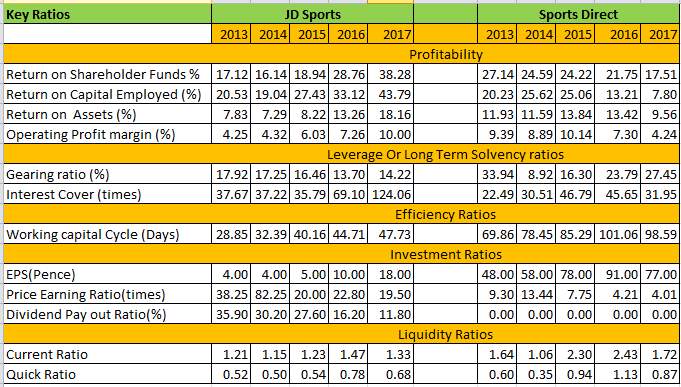
Source: (Morningstar, 2017e)
Return on Capital Employed (ROCE):
JD Sports
Overall Trend: Increasing except in 2014[17]
Evaluation:
- Slight decline of ROCE in 2014
Reason: Growth in Stake Holder Capital and Non-Current Liabilities > Growth in Operating Profit (high operating expense margin)
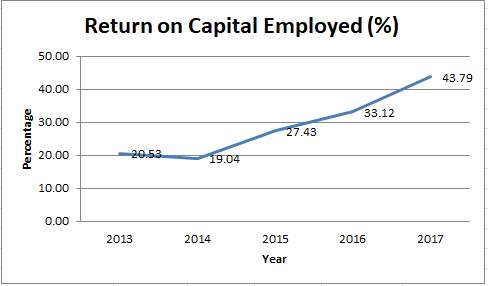
- Increase from year 2014 to 2017[18]
Reason:
Decrease in Operating Expense Margin resulting in increase in operating income
Implication: Increasing trend in ROCE is a good sign for the firm as more investors will show interest to invest in the firm.
Sports Direct
Overall Trend: Decreasing except in 2014
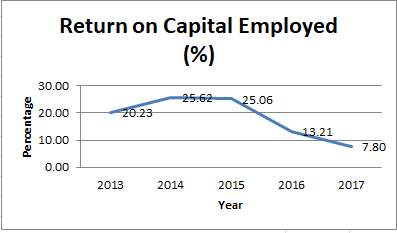
Evaluation: Increase in Cost of revenue margin for year 2017[19]
- Increase in Operating expenses margin over the years
- Operating profit Growth
Comparative Analysis
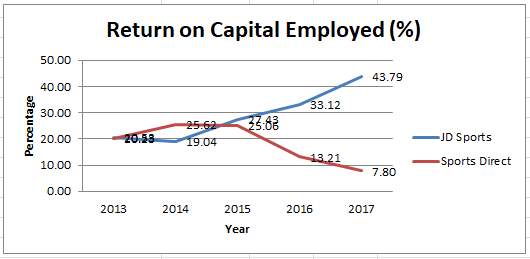
ROCE for JD Sports is high as well as in increasing trend when compared to Sports Direct. This gives the investors more confidence as they can get the high consistent returns for their investments.
- Operating Profit Margin:
JD Sports
Overall Trend : Increasing
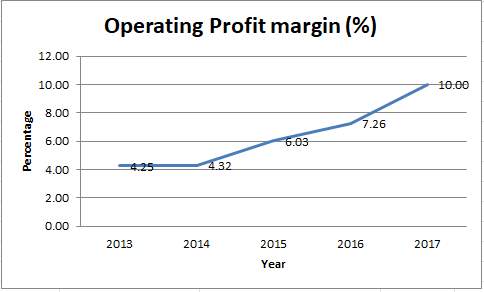
Evaluation:
As explained earlier, operating expense margin is reduced due to which the operating profit margin has been increased
Implication
This shows the firms efficiency and effectiveness in cost control
Sports Direct
Overall Trend: Declining Except in 2015
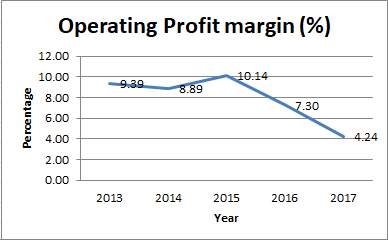
Evaluation:
- Increase in Operating expenses margin from year 2013 to 2017[20]
- Increase in Cost of sales margin in 2017
Comparative Analysis:
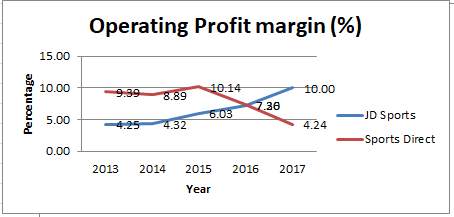
Evaluation shows that JD Sports has reduced the operating expnses margin wheras sports direct failed to control its costs and expenses due to which the operating profit margin has been declined
- Gearing Ratio:
JD Sports:
Overall Trend: Decreasing except in 2017
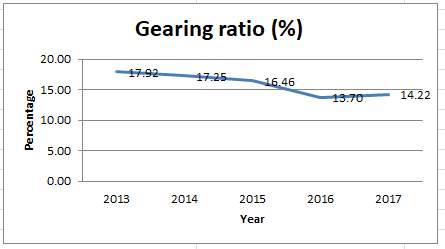
Evaluation:
- Non-Current Liability Growth is relatively low when compared to Equity Growth[21] from 2013 to 2016
- However in 2017, the long term debt has been increased from 0.2 Million GBP to 2 Million GBP (884.76% Growth) [22]which results in the increasing in the Gearing ratio.
Sports Direct:
Overall Trend : Increasing except in 2014
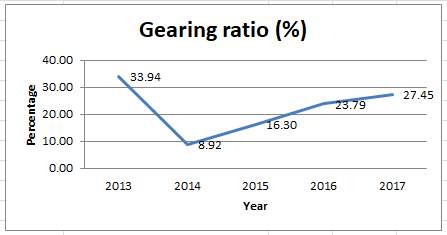
Evaluation:
- In 2014, the decrease in the long term debt has resulted in the decrease in the Gearing[23]
- From 2015 to 2017, the ratio is in increasing trend as the long term debt and other long term liabilities has increased over these years. On the other hand, Growth in Stock holder Equity is relatively low when compared to growth in non-current liabilities. In 2017 , the firm reported negative equity growth which resulted in further increase in Gearing[24]
Comparative Analysis:
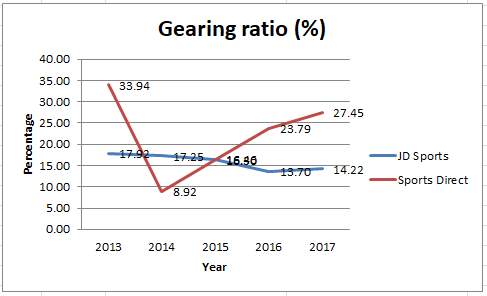
Evaluation shows that the Gearing for JD Sports is not only in decreasing trend, the values of Gearing is also pretty much lower when compared to Sports direct .This will make the investors attract towards JD Sports as it involves less risk in investing in JD when compared to Sports Direct.
- Interest Cover
JD Sports:
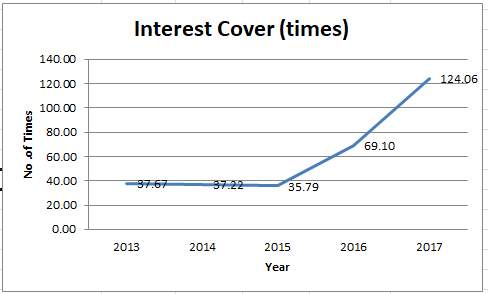
Overall Trend : Increasing
Evaluation:
As discussed in earlier ratios, the firm is mostly dependent on Shareholder equity than borrowings or Debts. So, Interest payable is very less when compared to operating profit. Also, the firm is maximizing the Operating profit margin by reducing the operating expense margin
Sports Direct:
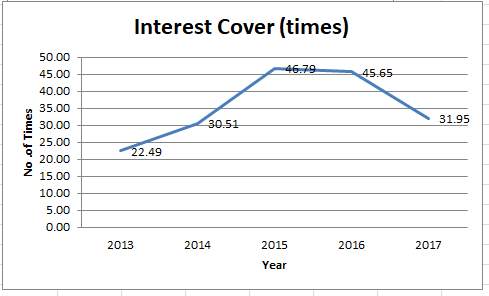
Overall Trend : Inconsistent
Evaluation:
In 2014, 2015 there is an increase in the interest cover as the interest expenses of the firm is low since the non-current liabilities are low. However, the interest cover in 2016 and 2017 has been declined since the operating profit margin is declined due to the increase in operating expense margin and cost of revenue margin
Comparative Analysis:
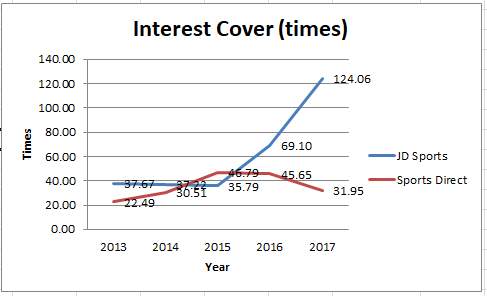
Above Graph shows that JD Sports Interest cover is not only in increasing trend but the interest coverage times is much higher than Sports Direct. It is a good sign for JD sports since the banks will lend the money as the firm has high capacity to repay the loans. At the same time, investors will also be attracted as the risk of investments is low when compared to Sports direct.
- Working Capital Cycle (WCC)
JD Sports:
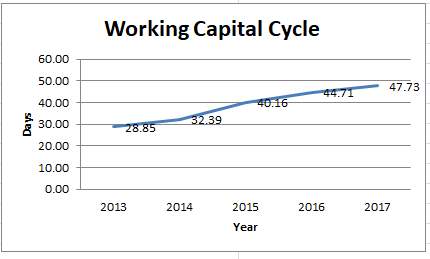
Overall Trend : Increasing
Evaluation:
As discussed earlier, the firm is holding inventory for more days which made the increase in WCC .Even though the firm is managing to reduce the receivable period[25], due to the increase in inventory days and decrease in payable days made the increase in WCC
Sports Direct:
Overall Trend : Increasing except in 2017
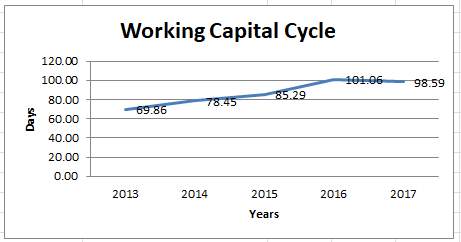
Evaluation: From 2013 to 2016, the WCC is increasing due to the increase in inventory days and receivable periods. However, in 2017, the Inventory turnover period and Trade receivable period has been decreased due to which resulted in the decrease in WCC
Comparative Analysis:
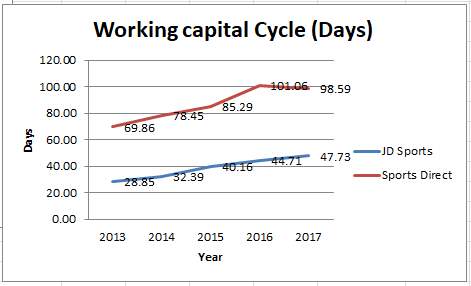
Lower WCC is good for a business. Even though the trend is increasing for both the firms, WCC for JD Sports is relatively lower when compared to Sports Direct.
- Diluted Earnings Per Share:
JD Sports:
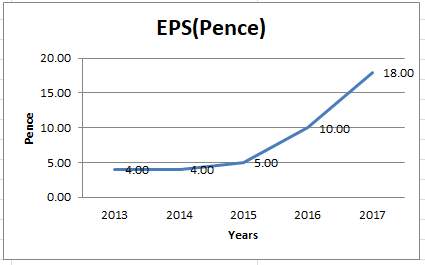
Overall Trend : Increasing
Evaluation:
- No change in number of shares from 2013 to 2017[26].So, the increase in EPS is due to the increase in Net Profits. This shows that every share of the common stock earns 18 pence of the Net profit in 2017.The increase in EPS is good for the firm
Sports Direct:
Overall Trend : Increasing except in 2017
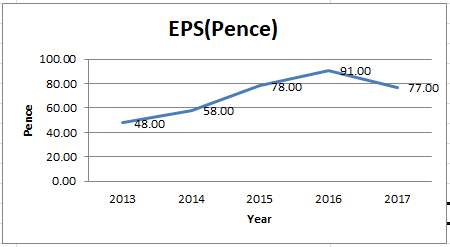
Evaluation: Number of shares from 2013 to 2017 has been reduced. The firm has a decline in EPS in 2017 since the Net Profits has been declined in 2017 (Negative Growth Rate). Due to the decrease in shares and increase in profits, the EPS has increased from 2013 to 2016.
Comparative Analysis:
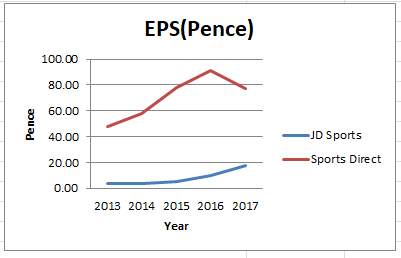
The above graph shows that EPS for sports direct is higher than JD Sports which is a good sign for Sports direct. However, considering the decline in EPS for Sports direct in 2017 and decrease in the number of shares over the years, it will be better to look in to other ratios before investing in Sports Direct
- Price Earnings Ratio:
JD SPORTS
Overall Trend : Inconsistent
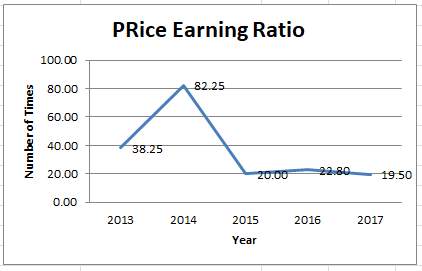
Evaluation: In 2017, the firm PE ratio is 19.5 which means the market value of the share is 19.5 times higher than the erearnings per share. Current industry average of PE ratio is 20.15 which is close to JD Sports PE
Sports Direct:
Overall Trend : Decreasing except in 2014
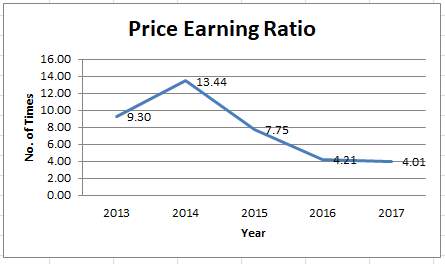
The PE ratio in 2017 is 4.01 which mean the market value per share is 4.01 times higher than the EPS. Even though it looks beneficial for the investor, the PE ratio is well behind the industry average which is 20.15
Comparative Analysis:
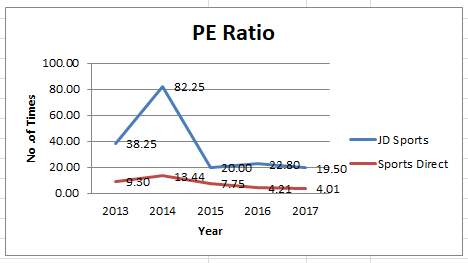
From the above evaluations, it is clear that the PE ratio of JD Sports is close to industry average whereas Sports direct is well behind the Industry average. So, the investor can be confident to invest in JD Sports
- Dividend Payout Ratio:
JD Sports
Overall Trend: Declining
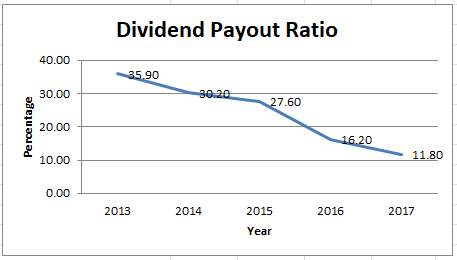
Payout ratio is in decreasing trend which means the company is reducing the proportion of earnings to pay as dividends. The firm is increasing the Dividend year by year but the raise in Dividend is not proportional to raise in earnings. This might be due to the fact that firm is using its profits for investment activities [27]
Sports Direct
Sports direct is not issuing any dividends from year 2013.So, there is no payout ratio for the firm.
Comparative Analysis
Dividend is a signal to the investors about the company performance. Since JD Sports is issuing dividends, the investors will be attracted towards this firm as Sport direct is not issuing any dividends
- Liquidity Ratio
JD Sports: Quick ratio for the firm is in inconsistent trend. There is about 50% difference in current and quick ratios which mean that the firm is holding high inventory. Quick ratio of the firm is 0.68 which is above industry average 0.58

Sports Direct: Current ratio is almost double the quick ratio which means the firm is holding high inventory. Quick ratio of the firm is 0.87 which is above industry average 0.58
Comparatively both the firms have the quick ratio above the industry average. So, it doesn’t make much difference between the two firms
Conclusion:
Overall, JD Sports is more attractive than Sport direct. Major ratios like Profitability, Long-term solvency and Investment ratios show that JD Sports is performing better than Sports Direct. The horizontal and vertical analysis also derived the same conclusion. One of the limitations of ratio analysis is that they do not reflect the current[28] and future expansion plans of the businesses. This is especially true in case of investment ratios. There is no dividend pay our ratio for Sports Direct since the firm is not paying any dividends but the cash flow statement of sports direct shows that the firm is doing investments in PPE[29] due to which it may not be able to pay the dividends. However, JD Sports is well balancing its investments and dividends. So, it can be recommended to a potential investor to invest in JD Sports when compared to Sports Direct
Appendix
- JD Sports Fashion PLC Income Statement
| JD SPORTS FASHION PLC (JD.) CashFlowFlag INCOME STATEMENT | |||||
| Fiscal year ends in January. GBP in thousands except per share data. | 2013-01 | 2014-01 | 2015-01 | 2016-01 | 2017-01 |
| Revenue | 1258892 | 1330578 | 1522253 | 1821652 | 2378694 |
| Cost of revenue | 645404 | 685448 | 782703 | 937431 | 1215053 |
| Gross profit | 613488 | 645130 | 739550 | 884221 | 1163641 |
| Sales, General and administrative | 559940 | 587671 | 638302 | 752057 | 919244 |
| Other operating expenses | 9527 | 6419 | |||
| Total operating expenses | 559940 | 587671 | 647829 | 752057 | 925663 |
| Operating income | 53548 | 57459 | 91721 | 132164 | 237978 |
| Interest Expense | 1503 | 1597 | 2601 | 1933 | 1937 |
| Other income (expense) | 3072 | 1988 | 1376 | 1400 | 2327 |
| Income before income taxes | 55117 | 57850 | 90496 | 131631 | 238368 |
| Provision for income taxes | 13875 | 16364 | 20741 | 31001 | 53788 |
| Minority interest | 2456 | 1328 | 1294 | 2996 | 5666 |
| Other income | 2456 | 1328 | 1294 | 2996 | 5666 |
| Net income from continuing operations | 41242 | 41486 | 69755 | 100630 | 184580 |
| Net income from discontinuing ops | -15784 | ||||
| Other | -2456 | -1328 | -1294 | -2996 | -5666 |
| Net income | 38786 | 40158 | 52677 | 97634 | 178914 |
| Net income available to common shareholders | 38786 | 40158 | 52677 | 97634 | 178914 |
| Earnings per share | |||||
| Basic | 0.04 | 0.04 | 0.05 | 0.1 | 0.18 |
| Diluted | 0.04 | 0.04 | 0.05 | 0.1 | 0.18 |
| Weighted average shares outstanding | |||||
| Basic | 973233 | 973233 | 973233 | 973233 | 973233 |
| Diluted | 973233 | 973233 | 973233 | 973233 | 973233 |
| EBITDA | 86948 | 93800 | 138338 | 182342 | 302675 |
| No.Of Employees | 10430 | 10508 | 11198 | 12602 | 16218 |
| Dividends | 12408 | 12871 | 13260 | 13820 | 14501 |
| Dividends/Share(Pence) | 1.274926 | 1.322499 | 1.362469 | 1.420009 | 1.489982 |
| Market Value Per share (http://www.jdplc.com/investor-relations/share-price.aspx)(Pence) | 153 | 329 | 100 | 228 | 351 |
Source :(Morningstar, 2017d)
- JD Sports Fashion PLC Balance Statement
| JD SPORTS FASHION PLC (JD.) CashFlowFlag BALANCE SHEET | |||||
| Fiscal year ends in January. GBP in thousands except per share data. | 2013-01 | 2014-01 | 2015-01 | 2016-01 | 2017-01 |
| Assets | |||||
| Cash and cash equivalents | 53484 | 76797 | 121317 | 215996 | 247560 |
| Total cash | 53484 | 76797 | 121317 | 215996 | 247560 |
| Inventories | 146569 | 186116 | 225020 | 238324 | 348007 |
| Prepaid expenses | 37962 | 45366 | 37738 | 30486 | 45527 |
| Other current assets | 18799 | 21600 | 16184 | 25889 | 73075 |
| Total current assets | 256814 | 329879 | 400259 | 510695 | 714169 |
| Land | 23959 | 12120 | 12674 | 17185 | |
| Fixtures and equipment | 221121 | 245410 | 259421 | 301150 | 379900 |
| Other properties | 20872 | 19050 | 22787 | 61375 | |
| Property and equipment, at cost | 245080 | 278402 | 291145 | 341122 | 441275 |
| Accumulated Depreciation | -115979 | -136828 | -143211 | -167805 | -205513 |
| Property, plant and equipment, net | 129101 | 141574 | 147934 | 173317 | 235762 |
| Goodwill | 54176 | 78776 | 86139 | 83944 | 130627 |
| Intangible assets | 41848 | 25554 | 14936 | -10333 | 60275 |
| Deferred income taxes | 482 | ||||
| Other long-term assets | 20568 | 23802 | 32402 | 33191 | 38103 |
| Total non-current assets | 245693 | 269706 | 281411 | 280601 | 464767 |
| Total assets | 502507 | 599585 | 681670 | 791296 | 1178936 |
| Liabilities and stockholders’ equity | |||||
| Short-term debt | 7108 | 30933 | 36685 | 6257 | 30928 |
| Capital leases | 49 | 37 | 28 | 44 | 503 |
| Accounts payable | 97084 | 128510 | 124590 | 122638 | 165003 |
| Taxes payable | 35693 | 35216 | 46203 | 57470 | 92159 |
| Other current liabilities | 72815 | 90955 | 119242 | 161745 | 246563 |
| Total current liabilities | 212749 | 285651 | 326748 | 348154 | 535156 |
| Long-term debt | 684 | 516 | 339 | 210 | 2068 |
| Capital leases | 7 | 35 | 35 | 64 | 461 |
| Deferred taxes liabilities | 3852 | 4283 | 1804 | 8192 | |
| Minority interest | 13934 | 13074 | 13502 | 18405 | 26592 |
| Other long-term liabilities | 33458 | 36260 | 42753 | 42043 | 54217 |
| Total non-current liabilities | 51935 | 54168 | 58433 | 60722 | 91530 |
| Total liabilities | 264684 | 339819 | 385181 | 408876 | 626686 |
| Common stock | 2433 | 2433 | 2433 | 2433 | |
| Additional paid-in capital | 11659 | 11659 | 11659 | 11659 | 11659 |
| Retained earnings | 230572 | 257744 | 297161 | 378898 | 543268 |
| Accumulated other comprehensive income | -4408 | -12070 | -14764 | -10570 | -5110 |
| Total stockholders’ equity | 237823 | 259766 | 296489 | 382420 | 552250 |
| Total liabilities and stockholders’ equity | 502507 | 599585 | 681670 | 791296 | 1178936 |
Source :(Morningstar, 2017b)
- JD Sports Fashion PLC Cash Flow Statement
| JD SPORTS FASHION PLC (JD.) Statement of CASH FLOW | |||||
| Fiscal year ends in January. GBP in thousands except per share data. | 2013-01 | 2014-01 | 2015-01 | 2016-01 | 2017-01 |
| Cash Flows From Operating Activities | |||||
| Deferred income taxes | 16364 | 20531 | 31001 | 53788 | |
| Inventory | -23551 | -29372 | -54696 | -13304 | -21240 |
| Other working capital | -18295 | 10969 | 53857 | 55785 | 39301 |
| Other non-cash items | 76574 | 79234 | 96070 | 152532 | 207412 |
| Net cash provided by operating activities | 34728 | 77195 | 115762 | 226014 | 279261 |
| Cash Flows From Investing Activities | |||||
| Investments in property, plant, and equipment | -43671 | -43575 | -63048 | -72765 | -84115 |
| Property, plant, and equipment reductions | 977 | 557 | 705 | 1145 | 2431 |
| Acquisitions, net | 11969 | -17213 | 9027 | -138568 | |
| Purchases of intangibles | -5540 | -4609 | -7152 | -4401 | -3843 |
| Other investing charges | 645 | 575 | 657 | -5955 | 767 |
| Net cash used for investing activities | -35620 | -64265 | -59811 | -81976 | -223328 |
| Cash Flows From Financing Activities | |||||
| Short-term borrowing | -245 | ||||
| Long-term debt issued | 26000 | 5000 | |||
| Long-term debt repayment | -129 | -291 | -31191 | -3133 | |
| Repurchases of treasury stock | -14815 | ||||
| Cash dividends paid | -12408 | -12871 | -13260 | -13820 | -14501 |
| Other financing activities | -971 | -105 | -72 | -75 | -804 |
| Net cash provided by (used for) financing activities | -13624 | 12895 | -8623 | -45086 | -33253 |
| Effect of exchange rate changes | -867 | -10 | -3674 | -4790 | 1796 |
| Net change in cash | -15383 | 25815 | 43654 | 94162 | 24476 |
| Cash at beginning of period | 61611 | 46228 | 72043 | 115697 | 209859 |
| Cash at end of period | 46228 | 72043 | 115697 | 209859 | 234335 |
| Free Cash Flow | |||||
| Operating cash flow | 34728 | 77195 | 115762 | 226014 | 279261 |
| Capital expenditure | -49211 | -48184 | -70200 | -77166 | -87958 |
| Free cash flow | -14483 | 29011 | 45562 | 148848 | 191303 |
| Supplemental schedule of cash flow data |
Source:(MorningStar, 2017c)
- JD Sports Horizontal and Vertical Analysis table
| JD SPORTS INCOME STATEMENT | |||||||||
| Vertical Analysis(Margin) | Horizontal Analysis(Growth) | ||||||||
| Fiscal year ends in January. Units in % | 2013-01 | 2014-01 | 2015-01 | 2016-01 | 2017-01 | 2014-01 | 2015-01 | 2016-01 | 2017-01 |
| Revenue | 100.00 | 100.00 | 100.00 | 100.00 | 100.00 | 5.69 | 14.41 | 19.67 | 30.58 |
| Cost of revenue | 51.27 | 51.52 | 51.42 | 51.46 | 51.08 | 6.20 | 14.19 | 19.77 | 29.62 |
| Gross profit | 48.73 | 48.48 | 48.58 | 48.54 | 48.92 | 5.16 | 14.64 | 19.56 | 31.60 |
| Total operating expenses | 44.48 | 44.17 | 42.56 | 41.28 | 38.91 | 4.95 | 10.24 | 16.09 | 23.08 |
| Operating income | 4.25 | 4.32 | 6.03 | 7.26 | 10.00 | 7.30 | 59.63 | 44.09 | 80.06 |
| Net income | 3.08 | 3.02 | 3.46 | 5.36 | 7.52 | 3.54 | 31.17 | 85.34 | 83.25 |
| JD SPORTS BALANCE SHEET | |||||||||
| Vertical Analysis(Margin) | Horizontal Analysis(Growth) | ||||||||
| Fiscal year ends in January. Units in % | 2013-01 | 2014-01 | 2015-01 | 2016-01 | 2017-01 | 2014-01 | 2015-01 | 2016-01 | 2017-01 |
| Total cash | 10.64 | 12.81 | 17.80 | 27.30 | 21.00 | 43.59 | 57.97 | 78.04 | 14.61 |
| Inventories | 29.17 | 31.04 | 33.01 | 30.12 | 29.52 | 26.98 | 20.90 | 5.91 | 46.02 |
| Prepaid expenses | 7.55 | 7.57 | 5.54 | 3.85 | 3.86 | 19.50 | -16.81 | -19.22 | 49.34 |
| Total current assets | 51.11 | 55.02 | 58.72 | 64.54 | 60.58 | 28.45 | 21.34 | 27.59 | 39.84 |
| Total assets | 100.00 | 100.00 | 100.00 | 100.00 | 100.00 | 19.32 | 13.69 | 16.08 | 48.99 |
| Capital leases | 0.01 | 0.01 | 0.00 | 0.01 | 0.04 | -24.49 | -24.32 | 57.14 | 1043.18 |
| Capital leases | 0.00 | 0.01 | 0.01 | 0.01 | 0.04 | 400.00 | 0.00 | 82.86 | 620.31 |
| Total liabilities | 52.67 | 56.68 | 56.51 | 51.67 | 53.16 | 28.39 | 13.35 | 6.15 | 53.27 |
| Total stockholders’ equity | 47.33 | 43.32 | 43.49 | 48.33 | 46.84 | 9.23 | 14.14 | 28.98 | 44.41 |
| JD SPORTS CASH FLOW | ||||
| Horizontal Analysis(Growth) | ||||
| Fiscal year ends in January. Units in % | 2014-01 | 2015-01 | 2016-01 | 2017-01 |
| Inventory | 24.72 | 86.22 | -75.68 | 59.65 |
| Other working capital | -159.96 | 390.99 | 3.58 | -29.55 |
| Net cash provided by operating activities | 122.28 | 49.96 | 95.24 | 23.56 |
| Investments in property, plant, and equipment | -0.22 | 44.69 | 15.41 | 15.60 |
| Property, plant, and equipment reductions | -42.99 | 26.57 | 62.41 | 112.31 |
| Acquisitions, net | -243.81 | -152.44 | -100.00 | |
| Net cash used for investing activities | 80.42 | -6.93 | 37.06 | 172.43 |
| Long-term debt issued | -80.77 | -100.00 | ||
| Long-term debt repayment | 125.58 | 10618.56 | -89.96 | |
| Cash dividends paid | 3.73 | 3.02 | 4.22 | 4.93 |
| Net cash provided by (used for) financing activities | -194.65 | -166.87 | 422.86 | -26.25 |
- JD Sports Fashion PLC Ratio Analysis
| Ratio Analysis | JD Sports | Formula | ||||
| 2013 | 2014 | 2015 | 2016 | 2017 | ||
| Profitability | ||||||
| Return on Shareholder Funds % | 17.12 | 16.14 | 18.94 | 28.76 | 38.28 | (Profit for the Year /Avg. (Ordinary Share capital+Reserves))*100 |
| Return on Capital Employed (%) | 20.53 | 19.04 | 27.43 | 33.12 | 43.79 | (Operating Profit/Avg.(Share Capital+Reeserves+Non-Current Liabilities))*100 |
| Gross Profit margin (%) | 48.73 | 48.48 | 48.58 | 48.54 | 48.92 | (Gross Profit/Sales Revenue)*100 |
| Return on Assets (%) | 7.83 | 7.29 | 8.22 | 13.26 | 18.16 | (Net Income/Avg.Total Assets) *100 |
| Operating Profit margin (%) | 4.25 | 4.32 | 6.03 | 7.26 | 10.00 | (Operating Profit/Sales Revenue)*100 |
| Leverage Or Long Term Solvency ratios | ||||||
| Gearing ratio (%) | 17.92 | 17.25 | 16.46 | 13.70 | 14.22 | (Long Term (non-current Liabilities)/Sharecapital+reserves+Non-Current Liabilities)*100 |
| Debt to Assets | 0.53 | 0.57 | 0.57 | 0.52 | 0.53 | Total liabilities/Total Assets |
| Debt to Equity | 1.11 | 1.31 | 1.30 | 1.07 | 1.13 | Total Liabilities/Share Holders Equity |
| Interest Cover (times) | 37.67 | 37.22 | 35.79 | 69.10 | 124.06 | operating Profit/Interest Payabale |
| Efficiency Ratios | ||||||
| Avg.Inventory Turn Over period(days) | 78.31 | 88.58 | 95.86 | 90.20 | 88.07 | (Avg.Inventors Held/Cost of sales)*365 |
| Avg. Settlement period for Trade Receivables(days) | 4.37 | 3.87 | 3.31 | 2.64 | 2.86 | (Avg. Trade Receivables/Credit Sales Revenue)*365 |
| Avg. Settlement period for Trade Payables(days) | 53.83 | 60.06 | 59.01 | 48.13 | 43.20 | (Avg. Trade Payables/Credit Purchaes)*365 |
| Working capital Cycle (Days) | 28.85 | 32.39 | 40.16 | 44.71 | 47.73 | (Avg.Inventory Turn Over period(days)+Avg. Settlement period for Trade Receivables(days)-Avg. Settlement period for Trade Payables(days)) |
| Sales Revenue to Capital Employed(times) | 4.34 | 4.24 | 4.29 | 4.11 | 3.69 | Sales revenue/(Share Capital+Non -Current Liabilities) |
| Sales Revenue Per Employee | 120.70 | 126.63 | 135.94 | 144.55 | 146.67 | Sales revenue/No.of Employees |
| Investment Ratios | ||||||
| EPS(Pence) | 4.00 | 4.00 | 5.00 | 10.00 | 18.00 | Earnings available to Ordinary Shareholders/Number of Ordinary Shares in Issue |
| Price Earning Ratio(times) | 38.25 | 82.25 | 20.00 | 22.80 | 19.50 | Market Value Pershare/Earnings Per share |
| Dividend Yield(%) | 0.83 | 0.40 | 1.36 | 0.62 | 0.42 | (Dividend per share/Market Value per share) *100 |
| Dividend Pay out Ratio(%) | 35.90 | 30.20 | 27.60 | 16.20 | 11.80 | (Dividends announced for the year/Earnings for the year avaialble for dividends)*100 |
| Dividend cover ratio(times) | 0.03 | 0.03 | 0.04 | 0.06 | 0.08 | Earnings for the year avaialble for dividends/Dividends announced for the year |
| Liquidity Ratios | ||||||
| Current Ratio | 1.21 | 1.15 | 1.23 | 1.47 | 1.33 | Current Assets/Current Liabilities |
| Quick Ratio | 0.52 | 0.50 | 0.54 | 0.78 | 0.68 | (Current Assets-Inventory)/Current Liabilities |
| 0.46 | 0.45 | 0.50 | 0.74 | 0.64 | (Current Assets-Inventory-Account Recievables)/Current Liabilities | |
Source:(Morningstar, 2017e)
- Sports Direct PLC Income Statement
| SPORTS DIRECT INTERNATIONAL PLC ADR (SDISY) CashFlowFlag INCOME STATEMENT | |||||
| Fiscal year ends in April. GBP in thousands except per share data. | 2013-04 | 2014-04 | 2015-04 | 2016-04 | 2017-04 |
| Revenue | 2185580 | 2705958 | 2832560 | 2904325 | 3245300 |
| Cost of revenue | 1290822 | 1551036 | 1591748 | 1619681 | 1914700 |
| Gross profit | 894758 | 1154922 | 1240812 | 1284644 | 1330600 |
| Sales, General and administrative | 689578 | 908843 | 950526 | 1021844 | 1255600 |
| Other operating expenses | 5531 | 3050 | 50759 | -62600 | |
| Total operating expenses | 689578 | 914374 | 953576 | 1072603 | 1193000 |
| Operating income | 205180 | 240548 | 287236 | 212041 | 137600 |
| Interest Expense | 9642 | 8113 | 6845 | 8104 | 9100 |
| Other income (expense) | 11688 | 7017 | 33055 | 157870 | 153100 |
| Income before income taxes | 207226 | 239452 | 313446 | 361807 | 281600 |
| Provision for income taxes | 55569 | 59839 | 72093 | 82826 | 49900 |
| Minority interest | 61 | -632 | 956 | 1566 | 1800 |
| Other income | 61 | -632 | 956 | 1566 | 1800 |
| Net income from continuing operations | 151657 | 179613 | 241353 | 278981 | 231700 |
| Other | -61 | 632 | -956 | -1566 | -1800 |
| Net income | 151596 | 180245 | 240397 | 277415 | 229900 |
| Net income available to common shareholders | 151596 | 180245 | 240397 | 277415 | 229900 |
| Earnings per share | |||||
| Basic | 0.53 | 0.61 | 0.81 | 0.94 | 0.79 |
| Diluted | 0.49 | 0.58 | 0.78 | 0.91 | 0.77 |
| Weighted average shares outstanding | |||||
| Basic | 284486 | 292757 | 296147 | 296287 | 291751 |
| Diluted | 310412 | 309095 | 308247 | 305120 | 300084 |
| EBITDA | 269464 | 311360 | 395940 | 465511 | 438600 |
| No.Of Employees | 14076 | 17165 | 17207 | 18280 | 20480 |
| Market Value Per share (http://www.sportsdirectplc.com/investor-relations/share-information/share-price-chart.aspx)(Pence) | 446.60 | 779.5 | 604.5 | 383.3 | 308.8 |
Source:(Morningstar, 2017h)
- Sports Direct PLC Balance Sheet
| SPORTS DIRECT INTERNATIONAL PLC ADR (SDISY) CashFlowFlag BALANCE SHEET | |||||
| Fiscal year ends in April. GBP in thousands except per share data. | 2013-04 | 2014-04 | 2015-04 | 2016-04 | 2017-04 |
| Assets | |||||
| Cash and cash equivalents | 147375 | 151024 | 78318 | 340363 | 352700 |
| Short-term investments | 17965 | 4355 | 92199 | 82527 | 43000 |
| Total cash | 165340 | 155379 | 170517 | 422890 | 395700 |
| Account Reeceivable(%) | 3.58 | 3.58 | 3.68 | 2.3 | 1.6 |
| Account Reeceivable | 50427.27 | 60886.46 | 65271.53 | 54276.688 | 39180.8 |
| Inventories | 446962 | 565479 | 517054 | 702158 | 629200 |
| Prepaid expenses | 29326 | 35653 | 31781 | 25152 | 32100 |
| Other current assets | 66785 | 87361 | 158945 | 161237 | 217000 |
| Total current assets | 708413 | 843872 | 878297 | 1311437 | 1274000 |
| Land | 322356 | 323402 | 433564 | ||
| Fixtures and equipment | 387255 | 425892 | 470580 | 557173 | 608600 |
| Other properties | 357527 | 125273 | 130351 | 174986 | 884900 |
| Property and equipment, at cost | 744782 | 873521 | 924333 | 1165723 | 1493500 |
| Accumulated Depreciation | -412746 | -461160 | -501591 | -579847 | -651500 |
| Property, plant and equipment, net | 332036 | 412361 | 422742 | 585876 | 842000 |
| Goodwill | 146938 | 165220 | 175808 | 173572 | 87900 |
| Intangible assets | 93482 | 89889 | 79556 | 34997 | 97800 |
| Deferred income taxes | 47952 | 31130 | 38352 | 43984 | 33700 |
| Other long-term assets | 79762 | 158267 | 178928 | 209990 | 113400 |
| Total non-current assets | 700170 | 856867 | 895386 | 1048419 | 1174800 |
| Total assets | 1408583 | 1700739 | 1773683 | 2359856 | 2448800 |
| Liabilities and stockholders’ equity | |||||
| Short-term debt | 55753 | 356226 | 1204 | 769 | 69500 |
| Accounts payable | 169976 | 239463 | 170090 | 219001 | 133300 |
| Taxes payable | 79959 | 54565 | 66217 | 99333 | 80800 |
| Other current liabilities | 126601 | 148991 | 145110 | 221505 | 457300 |
| Total current liabilities | 432289 | 799245 | 382621 | 540608 | 740900 |
| Long-term debt | 245625 | 6764 | 136849 | 333063 | 317300 |
| Capital leases | 2 | ||||
| Deferred taxes liabilities | 24978 | 24046 | 40088 | 21590 | 18700 |
| Pensions and other benefits | 15350 | 14869 | 13065 | 3400 | |
| Minority interest | -254 | -3538 | -2810 | -1666 | -700 |
| Other long-term liabilities | 61012 | 37780 | 37705 | 66802 | 130200 |
| Total non-current liabilities | 331363 | 80402 | 226701 | 432854 | 468900 |
| Total liabilities | 763652 | 879647 | 609322 | 973462 | 1209800 |
| Common stock | 64060 | 64100 | |||
| Additional paid-in capital | 874300 | 874300 | 874300 | 874300 | 874300 |
| Retained earnings | 752018 | 931819 | 1181511 | 1482331 | 1591000 |
| Treasury stock | -120609 | ||||
| Accumulated other comprehensive income | -860778 | -985027 | -891450 | -1034297 | -1290400 |
| Total stockholders’ equity | 644931 | 821092 | 1164361 | 1386394 | 1239000 |
| Total liabilities and stockholders’ equity | 1408583 | 1700739 | 1773683 | 2359856 | 2448800 |
Source:(Morningstar, 2017f)
- Sports Direct PLC Cash Flow
| SPORTS DIRECT INTERNATIONAL PLC ADR (SDISY) Statement of CASH FLOW | |||||
| Fiscal year ends in April. GBP in thousands except per share data. | 2013-04 | 2014-04 | 2015-04 | 2016-04 | 2017-04 |
| Cash Flows From Operating Activities | |||||
| Stock based compensation | 22183 | 11927 | 10105 | 7077 | 2800 |
| Inventory | -102026 | -52521 | 49320 | -155385 | 60000 |
| Other working capital | -25561 | -52676 | -118717 | -77202 | -43400 |
| Other non-cash items | 219825 | 260325 | 296244 | 291218 | 174500 |
| Net cash provided by operating activities | 114421 | 167055 | 236952 | 65708 | 193900 |
| Cash Flows From Investing Activities | |||||
| Investments in property, plant, and equipment | -48247 | -67304 | -97342 | -206977 | -413500 |
| Property, plant, and equipment reductions | 79 | 21150 | 44000 | 2400 | |
| Acquisitions, net | -47037 | -23407 | -3897 | -33091 | 92400 |
| Purchases of investments | -55467 | -50415 | -89213 | -30700 | |
| Sales/Maturities of investments | 49394 | 51695 | 181342 | 190200 | |
| Purchases of intangibles | -2282 | -1827 | -2937 | -124 | |
| Sales of intangibles | 625 | ||||
| Other investing charges | 2590 | 2495 | 3870 | 6140 | -4500 |
| Net cash used for investing activities | -94272 | -96116 | -77876 | -97923 | -163700 |
| Cash Flows From Financing Activities | |||||
| Long-term debt issued | 404970 | 300910 | 126989 | 267390 | 328000 |
| Long-term debt repayment | -323942 | -348452 | -346997 | -71258 | -344100 |
| Repurchases of treasury stock | -21742 | -109800 | |||
| Other financing activities | -7196 | -19789 | -6845 | -7720 | -2800 |
| Net cash provided by (used for) financing activities | 52090 | -67331 | -226853 | 188412 | -128700 |
| Net change in cash | 72239 | 3608 | -67777 | 156197 | -98500 |
| Cash at beginning of period | 69435 | 141674 | 145282 | 77505 | 233700 |
| Cash at end of period | 141674 | 145282 | 77505 | 233702 | 135200 |
| Free Cash Flow | |||||
| Operating cash flow | 114421 | 167055 | 236952 | 65708 | 193900 |
| Capital expenditure | -50529 | -69131 | -100279 | -207101 | -413500 |
| Free cash flow | 63892 | 97924 | 136673 | -141393 | -219600 |
| Supplemental schedule of cash flow data |
Source:(Morningstar, 2017g)
- Sports Direct Horizontal and Vertical Analysis Table
| SPORTS DIRECT INCOME STATEMENT | |||||||||
| Vertical Analysis(Margin) | Horizontal Analysis(Growth) | ||||||||
| Fiscal year ends in April.Units in % | 2013-04 | 2014-04 | 2015-04 | 2016-04 | 2017-04 | 2014-04 | 2015-04 | 2016-04 | 2017-04 |
| Revenue | 100.00 | 100.00 | 100.00 | 100.00 | 100.00 | 23.81 | 4.68 | 2.53 | 11.74 |
| Cost of revenue | 59.06 | 57.32 | 56.19 | 55.77 | 59.00 | 20.16 | 2.62 | 1.75 | 18.21 |
| Gross profit | 40.94 | 42.68 | 43.81 | 44.23 | 41.00 | 29.08 | 7.44 | 3.53 | 3.58 |
| Total operating expenses | 31.55 | 33.79 | 33.66 | 36.93 | 36.76 | 32.60 | 4.29 | 12.48 | 11.22 |
| Operating income | 9.39 | 8.89 | 10.14 | 7.30 | 4.24 | 17.24 | 19.41 | -26.18 | -35.11 |
| Net income | 6.94 | 6.66 | 8.49 | 9.55 | 7.08 | 18.90 | 33.37 | 15.40 | -17.13 |
| SPORTS DIRECT BALANCE SHEET | |||||||||
| Vertical Analysis(Margin) | Horizontal Analysis(Growth) | ||||||||
| Fiscal year ends in April.Units in % | 2013-04 | 2014-04 | 2015-04 | 2016-04 | 2017-04 | 2014-04 | 2015-04 | 2016-04 | 2017-04 |
| Short-term investments | 1.28 | 0.26 | 5.20 | 3.50 | 1.76 | -75.76 | 2017.08 | -10.49 | -47.90 |
| Total cash | 11.74 | 9.14 | 9.61 | 17.92 | 16.16 | -6.02 | 9.74 | 148.00 | -6.43 |
| Inventories | 31.73 | 33.25 | 29.15 | 29.75 | 25.69 | 26.52 | -8.56 | 35.80 | -10.39 |
| Total current assets | 50.29 | 49.62 | 49.52 | 55.57 | 52.03 | 19.12 | 4.08 | 49.32 | -2.85 |
| Goodwill | 10.43 | 9.71 | 9.91 | 7.36 | 3.59 | 12.44 | 6.41 | -1.27 | -49.36 |
| Intangible assets | 6.64 | 5.29 | 4.49 | 1.48 | 3.99 | -3.84 | -11.50 | -56.01 | 179.45 |
| Other long-term assets | 5.66 | 9.31 | 10.09 | 8.90 | 4.63 | 98.42 | 13.05 | 17.36 | -46.00 |
| Total non-current assets | 49.71 | 50.38 | 50.48 | 44.43 | 47.97 | 22.38 | 4.50 | 17.09 | 12.05 |
| Total assets | 100.00 | 100.00 | 100.00 | 100.00 | 100.00 | 20.74 | 4.29 | 33.05 | 3.77 |
| Total liabilities | 54.21 | 51.72 | 34.35 | 41.25 | 49.40 | 15.19 | -30.73 | 59.76 | 24.28 |
| Total stockholders’ equity | 45.79 | 48.28 | 65.65 | 58.75 | 50.60 | 27.31 | 41.81 | 19.07 | -10.63 |
|
SPORTS DIRECT CASH FLOW |
||||
| Horizontal Analysis(Growth) | ||||
| Fiscal year ends in April.Units in % | 2014-04 | 2015-04 | 2016-04 | 2017-04 |
| Inventory | -48.52 | -193.91 | -415.05 | -138.61 |
| Other working capital | 106.08 | 125.37 | -34.97 | -43.78 |
| Net cash provided by operating activities | 46.00 | 41.84 | -72.27 | 195.09 |
| Investments in property, plant, and equipment | 39.50 | 44.63 | 112.63 | 99.78 |
| Acquisitions, net | -50.24 | -83.35 | 749.14 | -379.23 |
| Purchases of investments | -9.11 | 76.96 | -65.59 | |
| Net cash used for investing activities | 1.96 | -18.98 | 25.74 | 67.17 |
| Long-term debt issued | -25.70 | -57.80 | 110.56 | 22.67 |
| Long-term debt repayment | 7.57 | -0.42 | -79.46 | 382.89 |
| Net cash provided by (used for) financing activities | -229.26 | 236.92 | -183.05 | -168.31 |
- Sports Direct PLC Ratio Analysis
| Ratio Analysis | Formula | Sports Direct | ||||
| 2013 | 2014 | 2015 | 2016 | 2017 | ||
| Profitability | ||||||
| Return on Shareholder Funds % | (Profit for the Year /Avg. (Ordinary Share capital+Reserves))*100 | 27.14 | 24.59 | 24.22 | 21.75 | 17.51 |
| Return on Capital Employed (%) | (Operating Profit/Avg.(Share Capital+Reeserves+Non-Current Liabilities))*100 | 20.23 | 25.62 | 25.06 | 13.21 | 7.80 |
| Gross Profit margin (%) | (Gross Profit/Sales Revenue)*100 | 40.94 | 42.68 | 43.81 | 44.23 | 41.00 |
| Return on Assets (%) | (Net Income/Avg.Total Assets) *100 | 11.93 | 11.59 | 13.84 | 13.42 | 9.56 |
| Operating Profit margin (%) | (Operating Profit/Sales Revenue)*100 | 9.39 | 8.89 | 10.14 | 7.30 | 4.24 |
| Leverage Or Long Term Solvency ratios | ||||||
| Gearing ratio (%) | (Long Term (non-current Liabilities)/Sharecapital+reserves+Non-Current Liabilities)*100 | 33.94 | 8.92 | 16.30 | 23.79 | 27.45 |
| Debt to Assets | Total liabilities/Total Assets | 0.54 | 0.52 | 0.34 | 0.41 | 0.49 |
| Debt to Equity | Total Liabilities/Share Holders Equity | 1.18 | 1.07 | 0.52 | 0.70 | 0.98 |
| Interest Cover (times) | operating Profit/Interest Payabale | 22.49 | 30.51 | 46.79 | 45.65 | 31.95 |
| Efficiency Ratios | ||||||
| Avg.Inventory Turn Over period(days) | (Avg.Inventors Held/Cost of sales)*365 | 107.98 | 119.13 | 124.12 | 137.38 | 126.90 |
| Avg. Settlement period for Trade Receivables(days) | (Avg. Trade Receivables/Credit Sales Revenue)*365 | 7.89 | 7.50 | 8.13 | 7.52 | 5.27 |
| Avg. Settlement period for Trade Payables(days) | (Avg. Trade Payables/Credit Purchaes)*365 | 46.01 | 48.18 | 46.96 | 43.84 | 33.58 |
| Working capital Cycle (Days) | (Avg.Inventory Turn Over period(days)+Avg. Settlement period for Trade Receivables(days)-Avg. Settlement period for Trade Payables(days)) | 69.86 | 78.45 | 85.29 | 101.06 | 98.59 |
| Sales Revenue to Capital Employed(times) | Sales revenue/(Share Capital+Non -Current Liabilities) | 2.24 | 3.00 | 2.04 | 1.60 | 1.90 |
| Sales Revenue Per Employee | Sales revenue/No.of Employees | 155.27 | 157.64 | 164.62 | 158.88 | 158.46 |
| Investment Ratios | ||||||
| EPS(Pence) | Earnings available to Ordinary Shareholders/Number of Ordinary Shares in Issue | 48.00 | 58.00 | 78.00 | 91.00 | 77.00 |
| Price Earning Ratio(times) | Market Value Pershare/Earnings Per share | 9.30 | 13.44 | 7.75 | 4.21 | 4.01 |
| Dividend Yield(%) | (Dividend per share/Market Value per share) *100 | 0.00 | 0.00 | 0.00 | 0.00 | 0.00 |
| Dividend Pay out Ratio(%) | (Dividends announced for the year/Earnings for the year avaialble for dividends)*100 | 0.00 | 0.00 | 0.00 | 0.00 | 0.00 |
| Dividend cover ratio(times) | Earnings for the year avaialble for dividends/Dividends announced for the year | NA | NA | NA | NA | NA |
| Liquidity Ratios | ||||||
| Current Ratio | Current Assets/Current Liabilities | 1.64 | 1.06 | 2.30 | 2.43 | 1.72 |
| Quick Ratio | (Current Assets-Inventory)/Current Liabilities | 0.60 | 0.35 | 0.94 | 1.13 | 0.87 |
| (Current Assets-Inventory-Account Recievables)/Current Liabilities | 0.49 | 0.27 | 0.77 | 1.03 | 0.82 | |
Source:(Morningstar, 2017i)
References
ATRILL, P. & MCLANEY, E. J. 2006. Accounting and Finance for Non-specialists, Pearson Education.
BAMBER, M. & PARRY, S. 2014. Accounting and Finance for Managers: A Decision-making Approach, Kogan Page Publishers.
BBC. 2016. Sports Direct ‘to back-pay Derbyshire workers £1m’ [Online]. BBC Available: http://www.bbc.co.uk/news/uk-england-derbyshire-37085244 [Accessed 06-Dec-2017 2017].
JDPLC. 2017. History [Online]. Available: http://www.jdplc.com/company-information/history.aspx [Accessed 04-DEC-2017 2017].
MORNINGSTAR. 2017a. Industry Peers [Online]. Available: http://financials.morningstar.com/competitors/industry-peer.action?t=JD.®ion=gbr&culture=en-US [Accessed 04-DEC-2017 2017].
MORNINGSTAR. 2017b. JD PLC balance-sheet [Online]. Available: http://financials.morningstar.com/balance-sheet/bs.html?t=JD.®ion=gbr&culture=en-US [Accessed 04-Dec-2017 2017].
MORNINGSTAR. 2017c. JD PLC Cashflow [Online]. Available: http://financials.morningstar.com/cash-flow/cf.html?t=JD.®ion=gbr&culture=en-US [Accessed 05-Dec-2017 2017].
MORNINGSTAR. 2017d. JD PLC income-statement [Online]. Available: http://financials.morningstar.com/income-statement/is.html?t=JD.®ion=gbr&culture=en-US [Accessed 04-Dec-2017 2017].
MORNINGSTAR. 2017e. JD PLC Ratios [Online]. Available: http://financials.morningstar.com/ratios/r.html?t=JD.®ion=gbr&culture=en-US [Accessed 05-Dec-2017 2017].
MORNINGSTAR. 2017f. Sports Direct Balance Sheet [Online]. Available: http://financials.morningstar.com/balance-sheet/bs.html?t=SDISY®ion=usa&culture=en-US [Accessed 04-Dec-2017 2017].
MORNINGSTAR. 2017g. Sports Direct Cash Flow [Online]. Available: http://financials.morningstar.com/cash-flow/cf.html?t=SDISY®ion=usa&culture=en-US [Accessed 04-Dec-2017 2017].
MORNINGSTAR. 2017h. Sports Direct Income Statement [Online]. Available: http://financials.morningstar.com/income-statement/is.html?t=SDISY®ion=usa&culture=en-US [Accessed 04-Dec-2017 2017].
MORNINGSTAR. 2017i. Sports Direct Ratios [Online]. Available: http://financials.morningstar.com/ratios/r.html?t=SDISY®ion=usa&culture=en-US [Accessed 04-Dec-2017 2017].
REUTERS. 2016. Britain’s JD Sports buys Go Outdoors for 112 million pounds. Reuters November 28, 2016.
SPORTSDIRECTPLC. 2017. Company History [Online]. Available: http://www.sportsdirectplc.com/about-us/company-history.aspx [Accessed 04-Dec-2017 2017].
[1] 2013 to 2017
[2] Which has 23 stores in Ireland and 50.1% shares of Sprinter which has 47 stores in Spain
[3] Bournemouth, Dunded United, Black pool etc
[4] See Appendix 1
[5] See Appendix 6
[6] Reported over the last five years 2013 to 2017
[7] See Appendix1 & 4 for detailed information
[8] From 2013 to 2017
[9] Operating expense margin
[10] See Appendix 6 &9 for detailed information
[11] See Appendix 2 & 4 for detailed information
[12] When compared to 2016
[13] Property, plant and equipment
[14] 78.04% in 2016 to 14.61% in 2017
[15] See Appendix 7&9 for detailed information
[16] -10.63%
[17] See Appendix 5 for more information on Ratio Analysis
[18] In 2017, the ROCE is 43.79% which mean for 1 pound of equity, the firm is generating 43 pence operating profit
[19] Refer to Appendix 6 for detailed information
[20] Refer to Appendix 6
[21],22 See Appendix 2 for detailed information
[22] Firm might have taken bank loan
[23] Refer Appendix 7 for detailed information
[24] Refer Appendix 7 for detailed information
[25] Refer Appendix 5 for detailed Information
[26] Refer Appendix 1 for detailed information
[27] Refer Appendix 2 and 3 for detailed information
[28] Since ratios is based on the financial information published months ago
[29] Plant ,Property and Equipment
Cite This Work
To export a reference to this article please select a referencing stye below:
Related Services
View allRelated Content
All TagsContent relating to: "Business Analysis"
Business Analysis is a research discipline that looks to identify business needs and recommend solutions to problems within a business. Providing solutions to identified problems enables change management and may include changes to things such as systems, process, organisational structure etc.
Related Articles
DMCA / Removal Request
If you are the original writer of this dissertation and no longer wish to have your work published on the UKDiss.com website then please:


