Food Hygiene of Food Street Vendors in Indonesia
Info: 8992 words (36 pages) Dissertation
Published: 9th Dec 2019
Food hygiene of food street vendors in Indonesia –
Part 1: Knowledge, attitude and practices
Abstract
The aims of this study were to evaluate knowledge, attitudes, and practices on food hygiene among food street vendor in Bandung, Indonesia. A questionnaire was designed for this survey and observation study. From 272 respondents with 98.89% response rate, 82.5 % of them had not taken a basic food hygiene training. A majority of participants were male (76.2%), 82% was at a productive age (25-60 years old), and most of them have less education than high school (65 %). They sold their food majority by cart and tent (97.5%) and not mobile or stay in the same place (84 %). The study showed that in general, food street vendors in Bandung had adequate knowledge and attitude, but poor practice on basic food hygiene. The finding demonstrated there were positive relationships between both knowledge and attitude (p< 0.01), and knowledge and practice (p<0.01). It can assumed that knowledge influence, attitude and practice. Intervention training based would be a decent opportunity for improving safer food handling in the future. (167 words)
Keyword:
Knowledge, Attitude, Practice, food hygiene
- Introduction
The need of ready to eat food has increased, especially in urban population. The previous finding showed that urban households spend almost 15-50 percent of their food money on street food vendors. Based on the data survey conducted by FAO, the consumer of street food included children and students, workers, and housewives (Khairuzzaman, Chowdhury, Zaman, Al Mamun, & Bari, 2014). The changing socialisation and modern lifestyle among people mean they may a less time to prepare their meals, and it has created a higher demand to eat outside the home. In many countries, the study showed that workers, as well as students, have their meal from street vendors (Winarno & Allain, 1991). The demands on ready to eat food and low-cost food have been the most priority things that attract consumers. The prior study confirmed this phenomenon that the demand for ready to eat food without spending a lot of time, cost, fuel, and transportation also less prepared on cooking equipment are the most reasonable points of customers select with street foods (Winarno & Allain, 1991).
Food street business can be categorized as an informal sector unit. The informal sector defined as “units engaged in the production of goods or services with the primary objective of generating employment and incomes to the persons concerned that typically work at a low level of organization with little or no division of labour and capital as factors of production and on a small scale” (Glsossary, 2003). The numbers of street food business were increased in many developing countries (Draper, 1996) and influenced by urban population growth (Winarno & Allain, 1991). The earning prospect and higher consumer demand for food attracted people to run a street food business. In developing countries, creating a business on street food seen as an opportunity for people to gain new income easily because it not need experience, less investment money to set up and no required special training. The study in Ghana stated that women were the higher number of employment, and relatively simple skills and low education level also confirmed the poor resources on food handling practice in developing country (Donkor, Kayang, Quaye, & Akyeh, 2009). The previous study that conducted in one of Indonesia cities, Bogor, showed that annual sales of street foods amount to US$67 million (Winarno & Allain, 1991). In 1983, Bogor as one of the urban cities, with a population of 250 000, has 17,754 street food vendors, one vendor for 14 inhabitants. Approximately 26 percent of workers active in the informal sector in Bogor city were directly employed as street food vendors (Tinker, 1997). This conditions supported by the latest study that showed the number of street vendors in developing countries South East Asia has been increasing rapidly because of monetary crisis in 1998 (Bhowmik, 2005). Based on the data above, it can figure how many street food vendors are available in every urban city. Furthermore, sellers have variability work hours and locations (Lucan et al., 2013). The survey in Bangkok showed street foods offer financial prospects for low and middle-income people, in particular for women. This condition increased when economic recessions appear and attract people become street food vendors for having other jobs they may have. (Chung., 2010, (Hilmi & Fellows, 2011)
Street food defined as “foods and beverages prepared and/or sold by vendors in streets and other public places for immediate consumption or consumption at a later time without further processing or preparation” (WHO, 1996). Some of ready-to-eat foods and beverages or meals prepared at home and consumed on the streets without extra preparation are known as street food (Rane, 2011). The study in Bangkok showed that poorer households cooked only once a day and bought one to two meals of ready-to-eat food from street food vendors. The households confirmed that street food was reasonably priced then cooking at home, readily available with many choices menu and no wasting time for cooking (Hilmi & Fellows, 2011). There are so many kinds of menus for sale by street food vendors which usually originate from its culture. In Indonesia, these include fried food, a variety of soup, salad with varied sauces, simple sweet cake and some other simple foods.
Selling food in the street provide an income for a lot of less education and employment opportunity. However, it also comes with arisen risk of food safety. Less hygiene practise and poor sanitation facilities caused several risks on the consumer. In Indonesia, there are many street food vendors as food hawkers or street food sellers in the stall that sell in on the side of the road which is on pavement or pedestrian side. The previous study confirmed that food safety and quality of street food have grown to be an essential issue, especially for food microbiological contamination and its preparation abuse (Rane, 2011). Some of the microorganism is pathogenic that harmful for human health. Based on World Health Organization, the major issue for human health problems regards foodborne illness were Salmonella, Escherichia Coli, Campylobacter, Listeria and Cholera (WHO, 2007). The several common pathogens that remain in food product showed the poor of hygiene practice during the food preparation. The knowledge, attitude and practise of food handler influence the potential risk for food hygiene practice on premises. Therefore, street foods are supposed to be a major public health risk (Alimi, 2016; Bhowmik, 2005).
In Indonesia, Food & Drug Agency (FDA) namely Badan Pengawasan Obat dan Makanan (BPOM) supported by local authority do share responsibilities for conducting food safety monitoring program. FDA role based on the law and Ministry of Health (MOH) regulations. In 2015, 61 outbreaks cases remained in 34 provinces of Indonesia. From the data monitoring from 2012 to 2014, the percentage of disallowed contaminant in street food remained constant, approximately about 20%. The data also showed that microbiology contamination shared a higher proportion and increased (from 60% to nearly 80 %) rather than harmful chemical use and food additive abuse (FDA, 2015). This circumstance should be investigated what is the root cause of the poor condition. Knowledge, attitude and practise of food handlers played crucial role in implementing basic food hygiene especially microbiology contamination. This study aimed for observing sociodemographic and exploring knowledge, attitude and practice (KAP) of basic food hygiene on food street vendors which can be used as a baseline evidence for further study in public health and food safety regards to street food vendor issues. The results of this study may describe the KAP level of food handlers’ and identified the proper approach intervention for reducing food borne illness.
- Material and Method
2.1 Study population
A total of 272 street food vendors participated in the study. The cross sectional study with opportunistic approach conducted in one sub district in Bandung city. The pilot project has been surveyed 20 respondents of 4 sub-districts for analysing the power of sample and also improved the questionnaire. The statistic confirmed about 252 food street vendors required as a minimal number one district for representative sampling.
2.2 Study Instrument and Data Collection
Face to face interview was conducted using socio-demographic and KAP questionnaire. Socio-demographic questionnaire as a complementary questionnaire consists of factors predicted that influence on respondent’s (food street vendors) knowledge, attitude and practice on food safety and hygiene which are constructed based on literature such as age, sex, marital status, education level, number of employment, employee type (self-employer/ employee), how long they have been a seller and also their profit per day.
Food premises information showed the premises condition and type of food that sale, food preparation, food packaging material, type of facilities (i.e., stall, mobile street vendors, tent, stand, or handed), and also hour length of sale.
The knowledge questionnaire, consists of 10 questions with maximal score 10 in total containing multiple choices questions, was given to respondent for reviewing their awareness on food hygiene. The questions concerning knowledge about food hygiene from storage, cleanness, preparation and personal hygiene linked to transmission of microorganisms, and respondents were asked to choose one answer from among three options.
The questions of attitude consist of 10 questions, with maximal score 50 containing statement agreements. The answer options for these question used Likert scales ranging from 1 (very disagree) to 5 (very agree) to show a subjective response on their agreement on food hygiene implementation. The scores for attitude were similar with the range from 1-5, the higher score represents better manner on food hygiene.
The scores for practice on food hygiene were calculated from 56 questions based on an audit that observed on premises. The appearance of reducing cross contamination on food handlers/vendors was noted e.g. personal hygiene, food storage, pest control and utensil/ equipment. The source of water supply was investigated also the ice (whether commercially bought or self-made). The presence of food exterior facilities and sanitary utilities was determined e.g. availability of toilets, adequate washing facilities, sink, surface, waste, and food packaging. The availability of cold storage/refrigeration storage was also checked.
2.3 Statistical Analysis
The data was analyzed by a statistical computer program (SPSS version 20). The descriptive t-test analysis was used for analyzing sociodemographic data. The knowledge, attitude and practice of food handlers were analyzed by using frequency, mean and standard deviation. Food safety knowledge scores for the respondents were, calculated based on the multiple choice answer for each question, only for the items of correct answers was assigned a score: +1 and 0 in the case of don’t know/wrong option. For ten attitude questions calculated from the Likert scale point 1-5, for question number 2, 6 and 9, the reversible point used to calculate the point because it was a negative question.
The answers classified as +1 point when the auditor/interview found out the correct evidence on respondent’s premises and 0 points when they failed to find it. However, not available marked for respondents who did not have the correlation item with the type of food. The total percent score for the respondents’ attitude then calculated by sum up all score in total.
The relationship between knowledge, attitude and practice scores have been computed by using non parametric result Spearman’s rank correlation.
- Result
- Sociodemographic
We obtained 272 responses from one area, 269 participants have completed the questions (response rate= 98.89%). Distribution of some socio-demographics characteristics respondents described in Table 1.
Table 1 Socio demographic variables and characteristic
of street food vendors in Bandung City
| Variable category | Number | % | |
| Gender | Male | 205 | 76.21 |
| Female | 64 | 23.79 | |
| Age group (years) | Teen(15-24) | 42 | 15.61 |
| Young people (25-40) | 102 | 37.92 | |
| Mature (41-60) | 119 | 44.24 | |
| Elderly (> 60) | 6 | 2.23 | |
| Marital Status | Married | 216 | 80.30 |
| Unmarried | 53 | 19.70 | |
| Education Level | No Schooling | 5 | 1.86 |
| Elementary school | 71 | 26.39 | |
| Junior High School | 99 | 36.80 | |
| High school | 78 | 29.00 | |
| Diploma | 10 | 3.72 | |
| Graduate | 6 | 2.23 | |
| Profit per day (IDR) | < 50 K | 17 | 6.32 |
| 50 – 100 K | 131 | 48.70 | |
| 101 – 200 K | 64 | 23.79 | |
| 201 – 300 K | 26 | 9.67 | |
| 301 – 400 K | 9 | 3.35 | |
| > 401 K | 22 | 8.18 | |
| Job type | Part time | 5 | 1.86 |
| Full time | 264 | 98.14 | |
Table 1 Socio demographic variables and characteristic
of street food vendors in Bandung City
| Variable category | Number | % | |
| Length of work | < 1 year | 43 | 16.00 |
| 1 – 5 years | 78 | 29.00 | |
| 5 years < x < 10 years | 33 | 12.27 | |
| > 10 years | 96 | 35.69 | |
| Sale position | Stay | 226 | 84 |
| Move | 43 | 16 | |
| Day of works | > 5 days | 4 | 1.5 |
| 5-6 days | 155 | 57.6 | |
| 7 days | 110 | 40.9 | |
| Duration of works | less than 5 hours | 6 | 2.2 |
| > 5 – 8 hours | 84 | 31.2 | |
| > 8 – 12 hours | 153 | 56.9 | |
| > 12 – 18 hours | 22 | 8.2 | |
| > 18 -24 | 4 | 1.4 | |
| Type of vendor | Hawker | 5 | 1.86 |
| Cart | 172 | 63.94 | |
| Tent | 88 | 32.71 | |
| Car/Truck | 4 | 1.49 | |
| Trained | Yes | 47 | 17.47 |
| No | 222 | 82.53 | |
Table 1 showed seventy-six percent of the food street vendors were male. The mature age (range 41–60 years) group was the highest proportion and mostly married, 80% respectively. Furthermore, in total, more than half of respondents were attained elementary school and high school, while the others (36%) have graduated from junior high school. Almost respondents was a full-time job (98%), only 35% of respondents had worked in the food business for more than 10 years. Most of them were spent 5 – 7 days a week with more than 8 hours until 12 hours for doing their job. The food handlers that has been trained by the local authority, their owner or others local empowerment community was only 17.47% respectively. Most of them sold the foods by carts (63, 94%), and tent (32.71%). They spent mostly 5-6 days with 8 – 12 hours per day for selling their products. The majority of respondents (55.02%) were having lower income than Bandung local monthly wage rate which is IDR 2,800 K in 2017.
3.2 Food Safety Knowledge
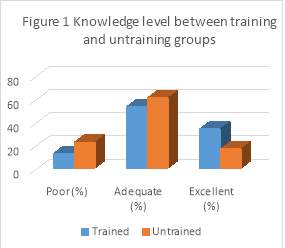
The food safety knowledge of respondents was adequate (6.39 + 1.26) which possible maximal 10 marks. The correct answers for all section had more than 60% correct in average except for temperature questions [Table 2]. The knowledge between trained and untrained respondents about questions on correct temperature for chillers, cross contamination, cleaning, washing hand, and smoking permitting when handling food was not actually different in percentages. However, the trained respondents have advance knowledge related questions about the temperature in the freezer (10.64%) and storage (up to 82.98 %) rather than the untraining people. The table also describes that the trained people have a lower percentage (78.72%) than untrained (86.49%) for knowledge of wearing personal safety.
Table 2 Response to knowledge of hygiene and safety between training and untraining groups
The data confirmed that training people had a higher percentage of having better knowledge (87.2%) rather than untraining people (77.5%)[Fig 1].
3.3 Food Safety Attitudes
Table 3 showed the attitude of respondents toward applying food hygiene practise and its risk to their food business. The majority of interviewees showed their positive attitude for practising food safety while they work (100%), keeping nails clean (98.51%), and having better knowledge on food safety (99.25%). They realized that they need applied food hygiene in daily work (96.65%). In addition, food handlers also believe that using correct temperature for storaging food was important (95.87%). The food attitude score was also higher for having safe of food supply safer (92.19%) and for keeping trust from the consumer (98.88%). Finding revealed, the food handlers had a lower percentage than others statement for an agreement to punishment effect (84.38%) and personal hygiene attitude for chewing, eating and smoking (85.35%). Overall, the food handlers have a positive attitude (43.16 + 2.95) with maximum 50 possible points.
Table 3 Total response respondent attitude by Likert Scale
| Attitude | Total Response Likert Scale (5) | |||||
| Mean + SD | Strongly Disagree Strongly Agree | |||||
| 1 | 2 | 3 | 4 | 5 | ||
| Handling food safety is an important part of my job responsibilities | 4.81 + 0.40 | – | – | – | 52(19.34) | 217(80.66) |
| Having a clean nail is not important when handling food | 4.84 + 0.43 | – | 1(0.37) | 3(1.11) | 35(13.01) | 230(85.50) |
| Storing food at the correct temperature is important for food safety | 4.52 + 0.66 | 2(0.74) | 2(0.74) | 7(2.60) | 100(37.17) | 158(58.70) |
| Applying food hygiene practice in my daily work should happen all the time | 4.66 + 0.53 | – | 2(0.74) | 4(1.48) | 80(29.74) | 180(66.91) |
| Better knowledge about food hygiene safety is important | 4.83 + 0.44 | 1(0.37) | – | 3(1.11) | 41(15.24) | 226(84.01) |
| It is acceptable for raw food and cooked food to be kept on the same shelf | 4.68 + 0.85 | 4(1.48) | 13(4.83) | 5(1.85) | 21(7.80) | 226(84.01) |
| Chewing, eating and smoking when preparation food provides a risk of contamination | 4.38 + 0.90 | 4(1.48) | 4(1.48) | 21(7.80) | 77(28.62) | 156(58.73) |
| Selling food without consideration for your customer health and safety may result in penalty such fine and/or jail as a punishment | 4.22 + 0.92 | 5(1.86) | 12(4.46) | 25(9.29) | 103(38.29) | 124(46.09) |
| The use of safer material ingredient from approved/ trusted supplier is not necessary | 4.69 + 0.69 | 4(1.48) | – | 17(6.31) | 52(19.33) | 196(72.86) |
| Selling food without consideration for your customer health and safety will risk losing customer trust. | 4.85 + 0.47 | 1(0.37) | 2(0.74) | – | 30(11.15) | 236(87.73) |
3.4 Practise
The observation on food hygienic practices showed the limitation performance in many aspects. The practice score of food handlers were 44.89 ± 10.39 (100 possible marks). In cross contamination related to personal hygiene, pointed that only 24.6% of those who worked with food routinely use head cover or hat, a small number of using protective clothes (5.95%) and almost one hundred percent of them rarely used disposal clothes for wiping the surface (Table 4). The data presented half of them did not use food grade container for storing the food (54.65%), and one-third of those food handlers did not cover the food to protect from contamination(31.97%), and the used of a dirty container was remained (21.19%). The majority of respondents did not control for flying insect during their work activity (86.99%). There were one ten respondents used similar chopping board between raw material and ready to eat food. Most of them (75.46%) did not bring the chopping board because the food was already cooking at home. Only a half respondent who has a source available in near their place (56.88%). However, the tank which used to store the water almost more than a half of them (56.10%) did not keep the cleanness. The respondent also stated they just buy the iced without knowing it is safe (5.58%).
Table 4 Food handlers’ practices toward preventing cross contamination
| Score | Observed | The total response (%) n=269 | ||||||||||||||
| Yes | No | NA | ||||||||||||||
| Cross-contamination | ||||||||||||||||
| Personal hygiene | ||||||||||||||||
| Q1 | Staff wearing head covering/ tying hair | 66(24.54) | 203(75.46) | |||||||||||||
| Q2 | Clothes are clean | 262(97.40) | 7(2.60) | |||||||||||||
| Q3 | Clean, short and unpolished nails | 244(90.71) | 25(9.29) | |||||||||||||
| Q4 | No smoking/chewing/eating | 226(84.01) | 43(15.99) | |||||||||||||
| Q5 | Using apron/ protective clothes | 16(5.95) | 253(94.05) | |||||||||||||
| Q6 | Disposable cloths or paper towels for wiping surface available | 1(0.37) | 268(99.63) | |||||||||||||
| Storage | ||||||||||||||||
| Q7 | Food store in food grade container | 147(54.65) | 122(45.35) | |||||||||||||
| Q8 | The food container is clean | 212(78.81) | 57(21.19) | |||||||||||||
| Q9 | Food are covered to protect from contamination | 183(68.03) | 86(31.97) | |||||||||||||
| Q10 | Food is stored based on consideration free of cross contamination between materials | 262(97.40) | 7(2.60) | |||||||||||||
| Q11 | Food storage stored up the ground minimal 45 cm. | 265(98.51) | 4(1.49) | |||||||||||||
| Pest Control | ||||||||||||||||
| Q12 | Controls for flying insects | 35(13.01) | 234(86.99) | |||||||||||||
| Q13 | No evidence of flying insects | 222(82.53) | 47(17.47) | |||||||||||||
| Utensils | ||||||||||||||||
| Q14 | Using stainless steel and hard plastic material or other suitable material | 265(98.51) | 4(1.49) | |||||||||||||
| Q15 | Knives, chopping boards and other equipment are clean | 211(78.44) | 58(21.65) | |||||||||||||
| Q16 | Separate chopping board for raw ingredients and ready-to-eat foods are available | 40(14.87) | 26(9.67) | 203(75.46) | ||||||||||||
| Q17 | Not used repeated plate | 121(44.98) | 148(55.02) | |||||||||||||
| Source of water | ||||||||||||||||
| Q18 | Available | 153(56.88) | 116(43.12) | |||||||||||||
| Q19 | Water tanks/ hose are clean | 118(43.90) | 151(56.10) | |||||||||||||
| Q20 | Water for cooking not from re used water | 269(100) | 0 | |||||||||||||
| Q21 | Ices used for food is made/buy safely | 38(14.13) | 15(5.58) | 216(80.30) | ||||||||||||
It seems that wash hand basin has poor accommodation facility, from the location only 27.88% available in the kitchen area. Poor cleanness (18.96%), multi used facility has not only for hand washing (9.67), and more than a half (52.79%) used re used water from the bucket which used for washing utensil or plate. Hot water did not available in all respondent places. The using of soap to reduce the bacterial remain lower (26.02%), and there was not a paper towel to rinse hand. The wastewater contamination has remained almost a half percentage (43.90%).In the toilet, the wash hand basin only available in a few places (20.07%). The hot water did not in place at all. Based on observation, not all toilet and respondent using soap, only 65.67% remain in this observation. Bacterial soap rarely used (17.10%) and only a few paper towels available (6.69%). The poor condition also showed in the sink. All observation item was lower from availability (18.96%), separate sink (0%), cleanness (13.75%), water source (17.10%), hot water (0%), detergent (42.38%), disinfectant (0%), paper towel (0%) and wastewater (41.26%). For wall or surface in good condition. However, for waste only small number that stored well and having a lid (15.24%).All respondent who works with risk food or sale ice did not have a thermometer and record the temperature storage. In addition, some of them did not keep the temperature below 8 C (9.67%).
Table 5 Hygiene and Sanitation facilities condition for food hygiene practise
| Score | Observed | The total response (%) n=269 |
|||
| Yes | No | NA | |||
Facilities
Wash hand basin in food preparation area
| Q22 | Wash hand basin is available in the kitchen area | 75(27.88) | 194(72.12) | |||||
| Q23 | Clean | 51(18.96) | 218(81.04) | |||||
| Q24 | Facility only for hand washing | 26(9.67) | 243(90.33) | |||||
| Q25 | Water source is not taken from re used water | 127(47.21) | 142(52.79) | |||||
| Q26 | Hot water available | 0(0) | 269(100) | |||||
| Q27 | Soap available | 70(26.02) | 199(73.98) | |||||
| Q28 | Bactericidal soap available | 7(2.60) | 262(97.40) | |||||
| Q29 | Hand dryer/ paper towels are available | 0(0) | 269(100) | |||||
| Q30 | Waste water no risk contamination | 151(56.10) | 118(43.9) | |||||
| Toilet | ||||||||
| Q31 | The toilet locates within a convenient distance | 208(77.32) | 61(22.68) | |||||
| Q32 | Clean | 187(69.52) | 82(30.48) | |||||
| Q33 | Wash hand basin available | 54(20.07) | 215(79.93) | |||||
| Q34 | Hot water available | 0 | 269(100) | |||||
| Q35 | Soap available in toilet/having their own | 175(65.06) | 94(34.94) | |||||
| Q36 | Bactericidal soap available | 46(17.10) | 233(86.62) | |||||
| Q37 | Paper towels are available | 18(6.69) | 251(93.91) | |||||
| Sink | ||||||||
| Q38 | Available | 51(18.96) | 218(81.04) | |||||
| Q39 | Separate sink for washing food is available | 0 | 269(100) | |||||
| Q40 | Clean | 37(13.75) | 232(86.25) | |||||
| Q41 | Water source not taken from re used water | 46(17.10) | 233(86.62) | |||||
| Q42 | Hot water available | 0 | 269(100) | |||||
| Q43 | Detergents for washing utensils are available | 114(42.38) | 155(57.62) | |||||
| Q44 | Disinfectants available | 0(0) | 269(100) | |||||
| Q45 | Paper towels or air drying for clean equipment | 0(0) | 269(100) | |||||
| Q46 | Waste water no risk of contamination | 111(41.26) | 158(58.74) | |||||
| Wall | ||||||||
| Q47 | The materials are easy to clean | 265(98.51) | 4(1.49) | |||||
| Q48 | No damage/holes | 264(98.14) | 5(1.86) | |||||
| Waste | ||||||||
| Q49 | Disposal bag or waste container is available | 259(96.28) | 10(3.72) | |||||
| Q50 | Well stored and having a lid | 41(15.24) | 228(84.76) | |||||
| Food packaging | ||||||||
| Q51 | Disposable used | 262(97.40) | 7(2.60) | |||||
| Temperature control | ||||||||
| Q52 | Ice box or equivalent available | 47(17.47) | 1(0.37) | 221(82.16) | ||||
| Q53 | Chilled food is kept below 8˚C | 22(8.18) | 26(9.67) | 221(82.16) | ||||
| Q54 | Fridge thermometers available | 0(0) | 48(17.84) | 221(82.16) | ||||
| Q55 | Records of temperature available | 0(0) | 269(100) | |||||
| Additional if necessary | ||||||||
| Q56 | Covering wound, burn with bandage and using gloves | 269(100) | ||||||
3.2 Correlations Knowledge, Attitude and Practise
A Spearman rank correlation with level correlation p < 0.01 was used to evaluate the relationship between knowledge-attitudes (K-A), knowledge-practices (K-P), and attitudes-practices (A-P) scores in groups. There were positive correlations between K-A (0.170) and K-P (0.289), but there has not a correlation between A-P (0.106).
Table 5 Correlations Knowledge, Attitude and Practise
| Variable(s) | Knowledge | Attitudes | Practices |
| Knowledge | 1 | .170** | .289** |
| Attitudes | .170** | 1 | .106 |
| Practices | .289** | 0.106 | 1 |
** Correlation is significant at the p < 0.01 level (2-tailed).
- Discussion
WHO stated street-vended food could lead significant public health problems because of food safety issues. Several caused has been identified as potential sources for supporting lack food hygiene practises such as lack of basic hygiene and sanitation facilities, less of monitoring food street business, an insufficient resource for inspection and limitation financial aid for testing analysis and also poor knowledge of food handlers in basic food hygiene practise (WHO, 1996). The previous study confirmed the outbreak incidence of food poisoning was occurred in caterers because of bacterial contamination (Dawson et al., 2006; Dorozynski, 2000; Hennekinne, De Buyser, & Dragacci, 2012). The insufficient knowledge, attitude and practices of food handlers may cause cross-contamination or transmit pathogens themselves because of poor of personal hygiene. A previous stated that the sources of training, certification, and experience indicated significantly affect the level of food safety knowledge. However, the length of hours of training did not increase knowledge (Lynch, Elledge, Griffith, & Boatright, 2003). Another study also confirmed that KAP on food safety and hygiene level before and after training exposed. The significant change in their perception to food safety knowledge increased from an average 24.35% to 66.2% and also practices ranged from 37.5% to 50.8% after training interventions (Choudhury, Mahanta, Goswami, & Mazumder, 2011). In addition, the behaviour change for implementing food hygiene practise should follow by adequate resources and an appropriate management culture because the behaviour alteration resulted from the training will not simply occur (Clayton, Griffith, Price, & Peters, 2002).
This study demonstrated that food handlers have adequate knowledge the data describes they have an opportunity to have the basic food hygiene training for enhancing their knowledge in several aspects which lower than ninety percent marks for storing food, temperature and cross contamination as well as happened in Turkey (Baş, Şafak Ersun, & Kıvanç, 2006). The study in 2003 confirmed that the basic lack of hygiene knowledge might cause a major barrier to the effective application of food hygiene in small food trades(Walker, Pritchard, & Forsythe, 2003).
Furthermore, they also have a positive attitude (43.16 + 2.95), but almost one-five of them believe that chewing, eating and smoking is allowed. It may happen because they did not know yet how the cross contamination transport. This supported correlation result which knowledge has a significant relationship with attitude. It showed they need to clarify for un-acceptable attitude when preparing the food. The lower percentage also occurred in punishment effect than another statement attitude, it gave an opportunity to run deterrent effect on controlling food inspection for those who break the regulation. The previous study in Indonesia showed poor hygiene practise in food Street vendors compares to the restaurant. This study also confirmed that poor hand washing hygiene, direct contact with food male sex and low education were the characteristics of street vendor (Vollaard et al., 2004). Those conditions also similar with this study that resulted poor hygiene practises score and characteristic of the respondent who male sex in working age. The study also showed that poor hand washing using bacterial soap in food preparation area (2.60%) and in the toilet (17.10%). The previous studies stated that hand-washing is a simple and effective way to reduce the risk contamination of foodborne pathogens (Curtis & Cairncross, 2003; Todd, Michaels, Smith, Greig, & Bartleson, 2010). The previous study confirmed that hygiene practices of food handlers are one of the five important factors of foodborne illness that occurs in poor hygiene practices (Ross & Guzewich, 1999).Inadequate practice in their personal hygiene such as hand washing and sanitation the environment may contribute to food contamination. In addition, the lack of infrastructure of food hygiene and sanitation facilities that presented by street food in Indonesia has mentioned by WHO as a potential risk for food borne illness. The previous study in Malaysia describes the significant relationship between knowledge and practise (Tan, Bakar, Abdul Karim, Lee, & Mahyudin, 2013). Similar, finding describes the positive correlation between knowledge and practise, this would be a decent chance to improve their practise food hygiene through knowledge.
- Conclusion
To sum up, food handlers have adequate knowledge and attitude, but some points should give attentions for improving food hygiene practise. Intervention training based used effective method should be provided to address the problems. However, the lack of facility for hygiene and sanitation had better have more attention. Monitoring routinely and give deterrent effect might be useful to prevent and keep sustain their natural work setting for implementing food hygiene.
(Total 4884 words including abstract and without reference)
REFERENCE
- Alimi, B. A. (2016). Risk factors in street food practices in developing countries: A review. Food Science and Human Wellness, 5(3), 141-148.
- Baş, M., Şafak Ersun, A., & Kıvanç, G. (2006). The evaluation of food hygiene knowledge, attitudes, and practices of food handlers’ in food businesses in Turkey. Food Control, 17(4), 317-322. doi:https://doi.org/10.1016/j.foodcont.2004.11.006
- Bhowmik, S. K. (2005). Street vendors in Asia: a review. Economic and Political Weekly, 2256-2264.
- Chung, C., Ritoper, S. & Takemoto, S. 2010. Bangkok and access to food for low-income residents, Massachusetts Institute of Technology, Boston
- Choudhury, M., Mahanta, L. B., Goswami, J. S., & Mazumder, M. D. (2011). Will capacity building training interventions given to street food vendors give us safer food?: A cross-sectional study from India. Food Control, 22(8), 1233-1239. doi:http://doi.org/10.1016/j.foodcont.2011.01.023
- Clayton, D. A., Griffith, C. J., Price, P., & Peters, A. C. (2002). Food handlers’ beliefs and self-reported practices. International Journal of Environmental Health Research, 12(1), 25-39. doi:10.1080/09603120120110031
- Curtis, V., & Cairncross, S. (2003). Effect of washing hands with soap on diarrhoea risk in the community: a systematic review. The Lancet infectious diseases, 3(5), 275-281.
- Dawson, S., Evans, M., Willby, D., Bardwell, J., Chamberlain, N., & Lewis, D. (2006). Listeria outbreak associated with sandwich consumption from a hospital retail shop, United Kingdom. Euro Surveill, 11(6), 89-91.
- Donkor, E. S., Kayang, B. B., Quaye, J., & Akyeh, M. L. (2009). Application of the WHO keys of safer food to improve food handling practices of food vendors in a poor resource community in Ghana. International journal of environmental research and public health, 6(11), 2833-2842.
- Dorozynski, A. (2000). Seven die in French Listeria outbreak. BMJ: British Medical Journal, 320(7235), 601.
- Draper, A. (1996). Street foods in developing countries: the potential for micronutrient fortification: John Snow, Incorporated, OMNI PROJECT.
- Glossary, O. (2003). OECD Glossary of Statistical Terms: On line at: http://stats. oecd. org/glossary/detail. asp.
- Hennekinne, J. A., De Buyser, M. L., & Dragacci, S. (2012). Staphylococcus aureus and its food poisoning toxins: characterization and outbreak investigation. FEMS microbiology reviews, 36(4), 815-836.
- Hilmi, M., & Fellows, P. (2011). Selling street and snack foods: Univerza v Mariboru, Fakulteta za kmetijstvo in biosistemske vede.
- Khairuzzaman, M., Chowdhury, F. M., Zaman, S., Al Mamun, A., & Bari, M. L. (2014). Food safety challenges towards safe, healthy, and nutritious street foods in Bangladesh. International journal of food science, 2014.
- Lucan, S. C., Varona, M., Maroko, A. R., Bumol, J., Torrens, L., & Wylie-Rosett, J. (2013). Assessing mobile food vendors (aka street food vendors)—methods, challenges, and lessons learned for future food-environment research. Public health, 127(8), 766-776.
- Lynch, R. A., Elledge, B. L., Griffith, C. C., & Boatright, D. T. (2003). A comparison of food safety knowledge among restaurant managers, by source of training and experience, in Oklahoma County, Oklahoma. Journal of Environmental Health, 66(2), 9.
- Rane, S. (2011). Street vended food in developing world: hazard analyses. Indian journal of microbiology, 51(1), 100-106.
- Ross, M., & Guzewich, J. (1999). Evaluation of risks related to microbiological contamination of ready-to-eat food by food preparation workers and the effectiveness of interventions to minimize those risks. FDA White Paper, FDA, CFSAN.
- Tan, S. L., Bakar, F. A., Abdul Karim, M. S., Lee, H. Y., & Mahyudin, N. A. (2013). Hand hygiene knowledge, attitudes and practices among food handlers at primary schools in Hulu Langat district, Selangor (Malaysia). Food Control, 34(2), 428-435. doi:https://doi.org/10.1016/j.foodcont.2013.04.045
- Tinker, I. (1997). Street foods: Urban food and employment in developing countries: Oxford University Press.
- Todd, E. C., Michaels, B. S., Smith, D., Greig, J. D., & Bartleson, C. A. (2010). Outbreaks where food workers have been implicated in the spread of foodborne disease. Part 9. Washing and drying of hands to reduce microbial contamination. Journal of Food Protection, 73(10), 1937-1955.
- Vollaard, A., Ali, S., Van Asten, H., Ismid, I. S., Widjaja, S., Visser, L., . . . Van Dissel, J. (2004). Risk factors for transmission of foodborne illness in restaurants and street vendors in Jakarta, Indonesia. Epidemiology and infection, 132(05), 863-872.
- Walker, E., Pritchard, C., & Forsythe, S. (2003). Food handlers’ hygiene knowledge in small food businesses. Food Control, 14(5), 339-343. doi:https://doi.org/10.1016/S0956-7135(02)00101-9
- WHO. (1996). Essential safety requirements for street-vended foods.
- Winarno, F., & Allain, A. (1991). Street foods in developing countries: lessons from Asia. Alimentation, Nutrition et Agriculture (FAO); Alimentacion, Nutricion y Agricultura (FAO).
Cite This Work
To export a reference to this article please select a referencing stye below:
Related Services
View all


Related Content
All TagsContent relating to: "Food and Nutrition"
Food and Nutrition studies deal with the food necessary for health and growth, the different components of food, and interpreting how nutrients and other food substances affect health and wellbeing.
Related Articles

DMCA / Removal Request
If you are the original writer of this dissertation and no longer wish to have your work published on the UKDiss.com website then please: