Cost and Journey Time Analysis for a Hyperloop System Analogous to HS2 Phase 1
Info: 20018 words (80 pages) Dissertation
Published: 15th Nov 2021
Tagged: Transportation
Abstract
This dissertation investigates the construction cost and potential journey times of a proposed Hyperloop system in the UK, connecting London Euston to Birmingham Curzon Street.
The proposed route follows existing transport infrastructure where possible, making extensive use of the M1 corridor to mitigate the visual, environmental and economic impact of the structure. Rider comfort is maintained by limiting curvature radii to ensure lateral, vertical positive and vertical negative accelerations do not exceed 0.5 g, 0.3 g and 0.2 grespectively.
To reduce the construction cost associated with tube widening requisite for higher velocities, the maximum capsule velocity was limited to 735 km/hover the 178 km route, enabling a 2 m internal diameter tube to be used. Journey times for such a system were found to be 15 minutes, 53 seconds: less than one third of the 49 minutes estimated to take by HS2 Phase 1 to complete the same journey.
In producing a cost estimate, the key components of a Hyperloop system were appraised individually, with utilisation of the extensive construction capital cost database in Spon’s Civil Engineering and Highway Works Price Book. Components considered include: land acquisition; pylon construction; foundations; steel tube; vacuum pumps; stations; linear accelerators; tunnelling; design and surveying; capsules; and other additional construction costs.
As per UK Government infrastructure guidance, an optimism bias provision factor of 66% was applied to the approximated costs, giving a preliminary construction cost estimate of £9.03 billion for the Hyperloop system: significantly less than the £27.4 billion cost estimate for HS2 Phase 1.
Through determination of this preliminary cost estimate, a framework for UK Hyperloop appraisal has been created, enabling future research to refine and build upon the premises of this research.
Click to expand Table of Content
Table of Contents
1. Introduction
1.1. What is the Problem?
1.2. Why is it a Problem?
1.3. Research Aims and Objectives
1.4. Methodology
2. Literature Review
2.1. Initial Hyperloop Concept
2.2. Development of the Concept
2.3. Design Elements
3. System Arrangement
3.1. Velocity
3.2. Route
3.3. System Capacity
3.4. Tube Span
3.5. Pylon Dimensions
4. Cost Analysis
4.1. Land
4.2. Pylons
4.3. Foundations
4.4. Steel Tube
4.5. Vacuum Pumps
4.6. Stations
4.7. Linear Accelerators
4.8. Tunnelling
4.9. Other Construction Costs
4.10. Design
4.11. Capsules
4.12. Optimism Bias Provision
5. Results
5.1. Total Cost
5.2. Journey Times
6. Discussions, Limitations and Recommendations
6.1. Fundamental Technology
6.2. System Requirements
6.3. Land
6.4. Pylons
6.5. Foundations
6.6. Steel Tube
6.7. Vacuum Pumps
6.8. Stations
6.9. Linear Accelerators
6.10. Tunnels
6.11. Other Construction Costs
6.12. Design
6.13. Capsules
6.14. Journey Times
7. Conclusions
8. References
9. Appendix
Table of Tables
Table 1 – Pod velocity to minimum tube radii of curvature
Table 2 – Cost breakdown of land acquisition
Table 3 – Cost breakdown for pylon construction
Table 4 – Cost breakdown for pylon foundations
Table 5 – Cost breakdown for steel tube
Table 6 – Cost breakdown of vacuum pumps
Table 7 – Cost breakdown for stations
Table 8 – Cost breakdown of linear accelerators
Table 9 – Cost breakdown of tunnelling
Table 10 – Cost breakdown of other construction costs
Table 11 – Capsule cost breakdown for 64 passenger capacity
Table 12 – Total capital cost summary for Hyperloop
Table of Figures
Figure 1 – Conceptual Design Sketch of Hyperloop Capsule (Musk, 2013)
Figure 2 – Longitudinal cross-section of a hollow passenger pod that lets mass flow pass through it (Chin, et al., 2015)
Figure 3 – Longitudinal cross-section of a hollow passenger pod with a diffuser to reduce the Mach number of flow into the compressor (Chin, et al., 2015)
Figure 4 – Exponential relationship between pod speed and tube diameter (Chin, et al., 2015)
Figure 5 – Drag Coefficient vs Mach number (Decker, et al., 2017)
Figure 6 – Optimum pylon spacing for a given tube area (Decker, et al., 2017)
Figure 7 – Energy cost vs tube pressure for leakage rate of 1.2 kg s-1 m-3 (Decker, et al., 2017)
Figure 8 – Optimal Pressures and Resulting Energy Cost for a Range of Leakage Rates (Decker, et al., 2017)
Figure 9 – Tube radii of curvature with pod velocity
Figure 10 – London-Birmingham Hyperloop route, showing curvature radii
Figure 11 – Vertical curvature parameters
Figure 12 – Tube and route elevation profile
Figure 13 – Pylon height distribution
Figure 14 – Arrivals by time band for central London, 2015 (Department for Transport, 2016)
Figure 15 – Wall thickness vs Steel material cost and Maximum span for cantilever and simply supported ultimate limit state conditions
Figure 16 – Route breakdown by land type
Figure 17 – Hyperloop and HS2 velocity-time profile comparison
List of Symbols and Acronyms
| Abypass | Sectional area of tube bypass zone around capsule |
| Atube,C | Sectional area of capsule compressor |
| Atube | Sectional area of tube interior |
| Asteel,cross | Sectional area of steel tube wall |
| Asteel,ext | External surface area of steel tube |
| a | Acceleration |
| dext | External tube diameter |
| dint | Internal tube diameter |
| dpylon | Pylon diameter |
| E | Young’s modulus |
| fcd | Concrete design strength |
| fy | Steel yield strength |
| g | Acceleration due to gravity |
| H | Height of the initial fixed location |
| h | Tube height |
| I | Second moment of area |
| Lcant | Cantilever span |
| Lroute | Route length |
| Lsimple | Simply supported span |
| l0 | Effective height of pylon |
| MEd | Design moment |
| MRd | Moment resistance |
| NEd | Design axial load |
| NRd | Axial resistance |
| P | Point load |
| R | Radius of curvature |
| Rvert | Vertical curvature radius |
| t | Tube wall thickness |
| v | Velocity |
| w | Linear load |
| X | Horizontal distance between fixed locations |
| x | Distance from initial fixed location |
| Y | Change in height between fixed locations |
| ρsteel | Density of steel |
1. Introduction
1.1. Hyperloop Concept
The Hyperloop is a concept for an ultra-high speed intercity transportation system that was initially outlined by Elon Musk in an Alpha paper in 2013. It offers tremendous advantages over a traditional high speed railway line in terms of cost and speed.
Musk’s initial proposal outlined a system that would travel at 760 mph, covering the distance between Los Angeles and San Francisco in just 35 minutes, with a total capital cost of £4.06 billion[1] (Musk, 2013).
This is a dramatic improvement over the California high-speed rail line (CHSR) which the proposal was made in response to, with this line set to take just under three hours to complete the same journey at a capital cost of £51.9 billion1 (California High-Speed Rail Authority, 2016).
1.2. Cost Estimate Variation
Musk’s initial low-cost estimate has since been challenged, with current cost estimates ranging from £8.5 million/kmin the original Alpha proposal, to £31.8 million/kmfor a proposed link between Helsinki and Finland (Korosec, 2016).
This cost variation is a consequence of differences in terrain and topography, combined with a maturing of the understanding needed to produce a commercially operated system.
As it stands, no detailed analysis on the cost of constructing a Hyperloop system in the UK has been conducted, which means meaningful cost comparisons between Hyperloop, high-speed rail and other transit systems in the UK cannot be made.
This is problematic because a Hyperloop system cannot be readily considered in national discussions of infrastructure investment, despite its many potential advantages.
1.3. UK Transport Problem
The United Kingdom’s North-South rail services face a crowding crisis in the next 20 years (The Economist, 2011a) unless substantial action is taken to alleviate demand or increase capacity.
Demand on the three main rail lines connecting London to the North – the West Coast Main Line, East Coast Main Line and the Midlands Main Line – is expected to more than double on 2003 levels by 2031.
This increase in demand is partly stimulated by enhancements to existing infrastructure (Atkins, 2003), which highlights a circularity issue in traditional methods of rail upgrades and shows that the high cost of rail infrastructure development means capacity enhancements cannot be made fast enough to alleviate demand.
With an anticipated cost of £55.7 billionfor infrastructure construction and rolling stock purchase (HM Treasury, 2015), HS2 will be the most expensive infrastructure project in UK history.
Given the high stakes of this project, and the failures that previous high-speed rail lines have experienced (Wellings, 2014), it seems worthwhile to explore the potential for cheap and fast capacity that Hyperloop offers.
Furthermore, Hyperloop has many inherent characteristics that make it more suitable for the UK than high-speed rail.
The UK is a densely-populated country, with urban areas comprising eleven percent of total land use in England (Watson & Albon, 2012). Consequently, HS2 requires significant use of tunnelling to reduce the degree of land acquisition required in urban areas and to mitigate its environmental impact.
In addition to this, noise from HS2 is a major concern for many residents in the UK, with many houses along the route claiming noise will be detrimental to their quality of living (HS2 Action Alliance, n.d.).
Hyperloop solves these concerns through its tube design. By using a tube as both structure and a fixed guideway, Hyperloop has an inherently efficient design that can be more easily prefabricated and installed on pylons, reducing the land acquisition requirement. Furthermore, the acoustic containment provided by the sealed tube reduces the potential for audible disruption from the system.
1.4. Research Aims and Objectives
The aim of this research is to improve the understanding of a potential Hyperloop system in the UK. Towards this aim, three key research objectives are identified.
Firstly, an estimation of journey times between London and Birmingham is to be calculated. This must be for a system which is economically viable and practicable, with the same capacity and primary connectivity attributes as HS2 Phase 1. For simplicity, this research only considers a direct London Euston to Birmingham Curzon Street connection, without stations at Old Oak Common and Birmingham Interchange as per HS2 (Butcher, 2017).
Secondly, a framework is to be created for costing a UK Hyperloop system, providing a backbone for future research to build upon and refine. This is important because cost forecasting for large infrastructure projects is inherently challenging. Due to the high number of cost influencing parameters involved, any cost estimate is wrong by varying degrees of inaccuracy. For an unproven technology such as Hyperloop, this difficulty is particularly pronounced.
Finally, this framework is to be used to calculate a preliminary cost estimate for the proposed route, giving an initial insight into the order of magnitude of construction costs for such a system.
1.5. Methodology
A proposal for a system arrangement was created based on the established parameters for Hyperloop ride comfort and tube-pod dimensions for given velocities. Identical capacity to HS2 was ensured by specifying a sufficient number of tubes and pods.
Journey times were then calculated for this proposed route, with consideration for the velocity constraints outlined in the system arrangement. This was done with use of an excel spreadsheet, which incrementally increases or decreases the capsule velocity towards the required speed limit along the route without exceeding acceleration or deceleration limits. The time taken by the capsule to complete the journey was then calculated with use of equations of motion for a particle undergoing constant acceleration.
A cost framework for the system was created by appraising the key elements of the Hyperloop construction individually. The system was dissected into: land acquisition; pylon construction; foundations; steel tube; vacuum pumps; stations; linear accelerators; tunnelling; design and surveying; capsules; and other additional construction costs. Reasonable estimates for each component were made with consideration for existing research on the cost and functionality of a Hyperloop system. Many cost estimates used draw upon the extensive construction capital costs database found in the annually published Spon’s Civil Engineering and Highway Works Price Book. To facilitate improvement and refinement of the accuracy of the cost framework, the limitations of the framework, and of the estimates used, have been stated explicitly in Section 6.
Combination of the cost estimates for each component fulfils the final objective of the research, by giving a preliminary cost estimate for a Hyperloop system analogous, in terms of capacity and primary connectivity, to HS2 Phase 1.
The terms ‘capsule’ and ‘pod’ will be used interchangeably in this report.
2. Literature Review
2.1. Initial Hyperloop Concept
The initial concept for the Hyperloop, laid out in an Alpha paper by Elon Musk (2013), proposed using a continuous steel tube with an internal diameter of 2.23 metres running between two locations. The internal pressure within the tube would be lowered to around 100 Pa–approximately equivalent to an atmospheric altitude of 150,000 feet–through use of numerous commercial-grade vacuum pumps positioned along the route of the tube. Human carrying capsules, similar to that shown in Figure 1, would then be propelled through this low drag environment by periodic use of electronic linear induction motors fixed to the tube guideway, reaching a maximum speed of 1,220 km/h.
To overcome the Kantrowitz Limit–the choking of compressed air flow around the capsule at near supersonic velocities–and to provide a means of capsule levitation, the Alpha paper proposed use of a compressor-air bearing system. This involves use of a capsule-based compressor to actively redistribute pressure concentrations in-front of the capsule to behind it. By channelling this compressed air through ‘air bearing skis’ beneath the capsule, a robust levitation system is created without requiring expensive magnetic levitation infrastructure. On board batteries would store the energy needed to power this capsule compressor and levitation system for the short journey times.
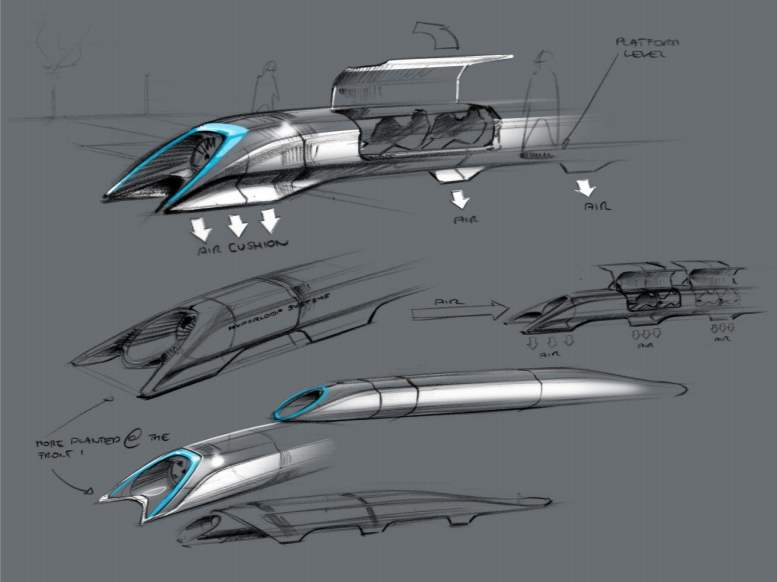
Figure 1 – Conceptual Design Sketch of Hyperloop Capsule (Musk, 2013)
Construction cost estimates in this paper put Hyperloop at around 10% of the cost of CHSR, which is largely a consequence of Hyperloop’s superfast speeds offering high throughput with light-weight infrastructure (Taylor, et al., 2016).
2.2. Development of the Concept
Despite its status as an unproven technology, significant research and development has been undertaken since the Alpha proposal’s release by academia and the commercial sector.
A SpaceX-funded Hyperloop Pod competition encourages student teams around the world to design and create a pod which can operate within a 1.25 km test-track at an internal pressure as low as 860 Pascals (SpaceX, 2016b). A great deal of academic research has spawned from this, which has challenged some of the initial assertions of the scheme.
Further to this, a NASA-backed open source model of the system by Gray, et al. (2013) has sought to understand the relationships between the various pod components, such as how the tube and pod diameters affect the maximum speed of the system.
In additional, commercial development of the concept has been progressed by American based start-ups Hyperloop One and Hyperloop Transportation Technologies, which have raised over
$190 millionin venture capital investment (Guerrini, 2016). These ventures are taking a practical approach to concept development, with Hyperloop One’s recently completed test-track giving the start-up the opportunity to develop and text levitation, propulsion, vacuum and control technologies on real world hardware (Upbin, 2017).
2.3. Design Elements
8.3.1. Tube Diameter-Pod Velocity Relationship
The initial Alpha paper proposed the use of an inner tube diameter of 2.23 m, with a pod measuring 1.1 m tall by 1.35 m wide having a maximum velocity of 1,220 km/h. Further analysis challenges the assertion that this velocity can be accomplished for the given pod to tube area ratio due to an underestimation of the Kantrowitz Limit by Musk (2013).
The challenge with this geometry is that the maximum inlet velocity of airflow into the pod compressor is limited to Mach 0.65 (Chin, et al., 2015), thereby requiring an air diffuser to be affixed to the capsule nose to reduce the inlet velocity. The effect of having this diffuser is to reduce the cross-sectional area ratio between the tube, A tube, and the air bypass zone, which constitutes the area around the capsule, A bypass, and the area of the pod compressor, A tube,C.
This difference is highlighted in Figure 2 and Figure 3, which illustrate a pod with and without a diffuser. Consequently, the higher the pod velocity is, the larger the affixed diffuser must be, and therefore the lower the tube area to bypass area ratio is.
As it is essential that this area ratio is sufficiently large to allow static air in the tube to flow around the capsule at high speed, increases in the velocity of the capsule result in significant increases in the required tube diameter.
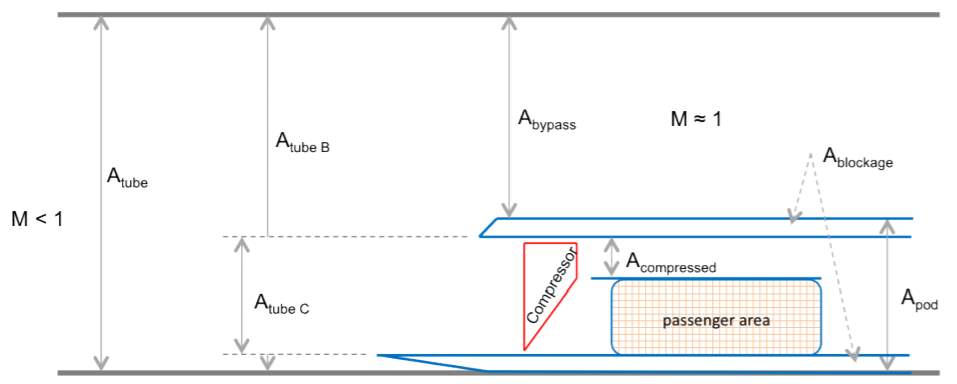
Figure 2 – Longitudinal cross-section of a hollow passenger pod that lets mass flow pass through it (Chin, et al., 2015)
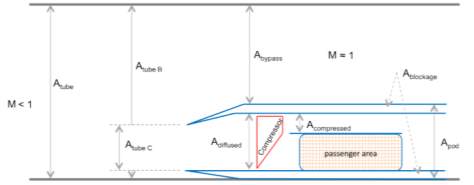
Figure 3 – Longitudinal cross-section of a hollow passenger pod with a diffuser to reduce the Mach number of flow into the compressor (Chin, et al., 2015)
Figure 4 shows the relationship between tube diameter and pod maximum velocity for a capsule measuring 1.1 m tall by 1.35 m wide. It can be seen that greater pod velocities result in exponentially larger required tube diameters, with velocities above Mach 0.8(614 mph, 988 km/h) being unlikely to be practical (Chin, et al., 2015). For a tube diameter of 2 m and pod dimensions of 1.1 m tall by 1.35 m wide–approximately that used in the Alpha paper Mach 0.6 (460 mph, 735 km/h) is the practical speed limit.
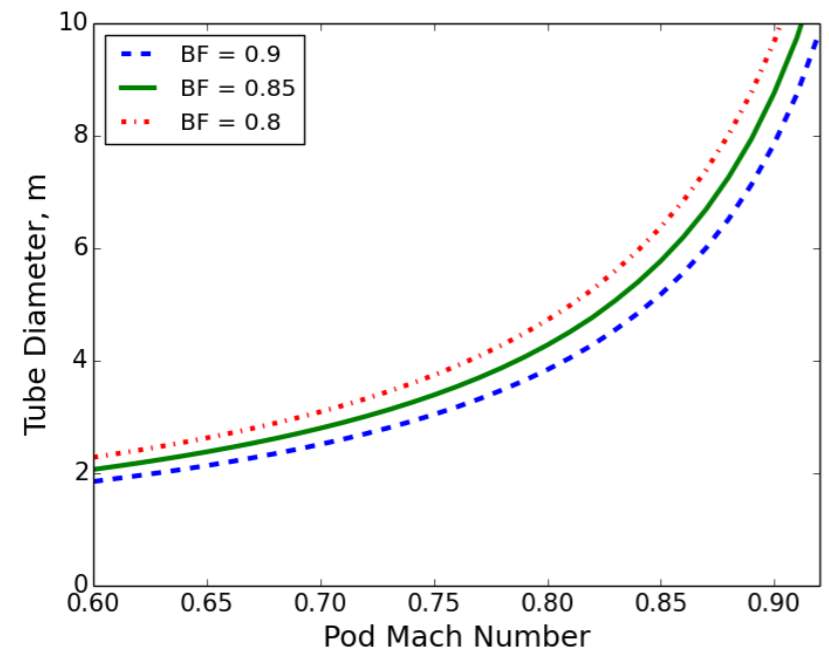
Figure 4 – Exponential relationship between pod speed and tube diameter (Chin, et al., 2015)
Limiting the pod velocity to Mach 0.6 also reduces the drag coefficient on the capsule to a near optimum value for a given size, as illustrated in Figure 5. This reduces the overall energy consumption of the system.
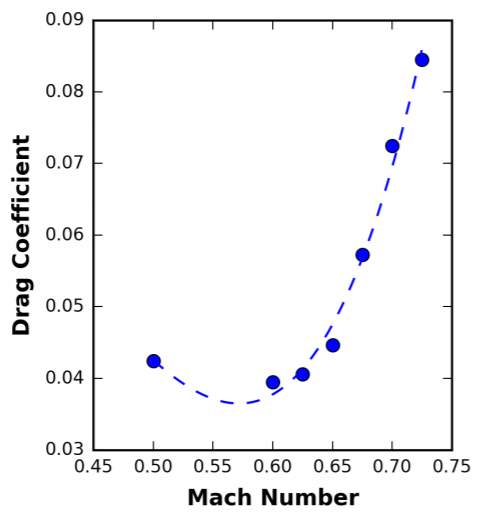
Figure 5 – Drag Coefficient vs Mach number (Decker, et al., 2017)
The implication of these findings is that for relatively short journeys, such as the ~178 km distance between London and Birmingham, a maximum speed of 735 km/his desirable. Increasing the speed beyond this requires a larger diameter tube for a given pod size, which has associated cost implications, as discussed in Section 9.1.1.
2.3.2. Tube Span-Pylon Strength Relationship
One of the key benefits of the Hyperloop system is the ability to install factory constructed tube sections on elevated pylons, thereby dramatically reducing the land acquisition cost and the need for tunnelling (Musk, 2013).
An optimised span distance for tube sections must therefore exist, balancing the cost of the increased tube strength needed to span a greater distance with the cost reduction of installing less pylons.
Research by Decker, et al. (2017) sought to find this optimised pylon spacing through basic structural modelling of the system.
In their analysis, the tube was modelled as a thin walled pressure vessel ‘beam’ spanning between pylons of equal height with simple supports at each end. A pod mass was applied at the mid-span of the beam, thereby inducing the greatest moment stress in the tube walls. Minimum tube thickness was constrained by the buckling condition for vacuum cylinders given by JP Peterson (1968).
Pylon supports were then modelled as vertical columns with a fixed base condition and were analysed with respect to the column buckling condition. Axial and transverse loads applied to the top of these columns modelled tube weight and pod deceleration forces respectively.
An optimised pylon spacing for a given tube area was then determined through application of cost functions to the total pylon length and tube thickness. This was produced for three separate pod masses, as shown in Figure 6. It is evident that the optimum pylon spacing decreases with an increase in tube area, which is reflective the higher load from the increased tube mass and the thicker tube wall needed to withstand the increased bending stress.
A finding of this research was that the structural requirement of the system is largely governed by the loading from the tube self-weight, rather than from the pod mass. Accordingly, an increase in pod mass from 10,000 kg to 20,000 kg resulted in a change in pylon spacing of less than 2%, with the sensitivity of this decreasing with an increase in tube area (Decker, et al., 2017). The implication of this is that the capacity, and therefore mass, of pods in the system can be adjusted without significant repercussions for the structural requirement of the system.
Whilst this cost optimisation shows a distinct relationship between tube size and optimum pylon spacing, it neglects the potential for variations in pylon height. All pylons were considered to be of equal height, without application of a cost function to reflect the disproportionate increase in cost of constructing taller pylons; it is therefore the case that this relationship may not hold for all scenarios. Ideally, pylon height would be modelled as an additional variable that could be adjusted in response to the topography of a particular route.
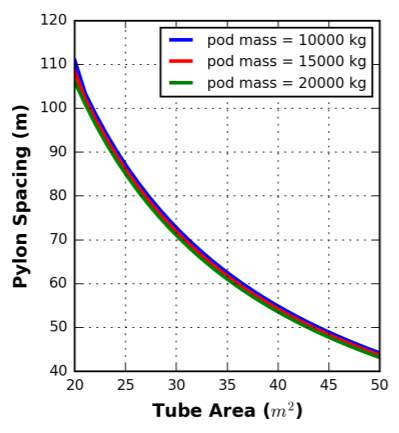
Figure 6 – Optimum pylon spacing for a given tube area (Decker, et al., 2017)
2.3.3. Internal Air Pressure
Air pressure within the tube has also been found to be a design component that can be optimised in the Hyperloop, due to the inverse relationship between vacuum pump requirements and pod propulsion and levitation requirements.
Maintaining a higher tube pressure means the pod propulsion systems must overcome greater drag resistance from the denser air, whilst the battery-compressor system onboard must exert more power and energy to redistribute pressure from in-front of the capsule to behind it. The benefit of making this increase, however, is that the requirement for the vacuum pumps along the length of the tube is reduced, meaning less expensive pumps can be used with a lower energy cost.
Decker et al. (2017) found the minimum energy consumption to be when the internal tube pressure is approximately 200 Pafor a leakage rate of 1.2 kg s-1 m-3, with the pressure-cost relationship illustrated in Figure 7. Minor deviations from this optimum were found to have drastic implications for the energy cost of the system as a whole.
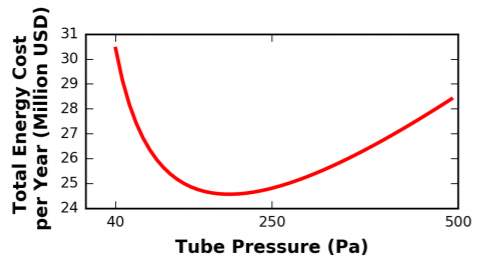
Figure 7 – Energy cost vs tube pressure for leakage rate of 1.2 kg s-1 m-3 (Decker, et al., 2017)
The optimum pressure was also found to be linearly related to the leakage rate of the system. High leakage rates result in greater strain on the vacuum pumps to maintain a given internal tube pressure, meaning the optimum tube pressure is higher for increased leakage rates. Optimum tube pressures and corresponding energy costs for given leakage rates in a system with a fixed volume of 25,000 m3are shown in Figure 8, which illustrates this linear relationship.
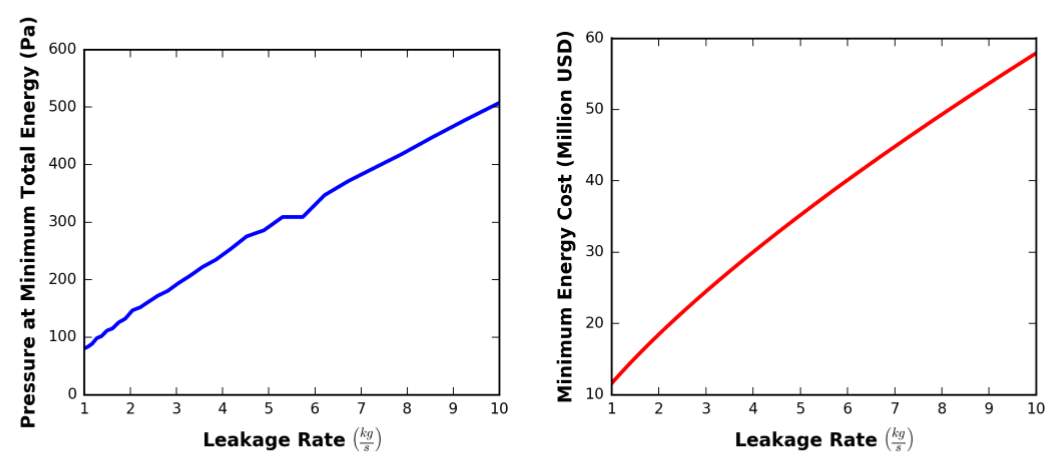
Figure 8 – Optimal Pressures and Resulting Energy Cost for a Range of Leakage Rates (Decker, et al., 2017)
2.3.4. Capacity
Decker et al. (2017) found that an increase in pod passenger capacity resulted in a reduction in energy usage per passenger. An order of magnitude increase in pod capacity, from 10 passengers to 100, produced a total energy consumption rise of just 15%.
As discussed in Section 2.3.2, increases in capsule weight do not have significant ramifications for the structural requirement of the infrastructure, with the tube self-weight representing the main driver for structural requirement. Greater capacity passenger pods are therefore favourable, due to the reduced energy consumption and logistical complexity of operating and maintaining fewer, but larger, pods.
2.3.5. Levitation
The Alpha proposal by Musk (2013) outlined the use of air bearing ‘skis’ to levitate the capsule, thereby reducing the frictional resistance acting between the capsule and tube without incurring the significant expense of an active magnetic levitation system.
Air bearings make use of a thin film of air between two moving components to provide a load bearing boundary which effectively eliminates friction. Wide utilisation in precision manufacturing machines has developed the reliability and the control precision achievable with such systems (New Way Air Bearings, 2006).
Speeds of up to Mach 6 have been demonstrated with air bearings on rocket sleds. Use of both externally supplied air pressure and that produced by the aerodynamic properties of the sled at high velocities has been demonstrated in this manner (Meier & Smith, 1966), confirming the outline of this principle made in the Alpha proposal by Musk (2013)
Air bearings have also been demonstrated to support heavy loads, with a NASA precision guidance training facility for astronauts utilising an air bearing system capable of supporting 2 ton loads (NASA, n.d.).
Alternative approaches to capsule support have also been proposed and are being pursued with equal vigour by student pod teams (Baldwin, 2016).
Passive magnetic levitation, as pioneered by Richard Post (2000), is the primary contender under development (Bennett, 2016). The main benefit of this system over a traditional, active, magnetic levitation system is a reduction in infrastructure cost. Levitation is achieved with magnets arranged in a Halbach array on the base of the capsule interacting with an aluminium rail affixed to the tube as the capsules travels at speed. It efficiently utilises the forward motion of the capsule to generate lift, independent of the air pressure in the tube (Post & Ryutov, 2000).
A further alternative is the use of wheels, which have been shown to be preliminarily feasible in a Hyperloop application (Zimmermann & Macfarlane, 2014) and are considered to be a simpler approach which limits ‘the number of miracles in series’ (Koebler, 2016). Aerospace grade aluminium wheels have been shown to function nominally at speeds of 1,770 km/h(Cisco Bloodhound TV, 2014): well in excess of the 1,220 km/hspeed proposed by Musk for Hyperloop (2013).
Wheels and air bearings require no specific infrastructure installation in the tube, other than a high quality internal surface finish. A passive magnetic levitation approach to levitation would require an aluminium rail to be affixed to the base of the tube, which is not considered a dramatic cost penalty to the viability of the system.
2.3.6. Propulsion
Capsule propulsion was outlined by Musk (2013) as being provided by periodic use of tube mounted electromagnetic linear accelerator stators which interact with rotors affixed to the capsules.
This architecture is similar to that used in military rail guns, which are being developed to launch lightweight projectiles to ultra-high velocities. In this manner, projectiles weighing approximately 0.64 kgare routinely launched to speeds of 9,000 km/h, with a muzzle energy of 2.5 MJ(McNab & Beach, 2007). As of 2016 (Kramer, 2016), the most powerful rail gun developed by the US military has a muzzle energy of 33 MJ (Petersen, et al., 2011), with the ultimate development target being a 64 MJ railgun which could launch a 20.5 kg projectile to 9,000 km/h. Whilst these developments are promising, the energy required from a Hyperloop electromagnetic linear accelerator would likely be significantly higher. A 40,000 kg Hyperloop capsule propelled to 735 km/h would require 833.7 MJ from its propulsion system, which is well beyond the scope of commercially available linear accelerators (Vlahos, 2015). As such, estimating the cost of this technology in this specific application is challenging and requires deeper analysis than the scope of this research; reliance is therefore made on Musk’s initial cost estimates (2013) in this assessment.
3. System Arrangement
3.1. Velocity
3.1.1. Speed-Cost Relationship
As graphically illustrated by Figure 4, increases in capsule velocity result in exponential increases in required tube diameter, which has a dramatic implication for the cost of the system.
A greater tube diameter requires an increased tube wall thickness, as additional strength is required to support the larger self-weight of the tube. This increased steel use has an inherent cost implication, as well as increasing the size and strength of the pylons required to support the additional steel weight. Tunnelling costs, as discussed in Section 4.8, are also increased with a greater tube diameter.
3.1.2. Maximum Speed
For these reasons, the maximum speed of the system was chosen to be 735 km/h, enabling use of an internal tube diameter of 2 m.
Reducing the maximum speed from 1,220 km/h to 735 km/hwas found to increase journey times by less than 5 minutes, from 10 minutes, 58 seconds to 15 minutes, 53 seconds, whilst saving over £5.5 billion in steel tube supply and installation alone.
3.2. Route
3.2.1. Desired Characteristics
As far as possible it is desirable for the Hyperloop route to follow existing transportation corridors. This approach mitigates the environment impact of the route and reduces land acquisition costs and complexities.
3.2.2. Lateral Acceleration
A constraint to route selection is ensuring rider comfort throughout the journey.
Ensuring rider comfort requires maintaining sufficiently high radii of curvature in the vertical and horizontal directions, such that inertial accelerations in both axes are kept below a level deemed tolerable for extended periods. These accelerations result in passengers experiencing forces perpendicular to the direction of travel known as G-forces; the larger the acceleration, the larger the G-force felt. Excessively high G-forces impair the body’s ability to circulate blood, resulting in reduced vision and ultimately loss of consciousness (Wyrick & Brown, 2009).
The comfortable rate of lateral acceleration in the horizontal axis that can be experienced by passengers for long periods of time is cited in the Hyperloop Alpha paper as being widely accepted to be 0.5 g (Musk, 2013). The acceleration due to Earth’s gravity, at 9.81 m/s2, is represented by g.
This is approximately equivalent to driving around a typical roundabout of 4 metre diameter (TD 16/07, 2007) at 11 km/h: well within the bracket of forces experienced during a regular commute.
3.2.3. Vertical Acceleration
In designing changes in tube elevation, the same curvature radius limitation practises must be adhered to in the vertical direction.
A 1994 study by the U.S. Department of Transportation into ride comfort in MAGLEV systems identified comfortable vertical acceleration thresholds of 0.3 gin the positive direction (into the seat) and 0.2 gin the negative direction (out of the seat) (Sussman, et al., 1994). The comfort criterion was defined as 95% of test subjects being willing to repeat the loading procedure without hesitation.
9.2.4. Radii of Curvature
The lateral acceleration, a, on a particle moving with velocity, v, around a curve of radius, R, is given in Equation (1) (Patera, 1975).
| a=v2R | [1] |
An exponential relationship therefore exists between the pod velocity and tube radii of curvature in the horizontal and vertical axes, which is graphically represented in Figure 9. It can be seen from this that radius of curvature constraints become progressively more onerous at higher velocities, making a lower speed system less challenging from a land acquisition perspective. The curvature radii for the velocities utilised in the route are shown in Table 1.
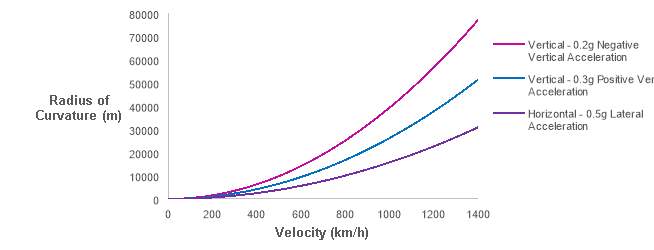
Figure 9 – Tube radii of curvature with pod velocity
3.2.5. Route Summary
Adhering to these horizontal radius of curvature constraints, a route which utilises existing infrastructure as far as possible was created. The route is denoted in purple in Figure 10, with radii of curvature shown as per the key. The total length of the route, L, is 178,328 m.
3.2.6. Velocity Profile
For velocities below 735 km/h, the route selection was dictated by existing urban environment constraints. The placement of the main section of the route was based on the tube curvature requirements for a pod velocity of 735 km/h. A breakdown of the lengths, velocities, cumulative journey time and radii of curvature for the main segments of the proposed route is given in Table 1.
Table 1 – Route segments with length, pod velocity, cumulative journey time and tube radii of curvature
| Route Segment | Velocity (km/h) | Segment Length (m) | Cumulative time (s) | Min. Horizontal Radius (km) | Min. Vertical Positive Radius (km) | Min. Vertical Negative Radius (km) |
| Birmingham Centre | 206.4 | 2,318 | 43.1 | 0.67 | 1.12 | 1.68 |
| Saltley | 292.9 | 2,044 | 68.5 | 1.35 | 2.25 | 3.37 |
| Water Orton Corridor | 617.6 | 9,658 | 127.2 | 6 | 10.00 | 15.00 |
| Main Section | 735 | 156,039 | 892.3 | 8.5 | 14.17 | 21.25 |
| London Tunnel | 563.8 | 8,269 | 953.1 | 5 | 8.34 | 12.50 |
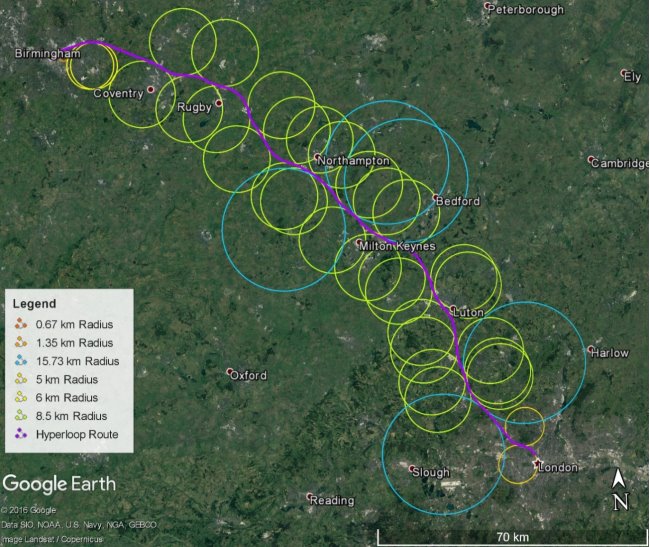
Figure 10 – London-Birmingham Hyperloop route, showing curvature radii
3.2.7. Tube Elevation
The route elevation was then calculated in order to minimise the average pylon height, whilst ensuring vertical radii of curvature are greater than then minimum values shown in Table 1.
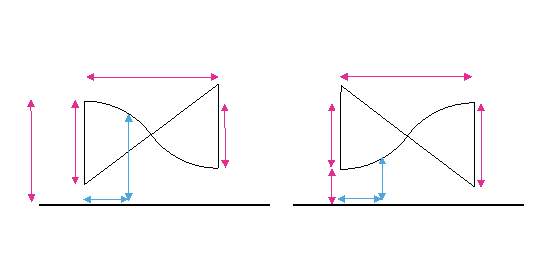
To do this, pylon heights were iteratively fixed in certain locations along the route. An S-shape tube profile, as shown in Figure 11, was then applied to fit between these two fixed locations.
The height difference, Y, and the horizontal distance, X, between these locations, along with the height of the initial fixed location, H, were used to determine the vertical radius of curvature, Rvert, for the segment. Tube height, h, at a given distance from the segment start, x, was then calculated with Equations (2) through to (5).
During phases of positive gradient, as shown in Figure 11 B, values of h were determined with Equation (2) where x
| h=H+Rvert-Rvert2-x2 | [2] | |
| h=H+Y-Rvert-Rvert2-X2+Xx-x2 | [3] |
During phases of negative gradient, as shown in Figure 11 A, values of h were determined with Equation (4) where x
| h=H-Rvert-Rvert2-x2 | [4] | |
| h=H-Y+Rvert-Rvert2-X2+2Xx-x2 | [5] |
The tube elevation, shown in Figure 12, was then calculated. From this, the distribution of required pylon heights, shown in Figure 13, was determined. Most pylons are of low height, with the average height determined to be 9.3 m.
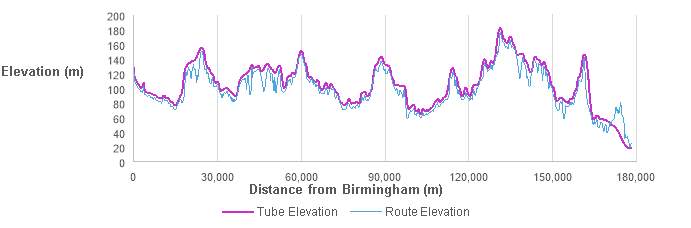
Figure 12 – Tube and route elevation profile
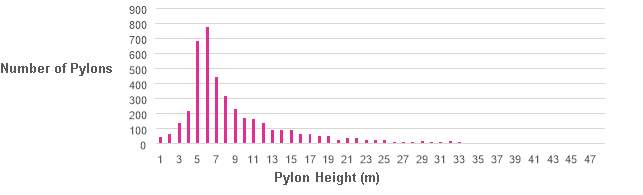
Figure 13 – Pylon height distribution
3.3. System Capacity
3.3.1. Required Capacity
To determine the cost of constructing the Hyperloop infrastructure, the requirements of the system from a capacity perspective had to be determined. Capacity is the key driver which dictates the size of Hyperloop capsules used, the departure frequency that they must have and the number of tubes required to accommodate them. This system has been specified to match the capacity of HS2, which will provide a peak departure capacity of 15,400 seats per hourfrom London Euston to Birmingham (HS2 Ltd, 2017a).
3.3.2. Departure Frequency
The number of passengers that the Hyperloop system can accommodate is equal to the capsule departure frequency per tube multiplied by the number of passengers carried in each capsule multiplied by the number of tubes used.
Fixing the maximum number of passengers carried per capsule simplifies the system, enabling easier capsule production and logistics. The number of tubes required and the appropriate capsule size for this layout must therefore be determined, with departure frequency being a variable that can be adjusted during service to accommodate varying passenger demand.
Considering the peak usage of the system, where all capsules are filled to capacity, the maximum departure frequency is constrained by safety requirements. A sufficient distance between each capsule must be maintained at all times to allow the capsule to come to a complete stop before colliding with the capsule in front, with a deceleration rate of no more than 1 g. To accommodate this, the initial report proposed a departure frequency of every 30 seconds (Musk, 2013), which has since been confirmed to be adequate by further research (Decker, et al., 2017). It was assumed in this research that innovative loading procedures will be developed, such that capsule unloading and loading will not be a constriction on this departure frequency.
3.3.3. Capacity of Capsule
The ideal size of each capsule feeds off of several variables. A smaller capsule size results in a larger number of capsules required, leading to greater servicing complexities and costs, whilst larger capsules offer less flexibility in response to demand.
It has been shown that an order of magnitude increase in capsule capacity, from 10 passengers to 100, results in only a 15% increase in yearly energy consumption per capsule (Decker, et al., 2017), which is a cost that is then spread out amongst the larger ridership.
As shown in Figure 6, increases in capsule weight do not have significant implications for the structural requirement of the infrastructure, with the tube self-weight and auxiliary load from propulsion equipment representing the main drivers for structural requirement. Considering the high capacity required of a Hyperloop line between London and Birmingham, larger capsule sizes are therefore desirable and have few negative ramifications.
The peak usage period was considered to be one hour. This represents the morning rush hour that central London experiences, as shown between 08:00 and 08:59 in Figure 14.
A HS2 peak capacity of 15,400 passengers per hour is equivalent to 128 passengers departing every 30 seconds. Split between two tubes, this would require pods capable of carrying 64 passengers departing every 30 seconds in both tubes in the same direction simultaneously.
Capsules were assumed to measure 1.1 m tall by 1.35 m wide in this research.
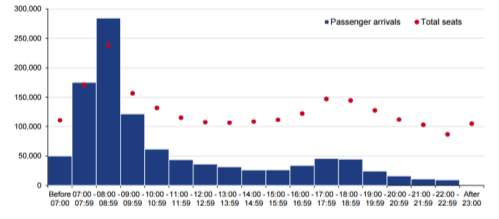
Figure 14 – Arrivals by time band for central London, 2015 (Department for Transport, 2016)
3.3.4. Number of Tubes
Four tubes are therefore proposed to accommodate this peak demand in both directions.
As demand will have a dominant direction according to the time of day – journeys into and out of London in the mornings and evenings respectively (Department for Transport, 2016) – all four tubes will likely not be operated simultaneously, with the fourth functioning as a back up to enable rotational servicing of the tubes.
3.3.5. Number of Capsules
The total journey time in each direction was calculated to be 953 seconds, as outlined in Section 3.2.6, with an optimized turnaround time assumed to be 300 seconds. Consequently, each capsule can complete 2.8 journeys in one hour, carrying a total of 64 passengers per journey. This gives an hourly capacity per capsule of 179.2 passengers per hour.
Based on the worst-case scenario, where 15,400 passengers per hour need to be transported in both directions simultaneously, a total system capacity of 30,800 passengers per hour is required from Hyperloop. Based on these premises, a total of 172 capsules are required in the system as a whole.
During off peak periods the departure frequency will be scaled back, with surplus capsules stored and serviced during this time.
3.4. Tube Span
To establish the total land footprint used by the system, the optimum span between pylons must be found. As discussed in Section 2.3.2, increases in the wall thickness of the tube raise the total steel cost but allow for a longer span, thereby reducing the number and cost of pylons required.
However, this research has found that the appropriate span is not governed by the in-service simply supported condition of the tube for which this relationship applies, but is instead guided by the construction phase.
3.4.1. Incremental Launching
An incremental launching construction technique is proposed as the most suitable for this application. The benefits of this technique include minimal disruption, increased worker safety, faster construction, and potentially reduced construction costs (LaViolette, 2007).
The technique involves projecting tube elements out from a pylon until the next support is reached. This therefore relies on the strength and stiffness of the tube in the cantilever condition during the construction phase, which puts far higher bending stress into the tube than would occur in a simply supported, in-service, condition.
3.4.2. Tube Strength
It has been demonstrated that the large external pressure acting on the tube, as a consequence of the low internal air pressure, is not the governing structural constraint on tube design. Instead, simple beam bending behaviour dominates (Decker, et al., 2017). Consequently, in this research an initial ultimate limit state was conducted by treating the tube as a beam in the cantilever and simply supported conditions.
As the loading on the tube during the construction phase is purely self-weight, the maximum cantilever span possible does not increase substantially with increases in wall thickness. This is a consequence of the relationship between design moment applied and moment resistance in the tube, shown in Equation (6), being directly related to the tube wall thickness.
| MEd,cantMRd,cant=Asteel,crossρsteelgLcant22dout3-din3fy6 | [6] |
The consequence of this direct relationship is that there is a maximum span achievable during the construction phase, regardless of wall thickness, that limits the maximum span achievable in-service. This span must not be exceeded unless temporary supports are used during construction, which would incur additional project cost and complexity.
The simply supported condition was calculated assuming a pod mass of 40,000 kg at mid-span, with a linear load from auxiliary equipment of 20 kN/m. An axial load from a pod decelerating at 9.81 ms-2 was also applied, with the tube checked for combined bending and axial compression utilising Equation (6.2) from BS EN 1993-1-1:2005, which is denoted here with an 80% utilisation rate as Equation (7).
| NEdNRd+My,EdMy,Rd+Mz,EdMz,Rd=0.8 | [7] |
Figure 15 illustrates the maximum spans achievable in the cantilever and simply supported conditions for given tube wall thicknesses. Increases in wall thickness result in increases in steel material costs, meaning it is desirable to use the minimum possible wall thickness to achieve the maximum simply supported and cantilever spans.
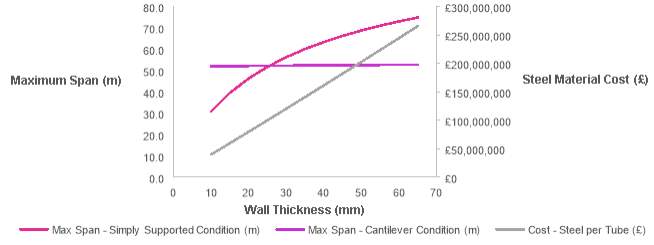
Figure 15 – Wall thickness vs Steel material cost and Maximum span for cantilever and simply supported ultimate limit state conditions
The maximum spans for the cantilever and simply supported ultimate limit state conditions have been calculated to converge at 52.2 m, with a wall thickness of 25.5 mm. The tube wall thickness taken forward for deflection analysis was therefore 25.5 mm.
3.4.3. Tube Deflection
To ensure the system operates with minimal deflection, the simply supported and cantilever conditions were then analysed to find the maximum tolerable span.
Using a deflection tolerance of span/360, Equations (8) and (9) were derived, with maximum spans for the cantilever and simply supported conditions calculated to be
Lcant=39.6 m and
Lsimple=41 m respectively. A Young’s modulus, E, of 210,000 N/mm2 was used.
| Lcant180=wLcant48EI | [8] | |
| Lsimple360=5wLsimple4384EI+PLsimple348EI | [9] |
3.4.4. Tube Span Summary
Given that the pylon diameter is in excess of 0.4 m, as shown in Section 3.5, the pylons are to be spaced 40 m apart centre to centre. This span ensures tolerable stress and deflection in the tube during the construction phase and in service.
3.5. Pylon Dimensions
3.5.1. Height-Footprint Relationship
To approximately calculate the footprint of the pylons, a simple calculation was undertaken to determine the minimum pylon diameter required for an unrestrained circular pylon to have a slenderness value that is less than the slenderness limit for a given height, h. This simplification negates the need to calculate second order effects and produces a conservative answer, with pylon diameter, d pylon, given by Equation (10).
The total axial load on the column, NE, is the load from 4 tubes and pods with properties as described in Section 3.4.2, which has a factored value of 9,373 kN.
Grade C40/50 concrete has been assumed, with a design strength, fcd, of 40 N/mm2. Due to the unrestrained nature of the pylons, the effective height, l0, has been taken to be twice the actual column height, h. Factors A, B and C were taken to be 0.7, 1.1 and 0.7 respectively.
| dpylon=4l04NEπfcd20ABC | [10] |
From this diameter, the minimum pylon cross-sectional areas were calculated for a series of pylon heights. It was found that the cross-sectional area required for a pylon is linearly related to its height, which enables a mean pylon height to be used in determining the average pylon cross-sectional area.
3.5.2. Average Pylon Dimensions
Assuming an average pylon height of 9.3 m, as calculated in Section 3.2.6, the average pylon cross sectional area was calculated to be 3.2 m2.
3.6. Levitation
An air bearing levitation approach, as proposed by Musk (2013), was assumed in this research. This requires no specific infrastructure within the tube.
4. Cost Analysis
4.1. Land
4.1.1. Land Type
Figure 16 denotes the breakdown of land use by the proposed route. The lightweight nature of the Hyperloop enables the use of pylons that can straddle existing infrastructure, resulting in system that is within 100 metres of, or above, existing infrastructure for 69%of the route. This compares favourably to approximately 1.7%of existing infrastructure utilisation made by HS2 Phase 1 (HS2 Ltd, 2017e).
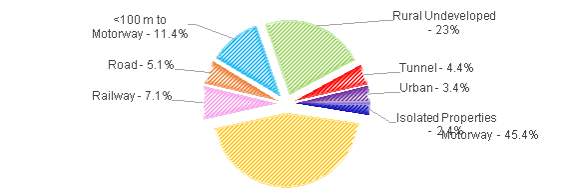
Figure 16 – Route breakdown by land type
4.1.2. Land Cost
Minor use of cuttings and a stretch of tunnel under London means a total of 4224 pylonsare required, with an average spacing of 40 m. The total land use for pylon footprint is therefore 13,517 m2, which is spread across four main land types.
34.4% of the Hyperloop route is on undeveloped farmland or farmland within 100 mof the Motorway. This land was assumed to be the most valuable type of farmland: prime arable, which has a market value of £2.47 per m2(Savills, 2016).
In rural areas, it was assumed that land purchase is limited to the pylon footprint, giving a total area required of 4,650 m2. For simplicity, no accommodation for way leave was made in these calculations.
5.8% of the route is on urban developed land or infringes on isolated rural properties. To calculate the cost of this, it was assumed that purchase of the pylon footprint alone would not be adequate to compensate landowners. Land use here was therefore taken to be a 10 m wide strip along the route, giving a total area of 103,430 m2.
The average land area of a property in England was estimated to be 46.2 m2. This is half of the total usable floor area of the average English property–which was taken to be 92.3 m2 (Department for Communities and Local Government, 2014)–to conservatively account for a two-storey layout.
The Hyperloop route is split approximately equally between the East of England and the East Midlands, which had average house prices for February 2017 of £281,665 and £176,784 respectively (HM Land Registry , 2017). From this, an average house price for the route was interpolated to be £229,225, spread over a land area of 46.2 m2. Land value for urban areas and isolated rural properties was therefore approximated to be £4962 per m2.
50.5% of the Hyperloop route straddles existing road infrastructure. Whilst the true ownership of land under roads is complicated and often dates back many centuries, roads are generally de facto considered to be owned by the local government authority (Marshall, 2016). Furthermore, trunk roads, such as Motorways, are de jure government owned, as they were built utilising central government ordained compulsory purchase orders (Marshall, 2016). This research considered Hyperloop construction to be a central government backed project, meaning there is no land acquisition cost for sections of the route on road infrastructure.
7.1% of the route is on rail infrastructure which is owned and operated by Network Rail Infrastructure Ltd (Network Rail, 2017b). Network Rail is a public-sector body that is ultimately responsible to the Secretary of State for Transport (Network Rail, 2017a), meaning railway land used for Hyperloop in this research was considered to have no acquisition cost.
4.4% of the route is through tunnels under central London. In English property law, ground to an unlimited depth below the property is owned by the freehold owner of the land.
Consequently, property owners directly above the route of Crossrail were compensated with £300 to purchase the ‘subsoil rights’ and contribute towards any legal advice the claimant may wish to seek (HS2 Ltd, 2012). An identical compensation package was used in this research.
The total length of tunnelling used in the route is 7,846 m. Affected properties were assumed to run along this length for a 10 mwide strip, with an average property size of 46.2 m2. The total number of properties affected is therefore approximately 1698.
4.1.3. Land Cost Summary
A summary of land acquisition costs is given in Table 2, with a total land acquisition cost of the project approximated to be £513,740,546.
Table 2 – Cost breakdown of land acquisition
| Item | Quantity | Unit | Rate | Total Cost |
| Prime Arable Farmland | 4,650 | m2 | £2.47 | £11,486 |
| Urban & Rural Properties | 103,430 | m2 | £4962 | £513,219,660 |
| Roads & Motorways | 6,826 | m2 | £0 | £0 |
| Railway | 960 | m2 | £0 | £0 |
| Tunnel | 1698 | properties | £300 | £509,400 |
| Total cost for Hyperloop | £513,740,546 | |||
4.2. Pylons
4.2.1. Pylon Construction
A total of 4224 pylonsare needed along the Hyperloop route. With an average height of 9.3 mand cross sectional area of 3.2 m2, the average pylon volume is 29.8 m3.
The pylons were assumed to be of a reinforced in-situ concrete construction. A conservative steel reinforcement rate of 4% and a steel density of 7850 kg/m3 were used, giving a total requirement of 28.6 m3 of concrete and 9.4 tonnes of reinforcement steel per pylon.
4.2.2. Reinforcement Steel
Grade 500C steel reinforcement bar has an upper envelope market value of £550 per tonne (Davis Langdon, 2009), giving a per pylon rebar cost of £5,170.
4.2.3. Concrete
Grade C40 concrete with 20 mm aggregate size has a unit cost of £80.06 per m3(Davis Langdon, 2009), giving a per pylon concrete cost of £2,290.
4.2.4. Labour
A single labour gang can construct approximately 3.5 m3/hr of reinforced concrete pier, assuming the sectional area exceeds 1.0 m2 (Davis Langdon, 2009). Pylon construction therefore requires approximately 8.52 labour gang hours. Labour rate estimates were taken from AECOM (2014) and are detailed in Table 3.
4.2.5. Movement Joints
Two guided sliding pot bearings per pylon, each measuring 545 ×435, were assumed. The unit cost for supply and install of each bearing is £912 (Davis Langdon, 2009).
4.2.6. Pylon Cost Summary
The total cost of superstructure construction for 4224 pylons was calculated to be £51,283,584, with a cost breakdown given in Table 3.
Table 3 – Cost breakdown for pylon construction
| Item | Quantity | Unit | Rate | Total Cost |
| Formwork gang | 8.52 | hour | £83.98 | £716 |
| Reinforcement gang | 8.52 | hour | £125.08 | £1,066 |
| Reinforcement onsite bending/baling gang | 8.52 | hour | £40.26 | £343 |
| Joints gang | 8.52 | hour | £42.96 | £366 |
| Concrete accessories gang | 8.52 | hour | £42.96 | £366 |
| Grade 500C steel reinforcement bar | 9.4 | tonnes | £550.00 | £5,170 |
| Grade C40 concrete,
20 mmaggregate |
28.6 | m3 | £80.06 | £2,290 |
| Guided sliding pot bearing | 2 | Nr | £912 | £1,824 |
| Total cost per pylon | £12,141 | |||
| Total cost for Hyperloop | £51,283,584 | |||
4.3. Foundations
4.3.1. Foundation Construction
An average foundation arrangement per pylon was assumed to consist of six piles installed by a lorry or crawler-mounted rotary rig, which is faster and more mobile than static alternatives such as tripod mountain percussion rigs. Flexibility in pile depth to suit pylon specification is also achieved with this rig, which can construct piles to a depth of 30 m without additional cost per metre of depth (Davis Langdon, 2009).
Concrete of 35 N/mm2 strength with an aggregate size of 20 mm was assumed, for an average pile diameter of 600 mmand depth of 10 m.
Piles of this kind have an approximate fixed cost of £266.24 per pile, to cover provision of plant, labour and equipment for construction, as well as transportation and site setup. A further cost of £191.37 per metreof depth per pile approximates for the material cost of concrete and the cost of excavation (Davis Langdon, 2009).
Pile foundations are then topped with a pile cap, which is a thick concrete slab that serves to spread the load from the pylon above across the six piles beneath.
A reinforced concrete pile cap suitable for six piles has an approximate unit cost of £4,440, including the cost of excavation, formwork, reinforcement and disposal (Davis Langdon, 2009).
4.3.2. Foundation Cost Summary
A summary of these costs is shown in Table 4, giving a total foundation cost for 4224 pylons of £74,002,959.
Table 4 – Cost breakdown for pylon foundations
| Item | Quantity | Unit | Rate | Total Cost |
| Fixed cost per pile | 6 | Nr | £266.24 | £1,598 |
| Cost with depth for six piles | 10 | m | £1,148.22 | £11,482 |
| Pile cap | 1 | Nr | £4,440.00 | £4,440 |
| Total cost per foundation | £17,520 | |||
| Total cost for Hyperloop | £74,002,960 | |||
4.4. Steel Tube
4.4.1. Tube Manufacture and Erection
With each tube having a wall thickness, t, of 25.5 mm and an inner diameter, dint, of 2000 mm, the total steel volume for each tubes along the route was calculated to be 28,936 m3. Assuming a steel density of 7,850 kg/m3, the total weight of steel required per tube is 227,120.3 tonnes.
Chinese based manufacturing costs for piping of the required specification are approximately £450 per tonne (Alibaba, 2017), with an erection cost of £250 per tonne (Davis Langdon, 2009).
Steel tubes are assumed to be welded together, eliminating the needed for separate sealant works at tube joints.
4.4.2. Corrosion Protection
Steelwork is vulnerable to corrosion unless protected (BS EN ISO 12944-3, 1998). For this analysis, a protective coating was assumed to be applied to entire exterior of the four pipes. The process entails blast cleaning of the steel, followed by aluminium spray, zinc chromate, zinc phosphate and micaceous iron oxide coatings. It has an approximate cost of £29.77 per m2(Davis Langdon, 2009).
The total exterior surface area, Asteel, ext, of a steel tube was calculated to be 1,149,040 m2, with use of Equation (11).
| Asteel,ext=π(dint+2t)×Lroute | [11] |
4.4.3. Steel Tube Cost Summary
Total tube construction cost for four tubes was calculated to be approximately £772,764,411, with a cost breakdown given in Table 5.
Table 5 – Cost breakdown for steel tube
| Item | Quantity | Unit | Rate | Total Cost |
| Steel tube material | 227,120.3 | tonnes | £450 | £102,204,113 |
| Erection | 227,120.3 | tonnes | £250 | £56,780,075 |
| Protective coating | 1,149,040 | m2 | £29.77 | £34,206,915 |
| Total cost per tube | £193,191,103 | |||
| Total cost for Hyperloop | £772,764,411 | |||
4.5. Vacuum Pumps
4.5.1. Vacuum Pump Requirement
Whilst in operation, the vacuum pumps must maintain an optimum pressure in the tube to minimize energy losses, as discussed in Section 2.3.3. The ideal pump rate for this scenario is therefore aligned to the leakage rate of the tube, which is challenging to estimate at this early stage.
Mechanical components are a major source of air leakage, which is effect that can be mitigated through building quality control and careful sealant design. Further sources of air leakage include diffusion, desorption, permeation and leaks through micro cracks (Decker, et al., 2017), which are proportional to the surface area of the tube. The leakage rate therefore requires significant analysis before a full-scale system can be constructed, as minor deviations in it will have ramifications for the optimal internal tube pressure and a corresponding capsule design.
For the purpose of specifying the maximum pump rate of the system, however, designers must ensure flexibility in the system exists to account for variations in leakage rate at different locations in the tube.
For this reason, this cost analysis will consider a worst-case leakage rate of 10 kg/s in a tube of volume, v = 25,000 m3at an optimum internal pressure of 500 Pa, taken from Figure 8 (Decker, et al., 2017). This will result in an over specified system which can easily handle lower leakage rates and internal pressures. The air leakage rate per unit volume is therefore given as
4×10⁻⁴ kg s-1m-3.
The volume of the proposed Hyperloop route between London and Birmingham is 560,234 m3and the desired pump down time is 1800 seconds. With the aforementioned leak rate, over the course of the pump-down time no more than 403,368 kgof air will leak into the system.
This is conservative because it assumes an air leakage rate that exists only when the internal pressure is 500 Pa. During the pump-down phase, the pressure difference will be less, meaning a less severe leakage rate would be expected.
Assuming an average air pressure during the pump down phase of 50,000 Pa, the air density at 15℃ would be approximately 0.605 kg/m3. The total volume of air to be displaced during the 1800 second pump down time is therefore approximately 1,226,959 m3, at a rate of 682 m3/s.
This would require approximately 4,910 pumpswith a suction rate of 500 m3/hourper tube. Market costs for a liquid ring vacuum pump of this specification are no more than £8,000 per pump, with a considerable reduction on price possible through bulk order.
4.5.2. Vacuum Pump Cost Summary
Table 6 details the cost breakdown for vacuum pumps. The total cost per tube of £39,280,000 is significantly higher than the £4,000,000 estimated by Musk (2013). This is likely a consequence of a difference in the price per pump used and of overly conservative pump requirement values used in this analysis. The answer given here should therefore be considered as conservative and will likely be subject to downward revisions in future research.
Table 6 – Cost breakdown of vacuum pumps
| Item | Quantity | Unit | Rate | Total Cost |
| Vacuum pump | 4910 | Nr | £8,000 | £39,280,000 |
| Total cost per tube | £39,280,000 | |||
| Total cost for Hyperloop | £157,120,000 | |||
4.6. Stations
4.6.1. Station Cost
For this assessment, the station cost estimates for HS2 were used as station costs for the Hyperloop system. This was deemed a reasonable assumption due to the identical capacity, connectivity and location requirements of the two systems.
Based on an average inflation rate of 3.0% a year, the early cost estimates for HS2 stations of £1.630 billion in 2009 prices (HS2 Ltd, 2009) scale to £2.01 billion in 2016 prices. This includes construction of Euston, Birmingham Curzon Street, Birmingham Interchange and Old Oak Common stations.
Whilst the Hyperloop stations could be significantly smaller than their corresponding HS2 counterparts, this is still an unknown design element. Furthermore, Hyperloop stations are proposed only for London Euston and Birmingham Curzon Street, unlike HS2 which will also make stops at Birmingham Interchange and Old Oak Common. It is therefore conservative to use a station cost estimate of £1.05 billion per Hyperloop terminus.
4.6.2. Station Cost Summary
Total station cost is approximately £2,010,000,000, with a cost breakdown given in Table 7.
Table 7 – Cost breakdown for stations
| Item | Quantity | Unit | Rate | Total Cost |
| Station | 2 | Nr | £1,005,000,000 | £2,010,000,000 |
| Total cost for Hyperloop | £2,010,000,000 | |||
4.7. Linear Accelerators
4.7.1. Linear Accelerator Cost
Tube based linear accelerator elements were estimated to cost £56 million per tube in the initial Hyperloop proposal (Musk, 2013). This is a conservative estimate to use for the London to Birmingham route, as the original route proposal is 216% longer and 66% faster.
4.7.2. Linear Accelerator Cost Summary
The total linear accelerator cost is approximately £224,000,000, as detailed in Table 8.
Table 8 – Cost breakdown of linear accelerators
| Item | Quantity | Unit | Rate | Total Cost |
| Linear accelerator | 4 | Nr | £56,000,000 | £224,000,000 |
| Total cost for Hyperloop | £224,000,000 | |||
4.8. Tunnelling
4.8.1. Length Related Costs
Tunnelling costs are directly correlated with the diameter of the tunnel (Infrastructure UK, 2010). The smaller diameter of a Hyperloop tube, compared to that required for a high-speed train, is therefore a cost advantage where tunnelling is required.
Due to its high cost, tunnelling has been minimised as far as possible in the proposed route. A small stretch of tunnel, measuring 7,846 mlong, under central London was deemed unavoidable due to the high urban density and route geometry constraints.
With four tubes in a rectangular arrangement, the outer diameter of the Hyperloop tunnel required is 4.95 m. Based on empirical UK tunnelling data, this has an approximate upper-boundary construction cost of £20,000 per metre (Infrastructure UK, 2010).
Disposal of excavated material and installation of mechanical and electric equipment costs are also related to tunnel length and were taken to be £4,500 per metre and £4,000 per metre respectively (HS2 Ltd, 2015).
4.8.2. Time Related Costs
Time related costs also exist, and include provision for labour, equipment hire and security. Assuming a typical tunnelling rate of 80 m per week, tunnelling will take 98 weeks, with an approximate cost of £1,100,000 per week (HS2 Ltd, 2015).
4.8.3. Fixed Costs
Additional to this, fixed costs for tunnel construction exist which are independent of tunnel length or construction time. These include purchase of a tunnel boring machine (TBM), which has been taken to be an Earth Pressure Balance Machine, as this is suited to London’s subsoil, with a fixed cost of approximately £18,000,000 (HS2 Ltd, 2015). Tunnel portals and shafts for access and ventilation have been assumed to have costs of £20,000,000 and £12,000,000 respectively (HS2 Ltd, 2015).
4.8.4. Tunnelling Cost Summary
The total cost of tunnelling is therefore £448,611,000, with a cost breakdown given in Table 9.
Table 9 – Cost breakdown of tunnelling
| Item | Quantity | Unit | Rate | Total Cost |
| Construction | 7,846 | m | £20,000 | £156,920,000 |
| Purchase of TBM | 1 | Nr | £18,000,000 | £18,000,000 |
| Tunnelling support costs | 1 | Nr | £35,000,000 | £35,000,000 |
| Time related costs | 98 | weeks | £1,100,000 | £107,800,000 |
| Disposal of excavated material | 7,846 | m | £4,500 | £35,507,000 |
| Tunnel portals | 2 | Nr | £20,000,000 | £40,000,000 |
| Tunnel shafts | 2 | Nr | £12,000,000 | £24,000,000 |
| Mechanical and electrical systems | 7,846 | m | £4,000 | £31,384,000 |
| Total cost for Hyperloop | £448,611,000 | |||
4.9. Other Construction Costs
4.9.1. Site Clearance and Temporary Accommodation
This research has assumed that all buildings along a 10 m wide strip of the route will be demolished. The total area of affected buildings measures 103,430 m2, as discussed in Section 10.1.1. With an average building height in the UK of 7.5 m (Ordnance Survey, 2014), the total volume of affected building is approximately 775,725 m3.
The typical building affected is assumed to be of masonry construction with timber floor and roof, which has a demolition cost of approximately £8.56 per m3(Davis Langdon, 2009).
Site clearance on live dual carriageway is required for approximately 90,055 m of the route.
Assuming the cleared area to be approximately 10 mwide, the required clearance area is 900,550 m2 which has an approximate clearance cost of £0.342 per m2 CITATION Lan10 l 2057 (Davis Langdon, 2009).
Open field site clearance is required for approximately 613,448 m2 at a clearance cost of £0.111 per m2(Davis Langdon, 2009).
Temporary accommodation costs for workers, including portable offices, toilets and canteens, were considered negligible for the scope of this assessment.
4.9.2. Other Construction Costs Summary
The total cost of other construction elements was calculated to be £7,016,287, with a cost breakdown given in Table 10.
Table 10 – Cost breakdown of other construction costs
| Item | Quantity | Unit | Rate | Total Cost |
| Demolition | 775,725 | m3 | £8.56 | £6,640,206 |
| Live carriageway clearance | 900,550 | m2 | £0.342 | £307,988 |
| Open field clearance | 613,448 | m2 | £0.111 | £68,093 |
| Total cost for Hyperloop | £7,016,287 | |||
4.10. Design
Cost similarity between HS2 and Hyperloop also likely extends to design costs and topographical investigation surveys. Significant work will be needed to determine the suitability of pylon and foundation designs according to ground conditions and neighbouring obstacles along the route.
Assuming a design and surveying cost of £758 million, as per the HS2 specification (HS2 Ltd, 2009), is therefore reasonable.
4.11. Capsules
4.11.1. Cost per capsule
In this research, the cost and weight breakdown of a 28 passenger capacity capsule from the original Hyperloop proposal by Musk (2013) has been crudely scaled to represent a capsule with a 64 passenger capacity. A currency exchange rate of 1 USD=0.80 GBP has been used.
4.11.2. Cost Summary
Table 11 details the cost breakdown for a 64 passenger capsule, with a total cost for Hyperloop calculated to be £424,594,212 based on a system requirement of 172 capsules.
Table 11 – Capsule cost breakdown for 64 passenger capacity
| Item | Quantity | Unit | Cost Rate | Weight Rate | Total Cost | Total Weight | |
| Capsule Structure & Doors | 64 | passenger | £7,000 | 111 kg | £448,000 | 7,086 kg | |
| Interior & Seats | 64 | passenger | £7,286 | 89 kg | £466,286 | 5,714 kg | |
| Propulsion System | 64 | passenger | £2,143 | 25 kg | £137,143 | 1,600 kg | |
| Suspension & Air Bearings | 64 | passenger | £5,714 | 36 kg | £365,714 | 2,286 kg | |
| Batteries, Motor & Coolant | 64 | passenger | £4,286 | 89 kg | £274,286 | 5,714 kg | |
| Air Compressor | 64 | passenger | £7,857 | 64 kg | £502,857 | 4,114 kg | |
| Emergency Braking | 64 | passenger | £1,429 | 21 kg | £91,429 | 1,371 kg | |
| General Assembly | 64 | passenger | £2,857 | N/A | £182,857 | N/A | |
| Passengers & Luggage | 64 | passenger | N/A | 100 kg | N/A | 6,400 kg | |
| Total per capsule | £2,468,571 | 34,286 kg | |||||
| Total cost for Hyperloop | £424,594,212 | ||||||
4.12. Optimism Bias Provision
Optimism bias is the systematic tendency for overly optimistic estimates to be produced by project appraisers (HM Treasury, 2013a). UK Government guidance exists to establish contingency in project budgets to account for this. Empirical data from previous construction projects is used, with the degree of contingency applied dependant on the degree of uncertainty of the project.
The construction of the proposed Hyperloop line would be considered a ‘non-standard civil engineering project’ by this guidance. This is due to its status as being innovative, having mostly unique characteristics and a construction process involving a high degree of complexity and difficulty (HM Treasury, 2013a).
Due to the hypothetical nature of this project, clear and tangible evidence of mitigation against factors that contribute towards cost and time overruns cannot be shown, meaning application of the upper bound optimism bias adjustment factor of 66% to the final capital cost is recommended (HM Treasury, 2013a).
This level of optimism bias would be reduced as the project proceeds through later stages of development and costings are refined.
5. Results
5.1. Total Cost
An approximate total capital cost estimate breakdown for the Hyperloop system, after application of a 66% optimism bias provision, is given in Table 12, with a total construction cost found to be £9,032,280,780.
It should be noted that this makes no provision for the ongoing operating costs of the system.
Table 12 – Total capital cost summary for Hyperloop
| Item | Initial Cost | Optimism Bias Factor | Final Cost |
| Land Acquisition | £513,740,546 | 66% | £852,809,306 |
| Pylons | £51,283,584 | 66% | £85,130,749 |
| Foundations | £74,002,960 | 66% | £122,844,914 |
| Steel Tube | £772,764,411 | 66% | £1,282,788,922 |
| Vacuum Pumps | £157,120,000 | 66% | £260,819,200 |
| Stations | £2,010,000,000 | 66% | £3,336,600,000 |
| Linear Accelerators | £224,000,000 | 66% | £371,840,000 |
| Tunnel | £448,611,000 | 66% | £744,694,260 |
| Other Construction Costs | £7,016,287 | 66% | £11,647,036 |
| Design/Surveying | £758,000,000 | 66% | £1,258,280,000 |
| Capsules | £424,594,212 | 66% | £704,826,392 |
| Total cost of Hyperloop | £9,032,280,780 | ||
5.2. Journey Times
The journey time was calculated to be 15 minutes, 53 seconds in either direction between London and Birmingham. A velocity-time profile comparison between HS2 and Hyperloop is given in Figure 17, with HS2 velocity data taken from an Arup journey time analysis for HS2 (2012).
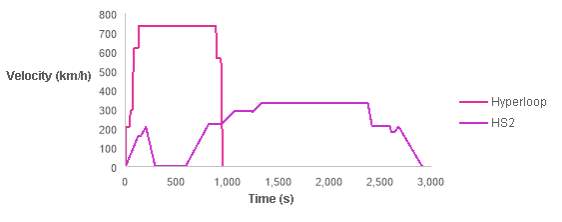
Figure 17 – Hyperloop and HS2 velocity-time profile comparison
6. Discussions, Limitations and Recommendations
6.1. Fundamental Technology
Whilst the overall Hyperloop concept is simple, it remains an unproven technology. Individual elements of the design have been shown to function in isolated applications, as discussed in Section 8.3, but no real-world examples of a complete Hyperloop system exist in the world.
Until the technology is proven and deemed safe through numerous robustly reliable prototypes, convincing regulators and governments to invest significant public money into building a Hyperloop system will remain an unrealistic dream.
That said, many experts believe Hyperloop is well within the realm of possibility, with US based start-ups – Hyperloop One and Hyperloop Transport Technologies – racing to realise a functioning prototype (Upbin, 2015).
The currently unproven nature of the technology undermines the validity of the cost estimate produced in this research. Significant changes in the Hyperloop design may need to be implemented to create a safe and reliable system, which could add significant extra costs which have not been forecast in this research. A key example of this is the undecided approach towards capsule levitation, with student pod teams split (Baldwin, 2016) between using air bearing levitation – as outlined in Musk’s Alpha proposal (2013) – or a Halbach passive magnetic levitation array (Post & Ryutov, 2000).
6.2. System Requirements
The system requirements assumed in this research may require adjustment through further analysis, which could have significant cost implications.
An overarching concern is the viability of persuading passengers to climb inside a capsule measuring 1.1 m tall by 1.35 m wide. If this is found to be too confined – possibly through simulations of various capsule sizes with focus group feedback – then the tube diameter will require scaling to suit the comfortable capsule size. As discussed in Section 9.1.1, even marginal increases in the tube diameter can have significant cost implications due to the increased material use required.
Passenger comfort in this study has been ensured with a simple curvature criteria in both axes, without consideration given for spiral easement of curves, as found in railway and road infrastructure. This involves a gradual transition into a curve to prevent abrupt changes in lateral acceleration (Levien, 2008), and as such should be incorporated into future route refinement. Inclusion of such transition curves may increase the cost of the route infrastructure, due to the reduced flexibility of the route’s location.
The installation of solar panels and battery arrays, as proposed in Musk’s initial Alpha proposal (2013), has not been considered or costed in this research. This would create additional capital cost during construction, whilst reducing the ongoing operations cost of the system.
Exploration of the potential to use the installed Hyperloop infrastructure as a highway for services, such as electricity and data, through further research could be beneficial. This may serve to subsidise the cost of constructing and operating the system.
6.3. Land
The cost of land purchase could be significantly underestimated in this research due to two key assumptions: that rural land purchases can be limited to the pylon footprint, and that road and railway land is without acquisition cost to the government.
It seems unlikely that Network Rail would be willing to share land with a transportation system that would directly compete with it, despite its status as a public institution (Network Rail, 2017a). Furthermore, building on road infrastructure restricts the potential for further expansion of the road network through widening. A degree of compensation for road and rail land would likely be needed, further increasing the land cost of the system. This is a subject for future research.
Rural land owners would likely require compensation for hindrance to farming operations or because of a reduction in property value, as demonstrated by the generous HS2 compensation package (NFU, 2015).
Wayleave is commonly used to compensate farmers for the obstruction caused by pylons for electricity and telecommunications infrastructure, without full purchase of the land used made (UtilityServe, n.d.). This is a land acquisition approach that could be explored for Hyperloop through further research, with the potential for a significant upfront land cost reduction.
Land cost estimates used in this research for urban and rural areas are vague and do not account for the actual costs of the properties involved. Significant refinement of this through future research could be made.
The route selected and analysed in this research is just one option for a Hyperloop path. Deeper analysis, considering all possible routes and associated costs, could be made through further research. This has the potential to reduce the land acquisition cost of the system whilst maximising rider comfort.
6.4. Pylons
Whilst the average pylon height is 9.3 m, no provision has been made in this research for the additional costs of working at height. A non-trivial number of very high pylons have been calculated to be required, with the tallest reaching up to 47 m. The incremental construction cost increase for higher pylons should be accounted for in future research.
Material transport costs have not been considered in this research, which could significantly increase the cost of constructing in remote locations. Furthermore, material wastage has not been included in the material use calculations made here, which would increase the amount of material used and the associated cost.
Construction on existing road and rail infrastructure may be significantly more challenging than the scenario costed here. Great care must be taken in the design and location of pylons to ensure that vehicle collision, which could structurally impair the Hyperloop system, is not possible. This careful design process is likely to increase the cost of pylon construction used in this research.
This research has assumed an in-situ concrete construction, which may not necessarily be the most economic approach. Future research giving a route-specific, in-depth comparison of the various construction approaches available, including in-situ and pre-cast concrete construction, would produce a more reliable cost estimate.
There is potential to optimise, and likely reduce, the pylon heights and associated costs further through deeper analysis, such as with genetic algorithms.
The dimensions for the pylons calculated in this research are likely to be overly conservative, due to the roughness of the pylon strength calculation used. Further analysis to minimize the degree of redundancy in the pylons would likely reduce the dimensions and associated cost of the average pylon.
In summary, whilst there are elements of the pylon costs which are overly conservative, such as the required dimensions, there are significant pylon-related costs that have not been accounted for in this research. There is therefore potential for an increase in the cost of pylon construction.
6.5. Foundations
The foundations assumed in this research have not been designed to fit the specific conditions that they are in. Instead, a reasonable estimation of a typical foundation has been used. Clearly this imbues a degree of inaccuracy in the result, due to the variety of influencing factors that are present in foundation design, such as pylon height and the underlying ground conditions. The cost of foundations must be refined through further research of specific foundation requirements for locations and heights along the route.
6.6. Steel Tube
In this research, steel tube accounts for the second largest cost component of the system. Minor alterations in this can therefore have significant implications for the cost of the overall system.
In addition to the potential for changes in tube size required, as discussed in Section 6.1, the cost estimate of steel tube could be improved by refining the assumptions made in this research.
Key to this is the estimate for steel tube erection cost, which is based on empirical data of typical steel frame assembly and therefore is not strictly representative of Hyperloop’s construction scenario. Furthermore, this research has used published steel pricing from medium sized steel tube manufacturers to ascertain a steel material cost estimate. Through direct discussion with manufacturers, with consideration for the large volume of steel required, this estimate could be refined and possibly reduced.
Internal fit out of the tube, to ensure a smooth surface for proper vehicle transit, has not been costed in this research, which could add further cost.
The deflection tolerances used in this research are those deemed generally suitable for buildings with brittle finishes. Further research around the deflection tolerances for the Hyperloop system may find this to be an inadequate level of smoothness for comfortable and safe vehicle transit. As such, the amount of steel needed to restrict deflection would need to be increased or the spacing between pylons would have to be reduced. Both options would incur significantly more construction cost, due to the increased amount of steel or number of pylons used.
This research has also not considered the installation of armour plating to protect the tube from deliberate or incidental breaches. It is plausible the Hyperloop would be a high-profile terrorism target, with 25.5 mm of steel tube being relatively easily penetrated with firearms (Tank Archives, 2015). Additional steel or concrete plating, to protect the tube, would add further material costs and would likely reduce the maximum span, increasing pylon construction costs.
Vibration resistance has not been considered in this research, which would likely add complexity and cost to the interaction components between the tube and the pylons.
Thermal expansion joints have not been costed in this research. With a typical steel expansion coefficient of 12×10-6/℃(Dolling, 2006), a tube length of 178,328 m and an extreme mean temperature range in the UK of 49.5℃(Perry & Golding, 2011), total steel elongation over the route length could be as high as 106 m. This is evidently a challenging design aspect to overcome, which could add significant cost and complexity to the design and installation of the system.
Whilst there are potentially reductions possible in the estimates used for the steel material and erection costs, it is likely that the forecast cost of the tube will increase significantly through further research and design appraisal for other elements not considered in this report.
6.7. Vacuum Pumps
The cost estimate for a single vacuum pump used in this report is vague and likely overly conservative. Through negotiations with manufacturers and deeper analysis of the appropriate pump requirement, a more accurate value can be reached, with reductions in this cost estimate likely.
6.8. Stations
Whilst the capacity, connectivity and location of HS2 and Hyperloop stations are the same, the internal requirements are potentially entirely different. Hyperloop loading and unloading procedures are not finalised, but a recent proposal by BIG for an Abu Dhabi ‘portal’ proposed an intermodal hub for driverless cars to seamlessly embark into Hyperloop capsules (Mairs, 2016). This is diametrically opposed to HS2’s conventional platform design for Euston Station.
Furthermore, Hyperloop requires bespoke airlock entry and exit systems for capsules to transition from the pressurised station environment into the reduced pressure tubes. This will add cost to the project which has not been accounted in this research.
Security is an additional difference between Hyperloop and HS2 stations, with Hyperloop likely requiring an airport style security procedure due to its vulnerability to terrorism.
Consequently, anticipating the cost of Hyperloop stations is challenging, with the estimation used in this report requiring significant refinement through future research.
6.9. Linear Accelerators
The linear accelerator cost estimate used in this report is overly reliant on Musk’s original Alpha proposal (2013) and is likely to be conservative.
With a capsule acceleration and deceleration rate of 9.81 m/s2, the total length of linear accelerator required was calculated to be 4,284 m per tube. Future detailed research is needed to assess the cost of installing a system suitable for this route, optimised for the velocities entailed. It is expected that the linear accelerator cost will be refined downwards through this research due to conservative estimate used in this research.
6.10. Tunnels
Numerous factors can affect the cost of tunnel construction through delays and unforeseen equipment requirements. Accurate forecasting of the tunnelling cost for Hyperloop therefore requires a full ground survey.
6.11. Other Construction Costs
Site security during project construction as well as accommodation and welfare facilities for workers could add significant cost.
The environmental costs associated with constructing the route also need calculating, with this research having not made an allowance for it.
6.12. Design
The engineering design costs for Hyperloop have in this research been assumed to be the same as HS2, due to the routes being of comparable length. The design challenges associated with Hyperloop are likely to be very different to HS2 however, due to the alternative approach to construction taken. It is likely that a higher degree of design modularisation is possible with Hyperloop than would be so with HS2, with variations in foundation design being the main Hyperloop design component that would change over the course of the route. It is therefore conceivable that design costs are lower for Hyperloop than HS2, however this is challenging to forecast due to the high degree of uncertainty still present in the Hyperloop design concept.
6.13. Capsules
The capsule cost estimate used in this research is overly reliant on the original Alpha document by Musk (2013), with deeper analysis into the cost of producing the capsules required from future research.
One of the Hyperloop design elements still unconfirmed is the use of passive magnetic levitation (Post & Ryutov, 2000) rather than air bearings, as assumed in this study. This would likely add significant cost, both in the onboard capsule levitation system and in the tube infrastructure required. The currently experimental nature of passive magnetic levitation makes accurate forecasting of its associated cost challenging, with industry consensus ultimately needed to determine the appropriate levitation approach required and the consequent cost.
The size and number of capsules specified in this research may require alteration if it is found that a 30 second departure frequency and a 300 second turnaround time are impractical. Computerised modelling of people flow behaviour, with capsule loading and unloading, in future research would shed light on this.
6.14. Journey Times
A key assumption used in this research that an acceleration and deceleration rate of 9.81 m/s2 is comfortable for passengers. This requires careful seating arrangement in the capsules to minimise loading on passengers, with proposals for gimballed passenger compartments having been made to overcome this challenge on a similar transport solution by the Rand corporation (Salter, 1978 ). Reductions in this acceleration rate do not dramatically affect the journey time, however. Halving the acceleration and deceleration rate to 4.91 m/s2 increases the total journey time by less than 15 seconds. The journey time estimate ascertained by this research is therefore attainable and comfortable.
7. Conclusions
The potential advantages of a Hyperloop system over a conventional high-speed rail line in the UK have been demonstrated by this research’s fulfilment of it three key objectives.
Journey times between London Euston and Birmingham Curzon Street have been calculated to be demonstrably shorter for a Hyperloop system than for HS2 Phase 1. With a maximum speed of 735 km/h, Hyperloop could complete the journey in 15 minutes, 53 seconds, with passenger comfort ensured by limitation of lateral, vertical positive and vertical negative accelerations to 0.5 g, 0.3 g and 0.2 g respectively. This compares to a predicted journey time of 49 minutes for HS2 (HS2 Ltd, n.d.). Adjustments to the route or the acceleration rate of the system are unlikely to dramatically affect this journey time, with a halving of the acceleration and deceleration rate used to 4.91 m/s2 only increasing journey times by 15 seconds.
A cost framework for a UK Hyperloop system has been created based on the key components required for operation. It is clear that a huge number of additional costs and variables need to be added to this framework to create a robust overall cost estimate for a UK Hyperloop system. By making clear the limitations of this framework and the estimates used in Section 6, future research can expand upon and improve the overall cost estimate.
The preliminary cost estimate calculated in this research for the proposed route demonstrates that Hyperloop has the potential to be constructed for a fraction of the anticipated cost of HS2 Phase 1. After application of an optimism bias provision factor of 66%, the total cost for a Hyperloop connecting London Euston to Birmingham Curzon Street was calculated to be £9.03 billion: a mere 33% of HS2 Phase 1’s cost of £27.4 billion (Butcher, 2017). This is largely a result of the lightweight and simple nature of Hyperloop infrastructure eliminating the need for costly earthworks, with the modular design facilitating mass production of pre-constructed elements.
Significant over simplifications have been made in this research, however. Further research is needed to refine the estimates used, as outlined in Section 6, before a realistic cost estimate can be produced with confidence. The scale and scope of infrastructure project planning necessitates a detailed cost analysis process which incorporates a greatly increased number of variables and influencing factors than in this research. In addition, the unproven nature of the Hyperloop technology undermines the validity of any cost analysis performed, due to the complete system requirements remaining unknown.
8. References
AECOM, 2014. Spon’s Civil Engineering and Highway Works Price Book 2015. Abingdon: CRC Press.
Albalate, D. & Bel, G., 2012. The Economics and Politics of High-Speed Rail: Lessons from Experiences Abroad. Plymouth: Lexington Books.
Alibaba, 2017. 12 meter large diameter Q235B water pipe spiral welded steel pipe helical welded pipe. [Online]
Available at: https://www.alibaba.com/product-detail/12-meter-large-diameter-Q235B-water_60402930259.html?s=p
Arup North America Ltd, 2008. Large Diameter Soft Ground Bored Tunnel Review, Seattle: s.n.
Arup, 2012. HS2 London to West Midlands Route Corridor Reviews: Journey Time Analysis, London: Arup.
Atkins, 2003. High Speed Line Study: Summary Report, London: Atkins.
Baldwin, R., 2016. A closer look at the vehicles designed for the Hyperloop Pod competition. [Online] Available at: https://www.engadget.com/2016/01/31/hyperloop-pod-competition-in-photos/ [Accessed 4 April 2017].
Bowsher, G., n.d. Wheels For A Jet Car. [Online]
Available at: http://www.thrustssc.com/thrustssc/Club/Secure/mn7_Wheels.html
BS EN 1993-1-1, 2005. Eurocode 3. Design of steel structures. General rules and rules for buildings, s.l.: BSI.
Butcher, L., 2017. High Speed 2 (HS2) Phase 1 – Briefing Paper, London: House of Commons Library.
California High-Speed Rail Authority, 2016. Connecting and Transforming California. Draft 2016 Business Plan, Sacramento: California High-Speed Rail Authority.
Chen, S., 2016. Beyond Hyperloop: Chinese scientists board ‘vacuum train’ for possible military projects. [Online] Available at: http://www.scmp.com/news/china/policies-politics/article/1946676/beyond-hyperloop-chinese-scientists-board-vacuum-train
Chin, J. C., Gray, J. S., Jones, S. M. & Berton, J. J., 2015. Open-Source Conceptual Sizing Models for the Hyperloop Passenger Pod, Cleveland: NASA.
Cisco Bloodhound TV, 2014. 1,100 mph wheel spin test. [Online]
Available at: http://www.bloodhoundssc.com/news/1100mph-wheel-spin-test
Davis Langdon, 2009. Spon’s Civil Engineering and Highway Works Price Book 2010. Abingdon: Taylor & Francis.
de Rus, G. & Nash, C., 2007. In what circumstances is investment in HSR worthwhile?, Leeds: Institute of Transport Studies.
Decker, K. et al., 2017. Conceptual Feasibility Study of the Hyperloop Vehicle for Next-Generation Transport, Cleveland: NASA Glenn Research Center.
Department for Communities and Local Government, 2014. English Housing Survey: Households 2012-13, London: Department for Communities and Local Government.
Department for Transport, 2016. Rail passenger numbers and crowding on weekdays in major cities in England and Wales: 2015, London: Department for Transport.
Design Manual For Roads and Bridges, 2007. Geometric Design of Roundabouts. TD 16/07, Guildford: Highways England.
Dolling, C., 2006. Material Selection, London: Corus.
Drury, J. C. & Marino, A., 2000. A Comparison of the Magnetic Flux Leakage and Ultrasonic Methods in the detection and measurement of corrosion pitting in ferrous plate and pipe. Rome, NDT.
Eddington, S. R., 2006. The Eddington Transport Study, London: Department for Transport.
Gray, J. et al., 2013. Hyperloop 0.5 Documentation. [Online]
Available at: http://openmdao-plugins.github.io/Hyperloop/index.html#introduction
Guerrini, F., 2016. Hyperloop Startup HTT Claims Surpassing $100M In ‘Investments’. [Online] Available at: https://www.forbes.com/sites/federicoguerrini/2016/12/01/hyperloops-startup-snags-30-million-in-funding-from-edgewater-investments/#542df6c31211
Hensher, D. A. & Truong, T. P., 1985. Valuation of Travel Time Savings, s.l.: Journal of Transport Economics and Policy.
HM Land Registry , 2017. House Price Index for: England. [Online] Available at: http://landregistry.data.gov.uk/app/ukhpi/explore
HM Treasury, 2013a. Supplementary Green Book Guidance – Optimism Bias, London: HM Treasury.
HM Treasury, 2013b. The Green Book – Appraisal and Evaluation in Central Government, London: HM Treasury.
HM Treasury, 2015. Spending Review and Autumn Statement 2015, London: HM Treasury.
HM Treasury, 2016. Public Expenditure – Statistical Analyses 2016, London: HM Treasury.
Hodaib, A., 2016. Conceptional Design of a Hyperloop Capsule with Linear Induction Propulsion System. International Journal of Mechanical, Aerospace, Industrial, Mechatronic and Manufacturing Engineering, pp. 922-929.
HS2 Action Alliance, n.d. Noise. [Online] Available at: http://www.hs2actionalliance.org/communities/noise/ [Accessed 27 March 2017].
HS2 Ltd, 2009. High Speed Rail: London to the West Midlands and Beyond, PART 9 of 11, London: HS2 Ltd.
HS2 Ltd, 2012. Properties Above Tunnels Factsheet, London: Department for Transport.
HS2 Ltd, 2015. High Speed Two – A Guide to Tunnelling Costs, London: HS2 Limited.
HS2 Ltd, 2017a. Changing Britain: HS2 taking root, Birmingham: HS2 Ltd.
HS2 Ltd, 2017b. D7: Tunnel Construction and Methodology, London: HS2 Limited.
HS2 Ltd, 2017c. HS2 Rolling Stock Industry Event. London, HS2 Ltd, pp. 1-29.
HS2 Ltd, 2017d. HS2: In Your Area, London: HS2 Ltd.
HS2 Ltd, 2017e. Interactive Map | HS2. [Online] Available at: http://interactive-map.hs2.org.uk/
HS2 Ltd, n.d. High Speed Rail: Investing in Britain’s Future. Consultation on the route from the West Midlands to Manchester, Leeds and beyond. [Online] Available at: http://assets.hs2.org.uk/sites/default/files/consulation_library/pdf/P2C81%20Phase2_UNgummed.pdf [Accessed 9 April 2017].
Infrastructure UK, 2010. Infrastructure Cost Review: Technical Report, London: HM Treasury.
Kaewunruen, S., Sussman, J. M. & Matsumoto, A., 2016. Grand Challenges in Transportation and Transit Systems, s.l.: Frontiers in Built Environment.
Koebler, J., 2016. Elon Musk on the Hyperloop: ‘I’m Starting to Think It’s Really Going to Happen’. [Online] Available at: https://motherboard.vice.com/en_us/article/elon-musk-on-the-hyperloop-im-starting-to-think-its-really-going-to-happen
Konrad, A., 2016. Leaked Hyperloop One Docs Reveal The Startup Thirsty For Cash As Costs Will Stretch Into Billions. [Online] Available at: https://www.forbes.com/sites/alexkonrad/2016/10/25/hyperloop-one-seeks-new-cash-amid-high-costs/#2ea9bc38125c
Korosec, K., 2016. Hyperloop That Links Helsinki to Stockholm Would Cost $21 Billion. [Online] Available at: http://fortune.com/2016/07/06/hyperloop-helsinki-stockholm/
Kramer, D., 2016. US Navy shows off its R&D wares. Physics Today, 69(7), p. 35.
LaViolette, M., 2007. Bridge Construction Practises Using Incremental Launching, Kansas City: HNTB Corporation.
Lee, J.-H. & Lee, S.-J., 2009. Application of laser-generated guided wave for evaluation of corrosion in carbon steel pipe. NDT&E International, pp. 222-227.
Levien, R., 2008. The Euler spiral: a mathematical history, s.l.: s.n.
Lopez, B., 2015. In-Service Inspections Using EMAT and MRUT. Inspectioneering Journal, August.
Lopez, B., 2016. Detection of Defects and Corrosion Under Pipe Supports and Inaccessible Areas Using EMAT Medium Range UT Techniques. Inspectioneering Journal, June.
Mackie, P. et al., 2003. Values of Travel Time Savings in the UK – Summary Report, Leeds: Institute for Transport Studies.
Mairs, J., 2016. BIG reveals full designs for Dubai Hyperloop in new video. [Online]
Available at: https://www.dezeen.com/2016/11/08/big-designs-dubai-abu-dhabi-hyperloop-one-new-video-technology-news/ [Accessed 6 April 2017].
Marshall, C., 2016. British Roads FAQ. [Online] Available at: http://www.cbrd.co.uk/roadsfaq/#26
McNab, I. R. & Beach, F. C., 2007. Naval Railguns. IEEE Transactions on Magnetics, 43(1), pp. 463-468.
Meier, R. C. & Smith, A. F., 1966. Feasibility Study of Air Bearing Rocket Sled Slippers, s.l.: Kaman Aircraft Corporation.
Musk, E., 2013. Hyperloop Alpha, Los Angeles: SpaceX;Tesla.
NASA, n.d. Two-Ton Hockey Pucks. [Online] Available at: http://ms.spacegrant.org/uploads/images/Education/Conferences/NASA%20s%20Toy%20Box/2.ton.hockey.pucks.pdf [Accessed 11 March 2017].
Network Rail, 2017a. How we’re governed and managed. [Online]
Available at: https://www.networkrail.co.uk/who-we-are/how-we-work/how-were-governed-and-managed/
Network Rail, 2017b. Who we are. [Online] Available at: https://www.networkrail.co.uk/who-we-are/
New Way Air Bearings, 2006. Air Bearing Application and Design Guide, Aston: New Way Air Bearings.
NFU, 2015. NFU responds to latest HS2 compensation package. [Online] Available at: http://www.nfuonline.com/archived-content/archived-news-content/news/archived-news-content-pre-nov-2015/nfu-responds-to-latest-hs2-compensation-package/ [Accessed 7 April 2017].
Ollivier, G., Sondhi, J. & Zhou, N., 2014. High-Speed Railways in China: A Look at Construction Costs. China Transport Topics No.9, pp. 1-8.
Ordnance Survey, 2014. New building height data released. [Online] Available at: https://www.ordnancesurvey.co.uk/blog/2014/03/new-building-height-data-released/
Perry, M. & Golding, N., 2011. Range of environmental temperature conditions in the United Kingdom , Exeter: Met Office.
Petersen, L. J. et al., 2011. U.S. Navy efforts towards development of future naval weapons and integration into an All Electric Warship (AEW), s.l.: s.n.
Peterson, J., 1968. Buckling of thin-walled circular cylinders, Langley: NASA.
Pharris, T. & Kolpa, R., 2007. Overview of the Design, Construction and Operation of Interstate Liquid Petroleum Pipelines, Argonne: Argonne National Laboratory.
Post, R. F. & Ryutov, D. D., 2000. The Inductrack Approach to Magnetic Levitation, Livermore: Lawrence Livermore National Laboratory.
Salter, R. M., 1978 . Trans-Planetary Subway Systems — A Burgeoning Capability , Santa Monica: The Rand Corporation.
Savills, 2016. Market Survey: UK Agricultural Land, London: Savills.
SpaceX, 2016a. SpaceX Hyperloop Pod Competition II: Rules and Requirements, Los Angeles: SpaceX.
SpaceX, 2016b. SpaceX Hyperloop Test-Track Specification, Los Angeles: SpaceX.
Sussman, E. D., Pollard, J. K., Mengart, P. & DiSario, R., 1994. Study to Establish Ride Comfort Criteria for High Speed Magnetically Levitated Transportation Systems, Cambridge: U. S. Department of Transportation: Federal Railroad Administration.
Tank Archives, 2015. PTRS Penetration. [Online] Available at: http://tankarchives.blogspot.co.uk/2015/10/ptrs-penetration.html [Accessed 8 April 2017].
Taylor, C. L., Hyde, D. J. & Barr, L. C., 2016. Hyperloop Commercial Feasibility Analysis, Cleveland: NASA.
The AA, 2001. Going Underground. TUNNELS: What role in town and country? , s.l.: The Automobile Association .
The Economist, 2011a. Railroad to nowhere. [Online] Available at: http://www.economist.com/node/21528294
The Economist, 2011b. The great train robbery. [Online] Available at: http://www.economist.com/node/21528263
Tiratsoo, J., 2014. The Current State of Pipeline Integrity Management. Inspectioneering Journal, October.
TunnelTalk, 2017. Tracking the world’s mega-TBMs. [Online] Available at: http://www.tunneltalk.com/Discussion-Forum-Mega-TBMs.php
Upbin, B., 2015. Hyperloop Is Real: Meet The Startups Selling Supersonic Travel. [Online]
Available at: https://www.forbes.com/sites/bruceupbin/2015/02/11/hyperloop-is-real-meet-the-startups-selling-supersonic-travel/#47fdb67c7686
Upbin, B., 2017. Hyperloop One. [Online] Available at: https://hyperloop-one.com/blog/first-look-devloop-worlds-only-full-scale-hyperloop-test-track
UtilityServe, n.d. Wayleaves & Easements. [Online] Available at: http://www.utilityserve.co.uk/wayleaves_and_easement.php [Accessed 7 April 2017].
Verkooijen, J., 2013. Automation in Non-Destructive Testing – The Changing Role of the Operator. Inspectioneering Journal, December.
Vlahos, J., 2015. Hyped Up – Startups Race to Bring the Hyperloop to Life. Popular Science, 2015 July.
Watson, R. & Albon, S., 2012. The UK National Ecosystem Assessment – Synthesis of the Key Findings, Oxford: UK NEA.
Wellings, R., 2014. Failure to Transform: High-Speed Rail and the Regeneration Myth, London: Institude of Economic Affairs.
Wyrick, B. & Brown, J., 2009. Acceleration in Aviation: G-Force, Oklahoma City: Federal Aviation Administration.
Zimmermann, K. & Macfarlane, R., 2014. Hyperloop Cheetah: Wheel design feasibility study, s.l.: s.n.
9. Appendix
All files used in this research are open source and available at: https://drive.google.com/drive/folders/0B_GyUTuhCdDYQTdtV0M3ay1TV28?usp=sharing
[1] A currency exchange rate of 1 USD=0.80 GBP has been used
Cite This Work
To export a reference to this article please select a referencing stye below:
Related Services
View all


Related Content
All TagsContent relating to: "Transportation"
Transportation refers to the process of goods, people or animals being moved from one place to another. There are multiple methods of transport, including train, boat, bus, plane, lorry, and more.
Related Articles

DMCA / Removal Request
If you are the original writer of this dissertation and no longer wish to have your work published on the UKDiss.com website then please: