Overestimation of Paraproteins in Serum by Immunoturbidimetric Method
Info: 24337 words (97 pages) Dissertation
Published: 11th Dec 2019
Tagged: Biology
Abstract
Background:
Although protein electrophoresis of serum (SPEP) and urine (UPEP) specimens is a well-established laboratory technique, the reporting of results using this important method varies considerably between laboratories
Multiple myeloma (MM) is a plasma cell dyscrasia characterized by the over- proliferation of a plasma cell clone that produces a monoclonal immunoglobulin (Aksungar et al., 2014).
Previous comparisons of monoclonal protein quantification identified a bias between serum protein electrophoresis (SPEP) and immunonephelometry.
Method: We examined the relationship between SPEP and NEPH. Selected sera with high monoclonal protein concentrations were diluted and reassessed.
Results:
Conclusion:
A key aspect of prognosis and follow up of monoclonal gammopathies rely upon obtaining reproducible accurate quantification of paraproteins.
A comparison of paraprotein estimation by scanning densitometry with corresponding immunoglobulin concentration measured by immunotubidmetry using a number of sera has indicated overestimation of the immunoglobulin by immunotubidmetry in the presence of a monoclonal component. The effect was seen with all three major immunoglobulin isotypes but was most marked with IgM paraproteins when measured by immuno. (Riches et al. 1991).
The detection, characterization, and measurement of M-proteins help in initial diagnosis of the disorders, stratification of risk progression, and monitoring response to therapy. (Keren and Schroeder, 2016).
Table of Contents:
Contents
1.2.1 Synthesis and Structure of immunoglobulins
1.2.3 Measurement of Immunoglobulins via Immunoturbidimetric via Roche Cobas c 701/702 instrument
1.3.1 Monoclonal Gammopathy of Undetermined Significance
1.3.3 Waldenström Macroglobulinemia
1.4 Diagnosis of Monoclonal gammaopathies
1.4.1 Serum protein electrophoresis
1.4.2 Paraprotein characterization
1.6 The discrepancy between SPE and Immunoturbidimetry
1.7 Aims and Objectives in light of the literature review
2.3.1 Sample Collection and Storage
2.3.2 Immunoturbidimetric assay
3.2 Dilution of samples to evaluate a solution
How results obtained compare with previous researchers/ Inconsistent results.
Factors affecting paraprotein measurement
Current approach/ recommendations in local hospitals
List of Figures:
Figure 1 Schematic representation of the structure of an immunoglobulin (Thermo Fisher Scientific, 2017)
Figure 2: SPE and the detection of monoclonal immunoglobulins……………………..
Figure 3: Normal and abnormal SPE electropherogram. Top picture depicts a normal electrophoretogram. Bottom picture depicts an electrophoretogram in a MM patient.
Figure 4: Regions where the polyclonal immunoglobulins usually lie on an electropherogram. The red area indicates the heavy or light chain type that has been removed after reaction with the relevant antisera.
Figure 5:……………………………………………………….
Figure 6 Results obtained from the retrospective search carried out on IgG isotype paraproteins quantitated by SPE and Immunoturbidimetric assay. The blue line depicts the trendline, while the red line depicts the ideal line.
Figure 7 Results obtained from the retrospective search carried out on IgA isotype paraproteins quantitated by SPE and Immunoturbidimetric assay. The blue line depicts the trendline, while the red line depicts the ideal line.
Figure 8 Results obtained from the retrospective search carried out on IgM isotype paraproteins quantitated by SPE and Immunoturbidimetric assay. The blue line depicts the trendline, while the red line depicts the ideal line.
Figure 9 IgG before dilutions…………………………………………..
Figure 10 IgG after dilutions……………………………………………
Figure 11: IgG NORMAL RANGE SAMPLES……………………………………
Figure 12:IgA before dilutions…………………………………………..
Figure 13: IgA after dilutions…………………………………………..
Figure 14: IgM BEFORE DILUTIONS……………………………………….
Figure 15: IgM RESULTS AFTER DILUTIONS…………………………………..
List of Tables:
Abbreviations
| SUH | Sligo University Hospital |
| SPE | Serum protein electrophoresis |
| MM | Multiple Myeloma |
| IT | Immunotyping |
| IF | Immunofixation |
| IgG | Immunoglobulin gamma |
| IgA | Immunoglobulin alpha |
| IgM | Immunoglobulin mu |
1.0 Literature review
1.1 Introduction
Immunoglobulins are an essential component of the human immune defence system, secreted by plasma cells. Plasma cells generally secrete polyclonal immunoglobulins, whereas in monoclonal gammopathies there is an overproduction of monoclonal immunoglobulins from single pro-B germ cells. The condition may be malignant or benign. These monoclonal immunoglobulins are preferably termed ‘paraproteins’. Paraproteins differ greatly from polyclonal immunoglobulins by size and amino acid composition, and may exhibit clone specific behaviours (Roche 2015, Uljon et al., 2013). The concentration of paraproteins is a good indicator of disease progression or response to treatment in patients with a monoclonal gammopathy, thus accurate quantitation of paraprotein levels is of upmost importance (Riches et al., 1991).
The overestimation of paraproteins by immunoturbidimetric assays has been well documented, when compared with the measurement from the electrophoretogram using Serum Protein Electrophoresis (SPE) (Jelinek and Bachmann, 2014, Riches et al., 1991). Clinicians dealing with patients who have a paraprotein are usually aware of this anomaly (??). However in Sligo University Hospital, as all immunoglobulin levels are assayed and reported on a daily basis, independently of SPE result (which may not be reported for some days later), the discrepancy isn’t taken into account, hence these ‘erroneous’ results may be acted on by the clinicians. Treatment and overall prognosis of the patient could potentially be affected.
The use, limitations and reliability of immunoglobulin measurement by immunoturbidimetry and electropherogram carried out by CZE, will be explored in this project, in particular in the monitoring of patients with a paraprotein band.
1.2 Immunoglobulins
1.2.1 Synthesis and Structure of immunoglobulins
The immune response to an invading pathogen is usually the production of a heterogeneous population of immunoglobulins, containing several different immunoglobulin classes and subclasses, all directed against the same antigen. Individuals with a healthy immunoglobulin production possess a range of polyclonal immunoglobulins in their serum, all capable of reacting to different antigens. Polyclonal antibodies are a heterogeneous mix of immunoglobulins that all possess a similar antigenic specificity with differing affinity (Sztefko and Dawsonera, 2011).
Individual B-lymphocytes called plasma cells secrete a single specific immunoglobulin, Each isotype of immunoglobulin comprises of a combination of heavy chains (IgG, IgA, IgM, IgD or IgE) and a light chain (kappa or lambda) joined. There are two major regions of an immunoglobulin molecule; the fragment antigen-binding region (Fab) and the fragment crystallizable region (Fc). There are constant, variable and hypervariable regions as can be seen from Figure 1 below.
In monoclonal gammopathies, over proliferation of a single clone of plasma cell leads to the overproduction of specific type of immunoglobulin. This immunoglobulin is referred to as a paraprotein (Hoffbrand and Moss, 2016, Thermo Fisher, 2017). Paraproteins are identical, having a single defined specificity, recognizing the same epitope on an antigen (Sztefko and Dawsonera, 2011).
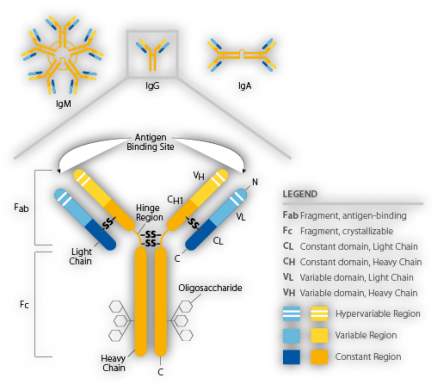
Figure 1 Schematic representation of the structure of an immunoglobulin (Thermo Fisher Scientific, 2017)
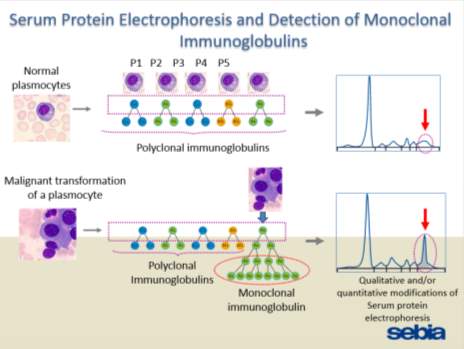
Figure 2: SPE and the detection of monoclonal immunoglobulins.
(Powerpoint by SEBIA)
1.2.2 Isotype subclasses
There are five main classes of immunoglobulin termed: IgG, IgA, IgM, IgE and IgD. These classes are composed of the basic four-chain antibody structure, however they differ in the heavy chains they possess: γ, α, µ, δ, and Ɛ (Roitt et al., 2011). Each of these classes have distinct functions and characteristics. All major isotypes but IgD and IgE are routinely measured in S.U.H.
Immunoglobulin gamma (IgG) is a monomeric antibody, commonly found in serum and non-mucosal tissues, where it has functions in inactivating pathogens directly and through the interaction with effector triggering molecules such as complement and Fc receptors (Roitt et al., 2011). Approximately 80% of serum immunoglobulins in IgG. It is composed of two heavy gamma chains and two light chains (kappa (κ) or lambda (λ) held together by a disulphide bond. Kappa chains tend to be more prevalent in humans than lambda chains (Roitt et al., 2011). An increase in polyclonal IgG is often observed in conditions such as cystic fibrosis, chronic liver diseases, systemic lupus erythematosus and infectious diseases. An increase in monoclonal IgG is related to IgG-myeloma (Roche, 2015). A decrease in serum IgG levels is a clinical feature of many conditions such as congenital and acquired immunodeficiency conditions, IgG subclass deficiencies, protein-losing enteropathies, and nephrotic syndrome (Roche, 2015).
IgA Accounts for 13% of the plasma immunoglobulins. Its main function is to protect the skin and mucosa against invading pathogens. It has the capability of binding to toxins and possesses anti-bacterial and anti-viral properties. IgA is the predominant immunoglobulin found in bodily secretions, such as saliva, sweat and colostrum. Secretory IgA provides defence against local infections and is important in binding food antigens in the gut. In serum, IgA exists in monomeric, dimeric and trimeric forms, whereas in bodily secretions IgA exists exclusively in dimeric form with an additional secretory component. An elevation of polyclonal IgA levels may occur in chronic infections, autoimmune disorders, sarcoidosis and Wiscott-Aldrich syndrome. A monoclonal IgA often relates to presence of an IgA-myeloma. A decrease in IgA either is related to an increased loss or decreased synthesis. Protein-losing gastroenteropathies or severe burns may result in an increased loss whereas a decreased synthesis is caused by acquired or congenital immunodeficiency disease such as Bruton type agammaglobulinemia.
Serum IgM molecules are pentameric repeats of the same monomer. IgM comprises of 10 heavy µ-chains and 10 light chains (kappa or lambda). There is a j-chain which links all the µ-chains together. IgM is the largest immunoglobulin molecule with a molecular weight of approximately 950 kDa (Roche, 2015). IgM accounts for 6% of plasma immunoglobulin. IgM is the first specific antibody to be produced in response to an infection. It aids in the elimination of bacteria and other pathogens by activating complement. IgM levels decline rapidly after the infection has subsided. This can aid clinicians in distinguishing between acute and chronic infections as in a chronic infection (such as Rubella or viral hepatitis) IgG will predominate whereas in an acute condition IgM will predominate. Increased polyclonal IgM levels are found in many viral, bacterial, and parasitic infections, as well as liver dysfunction, rheumatoid arthritis, scleroderma, heroin addiction and cystic fibrosis. Monoclonal IgM is increased in Waldenström’s macrogloulinemia. An increase in IgM may be due to protein losing enteropathy and in burns. A decreased synthesis of IgM occurs in congenital and acquired immunodeficiency syndromes.
IgE is a monomeric antibody found at very low concentrations in the serum. It is thought that the majority of IgE Fc receptors on mast cells. Antigens that bind to IgE cross-link IgE Fc receptors and trigger an inflammatory reaction, which aids in the immune defence and results in allergic symptoms (Roitt et al., 2011). IgD is also a monomeric antibody mainly found on the surface of the B cell as an antigen receptor together with IgM where its function is to control activation and suppression of lymphocytes (Roitt et al., 2011). IgE and IgD are not routinely measured in S.U.H primarily due to their rarity in relation to monoclonal gammopathies.
1.2.3 Measurement of Immunoglobulins via Immunoturbidimetric via Roche Cobas c 701/702 instrument
The Roche IgG/ IgA and IgM assays are based on immunological agglutination. For example anti-IgG antibodies in the reagent reacts with the corresponding epitope on the immunoglobulin in the serum sample to form an antibody- antigen complex. This agglutination is then measured immunotubidimetrically (Roche, 2015). This method measures the polyclonal and monoclonal antibodies present in the patients serum.Hypergammaglobulinaemia is often associated with autoimmune diseases or infection. In these cases, the immunoglobulins produced are usually polyclonal and multiple immunoglobulin classes tend to be affected.
Monoclonal production is usually associated with a significant increase in only one class of immunoglobulin, this is referred to as a paraprotein or monoclonal immunoglobulin. Monoclonal gammopathies are often associated with a decrease in the other two major classes of immunoglobulins known as immunoparesis. Patients with monoclonal gammopathies are often relatively immunocompromised, despite the total immunoglobulin level appearing raised, as the majority of the immunoglobulin production does not contribute to the patient’s immune response, as it is abnormal.
1.3 Monoclonal gammopathies
Monoclonal gammopathies are a group of plasma cell dyscrasia characterized by the presence of a paraprotein detected in the serum and/or urine. These paraproteins may consist of intact immunoglobulins and/or fragments for example free light chains. (Keren and Schroeder, 2016). There is a range of monoclonal gammopathies some of which include; monoclonal gammopathy of undetermined significance (MGUS), smouldering myeloma, multiple myeloma (MM) and Waldenström’s Macroglobulinemia (WM). There are also other disorders such as heavy chain disease, light chain disease, and amyloidosis. Each of these disorders has distinct clinical features, laboratory results, treatment options and prognosis (Keren and Schroeder, 2016). A major challenge for clinicians is the accurate differentiation of low risk patients who do not require further follow up from higher risk patients who require treatment and continual monitoring (Merlini, 2014).
1.3.1 Monoclonal Gammopathy of Undetermined Significance
MGUS is one the most common premalignant disorders occurring mainly in approximately 3-4% of individuals over the age of 50 years (Hoffbrand and Moss, 2016, Leung et al., 2012). However, it is possible for MGUS to begin in patients as early as 20 years of age (Keren and Schroeder, 2016). It is predominantly characterized by the presence of persistent paraproteins in the patient’s serum, in the absence of symptoms or end organ damage. Patients with MGUS have a risk of approximately 1% of progression to MM or other related plasma cell disorders (Leung et al., 2012). A diagnosis of MGUS includes serum monoclonal component of less than 10g/L and bone marrow plasma cells approximately less than 10%. Other serum immunoglobulins are also not suppressed (Hoffbrand and Moss, 2016).
It is often difficult to differentiate between MGUS and malignant paraproteins. Some criteria that clinicians may assess to aid differential diagnosis include; Total protein within reference range: Normal ESR: Beta 2 microglobulin within reference range: one or more faint bands on SPE, low concentration of a paraprotein (and no increase on repeat testing over a period of time): a lack of immunoparesis; absence of Bence Jones proteins. ? table? Treatment is generally not recommended for MGUS patients; however, these patients are monitored regularly in the outpatient clinic, unless the condition progresses to MM, as the vast majority of patients remain asymptomatic for many years (Leung et al., 2012).
1.3.2 Multiple Myeloma
Multiple myeloma (MM) is a malignant B cell neoplasm characterized by the uncontrolled proliferation of plasma cells (Fairfield et al., 2016). Virtually all MM patients first present clinically as MGUS and in the majority of these patients MGUS usually lasts approximately 8 years before progressing to a smoldering myeloma, and finally progressing to symptomatic MM. Populations which may be predisposed or at a higher risk to the development of MM include; elderly patients (65 years upwards), males and African American ethnicity. There are also a number of secondary risk factors, which may predispose patients to the development of MM, such as chronic immunodeficiency, and chronic inflammatory conditions for example cardiovascular disease, Diabetes Mellitus and obesity. Although MM occurs most often in elderly individuals, 2% of MM cases are reported in patients under 40 years of age (Keren and Schroeder, 2016).
Although the gamma globulin fraction is increased in MM patients, individuals are immunocompromised due the suppression of the other immunoglobulin isotypes (apart from the monoclonal immunoglobulin), this is known as immunoparesis
Clinical manifestations of MM often involve multiple organ systems (Fentress et al., 2006). Symptoms of MM are often abbreviated as CRAB symptoms, these include: hypercalcaemia, renal dysfunction, anaemia, and lytic bone lesions often result (Fairfield et al., 2016, Aksungar et al., 2014). Myeloma cells adhere to bone marrow stromal cells, therefore inhibiting apoptosis and stimulates cytokine production. Receptor activator of nuclear factor- kappa B ligand (RANKL) is synthesised by plasma cells and bone marrow stroma. RANKL binds to activatory RANK receptors on the surface of osteoclasts. High serum levels of RANKL causes an increase in osteoclast activation resulting in the development of osteolytic bone lesions (Hoffbrand and Moss, 2016).
Long term monitoring for evidence of progression must include any change in the quantity of the paraprotein and the degree of immunoparesis (suppression of normal immunoglobulins). Prognosis of MM patients was historically predicated using the Durie-Salmon classification system. This system was complex and was found not to correlate well with patient prognosis. This system has been replaced in recent years by the international staging system, which is a much simpler classification system (see APPENDIX) (Fentress et al., 2006). The outlook for patients with MM is improving markedly. The overall median survival is now 7-10 years and in younger patients (i.e. less than 50 years of age), it can be over 10 years. Further testing may include a bone marrow biopsy or cytogenetic testing. A bone marrow aspirate and biopsy, although an invasive procedure, provides clinicians with information regarding the percentage and distribution of plasma cells in the bone marrow.
1.3.3 Waldenström Macroglobulinemia
Waldenström Macroglobulinemia (WM) is a B- cell lymphoplasmacytic lymphoma, which was first described in 1944 (Oza and Rajkumar, 2016). It is characterized by bone marrow infiltration with lymphoplasmacytic cells, accompanied by a serum IgM monoclonal gammopathy. Oza and Rajkumar estimated the overall incidence of WM at 0.55 per 100,000 per year in the United Kingdom (2016), with the median age of people affected 63- 68 years old. Diagnosis of WM may be missed or patients may be misdiagnosed due to the lack of symptoms at the early stage of the condition (Leleu et al., 2008). A major risk factor for WM is patients with a pre-existing MGUS, increasing serum IgM levels are often seen in these patients that transform from asymptomatic IgM-MGUS to symptomatic WM (Leleu et al., 2008). 25% of patients affected by WM are asymptomatic; therefore, diagnosis is often incidental during routine screening. Common symptoms experienced by symptomatic patients include; anaemia, amyloidosis, pancytopenia, cryoglobulinemia and night sweats (Oza and Rajkumar, 2016). Accurate determination of the IgM paraprotein concentration is important for the containment of disease progression and prevention of transformation to a high-grade lymphoma. Survival rates range from 5 -11 years (Oza and Rajkumar, 2016).
1.4 Diagnosis of Monoclonal gammaopathies
Diagnosis of monoclonal gammaopathies is based on clinical features alongside laboratory finding such as: paraprotein levels in serum and/or urine; an increase of plasma cells in the bone marrow; organ or tissue impairment. The diagnosis and subsequent management of a monoclonal gammopathy patient depends upon the accurate identification and characterization of the correct paraprotein (Aksungar et al., 2014). Monoclonal (and biclonal) gammaopathies can be identified by a combination of SPE, immunofixation and immunotyping.
1.4.1 Serum protein electrophoresis
Quantification of IgG, IgA and IgM in serum can reveal an elevation of a specific immunoglobulin isotype that may be suggestive of the presence of a paraprotein. However, this measurement does not distinguish between polyclonal immunoglobulins and abnormal monoclonal forms of a particular immunoglobulin. Therefore, immunoglobulin quantification cannot substitute SPE for the identification of paraproteins and screening for protein abnormalities.
SPE is a well-established technique that is commonly used in clinical biochemistry/ immunology laboratories for the identification of protein abnormalities (SEBIA, 2015). Capillary electrophoresis is utilised in S.U.H. The CAPILLARYS 3 TERA instrument is a fully automated, capillary zone electrophoresis (CZE) instrument. Results processing and transfer to host is aided by the Phoresis software.
The CAPI 3 PROTEIN (E) 6 kit is designed to separate human serum proteins by capillary electrophoresis using the CAPILLARYS 3 instrument. The principle of CZE is based on the separation of charged molecules by their electrophoretic mobility in an alkaline buffer with a specific pH. SPE separates serum proteins into: albumin, alpha 1, alpha 2, beta 1, beta 2 and gamma globulins.
Table:
| Pre-albumin | Transthyretin
Retinol Binding protein |
| Albumin | |
| Alpha 1 | Alpha 1-Antitrypsin
Alpha 1-Fetoprotein Alpha 1-Lipoprotein |
| Alpha 2 | Haptoglobin
Alpha 2- Macroglobin Caeruloplasmin |
| Beta | Transferrin
Lipoproteins Complement proteins Fibrinogen C-Reactive protein |
| Gamma | Immunoglobulins – IgG, IgM, IgA, IgD, IgE |
SPE by CZE generates an electropherogram, which can indicate abnormalities particularly in the beta globulin or gamma globulin regions and therefore which may indicate the presence of a monoclonal gammopathy and thus requires further investigation Sebia, 2015).
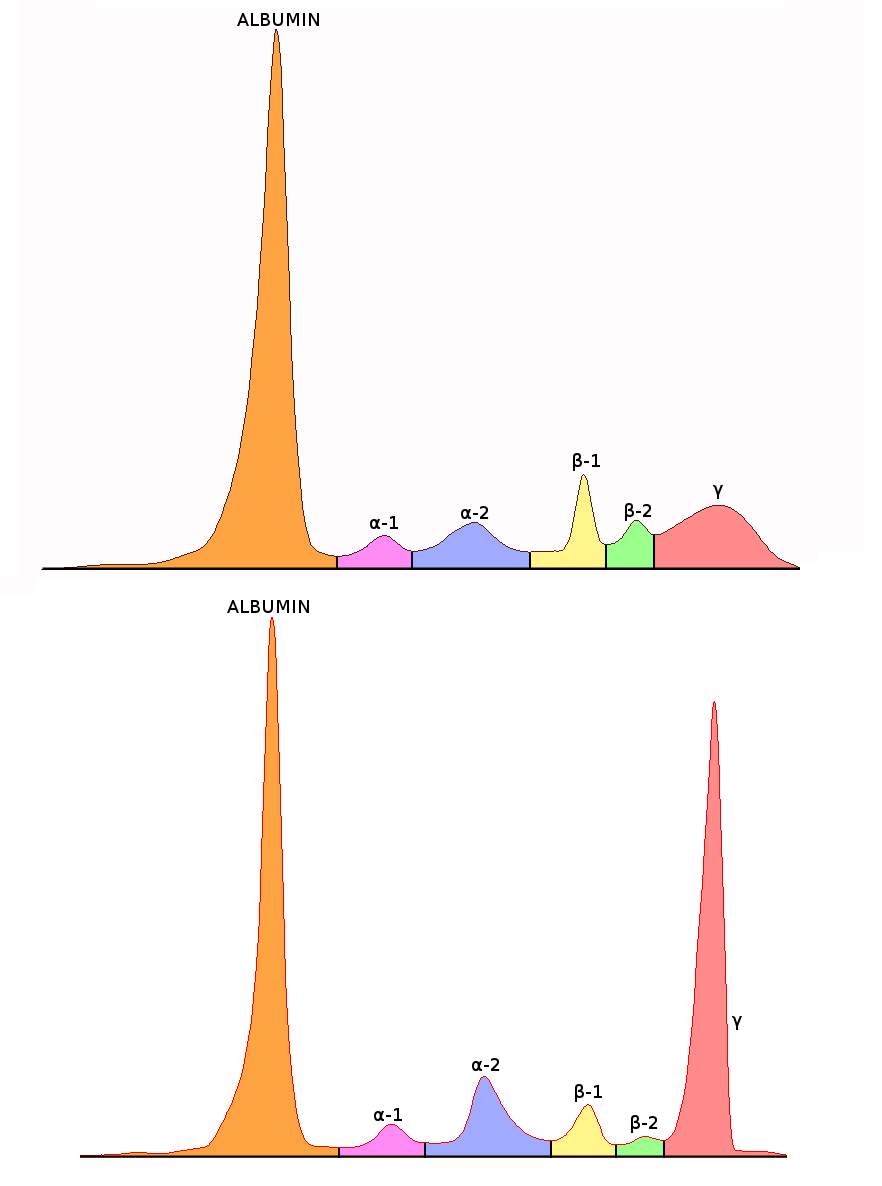
Figure 3: Normal and abnormal SPE electropherogram. Top picture depicts a normal electrophoretogram. Bottom picture depicts an electrophoretogram in a MM patient.
Figure :
1.4.2 Paraprotein characterization
Immunofixation (IF) or immunosubtraction/Sebia immunotyping (IT) is required to characterize the paraprotein type in first time patients presenting with a paraprotein. In subsequent samples from these patients, IF and immunotyping may not be essential unless in scenarios where there has been a change in the electrophoretic mobility, a suspected additional band or absence of a previous band or detect disease relapse (Tate et al,. 2012).
1.4.2.1 Immunofixation Electrophoresis
The HYDRAGEL IF system is designed for the detection and characterization of monoclonal proteins in human serum and urine by immunofixation electrophoresis (Sebia, 2015). IFE is a highly specific and sensitive method used to classify monoclonal immunoglobulins (Aksungar et al., 2014). After electrophoresis, individual antisera is overlaid into the appropriate electrophoretic migration tracks, the first track serves as a reference providing the entire electrophoretic pattern of the samples proteins. The remaining five tracks allow classification of the monoclonal component with antisera against IgG, IgA, IgM heavy chains, and against free and bound kappa and lambda light chains (Sebia, 2015 & Aksungar et al., 2014). The antisera diffuses into the gel and precipitates the corresponding antigens when present hence forming an insoluble complex (Sebia, 2015). The unprecipitated proteins are washed from the gel, whereas the precipitated proteins are trapped within the gel matrix, and can be visualised by staining with acid violet.
A non-multiple myeloma serum sample shows a light diffused staining of polyclonal immunoglobulins in all tracks (Sebia, 2015). A monoclonal band detected with one of the anti-heavy chain antisera (gamma, alpha or mu) and either with anti-kappa or anti-lambda light chain serum characterizes presence of a paraprotein. The band itself should be sharp and demarcated in appearance. A comparison can then be made between the suspect bands in the reference pattern; the corresponding band should have the same migration position (Sebia, 2015).
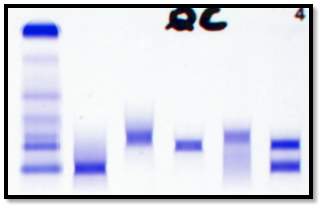
QC
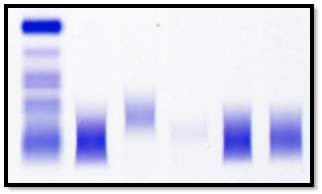
Normal POLYCLONAL DIFFUSE INCREASE
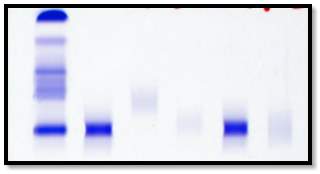
PATIENT WITH A BAND
A major disadvantage of the immunofixation method is that it is labour intensive. The manufacturer recommends the interpretation of the gel to be carried out soon after the gel has be processed. The gels are scanned using the built in scanner on the HYDRASYS 2-Scan (Sebia) and linked to the patients file on the Phoresis database.
IFE is a useful technique to identify small bands detected on SPE/
In cases where a myeloma of IgE or IgD is suspected on observation of the immunofixation, where light chains are observed alone without a corresponding heavy chain, if must be repeated using antisera against IgD and IgE and the corresponding free light chain, to check if paraprotein band is an IgD, IgE or light chain.
PICTURE X2 –PCN 483050 TO SHOW LIGHT CHAIN.
1.4.2.2 Immunotyping
An alternative method for paraprotein characterization is immunotyping (IT). Immunotyping employs the immunosubtraction technique. The CAPI 3 IMMUNOTYPING kit (Sebia) is designed for the ‘detection and characterization of monoclonal proteins in human serum’ with the CAPILLARYS 3 TERA instrument.
There are six wells in total. The first well is used to obtain the reference electropherogram and therefore no antisera is applied (Yellow curve). Specific antisera against IgG, IgA and IgM heavy chains and against free and bound Kappa and Lambda light chains is added to the other 5 wells and mixed with diluted sample. If the corresponding immunoglobulin is present, it is removed by the binding of the antisera to the immunoglobulin, forming an immune complex, this complex migrates to the anodic position.
Visual analysis of the patterns (blue curve) is compared with the reference pattern (yellow curve). A decrease or disappearance of a monoclonal peak on the immunotyping pattern indicates the isotype of the paraprotein (Aksungar et al., 2014). (SEBIA, 2015). (See
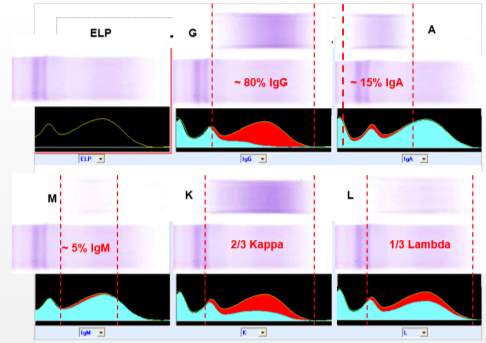
Figure 4: Regions where the polyclonal immunoglobulins usually lie on an electropherogram. The red area indicates the heavy or light chain type that has been removed after reaction with the relevant antisera.
NEED PICTURES OF QC, NORMAL AND BAND.
If as a result of the immunotyping or IF technique, a monoclonal band is identified and characterised, then this indicates the presence of a gammopathy. The next step is quantitation of the paraprotein band.
Quantitation of paraprotein
There are two methods available to quantitate paraproteins using Sebia CZE and Phoresis software: Perpendicular drop measuring perpendicularly to the baseline at the points where the Monoclonal peak meets the polyclonal γ curve. Tangent skimming where quantitation involves measurement of the peak from valley to valley. (Figure )
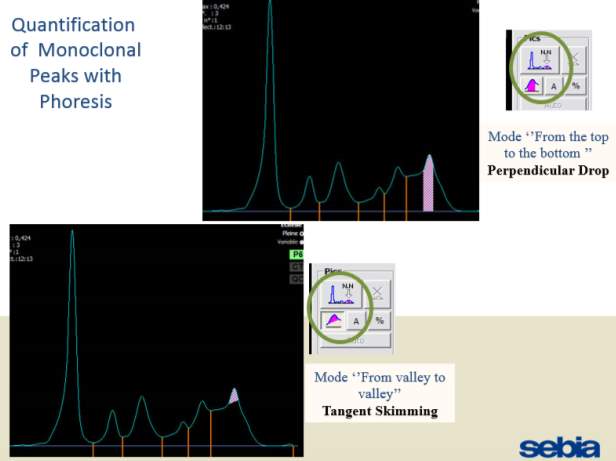
Only perpendicular drop is utilised in S.U.H. The paraprotein quantitation is estimated when a medical scientist subjectively delineates the boundary of the paraprotein with the aid of the projected gel image as seen in Figure below.
On the computer generated image, the beginning of the peak area (red arrow) is selected and dragged to the end. As the total protein result is available, the quantitation of the peak is given in g/L.


1.5 Current practice at S.U.H
The current protocol in place in S.U.H is that when a sample is requested for SPE or for Immunoglobulins, the following tests are ordered: Total protein, Albumin, IgG, IgA, IgM, and SPE. Total protein, albumin and the immunoglobulins are sent to the Roche Cobas 8000 series. These tests are assayed, and if results are within the pre-defined lower and higher technical limits, results are auto-validated. If the results are outside these technical limits (See appendix) the analyser is programmed to repeat these assays by dilution or increased volume of sample as appropriate. These results are assessed and if there are no technical alerts/ flags on the result then they are released by the medical scientist.?flow chart Occasionally when a particular immunoglobulin isotype gives an alert/ flag attached to the result even on dilution the result for that isotype is withheld and a coded comment: ‘Data for IgG/IgA/IgM has been suppressed as the monoclonal isotype is an IgG/IgA/IgM and therefore cannot be reliably measured’ replaces the result only when electrophoresis is complete and this result verified.
The samples for SPE are batched and run approx. 3 times per working week (i.e. Monday-Friday).
For patients with paraproteins bands the peak quantitation is reported as part of the electrophoresis report.
As part of SPE reporting process, immunoglobulin results are assessed. In many cases of patients with paraprotein bands, it has been noted that there is a discrepancy between the quantitation of the band and the results of the immunoglobulin isotype assayed by immunoturbidimetry.
In summary at S.U.H the clinicians are receiving Immunoglobulin results before the electrophoresis results are available and in some cases these are spurious results.
The biochemistry department in S.U.H adhered to many recommendations for reporting SPE as set out by Tate et al,. 2012. Consistency of the approach is fundamental to ensure serial measurements on regular patients have meaning.????? strive for consistency
Ability to interpret patient results accurately and awareness of the limitations of the measurement techniques is important.
1.6 The discrepancy between SPE and Immunoturbidimetry
There is an accepted discordance between quantitation of paraprotein bands by the electropherogram method (as described in section 1.4.1 /figure.. ) and immunoturbidimetry, in particular where high levels of paraproteins are present (Uljon et al., 2013). There are many possible causes of these discrepancies, many of which are analytical and biological.
Due to the known issues in the measurement of paraproteins, immunoturbidimetry cannot be solely used, as all immunoglobulins (whether polyclonal or monoclonal) are measured together. Therefore, if there is a ‘normal’ amount of polyclonal IgG in a patient that also has a small IgG paraprotein, the immunoturbidimetry measurement of IgG may indicate an overestimation the paraprotein band Katzmann et al., ). In practice this does not tend to be an issue as at this level many of the patients have MGUS rather than active MM and the amount normal polyclonal IgG is expected. This issue however is more complex in cases of large paraprotein bands where there is obvious background immunoparesis as demonstrated by SPE whilst the measurement of the immunoglobulin by immunoturbidimetry may be greatly overexaggaterd. Fortunately, clinicians treating patients with a high paraproteins are generally aware of these limitations. ?evidence?
1.7 Aims and Objectives in light of the literature review
As paraprotein levels are directly related to the tumour burden in patients with monoclonal gammopathies, it is important to ensure these patients receive accurate quantification of their paraprotein bands in order to assess prognosis and response to treatment. However not all methods of paraprotein measurement give comparable results.
The main aim of this research project is to assess the current protocol in S.U.H for the reporting of SPE and immunoglobulins. Objectives include investigation of the inconsistency that sometimes occurs in the quantitation of a paraprotein band by measurement using the Sebia CAPILLARYS 3 instrument and the result from the immunoglobulin isotype from immunoturbidimetric analysis using Roche Cobas c 701/702 instrument. The approach of this project aims at diluting the sera samples that have a paraprotein level above the relevant reference range, to examine whether this would improve the discrepancy. This project will explore opportunities to improve the standardized protocol in S.U.H , particularly in patients with a paraprotein band.
2.0 Methodology
2.1 Project planning
A Gantt chart was used in the planning and monitoring of the progression of the research project. (See APPENDIX). A risk assessment was also carried out before any laboratory work was carried out to identify potential risks (See APPENDIX).
2.2 Materials
Table: Materials of Immunoturbidimetry analysis
| Materials | Serial number/
Lot number |
Expiry date |
| Patient samples | N/A | n/a |
| QC lot | ||
| Roche Cobas 8000 series c 701/702 | 05172152? | |
| Saline (9% NaCl) | ||
| False bottom tubes |
Table: Materials and their Lot Numbers and expiry dates used in CZE
| Materials | Serial number/
Lot number |
Expiry date |
| Sebia CAPILLARYS 3 TERA Instrument | 150560? | |
| Sample racks supplied with Instrument | ||
| CAPI 3 protein (E) KIT | 12096/01 | 09/2019 |
| Computer with PHORESIS software | ||
| CAPIprotect (5L) | 08016/01 | 01/2018 |
| CAPICLEAN Capillarys 3 | ||
| Wash solution? | 17106/05 | 10/2019 |
Table : Materials used in Immunotyping
| Materials | Serial number/
Lot number |
Expiry date |
| CAPILLARYS PROTEIN(E) 6 kit | (ref. 2003) | |
| CAPILLARYS IMMUNOTYPING kit, containing 60 segments with antisera (single use) | (ref. 2100) | |
Table: Materials used in immunofixation
| Materials | Serial number/
Lot number |
Expiry date |
| hYDRASYS 2 Scan sebia | 150561? | N/A |
| Sebia hydragel if Diluent (32ml) | 01126/01 | 12/2019 |
| sebia antisera and fixative | 31017/04 | 30/01/2017 |
| HYDRAGEL Plate IF 2/4 | 04017/01 | 01/2019 |
| thick and thin filter paper | ||
| buffered strips | 12126/01 | 12/2019 |
| sebia staining solution | 26055/01 | 05/2018 |
| sebia destain solution | ||
| hYDRASYS wash solution | ||
Table: Pipettes used throughout the project
| Materials | Serial number
|
| 2µl-20µl | K08812661 |
| 10µl-100µl | K08701901 |
| 100µl- 1000µl | K08700611 |
2.3 Method
2.3.1 Sample Collection and Storage
Patient sera samples already requested for immunoglobulins and SPE, in which a paraprotein was found to be present, was retrieved between September 2016 – April 2017. These samples were stored in an assigned box in the -80◦C freezer located in the biochemistry department at S.U.H, for the purpose of this research project.
2.3.2 Immunoturbidimetric assay
Samples stored in the -80◦C freezer were retrieved and thawed out in batches for reanalysis. Five separate batches (numbered numerically) were run on the following dates: 29/03/2017, 30/03/2017, 04/04/2017, 11/04/2017, and 21/04/2017.
Samples were initially thawed
All samples were entered manually as barcode reads.
IgG, IgA and IgM analysis use commercial kits manufactured by Roche Diagnostics.
selected for further study in an attempt to explain the nature of immunoglobulin overestimation by immunoturbidimetry in the presence of a paraprotein (Riches et al., 1991).
the analytes reacts with the reagent to produce an insoluble particles which remain suspended in the solution. When the light hits these particles. As the concentration of the analyte increases, the amount of light passing straight through the solution decreases. The measurement of the loss of light passing straight through the solution is known as turbidimetry (Reed, 2010).
In turbidimetry the detector is placed in a direct line with the incident light and the light sensed by the detector decreases as the number of analyte particles increases.
Manual dilutions performed through project
| Dilutions | Amount of sample (µl) | Amount of diluent (µl) |
| 1 in 2 | 100 | 100 |
| 1 in 3 | 60 | 120 |
| 1 in 4 | 60 | 180 |
| 1 in 5 | 40 | 160 |
| 1 in 6 | 30 | 150 |
| 1 in 10 | 20 | 180 |
| 1 in 20 | 20 | 380 |
| 1 in 30 |
Serum total protein was measured by.. refer to kit insert
The paraprotein concentration estimated by scanning densitometry in 451 serum samples was
compared with the corresponding immunoglobulin concentration measured by kinetic
nephelometry using the… (Riches et al.,1991).
2.3.3 CZE
2.3.4 Immunotyping
2.3.5 Immunofixation method
The HYDRASYS system is a semi-automated multi-parameter instrument. The automated steps include processing of HYDRAGEL agarose immunofixation gels in the following sequence:
- Sample preparation
Serum samples are diluted using Hydragel IF diluent according to Table .
Table :
| Track | Serum (µl) | Diluent (µl) |
| IgG IF Track | 20 | 100 |
| ELP ref Track an all other IF Tracks | 30 | 60 |
- Sample Application
Apply 10µl of diluted serum into the applicator wells according to table below. The samples are allowed to diffuse into the teeth of the applicator for approximately 5 minutes.
Note: The well numbers 1, 8 and 15 are not used in this test.
| ELP | G | A | M | K | L | |
| Hydragel IF 2/4 | ||||||
| Sample no. 1 or 3 | 2 | 3 | 4 | 5 | 6 | 7 |
| Sample no. 2 or 4 | 9 | 10 | 11 | 12 | 13 | 14 |
The electrode and applicator carrier are inserted into slots. Buffered strips are placed on the pins on the electrode carrier.
- Electrophoretic Migration
- Migration Set Up
Table 2.
- Incubation with fixative solution and antisera
Table: The Inject reagent so that it spreads through the trough without trapping any bubbles.
| TROUGH | TEMPLATE 2 and 4 IF (volume µl) | REAGENT |
| ELP | 40 | Fixative solution |
| G | 25 | Anti-gamma heavy chain antiserum |
| A | 25 | Anti-alpha heavy chain antiserum |
| M | 25 | Anti-mu heavy chain antiserum |
| K | 25 | Anti-kappa light chain (free and bound) antiserum |
| L | 25 | Anti-lambda light chain (free and bound) antiserum |
- Drying
- Staining, Destaining and final drying
2.3.6 Data analysis
STATS- WHAT WAS USED, WHY IT WAS PERFORMED AND WHAT THE TEST RELIED ON.
As the purpose of this project was not to replace one method with another or assess the immunoturbidimetric method as a screening test, many statistical tools such as a Bland Altman plot and regression analysis were not performed.
3.0 Results:
In the past S.U.H had carried out electrophoresis techniques, however this was discontinued in February 2013 due to the number of requests and staffing issues. With the arrival of new equipment, S.U.H recommenced electrophoresis testing again on August 10th 2016.
3.1 Retrospective Search
A retrospective search of the Sebia capillary zone electrophoresis (CZE) database in S.U.H was carried out from 10/08/2016-24/03/2017 on all patients that had SPE performed. Where patients had a paraprotein band identified and its concentration measured by the SPE, the results of the corresponding isotype which was measured by immunoturbidimetry on the Roche Cobas 8000 series c702 analyser, was then found on the laboratory information system (LIS). These patients had monoclonal bands of IgG, IgA and IgM at a variety of concentrations ranging from 1.3g/l to 71.95g/l. From this data scatter plots for the immunoglobulin isotypes IgG, IgA and IgM were constructed. Results obtained are displayed below in Figures 6, 7 and 8. From this retrospective search, it was evident that there was variation between many of the results, especially at higher levels reported by immunoturbidimetric. In a minority of these cases, these discrepancies cannot be accounted for by assay imprecision (Sinclair et al., 1990). This warranted further investigation into a possible solution to these discrepancies. ?R2 values comment
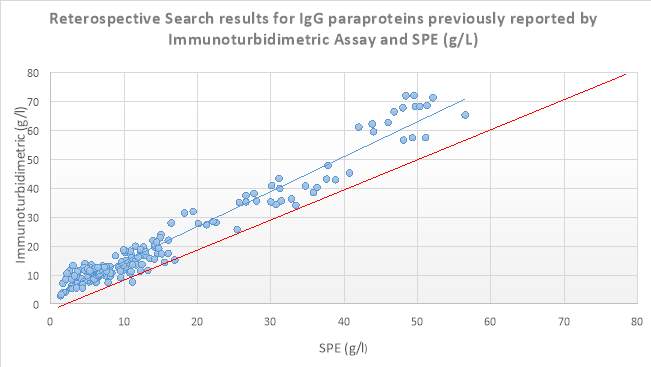
Figure 6 8 Scatter plot displaying results obtained from the retrospective search carried out on IgG isotype paraproteins quantitated by SPE and Immunoturbidimetric assay (g/L). The blue line depicts the trendline, while the red line depicts the ideal line.
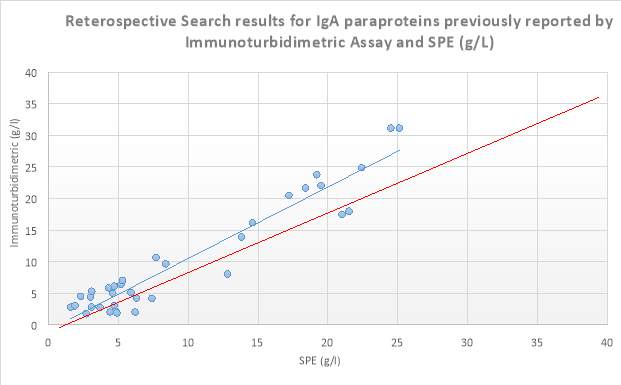
Figure 7 8 Scatter plot displaying results obtained from the retrospective search carried out on IgA isotype paraproteins quantitated by SPE and Immunoturbidimetric assay (g/L). The blue line depicts the trendline, while the red line depicts the ideal line.
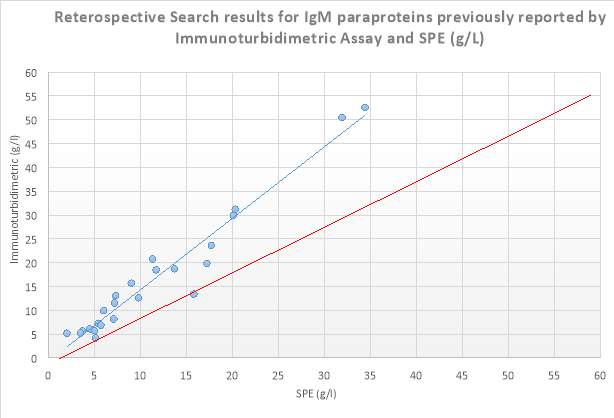
Figure 8 Scatter plot displaying results obtained from the retrospective search carried out on IgM isotype paraproteins quantitated by SPE and Immunoturbidimetric assay (g/L). The blue line depicts the trendline, while the red line depicts the ideal line.
3.2 Reanalysis and Dilution of samples
A total of 75 sera samples showing either an IgG (n= ), IgA (n=) or IgM (n=) that were previously ordered for immunoglobulins and SPE and found to be paraprotein positive were collected for further investigation. Reanalysis of these samples for Total protein, and immunoglobulins was carried out. In cases where the paraprotein isotype was greater than the reference range, these samples were then manually diluted so as to bring the level into the reference range (linear range) of the analytes (where it is believed to give a more accurate reading) and multiplied by the relevant dilution factor. The SPE result (previously reported on the sample was obtained from the LIS for comparison purposes). Results obtained are displayed below (See Appendix E for raw data).
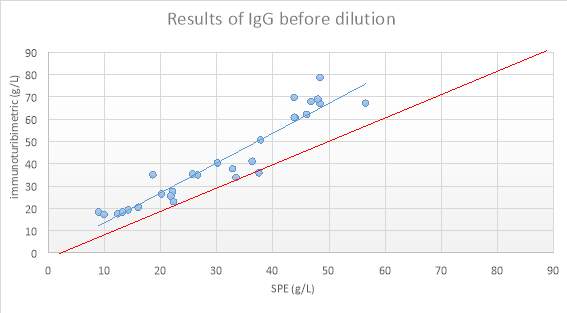

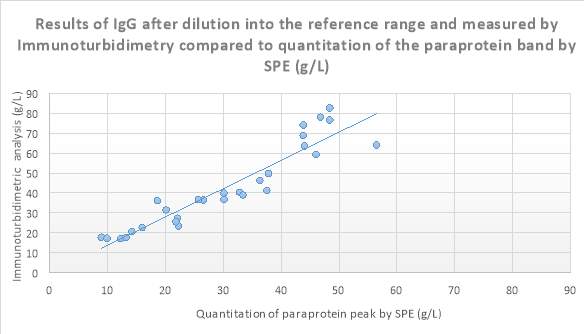 Figure 9: Scatter plot showing results obtained
Figure 10 Scatter plot showing results of IgG after dilution into the reference range and measured by Immunoturbidimetry (g/L) compared to quantitation of the paraprotein band by SPE (g/L).
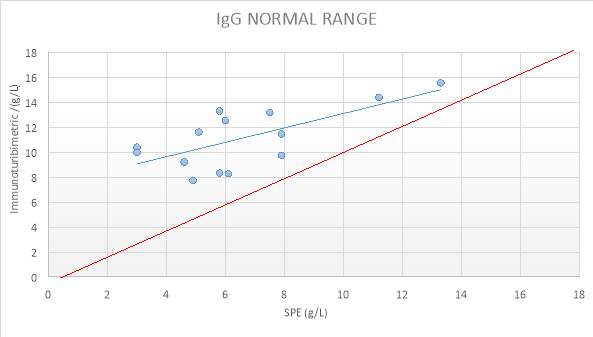
Figure 11: IgG NORMAL RANGE SAMPLES
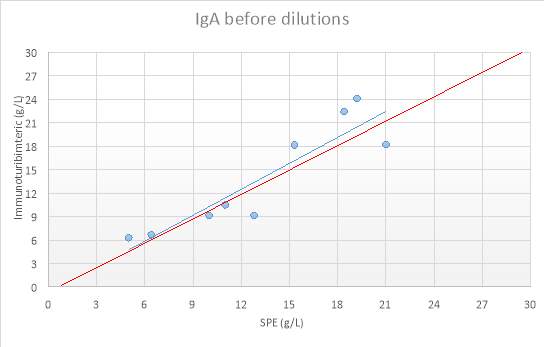
Figure 12:IgA before dilutions
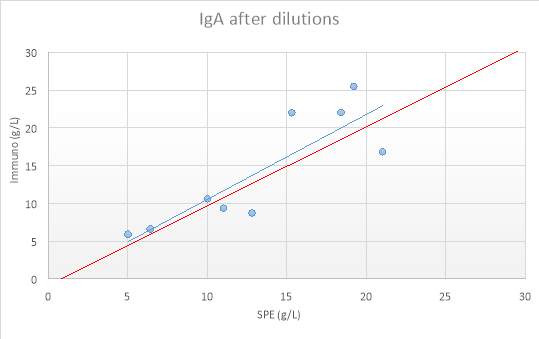
Figure 13: IgA after dilutions
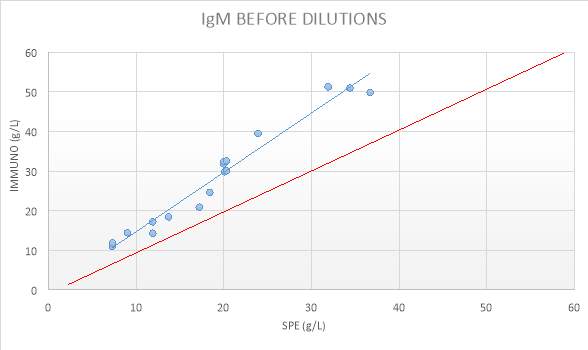
Figure 14: IgM BEFORE DILUTIONS
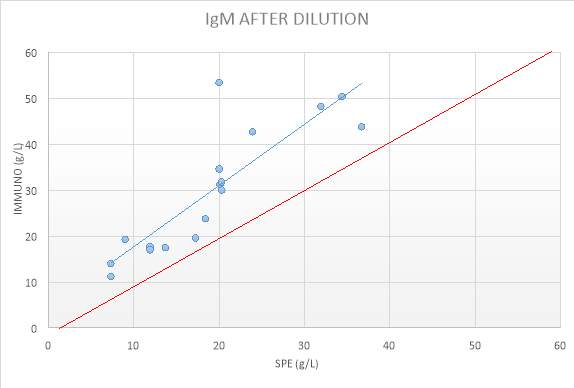
Figure 15: IgM RESULTS AFTER DILUTIONS
Table: Summary of R2 values obtained from results displayed above.
| Paraprotein isotype | IgG | IgA | IgM |
| R2 value obtained from the retrospective search | 0.9548 | 0.914 | 0.9479 |
| R2 value before dilutions were carried out | 0.897 | 0.8283 | 0.9604 |
| R2 value after dilutions were carried out | 0.8729 | 0.7246 | 0.7368 |
| Samples that were not diluted as they were inside the normal range | 0.4668 | N/A | N/A |
Note: R2 should be close to 1.
Paired T-Tests were performed on IgG, IgA and IgM results of the analytes after dilution into the reference range, projected (calculated) recovery and the actual recovery of the analytes (See Appendix for Raw data). Table below displays a summary of results obtained.
Table 7:
| IgG | IgA | IgM | |
| Mean difference | 0.458 | -0.0014 | 0.0505 |
| P values | 0.00604 | 0.988 | 0.720735 |
3.3 SPE Results
Of these 75 sera samples, 24 were chosen for SPE to demonstrate how the monoclonal bands can be quantified with reasonable accuracy with experience and with the aid of immunotyping (in some cases).
We determined the concentrations of each isotype that fitted a linear relationship. IgA had the best correspondence (slope 0.92, 95% CI 0.87–1.02), whereas IgM demonstrated a systematic bias of higher values by NEPH (slope 1.80, 95% CI 1.68–1.92). IgG demonstrated a nonlinear relationship between SPEP and NEPH, with a linear region <19.2 g/L having a slope of 0.83 (95% CI 0.79–0.89) and a second linear region having a slope of 1.47 (95% CI 1.39–1.53) at higher concentrations. Dilutions of high-concentration IgG monoclonal proteins were linear by NEPH and nonlinear by SPEP. (very similar study done by (Murray et al., 2009).
We did not subdivide the proteins according to light chain isotype (Murray et al., 2009).
4.0 Discussion:
Intro:
As discussed previously, the quantity of the paraprotein band is considered a good surrogate marker for monitoring the population size of clonal plasma cells. Hence, accurate quantitation is of utmost importance in following the progression of disease in cases of plasma cell dyscrasias. Many physicians use immunoglobulin quantitation from SPE.
Discuss controls first.
The controls used in each assay were all within defined target ranges (within 2 standard deviations) (See Appendix). All test results are considered valid.
Discuss results
The discrepancy seem to become more pronounced at higher immunoglobulin concentrations.
It appears that some samples are well correlated while others are not. A lack of significant correlation was not necessarily associated only with the overestimation of immunoglobulin concentration. In patient X there was reasonable agreement between paraprotein and immunoglobulin concentration, while in patient Y there was significant correlation between methods despite overestimation of corresponding immunoglobulin.
We found that manual dilution of the serum samples showed no marked improvement in correlation and hence would not be a solution to this problem.
With an increase of the paraprotein concentration, there seems to be an increased risk of the potential erroneous results also increases (Jelinek and Bachmann, 2014).
The most marked effects of non-linearity occurs at very high paraprotein concentrations, where dilution of samples often resulted in the final levels greater than the initial sample (without dilution, as the analyser would have reported it).
Advantages and Disadvantages of SPE & immunoturbidimetry method for the quantitation of paraprotein bands.
Whilst the measurement of a paraprotein band from SPE scan in most cases is the accepted way of monitoring the progress of disease, the immunoglobulins measurement can also give an indication of the tumour burden. Whilst both methods offer advantages, there are also many disadvantages that preclude either method from being the ideal choice.
One of the advantages of the initial measurement of the total concentration of IgG, IgA and IgM in serum by immunochemical methods is that it can reveal an elevation of a specific immunoglobulin isotype that is suggestive of the presence of a paraprotein. However, one of the main problems with immunoturbidimetry measurements is that these measurements also include incalculable amounts of polyclonal immunoglobulins of a particular isotype. Because of this, unless there is notable immunoparesis, it is difficult to ascertain how much of the measured immunoglobulin is truly monoclonal in origin. Additionally a marked decrease in immunoglobulins of all classes may indicate a free light chain-producing myeloma measured by immunoturbidimetry. The quantities measured by immunoturbidimetry of IgG, IgA and IgM can give extra information when classifying patients and have particular importance in demonstrating immunoparesis where all or some of the non-monoclonal immunoglobulins are reduced. Quantitation of paraproteins using this method maybe distorted the more the paraprotein declines and normal clones recover after therapy. (?2 pics one before treatment, on after and corresponding Ig level.)
One of the main disadvantages of reporting immunoglobulins in advance of SPE reports is that it may be taken as an indication of tumour burden, which in some cases can give a misleading picture of the progression of disease.
SCAN
For many of the large paraproteins where there is also suppression of the polyclonal immunoglobulins, the paraprotein measurement is only minimally contaminated with co-migrating polyclonal immunoglobulins and making off (?delineating) the area of the band tends to be a straightforward process. (example) paraprotein measurements have been improved by the use od CZE. Here, IT can be used to employ immunsubtraction where a region of interest can be selected, example in the beta region and thus gives an indication of the amount of this area that is paraprotein versus normal beta protein. (give example of large beta and small beta-migrating immunoglobulin).
Disadvantages include the fact that the actual measurement of the peak in the scan remains a subjective methods, espically for the smaller paraproteins and those migrating in the beta region. The latter, as discussed earlier is helped with the aid of IT. Difficulty in measurement also arises in cases where a paraprotein is present in a background of hypergamma… (show examples of small PP and band in polyclonal background) The actual measurement of the paraprotein peak remains a subjective method especially for the smaller paraproteins and those migrating in the beta region.
Ad of immunoturbidimetric -It is important to be aware, although not quantified in S.U.H, it is rare but possible to see a monoclonal IgD and IgE, most likely associated with a hypogammaglobulinemia. (due to immunoparesis of IgG which is normally in the highest amount.)
SPE has the advantage of being capable of separating paraprotein from polyclonal immunoglobulins.
Paraprotein migrating with a normal protein fraction eg in beta region, its concentration is generally reported as the total band concentration i.e. band and normal fraction. Sometimes the immunochemical result is reported only as an alternative to the scanned paraprotein concentration.
Considering the limitations of both electrophoresis and immunoturbidimetric methods, recommendations that the paraprotein should be quantified by a combination of the electrophoretogram and immunoturbidimetric methods. The preferred method for paraprotein monitoring is by the electrophoretogram, unless accurate quantitation of the paraprotein cannot be obtained using the electrophoretogram (see examples). The rationale for this recommendation is that the electrophoretogram specifically measures the monoclonal immunoglobulin of interest. In contrast, the immunoturbidimetric can measure both polyclonal and monoclonal immunoglobulins, this specificity is particularly apparent when a low-level paraprotein exists in the presence of polyclonal immunoglobulins. The clinical importance of having both electrophoregrams and immunoturbidimetric assay quantitation of paraproteins is highlighted in health systems where therapy is funded based on the response to treatment. This occurs in both Australia and the UK. Drugs such as bortezomib etc.… are often used in the treatment of monoclonal gammopathies. Some of these therapies are only funded for patients with myeloma who achieve a partial remission after four cycles of therapy. They recommend a decline of at least 25% in the serum M-spike and at least 50% in the urine M-spike to document a minimal response to therapy. (Keren, 2003).
The consensus is that immunochemical methods measure both paraprotein and non-paraprotein immunoglobulins, whereas SPE can selectively estimate the monoclonal immunoglobulin. In this research project, in certain sera samples the paraprotein measured may be accurate when compared with the SPE result for example in cases where the paraprotein band is amongst a polyclonal region. However at certain higher levels, the immunoglobulin isotype measured is highly overestimated by immunoturbidimetric method where there is very little other immunoglobulins are seen by SPE to be present. (Riches et al., 1991).
Quantitation in the scan is done by manually delineating the boundary of the paraprotein. Advantage here is separating the paraprotein from background immunoglobulins. When peaks are identified the operator manually ‘gates’ the area under the curve representing the peak.
Similar studies done
Many studies have identified a significant bias between SPE and immunoturbidimetry. Sinclair et al. reported significant correlations between these two methods for all three major immunoglobulin classes (1990). It was also noted that the agreement between the methods was patient dependent, serial samples on the same patient by immunochemical methods gave directly comparable results (Sinclair et al., 1990). A small minority of samples showed quantitation by SPE higher produced higher results than immunoturbidimetry (Sinclair et al., 1990). Some researchers have found an acceptable level of agreement between SPE and immunoturbidimetry assays in the measurement of IgG paraproteins migrating in the gamma region. However, results obtained for IgG, IgA and IgM isotypes by CZE and immunoturbidimetry shows variable correlation (Keren, 2003).
IgM paraproteins gave varied results in serial samples, even if the same method and antiserum batch are used (Sinclair et al., 1990).
A study done by Schreiber et al. (may need reference from (Keren, 2003)) compared the concentration of the gamma globulin fractions (by SPE) to the total sum of immunoglobulins (measured by immunochemical method). IgG, IgM and half of IgA (they assumed half of IgA migrated in the beta region). The correlation coefficient between the two techniques was good, with a value of 0.95.
A similar study done by Chang et al, (may need reference from (Keren, 2003)) recommended diluting sera according to the total protein concentration in an attempt to improve the linearity. Sera with a total protein concentration of 91-114g/L were diluted 1:10, whereas sera with a total protein concentration of 115g/L or greater were diluted 1:20.
Murray et al, (2009) performed an in depth study of data from 2,845 patients with a gamma migrating paraprotein, alongside their immunoturbidimetry results. Their findings revealed different correlations for each of the 3 isotypes. IgG paraprotein ˂19.2g/L had a linear region with a slope of 0.83, but higher concentration demonstrated a linear region with a slope of 1.47. IgM has a systematic bias of higher values by immunoturbidimetry. Tate et al. also documented extensive variation in results reported by SPE and Immunochemical methods across New Zealand and Australia (2012).
How results obtained compare with previous researchers/ Inconsistent results.
Findings from this research project differ/ are similar …
Co-migrating paraproteins- it would be helpful to define the most clinically valid estimate of paraprotein concentration eg either band value, with or without subtraction of underlying proteins or the paraprotein type immunoglobulin result (IT).
A general finding of many researchers has been the tendency for immunoturbidimetric methods to give higher results than quantitation of the paraprotein by SPE in particular at high paraprotein concentrations (Riches et al., 1991).
This overestimation has been previously remarkably noticed with IgM paraproteins. In some extreme cases the measured immunoglobulins often exceed the total calculated globulin (total protein – albumin) or even the measured total protein (Riches et al., 1991).
Total protein, albumin and paraproteins all require quantitative reporting. In cases of monoclonal gammopathies the quantitation of the paraprotein is of primary interest to the clinicians, however results of the other protein fractions can also be of use in monitoring of patients. – intro? Lit review?
Tate et al., outlines many recommendations for the quantitative reporting of SPE (2012). Some of which include; Total Protein, Albumin and, if present, the paraprotein are the minimal fields which should be quantified and reported.
Paraprotein quantitation provides a good indication of the size of the population of malignant cells in an individual patient.
The delineation of the paraprotein peak by perpendicular drop on the CZE should be made with reference to how it was previously delineated. The minimum concentration for the quantitation of paraprotein bands is 1g/L. If a band is present but below 1g/L a comment stating ‘bands are too small to quantify’ replaces the paraprotein concentration. (Tate et al., 2012).
The discrepancy between immunoturbidimetric methods and SPE methods of quantifying paraproteins may be due to the dilutional properties of monoclonal immunoglobulins or the presence of other polyclonal immunoglobulins of the same class as the paraprotein. Immunoturbidimetric methods measure both the monoclonal and polyclonal immunoglobulins whereas SPE is more specific for the paraprotein unless hidden by other co-migrating proteins, e.g. in alpha and beta regions or by fibrinogen. The most notably differences have been reported in IgM, this most likely due to the pentameric structure of IgM forming increased antigen-antibody complexes with increased light scatter patterns.
Studies have found a closer correlation between electrophoretogram and immunoturbidimetric analysis in IgA paraprotein measurement. While other studies have found discrepancies of approximately 25% or more for paraprotein concentrations greater than 40g/L.
The assessment of partial remission is straightforward for the majority of paraproteins in the gamma region, however patients with a low-level paraprotein in the beta region may have their response underestimated by quantitation by electrophoretogram therefore implications of patient’s management may be effected.
After treatment, for example if the beta + paraprotein was 16g/L, and total IgA by immunoturbidimetric was 9g/L. in this case the inclusion of the normal beta region proteins in the CZE measurement has prevented accurate response to treatment assessment. The use of immunoturbidimetric assay solely where paraproteins results are ‘less’ spurious at lower concentrations could offer a solution to this. Using immunoturbidimetric results would enable the patient to continue to receive funding for treatment, whereas the results from the scan would not. Using scan and immuno. method in conjunction may allow the patient to access treatment.
Tate et al. outlines recommendations for the quantification of serum paraproteins. Paraproteins in the gamma region should be quantified by CZE measurement in g/L. Paraproteins less than 1g/L should not be quantified and reported with a comment ‘too small to quantify’. Paraproteins that are only visible by immunofixation technique should not be quantfied, and a comment should follow stating for example ‘IgM lambda paraprotein only visible by immunofixation’ and not quantity given here. In scenarios where the paraprotein is in the alpha or beta regions, the total protein in the for example beta region should be reported with a comment stating ‘beta + paraprotein’. In cases where there is a significant amount of beta proteins the quantitation is often not given and a comment stating ‘??Paraprotein overlying the beta region and cannot be accurately quantified’. In this scenario, quantification of total IgG, IgA and IgM by immunoturbidimetric methods provides an approximate concentration of the paraprotein. These results may be overestimated due to non-linearity at higher paraprotein concentrations; however, they are useful in cases where the paraprotein cannot be quantified by electrophoretogram.
Tate et al. recommends that ‘all laboratories should perform a comparison of their quantitative electrophoresis and immunochemical method for monoclonal IgG, IgA and IgM paraproteins to determine the upper limit of agreement for monoclonal immunoglobulins measured by immunochemical methods (2012).
In patients with a monoclonal gammopathy and paraproteins in the non-gamma region, laboratories should report both the quantitation by electrophoregram and immunoturbidimetric method to facilitate disease monitoring, according to a laboratories upper limit of agreement for paraprotein measurement.
Medical Scientists, which are responsible for reviewing, interpreting and reporting protein electrophoresis results, require a high level of competency and expertise. Continual professional development should be encouraged throughout laboratories (Tate et al., 2012).
The Medical Scientist reporting results should be appropriately trained before reporting electrophoresis results (Tate et al., 2012). In S.U.H, a second Medical Scientist always validates / re-reads the ‘batch’ before the final reporting of results. Any difficult or ubiquitous samples/ results should be conferred at this point by a senior medical scientist and communication with the consultant hematologist/ clinician should be encouraged. Repeat testing should be requested or additional clinical history.
Samples with a paraprotein band require descriptive comments and often individual commenting, depending upon patient demographics and clinical history. In S.U.H first time monoclonal gammopathy patients GP also receive an information leaflet with further referral / investigations information (See Appendix). The inclusion of the patient history/ clinical presentation is important, in particular in patients presenting for first time protein electrophoresis examination by the laboratory (Tate et al., 2012).
The working party recommends that the reporting of protein electrophoresis in done in a suitable format to allow cumulative viewing of paraprotein trends, and to easily demonstrate the location of known paraproteins in previous patient samples thus facilitating patient management (Tate et al., 2012).
Factors affecting paraprotein measurement
Certain differences between immunoturbidimetry and SPE may be explainable; However larger discrepancies in the some cases can only be explained by gross overestimation of paraprotein concentration by immunoturbidimetry.
Discrepancies in the quantitation of paraproteins, by CZE and immunoturbidimetric assays often are known to occur in patients with very high or very low serum immunoglobulin levels (Uljon et al., 2013). Interference in routine immunoturbidimetric assays may be caused by aberrant immunoglobulins expressed in monoclonal gammopathies (Jelinek and Bachmann, 2014).
Analytical variability is often related to the type of antisera and/or calibrator used in the immunoturbidimetric assay is often a factor. In some patient’s serum, the paraprotein reacts oddly with the polyclonal antisera used to measure the total immunoglobulin isotype, resulting in mainly falsely elevated results, or in a minority of cases, lower values when compared to measurement by the electrophoretogram. Paraprotein interferences vary from sample-to-sample and depends on the unique characteristics and structural changes of the paraprotein under particular assay conditions. The electrophoretic quantification only includes the paraprotein, while immunoglobulin measurement includes both normal polyclonal and abnormal monoclonal immunoglobulins.
Reagents used in the immunoturbidimetric assays for immunoglobulin quantification are optimized to recognize the diverse constellation of circulating polyclonal immunoglobulins found in other physiological states. Monoclonal gammopathies are known to cause unexpected behaviours in routine immunoassay methods, often resulting in erroneously high or low immunoglobulin measurements (Jelinek and Bachmann, 2014).
As well as analytical variability, there is individual biologic variability in the quantitation of paraproteins in serum and urine. This limits the ability to reproduce similar results on the same patient’s sample, leading to sample-sample variation. The Roche kit insert for immunoglobulins explains that ‘paraproteins secreted in these patients may differ from the immunoglobulins of polyclonal origin by; amino acid composition and size therefore impairing the binding to antibody hence impairing accurate quantitation due to an excess of antigen below the limits determined with immunoglobulins of polyclonal origin. Antigen excess may be detected after appropriate dilution of such samples’ (Roche 2015).
In the samples analysed in this project, the immunoturbidimetric results were mainly reading higher than the SPE results, however falsely lower results have been reported in many cases. When there is a large amount of paraprotein in the sample, immunoturbidimetry techniques may provide misleading information due to antigen excess, this phenomenon is known as the prozone effect. An excessive amount of antigen can inhibit stable antigen-antibody complex formation. The subsequent decrease in detected absorbance leads to a falsely low measured concentration. Dilutions of the sample can remove the excess antigen and allow appropriate formation of the antigen-antibody complex, resulting in an accurate measurement. Jelinek and Bachmann found that repeat testing with 1:100 dilution found results which were consistent with the SPE results and the patients overall clinical presentation (2014).
For many of the large paraproteins where there is also suppression of the polyclonal immunoglobulins, the paraprotein measurement is only minimally contaminated with co-migrating polyclonal immunoglobulins. When the paraprotein is lower and within an area of polyclonal immunoglobulins, then the estimation of the band has to include some co-migrating polyclonal immunoglobulin, therefore gives a falsely increased measurement of the paraprotein. The majority of paraproteins migrate in the gamma region so measurement of the paraprotein in the gamma region includes polyclonal immunoglobulins that are present at the same position. Polyclonal immunoglobulins are often suppressed (immunoparesis) in monoclonal gammopathies; this makes the measurement using perpendicular drop both accurate and reproducible to provide a useful estimate of tumour burden (Keren and Schroeder, 2016). However, in cases of small paraprotein bands , the presence of co-migrating polyclonal immunoglobulins by the perpendicular drop measurement creates a significant overestimation of the paraprotein (Keren and Schroeder, 2016). Despite advance in technologies and equipment used for SPE, the measurement of the paraprotein remains a subjective method with suboptimal measurements on small paraproteins and those that migrate in the beta region. (Keren and Schroeder, 2016).
It is thought that the expression of large concentrations of a single clone causes incomplete reaction of the reagent antibodies or atypical epitopes, leading to inaccurate measurements (Jelinek and Bachmann, 2014). The overestimation of paraproteins may be due to the presence of immune complexes for example rheumatoid factor (Riches et al., 1991).
Considerable discrepancies have been particularly noted with IgM isotype paraproteins. This may be due to accelerated formation of immune complexes, due to the size and multimeric nature of IgM. Quantitation of IgM paraprotein by SPE can frequently pose problems, specifically if the IgM paraprotein is obscured by background polyclonal immunoglobulins (Uljon et al., 2013). Cryoglobulins (often effects approx. 20% of WM patients) these samples require to be analysed at higher temperatures to prevent precipitation of the IgM paraprotein (Uljon et al., 2013).
The quantities of IgG, IgA and IgM are still useful and should be determined as these results can give extra information when classifying patients, but have particular importance in demonstrating immunoparesis, where all or some of the non-monoclonal immunoglobulins are reduced.
IgA and IgM paraproteins are more likely than IgG paraproteins to run in the beta region of the gel, which contains normal serum proteins that complicate quantitation. (there is no reliable way to quantitate the paraprotein peak in the beta region, (Uljon et al., 2013) in these cases the immunoglobulin measurement by immunoturbidimetric assay may be useful and give an indication of the tumour burden.
Importance of measuring immunoglobulins in MM patients with a high IgA, total gamma region may look normal as IgG is decreased but IgA is increased, patient presents with hypogammaglobulinemia. Therefore, need to do immunofixation on all hypogamma patients.
It is important that Medical Scientists remain attentive and aware of potential discrepant results in patients with paraprotein bands. The Medical Scientist should take appropriate action to prevent the release of erroneous results (Jelinek and Bachmann, 2014). Medical Scientists should also review the clinical history of the patient and offer an appropriate guidance to clinicians (Keren, 2003).
Limitations of the study
Due to time restrictions of this research project, the study design could be improved in many areas. The sample size used was dependent on the amount of samples that were submitted for testing during the period of the project. A study over a longer period could include a greater number/variety of samples. In particular, IgA and IgM sample numbers were much lower than IgG.
Dilutions on-board the analyser were initially carried out on a selection of samples, but as an initial background readings were taken before dilution and the reaction curves were then outside the expected values, these results had a prozone errors, so these results were not used in the study. Instead manual dilutions were performed on all samples; and as with all manual techniques, the potential for errors exists. Although the study design has limitations, many findings are relevant.
Current approach/ recommendations in local hospitals
A recent study carried out by Hooley et al. for Cork University Hospital, submitted questionnaires directed to GP service users to assess their understanding of immunoglobulins and SPE results (2016). It was identified immunoglobulin testing as an area that was poorly understood by GP’s and was found to be often inappropriately requested. Their findings suggest that GP’s understanding of protein electrophoresis can be improved with the induction of detailed guidelines, interpretive comments and educational messages. GP’s have noticed an improvement in the quality of the electrophoresis report making it easy to interpret. This also highlights the future role for Medical Scientists in the educating of GP’s regarding the appropriate use of specialized tests (Hooley et al., 2016).
Current practice at Mater Private Hospital, Dublin is that immunoglobulin results measured by immunochemical method are not released until compared with protein electrophoresis results (Mater Private Hospital, 2016). According to guidelines set out and followed by the Immunology laboratory at St James Hospital, Dublin state that ‘Immunoglobulin isotypes should not be used to monitor a paraprotein as there may be background polyclonal immunoglobulin, therefore electrophoresis is used as a tool to monitor paraprotein concentration (2016). These guidelines also state that ‘electrophoresis is required to distinguish monoclonal from polyclonal IgG production, all samples for IgG levels also have electrophoresis performed.’ (St James Hospital, 2016).
Galway University Hospital states; ‘The technique used to quantitate monoclonal bands is different to that used to measure the total immunoglobulins (IgG, IgA, IgM) and results are not directly comparable’.
The UK national quality assessment scheme (NEQAS) has addressed recurring problems in the quantitation of paraprotein by immunochemical methods (Sinclair et al., 1990). NEQAS does not score clinical laboratories on their quantitation of immunoglobulin isotype using immunochemical methods when there is a paraprotein of that isotype.
Tate et al, issued recommendations for the standardization of protein electrophoresis which covered the areas such as analytical requirements, detection systems, quantification of serum total protein and albumin, the fractionation into alpha-1, alpha-2, beta and gamma fractions, and of particular interest in this project, paraprotein quantification and characterization, and laboratory performance, expertise and staffing. The recommendations also include general interpretive commenting and commenting for specimens with paraproteins and small bands together with illustrative examples of reports. (Tate et al., 2012).
The ‘All Wales Clinical Biochemistry Audit Group’ recommend that only the non-paraprotein serum immunoglobulins results should be reported, as a means of demonstrating immunoparesis. Consistent with this approx. 50% of respondents withheld the paraprotein-type immunoglobulin result when the band was quantified. On the other hand, Durie et al. recommended the use of the serum immunoglobulin result of the paraprotein type in defined circumstances, particularly for IgA, low concentration paraproteins for the purpose of aiding paraprotein quantification. The same measurement type must be used consistently for a particular patient. Given the well known risk of misleading results it seems prudent to append a disclaimer to the immunoglobulin results.
All laboratory reports, in particular the protein electrophoresis report, should deliver full, clear and cumulative patient results to the clinician. As protein electrophoresis is a specialized test, it requires individualized reporting from Medical Scientists. The clinician must be capable of interpreting the comments made on a protein electrophoresis report. The main interest of the clinician is the presence or absence of a paraprotein, and if present: its isotype and concentration.
Further study /areas of investigation.
There are many areas of SPE and immunoglobulin measurement, which could possibly be improved, with continuous updating of software and the addition of advanced technology. The Sebia Phoresis software, used by the Medical Scientist, could potentially be installed on the Consultant Haematologist computer; and training in interpretation of results provided. Therefore, in difficult cases or cases where there is a notable discrepancy between the immunoglobulin result and the paraprotein quantitation, the consultant may form a better understanding of the true clinical picture of the patient. At the 2015 American Association for Clinical Chemistry meeting, Wunsch proposed to extend the clinical utility of CZE. A quantitative immunosubtraction method on CZE that subtracts the paraprotein peak from the electrophoretogram curve and mathematically calculates the quantity of the beta or gamma regions. This allows the quantification of paraproteins, even when it overlies normal plasma proteins. The measurement of the peak areas helps in the interpretation of abnormal results (Wunsch, 2015).
N.B THAT SPE SAMPLES SHOULD HAVE BEEN DILUTED ALSO TO DIRECTLY COMPARE… IF PARAPROTEIN BADN IS DILUTED OUT (ALMOST), THEN THE HIGH READING MUST BE POLYCLONAL INTERFERANCE.
Recommendations to S.U.H
A consistent approach is required by both laboratories and clinicians so that the paraprotein concentration is monitored on an individual basis using the same method, this ensures that results accurately monitors the paraprotein concentration and that significant increases or decreases are due to response to treatment rather than method of measurement and facilitates long term cumulative review of the progress of a patient’s disease.
As the local protocol stands, SPE and immunoglobulins are always ordered together, so if a clinician orders either, the other is automatically carried out. As explained from the results presented, because there is a potential for erroneous results when immunoglobulins are reported in isolation, it is recommended that immunoglobulins and SPE results be reported together (Tate et al., 2012). Laboratories equipped for both SPE and Immunoturbidimetric assays should use both methods for IgG and IgA paraprotein measurement (Sinclair et al., 1990). Immunoturbidimetric assay is suitable for IgM paraprotein measurement according to Sinclair et al. and SPE is the method of choice (1990).
If immunoglobulin measurement results are to be reported before SPE results are available, the diagnostic laboratories should consider at a minimum an interpretive comment to accompany these potentially unreliable results at a minimum. Example:
If the immunoglobulin result is greater than the globulin fraction (Total (Protein – Albumin), erroneous results should be held back by the LIS at validation.
However, laboratories should consider holding back immunoglobulin results (perhaps results that fall outside the reference range) in a preliminary file so that they can and be validated by the Medical Scientist in conjunction with SPE findings. There are both pros and cons to holding these results. It may be a disadvantage for patient management if a preliminary diagnosis could be made and treatment began when the immunoglobulin results are available. However, clinicians should not be basing diagnosis or commence treatment on the basis. Therefore is it of any clinical utility to release immunoglobulin results before SPE results are available. Another consideration for the laboratory if they are to retain immunoglobulin results, is that clinicians must informed of the change in protocol and the reasoning behind it.
One possibility could also be to increase the turnaround time of SPE results so that both results are being released on the same day. This could avoid delay in the reported patient results to clinicians and not alter patient management. This may not be an option for many laboratories due to the work load of the SPE rota and staffing limitations.
Their overall recommendation is that clinicians should not alternate between immunochemical assay and electropherogram measurements (Keren, 2003).
Tate et al. states that overestimated values should not be reported (2012). Tate et al. recommends that all laboratories reporting protein electrophoresis should have an educational system in place for requesting clinicians (2012).
5.0 Conclusion
Each laboratory should investigate the overestimation and assess their protocol on the reporting of these results (Tate et al.,2012)
Although both SPE and immunoturbidimetric assays are well-established laboratory techniques, the reporting of results varies greatly between methods used, laboratories, Medical Scientist interpretation. Systems should be put in place to reduce both variation between methods and laboratories and the risk of misinterpretation of results, which affects patient management. A standardised approach to the analysis, interpretation and reporting of SPE and immunoglobulin results should be put in place.
It is important that immunoassays such as the immunoturbidimetric assay are used in conjunction with SPE. Immunoassays measure all the heavy and light chain isotype class. Therefore, if there is a normal amount of IgG in a patient’s sample who also had a small paraprotein, the immunoassay of the total IgG may potentially overestimate the paraprotein. In addition, if there are a large amount of paraprotein present in the patients sample immunoturbidimetric assays may also overestimate the paraprotein due to the type of antisera and calibrators used in the assay (Keren, 2003).
References:
Aksungar, F.B., Ayer, M., Serteser, M., Coskun, A. and Unsal, I. (2014). A triclonal gammopathy in a relapsing multiple myeloma patient, detected by immunosubtraction method. Annals of Clinical Biochemistry. [Online] 51 (5), 606-610. Available from: http://gmit.summon.serialssolutions.com/2.0.0/link/0/eLvHCXMwjV1LT8JAEN4YTNSLUXyAj2RPniy0-2yPBCVeOEhQvDX7qiGBQngc-Pfu0FYIXrxvN83s7szszvfNhxAlrTA48AlM6NAoQyyR2gpFY0tVYiiT3kH6oAT05_cXPhjFn19stIPqlPZctgBk5f9v67rhrMPbdLssObaLvIQSEJsjMZC5jomgFAB-w0H_1y-TipASsgCG74qWf2bYC0d7-K5tyOldoPMyV8SdYnEv0ZHL6-i0W0m01dFJv6yMXyHbwdBrfwKJNf5WfneB1vAGj3OsMBBW5vAogCv8IJ5u3GQ2Vbjsq_qMrYNygrNY-4-ANDJbrvVqUfAecCE0fY0-eq_D7ltQKigEc2jdFkhhNNeJj9Ghy7SkmeCZkoRqwqwgVotQ2tjnFHApizmPNZdKCRaZMCNKxobeoFo-y10DYRYppxOjtNKcUaV0ZHhkqCQgeJUJ2kS3hcnSedEmIyWM-ttZEjbRE9gwrRYzjaoW4wdWv_vvwHt05vMWVkC9HlBttVi7Rx9Sp-PVD7S_rlg.
Boyle, E.M., Salomon.Lejeune, Julie.Fouquet, Guillemette.Guidez, Stephanie. Bonnet, Sarah., Houria Debarri1, D., Helene.Dulery, Remy. Gay, Julie.Hennache, Bernadette.Onraed, Brigitte.Faucompré, Jean-Luc.Schraen, Suzanna. Facon, Thierry.Avet-Loiseau, Hervé.Chevret, Sylvie. and Leblond, V.H., Stephen.Leleu, Xavier. (2016). IgM kappa and IgM lambda measurements for the assessment of patients with Waldenstrӧm’s
macroglobulinaemia, [Online]. Available from: http://clincancerres.aacrjournals.org/content/clincanres/early/2016/05/11/1078-0432.CCR-15-2899.full.pdf [Accessed 5th April].
C., W. (2015). Extending capillary zone electrophoresis (CZE) of serum proteins. Poster Annual AACC meeting:
Enitza, G. and Sadovsky, R. (1999). Multiple Myeloma: Recognition and Management – American Family Physician.
Fentress, D.S., Orrico, L.A., Kruspe, M., Kristi S. and Laber, D.A. (2006). Multiple Myeloma. Available from: http://turner-white.com/pdf/hp_may06_myeloma.pdf [Accessed: 20th March 2017].
Hoffbrand, V. and Moss, P. (2016). Hoofbrand’s Essential Haematology.: Wiley Blackwell.
Jelinek, A.G. and Bachmann, L.M. (2014). Unexpected test results in a patient with multiple myeloma. Clinical chemistry, 60 (11), 1375-1378.
Kasi, P.M., Ansell, S.M. and Gertz, M.A. (2015). Waldenström macroglobulinemia. Clinical advances in hematology & oncology : H&O, 13 (1), 56.
Keren, D. (2003). Protein Electrophoresis in Clinical Diagnosis.
Keren, D.F. and Schroeder, L. (2016). Challenges of measuring monoclonal proteins in serum. Clin Chem Lab Med, 54 (6), Jun 01, 947-61.
Kyle, R.A. and Rajkumar, S.V. (2008). Multiple myeloma. Blood, 111 (6), 2962-2972.
Leleu, X., Roccaro, A.M., Moreau, A.-S., Dupire, S., Robu, D., Gay, J., Hatjiharissi, E., Burwik, N. and Ghobrial, I.M. (2008). Waldenstrom Macroglobulinemia. Cancer Letters, 270 (1), 95-107.
Leung, N., Bridoux, F., Hutchison, C.A., Nasr, S.H., Cockwell, P., Fermand, J.-P., Dispenzieri, A., Song, K.W., Kyle, R.A., International Kidney and Monoclonal Gammopathy Research, G. and on behalf of the International Kidney and Monoclonal Gammopathy Research, G. (2012). Monoclonal gammopathy of renal significance: when MGUS is no longer undetermined or insignificant. Blood, 120 (22), 4292-4295.
Mater Private Hospital (2016). Pathology Department Handbook, [Online]. Available from: https://www.materprivate.ie/documents/User-Handbook-Pathology-Laboratory.pdf [Accessed 18th April].
Merlini, G. (2014). Determining the significance of MGUS. Blood, 123 (3), 305-307.
Murray, D.L., Ryu, E., Snyder, M.R. and Katzmann, J.A. (2009). Quantitation of Serum Monoclonal Proteins: Relationship between Agarose Gel Electrophoresis and Immunonephelometry.2009-08-01.
Reed, R. (2010). Abbott Diagnostics Clinical Chemistry Educational Services., [Online]. Available from: https://www.corelaboratory.abbott/sal/learningGuide/CC_09_10552_ClinChemLearning_singlepageFinal_072710.pdf [Accessed 3rd April].
Riches, P.G., Sheldon, J., Smith, A.M. and Hobbs, J.R. (1991). Overestimation of monoclonal immunoglobulin by immunochemical methods. Annals of Clinical Biochemistry, 28 (1), 253-259.
Roche (2015). IgG-2 Kit Insert.
Roitt, I.M., Delves, P.J., Martin, S.J. and Burton, D.R. (2011). Roitt’s essential immunology. 12 ed.Malden, Mass: Blackwell Pub.
SEBIA (2015). CAPRI 3 IMMUNOTYPING kit insert.
Sebia (2015). HYDRAGEL 1, 2, 4 & 9 Immunofixation kit.
Sinclair, D., Ballantyne, F., Shanley, S., Caine, E., O’Reilly, D. and Shenkin, A. (1990). Estimation of paraprotein by immunoturbidimetry and electrophoresis followed by scanning densitometry. Annals of Clinical Biochemistry:International Journal of Laboratory Medicine, 27 (4), 335-337.
Song, L. (2017). On the Case of Paraprotein Interference: Assays With Extreme pH, Low Ionic Strength Susceptible, [Online]. Available from: https://www.aacc.org/publications/cln/articles/2017/april/on-the-case-of-paraprotein-interference-assays-with-extreme-ph-low-ionic-strength-susceptible [Accessed 5th April].
St James’s Hospital (2017). St. James’s Hospital, Dublin, [Online]. Available from: http://search.stjames.ie/sjhservlet/Record.jsp?li=46&rf=as [Accessed 17th April].
Sztefko, K. and Dawsonera (2011). Immunodiagnostics and patient safety [electronic resource]. De: Walter de Gruyter GmbH Co.KG.
Tate, J., Caldwell, G., Daly, J., Gillis, D., Jenkins, M., Jovanovich, S., Martin, H., Steele, R., Wienholt, L., Mollee, P., Working Party on Standardised Reporting of Protein, E. and on behalf of the Working Party on Standardised Reporting of Protein, E. (2012). Recommendations for standardized reporting of protein electrophoresis in Australia and New Zealand. Annals of Clinical Biochemistry, 49 (3), 242-256.
Thermo Fisher Scientific (2017). Immunoglobulin Structure and Classes, [Online]. Available from: https://www.thermofisher.com/ie/en/home/life-science/antibodies/antibodies-learning-center/antibodies-resource-library/antibody-methods/immunoglobulin-structure-classes.html [Accessed 15/03].
Uljon, S.N., Treon, S.P., Tripsas, C.K. and Lindeman, N.I. (2013). Challenges with serum protein electrophoresis in assessing progression and clinical response in patients with Waldenstrom Macroglobulinemia. Clinical Lyphoma, Myeloma and Leukemia, 13 (2), 247- 249.
APPENDIX
APENIDX A
Table: Comparison between the international staging system and the Durie-Salmon staging system for multiple myeloma prognosis. Information adapted from (Fentress et al., 2006).
| International staging system (ISS) | The Durie-Salmon staging system | ||
| Criteria | Median Survival (months) | ||
| Stage I | Serum Beta 2 microglobulin:
˂ 3.5mg/L Serum albumin: ˃ 3.5g/dL |
62 | Haemoglobin: ˃10g/dL
Calcium: Normal or ≤ 12g/dL Myeloma protein: IgG peak ˂5g/dL IgA peak ˂ 3g/dL Bence Jones protein ˂4 g/24hours Lytic bone lesions: None or solitary bone plasmacytoma only Stage I must demonstrate all of the criteria. |
| Stage II | Neither stage I or III | 44 | Neither stage I or III |
| Stage III | Serum Beta 2 microglobulin: ˃5.5mg/L | 29 | Haemoglobin: ˂8.5g/dL
Calcium: ˃ 12 mg/dL Myeloma protein: IgG peak ˃ 7g/dL IgA peak ˃ 5g/dL Bence Jones protein ˃ 12g/24hours Lytic bone lesions: ˃3 lytic lesions Stage III must demonstrate one or more of the criteria |
APPENDIX B
Gantt chart used for project planning and progress monitoring
| Week Number Estimate | ||||||||||||
| Phase | 1 | 2 | 3 | 4 | 5 | 6 | 7 | 8 | 9 | 10 | 11 | |
| 1 | Preparation:
Literature Review |
× | × | × | × | |||||||
| Submission of Progress report I (23.03.2017) | × | |||||||||||
| 2 | Preparation: Research methods | × | × | |||||||||
| Submission of Progress Report II (.04.2017) | × | |||||||||||
| 3 | Data Collection and Analysis | × | × | × | ||||||||
| Submission of Interim report (24.04.2017) | × | |||||||||||
| 5 | Thesis preparation | × | × | × | × | |||||||
| Thesis submission (19.05.2017) | × | |||||||||||
| Final | Preparation of Poster | × | × | |||||||||
| Poster presentation & Interview (29.05.2017) | × | |||||||||||
APPENDIX C
Project Risk Assessment:
| Category | Risk | Danger Rating | Preventive Measures |
| Biological |
|
Medium |
|
| Chemical
|
|
Medium |
|
| Physical
|
|
Low |
|
| Electrical
|
|
Low |
|
Appendix C
Table: IgG
| Sample number | Ig Isotype
IgG
|
SPE measurement (g/l) | Immunoturbidimetric |
| 1 | IgG kappa | 7.0 | 13.08 |
| 2 | IgG lambda | 1.9 | 3.91 |
| 3 | IgG kappa | 10.6 | 14.23 |
| 4 | IgG kappa | 3.8 | 6.61 |
| 5 | IgG kappa | 5.0 | 8.57 |
| 6 | IgG kappa | 22.5 | 28.20 |
| 7 | IgG kappa | 3.4 | 6.55 |
| 8 | IgG kappa | 15.5 | 14.37 |
| 9 | IgG kappa | 3.5 | 10.00 |
| 10 | IgG kappa | 7.4 | 9.74 |
| 11 | IgG kappa | 1.6 | 7.12 |
| 12 | IgG lambda | 12.2 | 18.35 |
| 13 | IgG kappa | 3.4 | 6.82 |
| 14 | IgG kappa | 3.2 | 7.99 |
| 15 | IgG lambda | 1.7 | 4.00 |
| 16 | IgG kappa | 4.6 | 13.99 |
| 17 | IgG kappa | 26.6 | 37.41 |
| 18 | IgG lambda | 8.8 | 16.68 |
| 19 | IgG lambda | 40.7 | 45.22 |
| 20 | IgG kappa | 3.4 | 6.21 |
| 21 | IgG kappa | 31.4 | 35.59 |
| 22 | IgG kappa | 7.0 | 10.40 |
| 23 | IgG kappa | 35.8 | 38.47 |
| 24 | IgG kappa | 10.9 | 17.04 |
| 25 | IgG kappa | 3.9 | 8.01 |
| 26 | IgG lambda | 14.2 | 19.51 |
| 27 | IgG kappa | 30.7 | 34.37 |
| 28 | IgG kappa | 14.6 | 17.55 |
| 29 | IgG kappa | 49.5 | 71.95 |
| 30 | IgG kappa | 2.8 | 6.13 |
| 31 | IgG kappa | 3.6 | 7.08 |
| 32 | IgG kappa | 48.4 | 71.85 |
| 33 | IgG kappa | 27.7 | 38.08 |
| 34 | IgG kappa | 4.7 | 8.26 |
| 35 | IgG kappa | 46.8 | 66.32 |
| 36 | IgG kappa | 6.6 | 9.67 |
| 37 | IgG kappa | 32.8 | 36.30 |
| 38 | IgG lambda | 9.2 | 12.91 |
| 39 | IgG kappa | 36.3 | 40.27 |
| 40 | IgG kappa | 9.9 | 11.97 |
| 41 | IgG kappa | 9.4 | 11.79 |
| 42 | IgG kappa | 9.9 | 11.66 |
| 43 | IgG kappa | 44 | 59.46 |
| 44 | IgG lambda | 11.1 | 7.63 |
| 45 | IgG kappa | 5.7 | 9.15 |
| 46 | IgG kappa | 26.6 | 35.18 |
| 47 | IgG lambda | 5.9 | 9.46 |
| 48 | IgG kappa | 12.2 | 11.43 |
| 49 | IgG lambda | 15.0 | 23.89 |
| 50 | IgG lambda | 5.9 | 9.46 |
| 51 | IgG kappa | 12.2 | 11.43 |
| 52 | IgG lambda | 3.4 | 9.30 |
| 53 | IgG kappa | 11.0 | 15.89 |
| 54 | IgG kappa | 5.3 | 8.74 |
| 55 | IgG lambda | 5.5 | 13.54 |
| 56 | IgG kappa | 16.9 | 15.18 |
| 57 | IgG kappa | 43.8 | 62.13 |
| 58 | IgG kappa | 12.6 | 19.64 |
| 59 | IgG lambda | 2.7 | 5.41 |
| 60 | IgG kappa | 10.1 | 12.58 |
| 61 | IgG kappa | 11.5 | 19.94 |
| 62 | IgG kappa | 5.2 | 7.68 |
| 63 | IgG lambda | 6.1 | 7.63 |
| 64 | IgG lambda | 5.5 | 12.38 |
| 65 | IgG kappa | 1.3 | 2.87 |
| 66 | IgG kappa | 4.5 | 12.67 |
| 67 | IgG lambda | 6.1 | 7.77 |
| 68 | IgG lambda | 16.4 | 27.95 |
| 69 | IgG kappa | 10.1 | 17.83 |
| 70 | IgG lambda | 3.0 | 13.33 |
| 71 | IgG lambda | 10.8 | 18.26 |
| 72 | IgG lambda | 5.1 | 8.40 |
| 73 | IgG kappa | 9.5 | 9.09 |
| 74 | IgG kappa | 42.0 | 61.06 |
| 75 | IgG lambda | 6.2 | 7.54 |
| 76 | IgG kappa | 4.2 | 8.60 |
| 77 | IgG kappa | 2.9 | 5.38 |
| 78 | IgG kappa | 1.4 | 3.28 |
| 79 | IgG kappa | 5.4 | 11.46 |
| 80 | IgG lambda | 20.1 | 27.75 |
| 81 | IgG lambda | 14.9 | 22.87 |
| 82 | IgG lambda | 5.0 | 8.17 |
| 83 | IgG lambda | 10.1 | 18.43 |
| 84 | IgG lambda | 2.5 | 11.35 |
| 85 | IgG lambda | 5.0 | 10.76 |
| 86 | IgG kappa | 6.1 | 9.22 |
| 87 | IgG kappa | 31.2 | 39.89 |
| 88 | IgG lambda | 3.2 | 9.81 |
| 89 | IgG kappa | 28.0 | 35.54 |
| 90 | IgG kappa | 11.5 | 14.70 |
| 91 | IgG kappa | 13.2 | 11.56 |
| 92 | IgG kappa | 16.0 | 17.49 |
| 93 | IgG kappa | 6.7 | 10.02 |
| 94 | IgG kappa | 25.4 | 25.67 |
| 95 | IgG kappa | 10.8 | 10.70 |
| 96 | IgG kappa | 46.0 | 62.67 |
| 97 | IgG kappa | 11.6 | 13.53 |
| 98 | IgG kappa | 4.2 | 6.63 |
| 99 | IgG kappa | 3.8 | 11.54 |
| 100 | IgG lambda | 2.9 | 8.49 |
| 101 | IgG lambda | 3.6 | 10.81 |
| 102 | IgG kappa | 6.8 | 12.13 |
| 103 | IgG lambda | 4.6 | 11.57 |
| 104 | IgG lambda | 14.2 | 20.33 |
| 105 | IgG kappa | 7.0 | 11.88 |
| 106 | IgG kappa | 5.0 | 9.06 |
| 107 | IgG kappa | 49.7 | 68.16 |
| 108 | IgG lambda | 4.5 | 7.79 |
| 109 | IgG kappa | 21.2 | 27.34 |
| 110 | IgG kappa | 8.1 | 9.62 |
| 111 | IgG lambda | 3.4 | 9.55 |
| 112 | IgG kappa | 10.9 | 11.24 |
| 113 | IgG kappa | 3.5 | 5.52 |
| 114 | IgG kappa | 12.6 | 16.74 |
| 115 | IgG kappa | 50.3 | 68.18 |
| 116 | IgG kappa | 7.8 | 7.36 |
| 117 | IgG lambda | 14.7 | 19.19 |
| 118 | IgG lambda | 9.9 | 18.64 |
| 119 | IgG lambda | 13.9 | 21.98 |
| 120 | IgG kappa | 11.1 | 13.56 |
| 121 | IgG lambda | 13.0 | 16.71 |
| 122 | IgG kappa | 38.8 | 42.87 |
| 123 | IgG lambda | 2.8 | 8.56 |
| 124 | IgG lambda | 5.0 | 12.09 |
| 125 | IgG lambda | 31.1 | 43.32 |
| 126 | IgG lambda | 5.9 | 12.10 |
| 127 | IgG lambda | 9.9 | 13.46 |
| 128 | IgG lambda | 4.3 | 6.82 |
| 129 | IgG kappa | 48.0 | 67.69 |
| 130 | IgG lambda | 6.9 | 12.59 |
| 131 | IgG kappa | 8.1 | 12.95 |
| 132 | IgG lambda | 2.2 | 10.63 |
| 133 | IgG kappa | 3.6 | 11.19 |
| 134 | IgG kappa | 11.9 | 16.22 |
| 135 | IgG kappa | 6.1 | 8.76 |
| 136 | IgG lambda | 6.0 | 12.36 |
| 137 | IgG lambda | 12.2 | 18.83 |
| 138 | IgG kappa | 37.8 | 47.88 |
| 139 | IgG kappa | 14.4 | 21.36 |
| 140 | IgG kappa | 12.4 | 13.56 |
| 141 | IgG lambda | 2.0 | 8.49 |
| 142 | IgG kappa | 5.9 | 8.60 |
| 143 | IgG kappa | 3.2 | 9.69 |
| 144 | IgG lambda | 8.3 | 10.72 |
| 145 | IgG kappa | 51.1 | 57.40 |
| 146 | IgG kappa | 10.2 | 15.04 |
| 147 | IgG kappa | 52.1 | 71.16 |
| 148 | IgG kappa | 49.3 | 57.40 |
| 149 | IgG kappa | 34.7 | 40.74 |
| 150 | IgG kappa | 6.5 | 9.85 |
| 151 | IgG lambda | 5.3 | 11.44 |
| 152 | IgG kappa | 6.3 | 9.75 |
| 153 | IgG kappa | 4.3 | 5.48 |
| 154 | IgG kappa | 48.1 | 56.55 |
| 155 | IgG lambda | 6.5 | 9.95 |
| 156 | IgG lambda | 56.5 | 65.22 |
| 157 | IgG kappa | 30.1 | 40.85 |
| 158 | IgG kappa | 15.1 | 17.32 |
| 159 | IgG kappa | 12.9 | 18.11 |
| 160 | IgG lambda | 6.4 | 12.61 |
| 161 | IgG kappa | 13.5 | 15.72 |
| 162 | IgG kappa | 18.2 | 31.44 |
| 163 | IgG kappa | 25.7 | 35.00 |
| 164 | IgG kappa | 19.4 | 31.94 |
| 165 | IgG kappa | 16.0 | 22.03 |
| 166 | IgG kappa | 9.5 | 11.32 |
| 167 | IgG kappa | 8.1 | 10.69 |
| 168 | IgG kappa | 14.1 | 15.46 |
| 169 | IgG lambda | 7.5 | 12.81 |
| 170 | IgG kappa | 6.6 | 10.40 |
| 171 | IgG kappa | 22.1 | 28.53 |
| 172 | IgG kappa | 51.3 | 68.55 |
| 173 | IgG lambda | 7.1 | 11.41 |
| 174 | IgG kappa | 7.6 | 11.41 |
| 175 | IgG lambda | 30.0 | 35.23 |
| 176 | IgG lambda | 9.6 | 14.48 |
| 177 | IgG kappa | 33.4 | 34.08 |
| 178 | IgG lambda | 7.3 | 12.62 |
| 179 | IgG kappa | 37.6 | 43.09 |
Table: IgA retrospective study
| Sample number | Ig Isotype
IgA
|
SPE measurement (g/l) | Immunoturbidimetric (g/l) |
| 1 | IgA lambda | 24.5 | 31.15 |
| 2 | IgA kappa | 19.5 | 22.06 |
| 3 | IgA lambda | 8.4 | 9.67 |
| 4 | IgA lambda | 25.1 | 31.15 |
| 5 | IgA kappa | 1.6 | 2.83 |
| 6 | IgA kappa | 21.0 | 17.50 |
| 7 | IgA kappa | 18.4 | 21.66 |
| 8 | IgA kappa | 21.5 | 18.02 |
| 9 | IgA kappa | 19.2 | 23.77 |
| 10 | IgA lambda | 4.7 | 6.14 |
| 11 | IgA kappa | 22.4 | 24.90 |
| 12 | IgA kappa | 4.3 | 5.88 |
| 13 | IgA kappa | 3.0 | 4.43 |
| 14* | IgA kappa | 7.4 | 4.23 |
| 15* | IgA kappa | 6.3 | 4.23 |
| 16* | IgA kappa | 6.2 | 2.05 |
| 17 | IgA kappa | 17.2 | 20.50 |
| 18* | IgA kappa | 3.7 | 2.75 |
| 19 | IgA lambda | 3.1 | 5.35 |
| 20* | IgA kappa | 4.8 | 2.25 |
| 21* | IgA kappa | 4.4 | 2.06 |
| 22 | IgA kappa | 5.2 | 6.46 |
| 23 | IgA kappa | 14.6 | 16.19 |
| 24 | IgA lambda | 5.3 | 7.05 |
| 25* | IgA kappa | 4.9 | 1.91 |
| 26* | IgA kappa | 2.7 | 1.79 |
| 27 | IgA kappa | 3.1 | 2.86 |
| 28 | IgA kappa | 3.1 | 2.86 |
| 29 | IgA kappa | 2.3 | 4.53 |
| 30 | IgA lambda | 4.6 | 4.98 |
| 31 | IgA lambda | 7.7 | 10.65 |
| 32 | IgA lambda | 4.7 | 3.07 |
| 33 | IgA lambda | 13.8 | 13.92 |
| 34 | IgA kappa | 1.9 | 3.04 |
| 35 | IgA kappa | 12.8 | 8.09 |
| 36 | IgA lambda | 5.9 | 5.16 |
Table: IgM data from retrospective study
| Sample number | Ig Isotype
IgM
|
SPE measurement (g/l) | Immunoturbidimetric |
| 1 | IgM kappa | 2.0 | 5.20 |
| 2 | IgM kappa | 11.3 | 20.77 |
| 3 | IgM kappa | 7.1 | 8.19 |
| 5 | IgM lambda | 31.9 | 50.49 |
| 6 | IgM kappa | 3.7 | 5.73 |
| 7 | IgM kappa | 4.5 | 6.11 |
| 8 | IgM kappa | 9.0 | 15.70 |
| 9 | IgM kappa | 3.5 | 5.23 |
| 10 | IgM kappa | 17.2 | 19.85 |
| 11 | IgM kappa | 6.0 | 9.94 |
| 12 | IgM kappa | 5.0 | 5.73 |
| 13 | IgM lambda | 7.2 | 11.54 |
| 14 | IgM kappa | 20.1 | 29.94 |
| 15 | IgM kappa | 9.8 | 12.64 |
| 16 | IgM kappa | 17.7 | 23.64 |
| 17 | IgM kappa | 11.7 | 18.49 |
| 18 | IgM lambda | 5.1 | 4.21 |
| 19 | IgM lambda | 5.4 | 7.22 |
| 20 | IgM lambda | 5.7 | 6.90 |
| 21 | IgM lambda | 34.4 | 52.60 |
| 22 | IgM kappa | 13.7 | 18.74 |
| 23 | IgM kappa | 20.3 | 31.22 |
| 24 | IgM kappa | 15.8 | 13.41 |
| 25 | IgM lambda | 7.3 | 13.12 |
APPENDIX D
Table of upper and lower technical limits of measurement of iGS by Roche.
| Lower technical limit | Upper technical limit | Increase volume if low | Dilution if high | Extended lower limit | Extended upper limit | Report Low as | |
| IgG | 3.00 | 50.00 | X7.5 | 5.5 | 0.40 | 275.00 | ˂0.40 |
| IgA | 0.50 | 8.00 | X10 | 8 | 0.05 | 64.00 | ˂0.05 |
| IgM | 0.25 | 6.50 | X5 | 9 | 0.05 | 58.50 | ˂0.05 |
APPENDIX E
Table: Results of Reanalysis and manual dilution of analytes and their corresponding SPE quantitation values
| Batch Number | IgG (g/L) | IgA (g/L) | IgM
(g/L) |
Total Protein
(g/L) |
Dilution required | Results obtained after dilution | Manual dilution result (g/L) | Paraprotein Band Quantitation (SPE) (g/L) | |
| Reference Ranges* |
7-16
|
0.70-4.0 |
0.40-2.30 |
66-87 |
|||||
| 1.1 | 67.92 | 0.02 | 0.08 | 109.2 | 1 in 5 | IgG-15.60 | IgG- 78.0 | 46.8 | |
| 1.2 | 41.17 | 0.51 | 0.23 | 98.0 | 1 in 3 | IgG-15.44 | IgG- 46.32 | 36.3 | |
| 1.3 | 78.63 | 0.02 | 0.07 | 114.2 | 1 in 5 | IgG-16.54 | IgG- 82.70 | 48.4 | |
| 1.4 | 37.83 | 0.40 | 0.21 | 88.8 | 1 in 3 | IgG-13.43 | IgG- 40.29 | 32.8 | |
| 1.5 | 17.61 | 1.03 | 0.08 | 70.4 | 1 in 3 | IgG-5.69 | IgG- 17.07 | 12.3 | |
| 1.6 | 67.09 | 0.02 | 0.07 | 107.1 | 1 in 5 | IgG-15.33 | IgG- 76.65 | 48.4 | |
| 1.7 | 19.33 | 0.75 | 0.61 | 74.3 | 1 in 3 | IgG-6.88 | IgG- 20.64 | 14.2 | |
| 1.8 | 39.61 | 0.75 | 0.17 | 93.0 | Insufficient sample | 27.7 | |||
| 1.9 | 23.05 | 0.33 | 0.15 | 73.0 | 1 in 3 | IgG-7.82 | IgG- 23.46 | 22.3 | |
| 1.10 | 18.36 | 0.14 | 0.54 | 70.6 | 1 in 3 | IgG-5.92 | IgG- 17.76 | 13.2 | |
| 1.11 | 18.37 | 2.13 | 0.24 | 71.9 | 1 in 3 | IgG-5.94 | IgG- 17.82 | 8.9 | |
| 2.1 | 4.35 | 14.55 | 0.48 | 62.6 | 1 in 10 | IgA-1.51 | IgA- 15.1 | B region | |
| 2.2 | 6.75 | 22.42 | 0.11 | 78.7 | 1 in 10 | IgA-2.20 | IgA- 22.0 | 18.4 | |
| 2.3 | 0.18 | 0.02 | 39.44 | 61.0 | 1 in 10 | IgM-4.27 | IgM- 42.7 | 23.9 | |
| 2.4 | 7.66 | 1.78 | 51.28 | 96.5 | 1 in 20 | IgM-2.41 | IgM- 48.2 | 31.9 | |
| 2.5 | 4.30 | 0.80 | 14.44 | 64.2 | 1 in 10 | IgM-1.93 | IgM- 19.3 | 9.0 | |
| 2.6 | 35.04 | 0.63 | 0.43 | 83.7 | 1 in 4 | IgG-9.13 | IgG- 36.52 | 26.6 | |
| 2.7 | 16.25 | 0.70 | 20.90 | 86.3 | 1 in 10 | IgM-1.96 | IgM-19.6 | 17.2 | |
| 2.8 | 1.72 | 0.13 | 29.85 | 76.5 | 1 in 10 | IgM- 3.12 | IgM- 31.2 | 20.1 | |
| 2.9 | 10.75 | 1.07 | 24.65 | 87.8 | 1 in 10 | IgM- 2.38 | IgM- 23.8 | 18.4 | |
| 2.10 | 10.04 | 0.68 | 18.46 | 83.0 | 1 in 10 | IgM- 1.75 | IgM- 17.5 | 13.7 | |
| 2.11 | 20.53 | 2.13 | 0.54 | 72.7 | 1 in 2 | IgG- 11.31 | IgG- 22.62 | 16.0 | |
| 2.12 | 6.63 | 1.67 | 50.99 | 92.6 | 1 in 20 | IgM- 2.52 | IgM- 50.40 | 34.4 | |
| 2.13 | 4.69 | 18.14 | 0.08 | 68.2 | 1 in 10 | IgA- 2.20 | IgA- 22.0 | 15.3 | |
| 2.14 | 13.18 | 3.32 | 0.60 | 73.5 | N/A | 7.5 | |||
| 2.15 | 1.77 | 0.15 | 30.11 | 75.3 | 1 in 20 | IgM- 1.50 | IgM- 30.0 | 20.3 | |
| 2.16 | 5.55 | 2.23 | 0.52 | 65.1 | N/A | B region | |||
| 2.17 | 69.69 | 0.01 | 0.04 | 116.2 | 1 in 4 | IgG- 18.53 | IgG- 74.12 | 43.8 | |
| 2.18 | 9.74 | 1.39 | 0.34 | 60.8 | N/A | 7.9 | |||
| 2.19 | 27.59 | 0.96 | 0.63 | 81.7 | 1 in 2 | IgG- 13.68 | IgG- 27.36 | 22.1 | |
| 3.1 | 3.89 | 9.17 | 0.28 | 60.6 | 1 in 3 | IgA-2.91 | IgA- 8.73 | 12.8 | |
| 3.2 | 27.26 | 7.49 | 1.65 | 82.8 | 1 in 3 | IgG- 9.90
IgA- 2.69 |
IgG- 29.70
IgA- 8.07 |
TSTQ | |
| 3.3 | 5.71 | 2.21 | 11.00 | 65.3 | 1 in 5 | IgM- 2.88 | IgM- 14.00 | 7.3 | |
| 3.4 | 9.98’ | 1.40 | 1.25 | 71.2 | N/A | 3.0 | |||
| 3.5 | 1.85 | 0.14 | 31.84 | 73.6 | 1 in 20 | IgM- 1.73 | IgM- 34.6 | 20.0 | |
| 3.6 | 5.54 | 9.16 | 0.49 | 54.1 | 1 in 3 | IgA- 3.54 | IgA- 10.62 | 10.0 | |
| 3.7 | 33.81 | 0.32 | 0.12 | 87.0 | 1 in 3 | IgG- 13.01 | IgG- 39.03 | 33.4 | |
| 3.8 | 3.20 | 0.55 | 14.33 | 58.4 | 1 in 6 | IgM- 2.95 | IgM- 17.70 | 11.90 | |
| 3.9 | 68.99 | 0.03 | 0.05 | 125.0 | 1 in 10 | IgG- 6.48 | IgG- 64.80 | 48.0 | |
| 3.10 | 6.19 | 24.07 | 0.11 | 76.1 | 1 in 10 | IgA- 2.55 | IgA- 25.50 | 19.20 | |
| 3.11 | 60.67 | 0.02 | 0.06 | 130.6 | 1 in 10 | IgG- 6.36 | IgG- 63.60 | 44.0 | |
| 3.12 | 60.86 | 0.02 | 0.06 | 104.6 | 1 in 10 | IgG- 6.89 | IgG- 68.90 | 43.8 | |
| 3.13 | 50.73 | 0.27 | 0.03 | 95.4 | 1 in 5 | IgG- 9.96 | IgG-49.80 | 37.80 | |
| 3.14 | 35.47 | 0.59 | 0.38 | 84.7 | 1 in 3 | IgG- 12.24 | IgG- 36.72 | 25.70 | |
| 3.15 | 40.32 | 0.76 | 0.19 | 97.3 | 1 in 3 | IgG- 13.32 | IgG- 39.96 | 30.10 | |
| 3.16 | 67.17 | 0.22 | 0.40 | 112.4 | 1 in 5 | IgG- 12.82 | IgG- 64.10 | 56.5 | |
| 3.17 | 26.46 | 1.51 | 1.04 | 82.9 | 1 in 3 | IgG- 10.50 | IgG- 31.50 | 20.1 | |
| 4.1 | 15.55 | 0.08 | 0.08 | 67.3 | N/A | 13.3 | |||
| 4.2 | 62.16 | 0.02 | 0.06 | 106.8 | 1 in 4 | IgG- 14.82 | IgG- 59.28 | 46.0 | |
| 4.3 | 5.70 | 18.24 | 0.64 | 80.9 | 1 in 4 | IgA- 4.21 | IgA-16.84 | 21.0 | |
| 4.4 | 7.72 | 0.28 | 0.34 | 65.6 | N/A | 4.9 | |||
| 4.5 | 10.40 | 1.43 | 1.35 | 73.4 | N/A | 3.0 | |||
| 4.6 | 1.94 | 0.14 | 32.41 | 75.5 | 1 in 20 | IgM- 2.67 | IgM- 53.40 | 20.0 | |
| 4.7 | 8.28 | 0.20 | 0.25 | 63.1 | N/A | 6.1 | |||
| 4.8 | 8.32 | 0.20 | 0.26 | 63.2 | N/A | 5.8 | |||
| 4.9 | 14.40 | 0.66 | 0.54 | 69.0 | N/A | 11.2 | |||
| 4.10 | 13.30 | 0.58 | 0.27 | 73.1 | N/A | 5.8 | |||
| 4.11 | 25.60 | 0.17 | 0.35 | 78.9 | 1 in 2 | IgG- 12.78 | IgG- 25.56 | 21.8 | |
| 4.12 | 11.61 | 0.51 | 0.22 | 61.9 | N/A | 5.1 | |||
| 4.13 | 3.67 | 0.61 | 17.21 | 68.4 | 1 in 20 | IgM- 0.85 | IgM- 17.0 | 11.9 | |
| 4.14 | 1.88 | 0.16 | 32.62 | 77.3 | 1 in 20 | IgM- 1.59 | IgM- 31.80 | 20.3 | |
| 4.15 | 17.18 | 1.45 | 0.96 | 80.3 | 1 in 2 | IgG- 8.66 | IgG- 17.32 | 9.9 | |
| 4.16 | 7.02 | 2.67 | 11.84 | 73.1 | 1 in 10 | IgM- 1.12 | IgM- 11.20 | 7.3 | |
| 4.17 | 35.93 | 0.30 | 0.12 | 88.3 | 1 in 4 | IgG- 10.32 | IgG- 41.28 | 37.50 | |
| 5.1 | 4.55 | 6.29 | 0.47 | 66.8 | 1 in 2 | IgA- 2.97 | IgA- 5.94 | 5.0 | |
| 5.2 | 40.49 | 0.68 | 0.27 | 91.6 | 1 in 4 | IgG- 9.19 | IgG-36.76 | 30.1 | |
| 5.3 | 13.39 | 3.71 | 0.27 | 63.4 | N/A | TSTQ | |||
| 5.4 | 4.1 | 6.68 | 0.05 | 58.2 | 1 in 2 | IgA- 3.31 | IgA-6.62 | 6.4 | |
| 5.5 | 11.45 | 1.43 | 0.38 | 65.0 | N/A | 7.9 | |||
| 5.6 | 35.10 | 3.96 | 0.53 | 76.3 | 1 in 4 | IgG- 9.04 | IgG- 36.16 | 18.6 | |
| 5.7 | 9.14 | 10.50 | 1.37 | 68.6 | 1 in 4 | IgA- 2.34 | IgA- 9.36 | 11.0 | |
| 5.8 | 9.21 | 0.31 | 0.29 | 64.3 | N/A | 4.6 | |||
| 5.9 | 4.97 | 0.69 | 49.85 | 77.6 | 1 in 30 | IgM- 1.46 | IgM- 43.80 | 36.7 | |
| 5.10 | 12.53 | 1.20 | 0.96 | 69.3 | N/A | 6.0 | |||
* References ranges were obtained from relevant the kit inserts by (Roche 2015).
Note: Batch number 8 was a small sample, therefore manual dilution could not be performed.
N/A :Values were within the relevant reference range and therefore was not diluted, but instead included.
SPE results obtained from the LIS as previously reported on that sample.
APPENDIX F
The Remainder of the SPE results
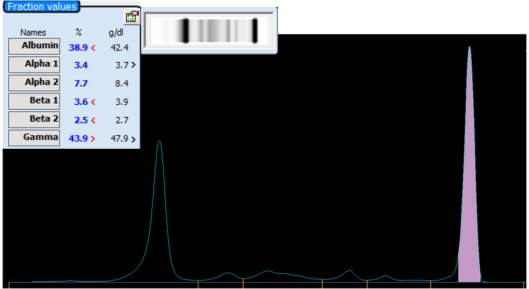
- Complete
| Analyte | % | g/dl | Ref Range |
| Albumin | |||
| Alpha 1 | |||
| Alpha 2 | |||
| Beta 1 | |||
| Beta 2 | |||
| Gamma |
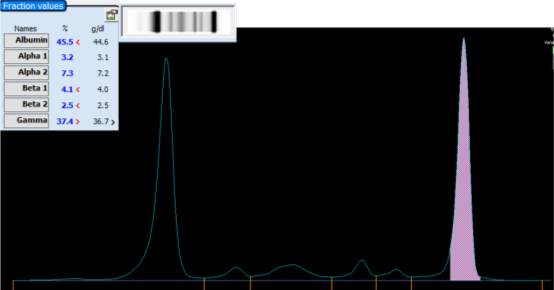
- complete
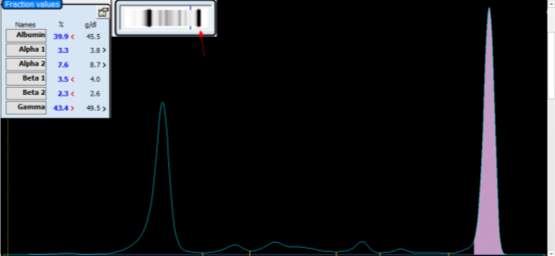
- complete
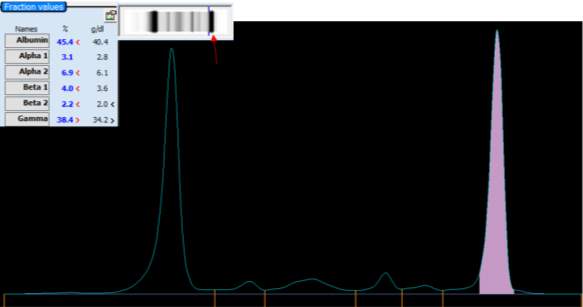
1.4 Complete
APPENDIX F
Other EXAMPLES
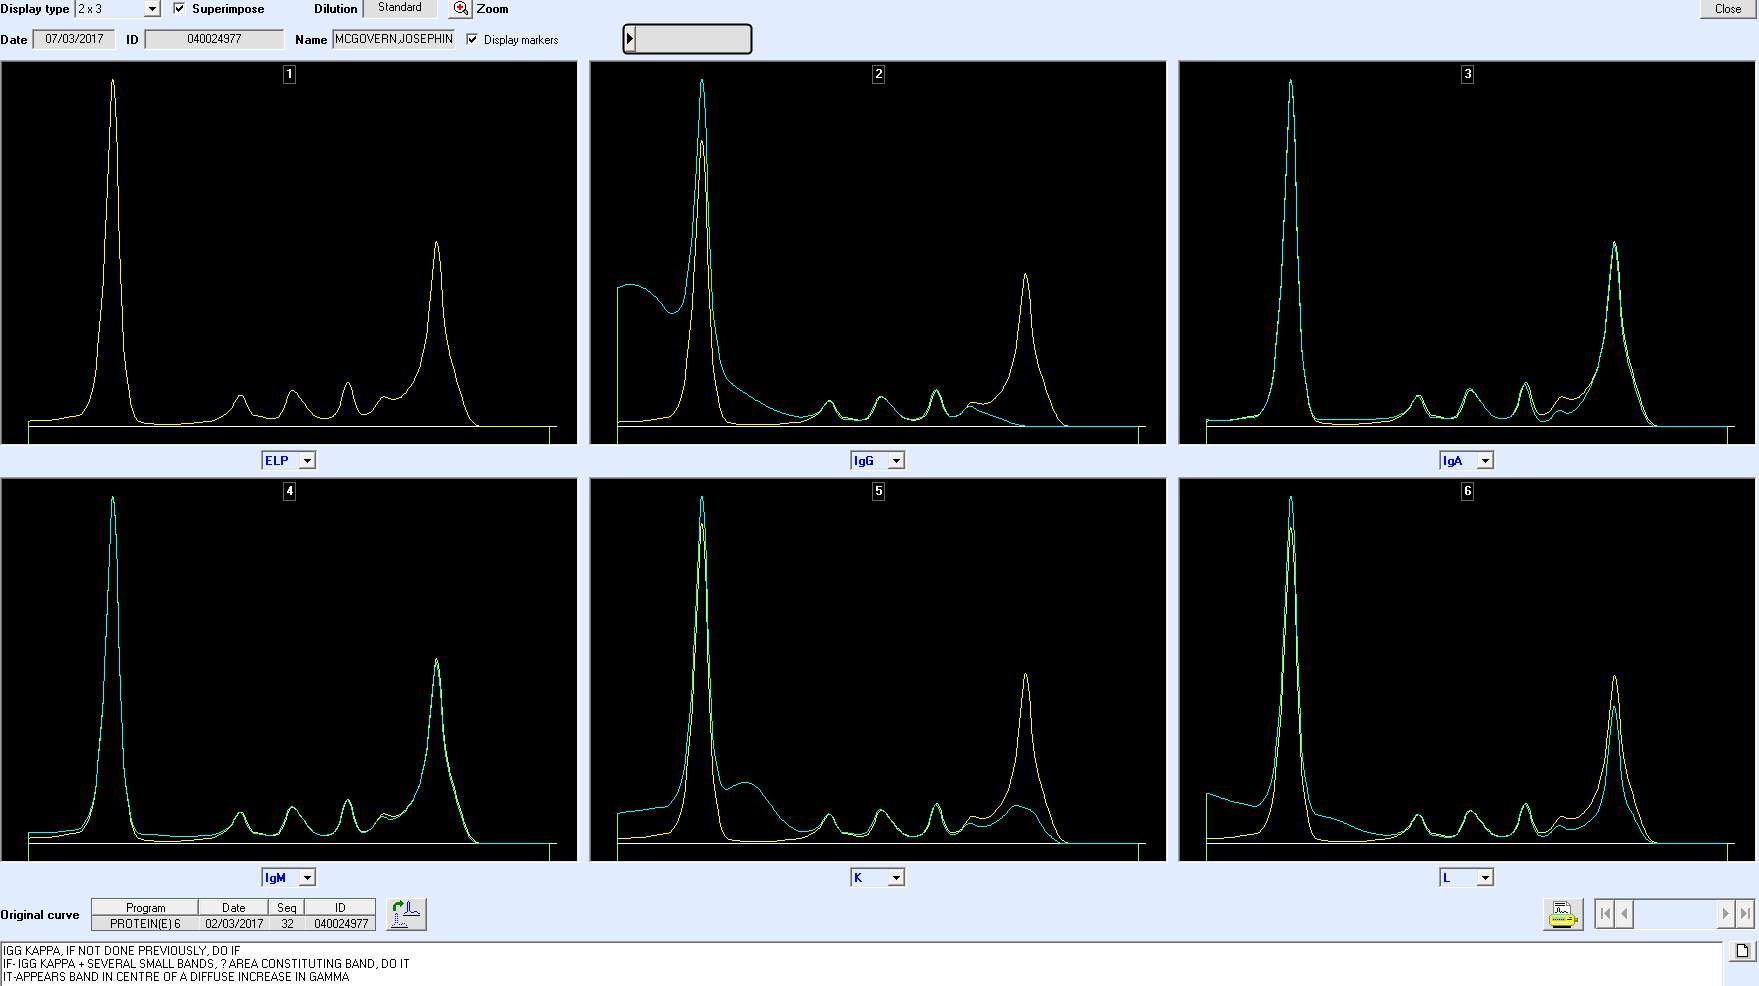
IMPORTANCE OF IT IN POLY AND MONO
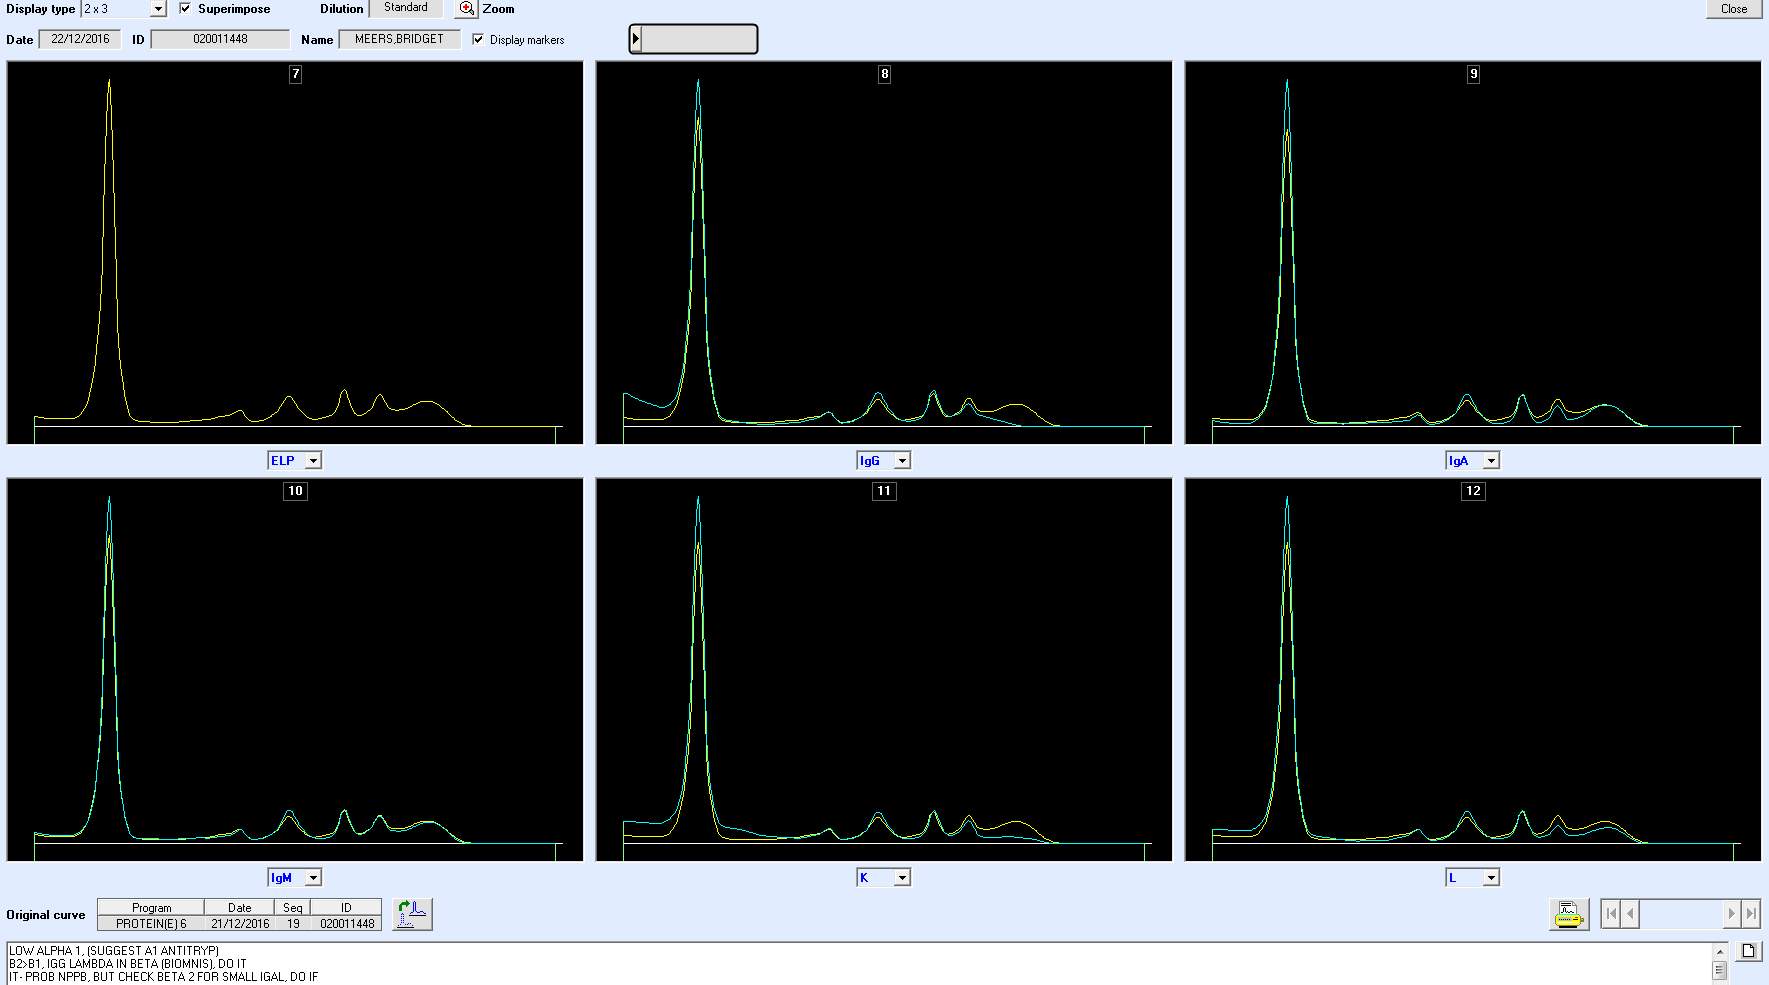 IT BANDS CANT BE QUANTIFIED
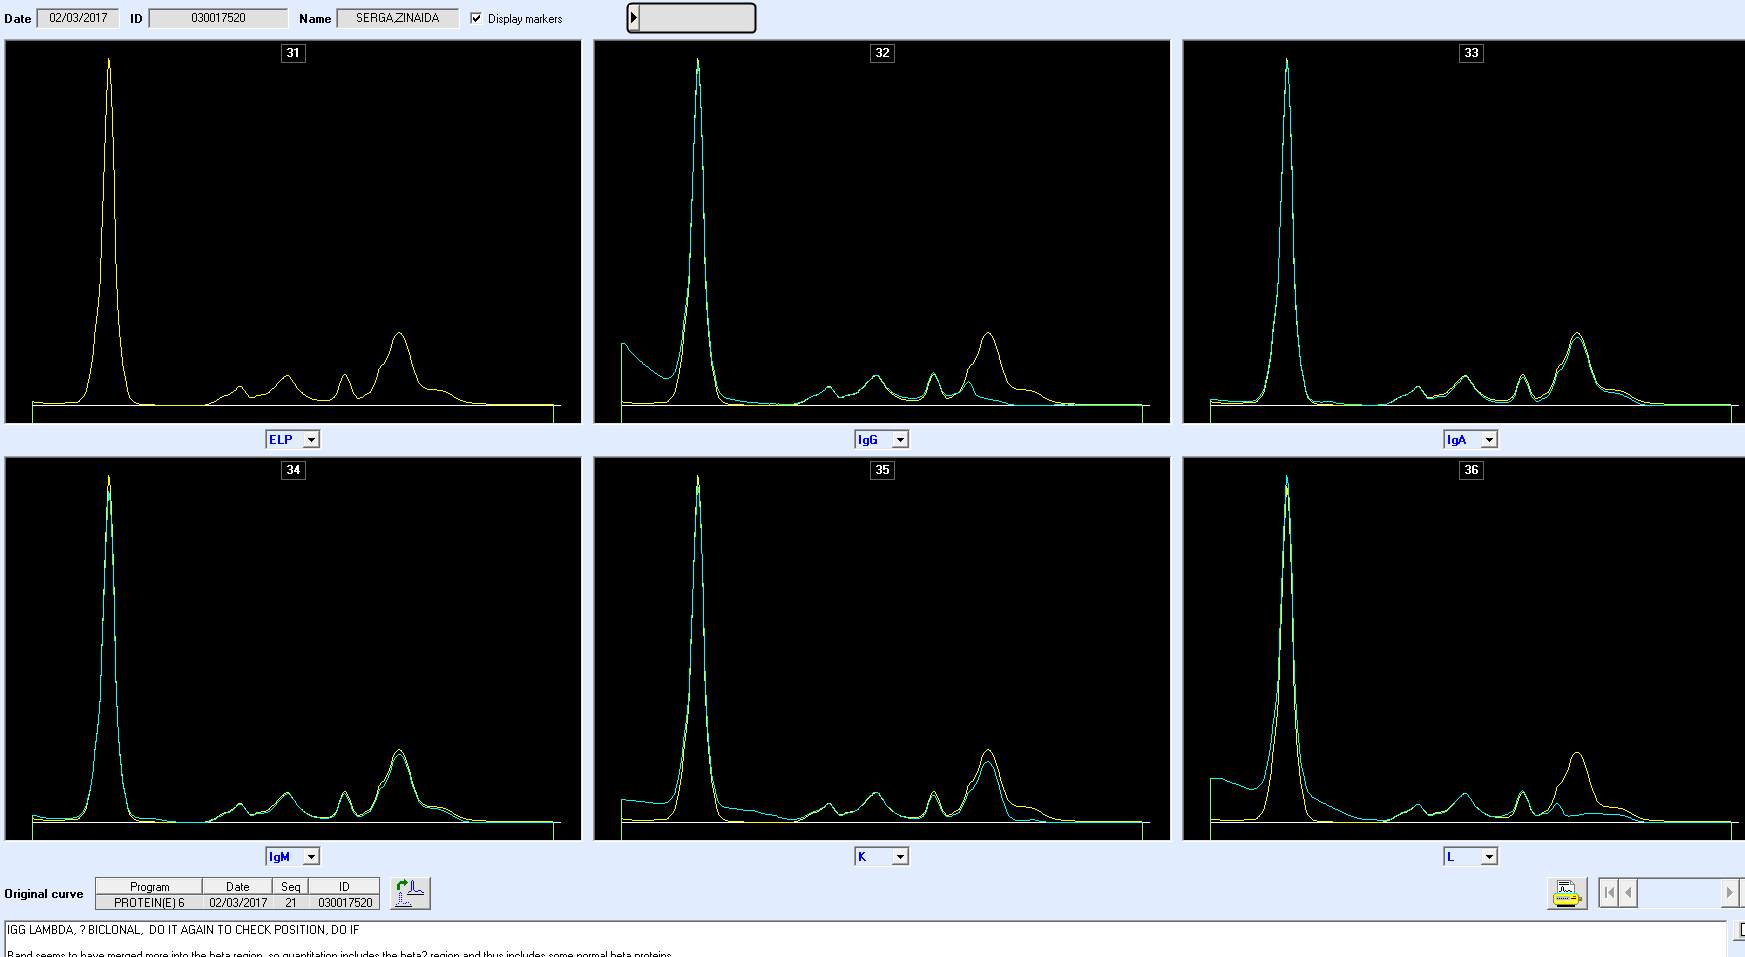
IT BENEFITS
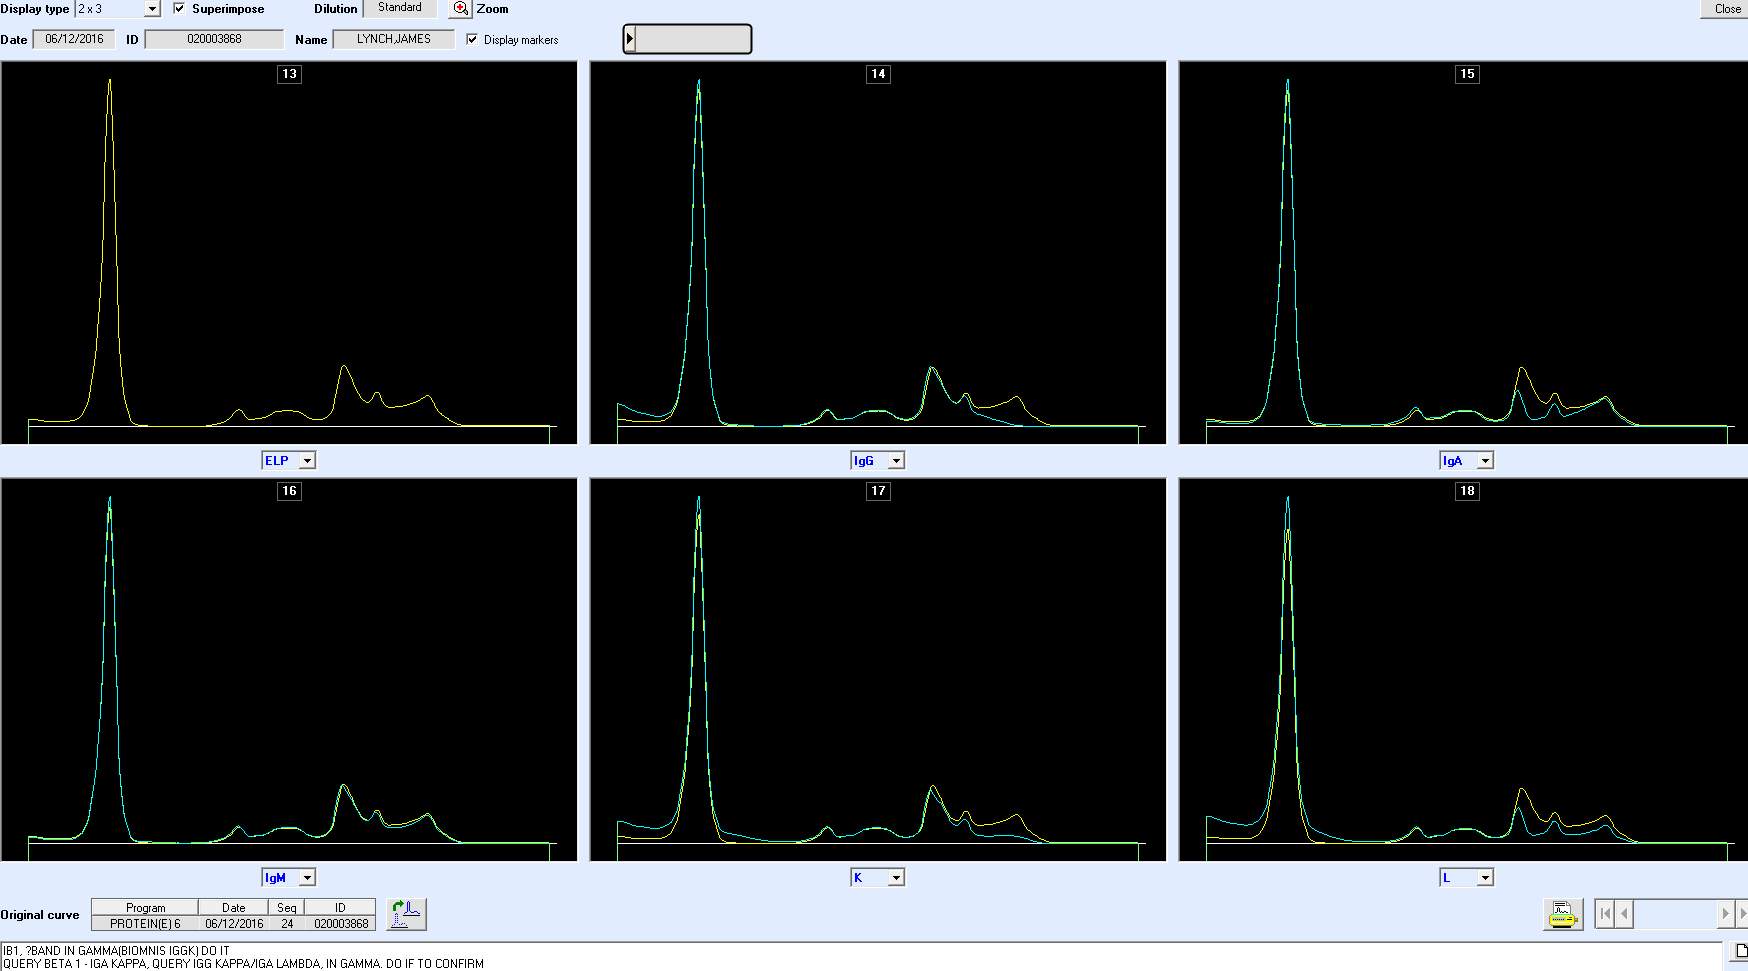
IT HELPFUL IN BETA REGION
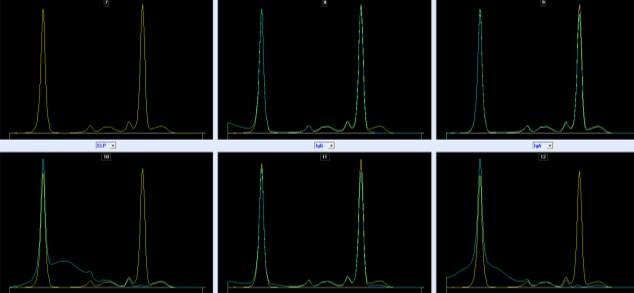
LARGE IGM- SHOWS DISCREPNACY
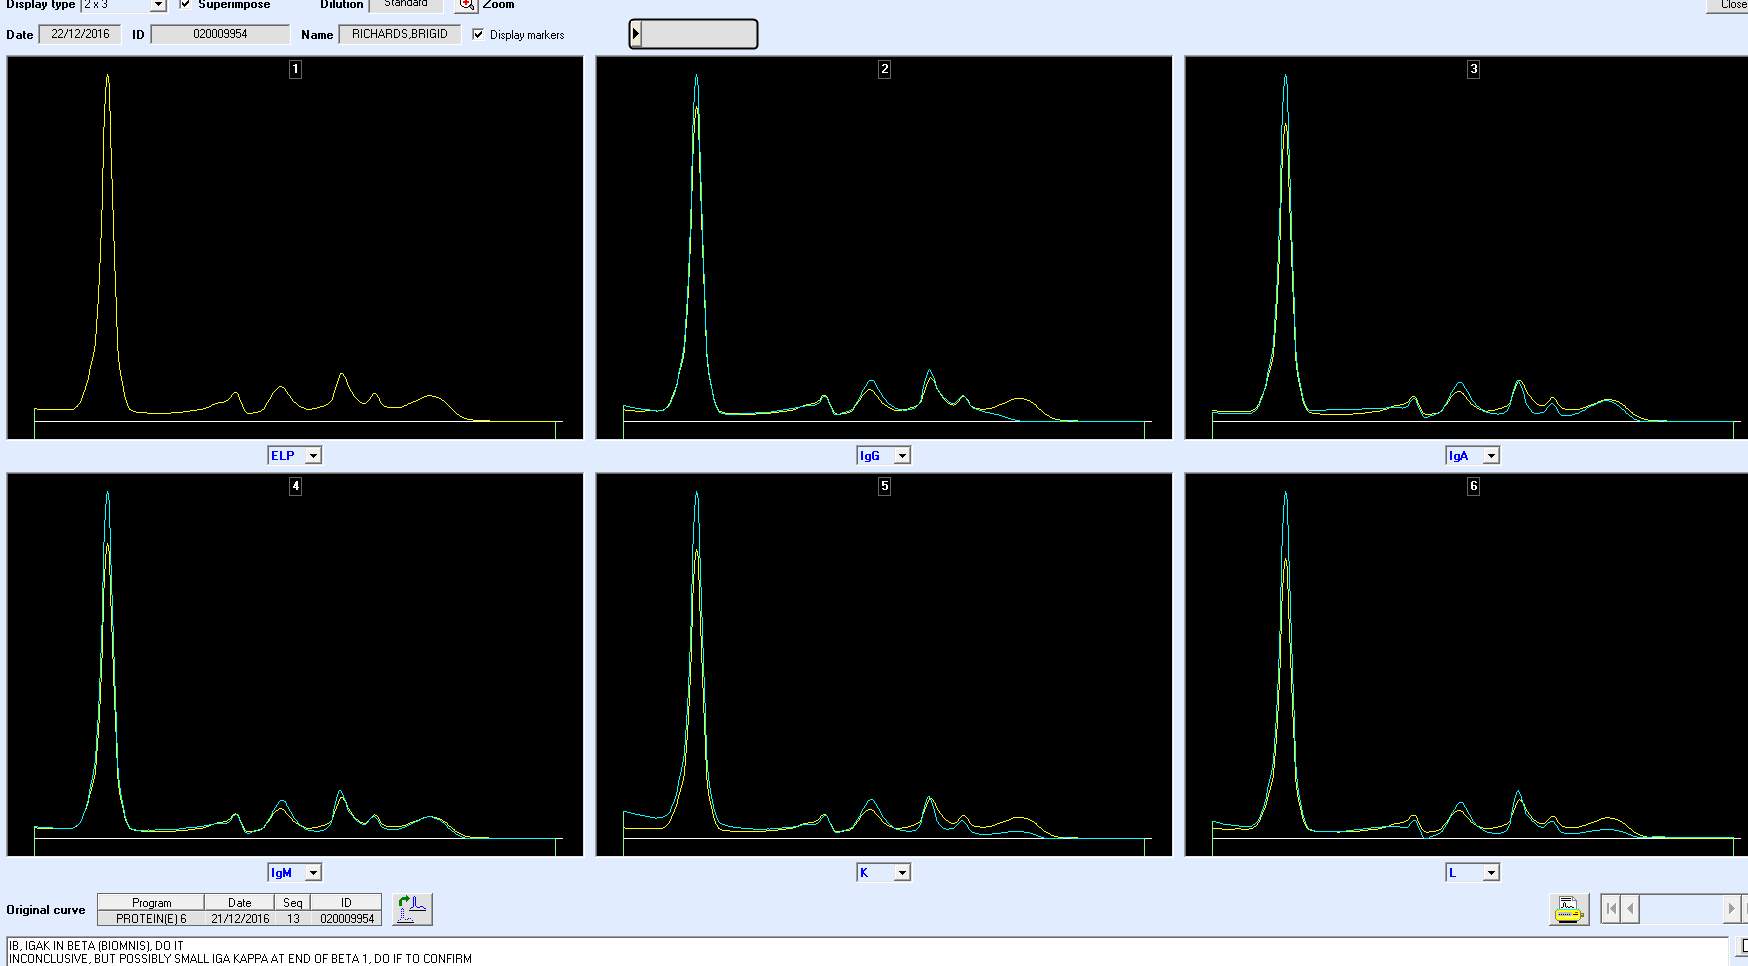
PITFALLS IN BETA REGION
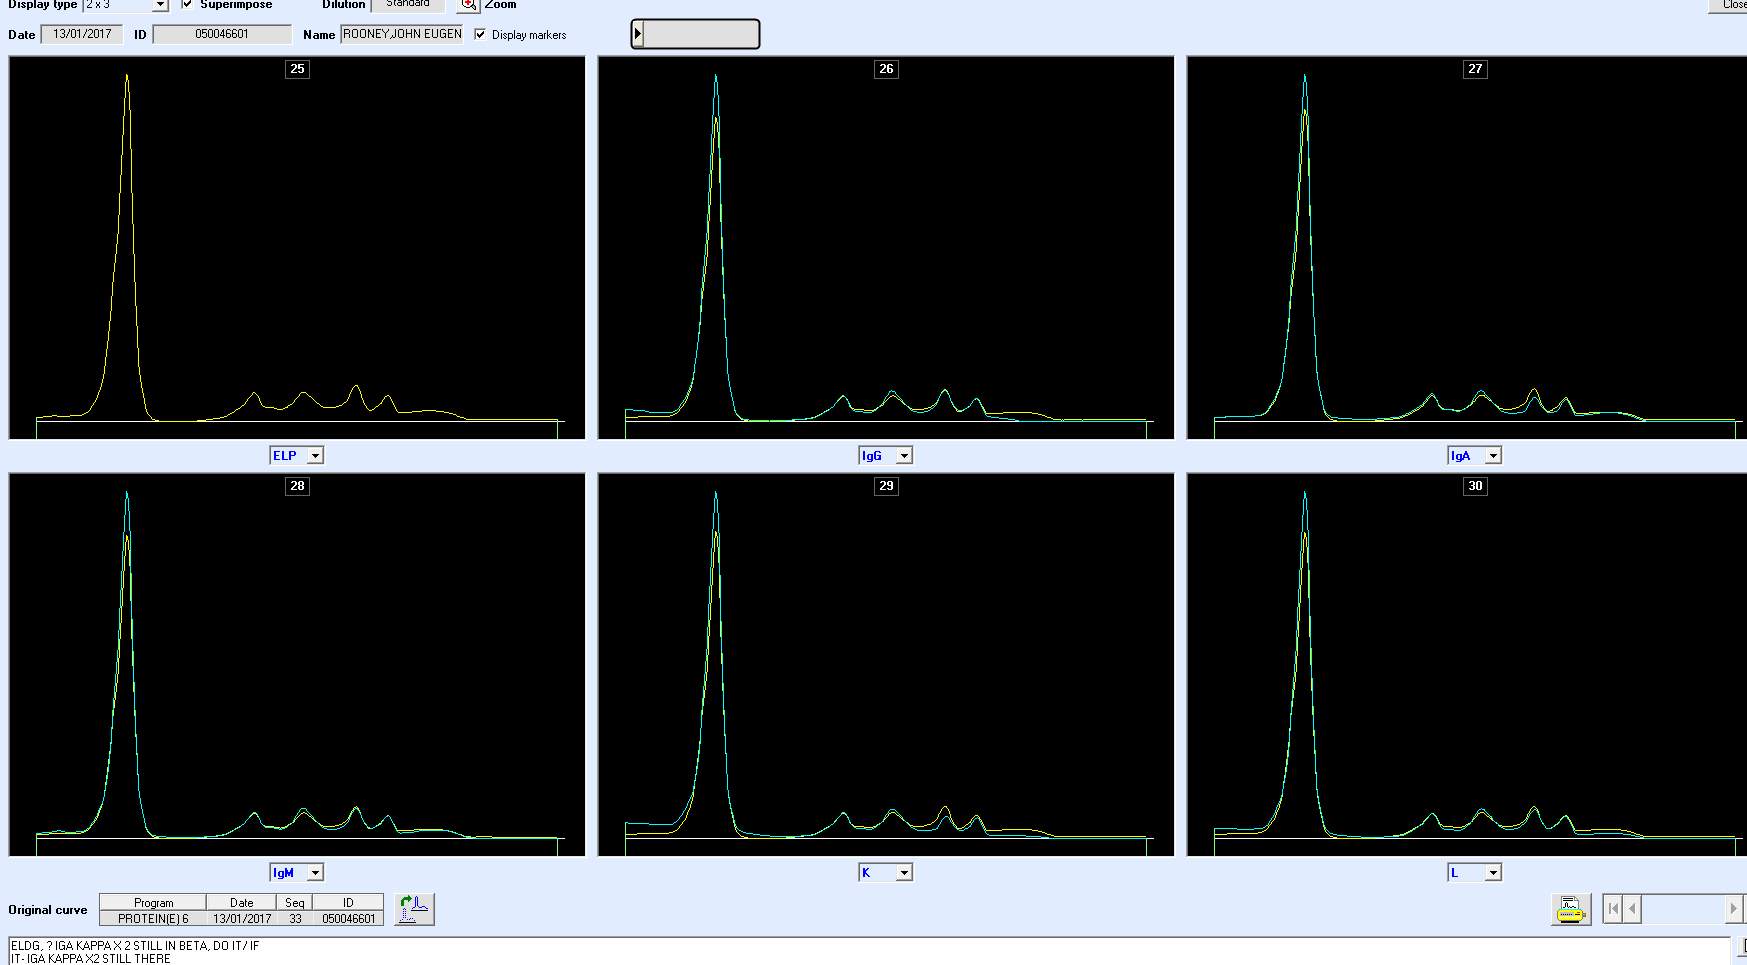
CANT BE QUANTFIED SO NECESSITY OF IGS.
Cite This Work
To export a reference to this article please select a referencing stye below:
Related Services
View all


Related Content
All TagsContent relating to: "Biology"
Biology is the scientific study of the natural processes of living organisms or life in all its forms. including origin, growth, reproduction, structure, and behaviour and encompasses numerous fields such as botany, zoology, mycology, and microbiology.
Related Articles

DMCA / Removal Request
If you are the original writer of this dissertation and no longer wish to have your work published on the UKDiss.com website then please: