Energy and Material Efficiency in Cement Industry India
Info: 13571 words (54 pages) Dissertation
Published: 10th Dec 2019
Table of Contents
4.0 Impacts on environmental and health from cement and lime manufacturing
4.2 Energy consumption and fuels-
6.1 Energy saving options in Indian cement production
7.0 Cement Consumption and production, worldwide
9.0 Alternative materials and possible improvements
9.1.1Medium and soft material:
10.0 Alternative Fuels and possible improvements
10.1.1 Kiln and preheater system-
10.2 High efficiency clinker coolers-
10.3More efficiency in grinding systems-
10.4 Energy efficiency upgrades on Process fans-
10.5 Improvements in auxiliary equipment-
10.5.2 Centrifugal compressors
10.5.3 Use of VFD for capacity control
10.5.4 Wobbler screen for crusher
10.5.5Use of renewable energy in cement industry
11.0 Material and energy flow diagram: Dry process
11.1 Material and energy flow diagram: Wet process
Figure 1. World production of cement during the twentieth century, according to cembureau.
Table 1. Summary table of the main energy use (MJ per kg).
Abstract
Chapter one:
1.0 Introduction
1.1 Background
Today’s growing population have been one of the factors of many changes that have been taking place all around the world. Growth of current population demands more houses/buildings/transport etc. Constructing more houses & buildings means that more concrete and other material are required. Concrete plays a major role in construction. In this period, concrete is made using mixtures of cement, water and aggregates containing mineral components, chemical admixtures and fibres.
1.1.1 Cement Consumption and production, worldwide
Throughout the world total cement consumption has reached 3,312 Mt in 2010. Global consumption continued to rise moving to 3,585 Mt in 2011, and estimated consumption for 2013 is over 3,900 Mt. This can be seen on the graph below.(Gorbatenko and Sharabaroff, 2014)
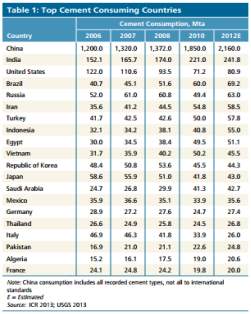


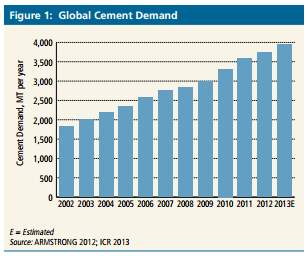 Figure 1 shows an increase in global cement demand is due to economic expansion in emerging economies. Urbanization and industrialization has increased the demand for cement throughout the world. Annual growth rates for china has reached 16% in 2010 and, over 2011 and 2012 China’s economy approaches a sustainable growth rate.
Figure 1 Global cement demand. . (IFC, 2014)
Figure 2 Top cement consuming countries worldwide (IFC, 2014)
China is the world largest cement producers and in 2012 their cement consumption is 2160.0 (Mta) and in the same year Indian cement industry has consumed around 241.8 (Mta). Indian Cement consumption is 11.19% compared to China’s cement consumption for that year.
1.2 Motivation
Economic growth and energy consumption are very closely related, Non availability of energy and material will have a downfall on the country’s economic growth. Energy demand in industries are increasing to 0.5% per year. Indian industrial demands 4.5% of industrial energy use worldwide, and 44.8% of the total energy use in the year of 2006/07. As India being the second Largest cement producers in the world after China it consumed 13.5% of the total industrial energy in the year of 2006-2007. (Thirugnanasambanda and Hasanuzzaman, 2011)
Production of cement clinker using limestone and chalk by heating limestone at temperature above 950°C demands most of the energy. Clinker production emits CO2 as a by-product when calcination of limestone takes place. Indian cement industry is highly advanced compared to other countries as they have achieved the best level of specific energy consumption in both thermal energy and electrical energy, while having 680kcal/kg of clinker (2.85GJ/ton clinker) and 66kWh/tonne of cement as their best achieved number. (Confederation of Indian Industry, 2013)
1.3 Aim and Objective
The main aim of this project is to investigate the energy and material efficiency of cement industry in India.
Objectives of the research;
- To conduct a review of historical and current data on energy and material efficiency in the cement industry in India.
- To Choose top 5 companies that produces cement in India.
- To Collect performance data such as Annual power consumption and annual cement production by those plants.
- To analyse and compare the indications of energy and material efficiency in cement industry in India.
- To research about the safety and health across the industry.
- Based on analysis of indicators propose recommendations for Cement industry in India.
This report reviews the main manufacturing process and the use of latest technologies in Indian cement sector. An overview of the current industry structure, regulation, production, import and export status are reviewed.
2.0 Cement industry India
2.1 Manufacturing Process
Cement manufactured at thousands of plants, the industry is worldwide where international firms account for only 30% of the worldwide market (European commission, 1997). The most vital market for cement is the construction industry where its combined with water to make concrete. Manufacturing industries use up to one third of global energy use. CO2 emissions amount released from direct industries is up to 6.7 (Gt) which is about 25% of total worldwide emissions of which 30% comes from the iron and steel industry, 27% from non-metallic minerals (mainly cement) and 16% from chemicals and petrochemicals productions(IEA,2008). Cement production requires heating, calcining and sintering of blended and ground materials to form clicker. Which causes CO2 to be produced in a large quantity due to the production of lime, which is the key ingredient in cement.
2.1.1 Stage 1 – Blasting Process;
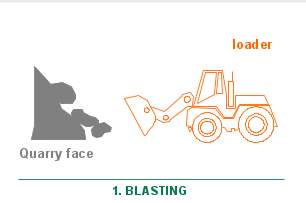
Figure 3-Blasting( Cement manufacturing process 2016)
The raw materials that are needed to produce cement such as Limestone and clay are blasted from the quarry. Quarying done through drilling, blasting and using heavy earth moving equipment such as bulldozers and dump trucks.
2.1.2 Stage 2 – Transport of Raw Material;
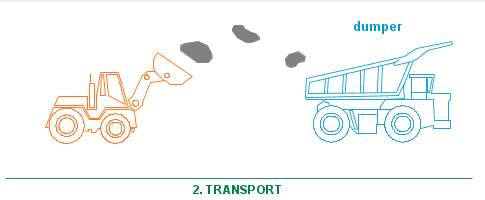
Figure 4-Transport( Cement manufacturing process 2016)
The collected raw materials are loaded into a dumper and transported to the factory where it goes through the next stage. Limestone supplies CaCO3 for the cement production where Silica, Alumina, and Iron are considered to be other raw materials. The typical limestone used in cement production has 75-90% CaCO3 in a raw feed. The reminder is magnesium carbonate (MgCO3)and impurities. The lime and silica provides the main strength to cement where as the iron reduces the reaction temperatue and gives the cement its characteristics grey colour.
2.1.3Stage 3 – Crushing and Transportation;
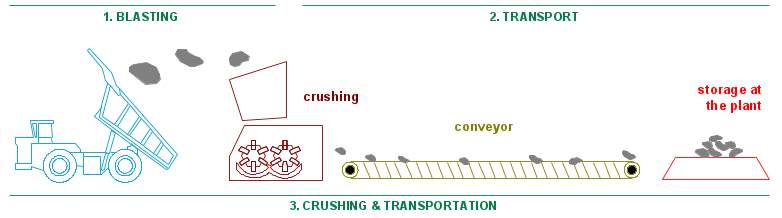
Figure 5-Crushing and Transportation( Cement manufacturing process 2016)
The raw materials then taken to the cement factory where the raw materials get crushed and transported to the plant by conveyor. Then the materials are stored before they are homogenized. The limestone size is reduced to 25mm buy feeding into a primary and secondary crusher. A further reduction in the inlet size can be made by passing it through a tertiary crusher. In the storage hopper some iron, bauxite, quartzite and silica to achieve the required raw feed compositions. These materials can be stored in silos or hoppers. These additives prevent any natural deviation from compositions of raw materials.
2.1.4 Stage 4 – Raw Grinding process;
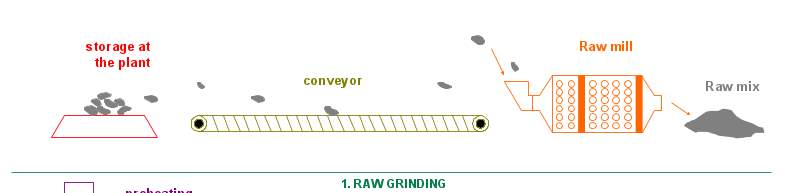
Figure 6-Raw Grinding( Cement manufacturing process 2016)
The stored materials then go through the raw mill where they are finely grounded to produce raw mix. A ball mill or vertical roller mill (VRM) are used during a grinding process. The raw mix is dried using the part of the excess heat from the kiln in this stage. Various sizes of balls are used inside the ball mills. The larger sized balls are used for impact grinding and the smaller balls for attrition grinding. A compression principle is used to grind the raw materials in a VRM grinding process. The choice between a ball mill is depend on the moisture content of the raw material, the size of the plant, the abrasiveness of the material, the energy consumption levels, reliability and economic viability.
2.1.5 Stage 5 Burning Process;
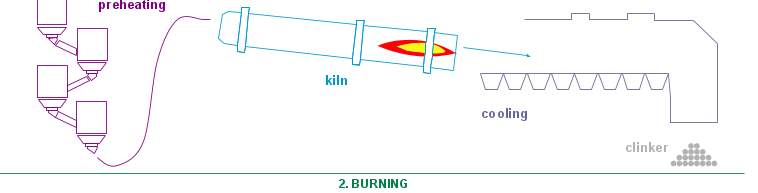
Figure 7-Burning( Cement manufacturing process 2016)
At the core of the production process is a rotary kiln where limestone and clay are heated to approximately 1450°C. the semi-finished product clinker is created by sintering or heating it until it coalesces into solid material. The flame can be produced by powdered materials such as coal, petroleum coke or by natural gas. To reduce the natural chemical variation in the various raw materials, it is necessary to blend and homogenize the raw material efficiently. Increasing the relative proportion of blending additives may reduce the amount of clinker used. This consequently will reduce the specific energy consumption of the final product. Latest pre heater towers contain a combustion chamber. This chamber is commonly known as pre-calciner, in this stage the raw materials are calcined to produce CO2.
2.1.6 Stage 6 – Grinding Process;
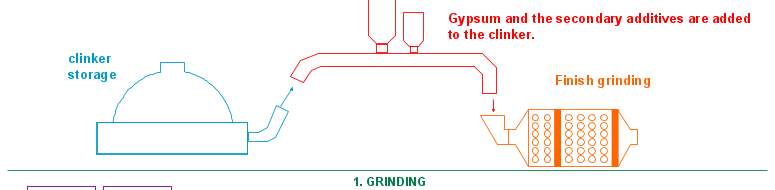
Figure 8-Grinding( Cement manufacturing process 2016)
The collected clinker is then added with Gypsum and grinded to a fine product traditional Portland cement. Other secondary additives and cementitious materials can also be added to make a blended cement.
2.1.7 Stage 7 Storage, Packing and Dispatch Process;
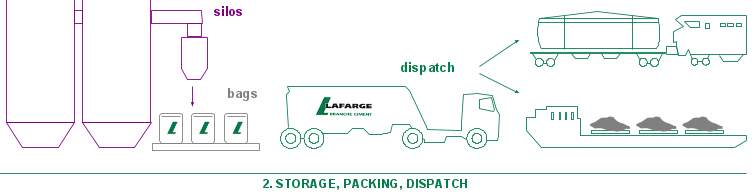
Figure 9-Storage,Packing and Dispatch( Cement manufacturing process 2016)
The grounded cement is then stored in silos before being dispatched in bulk or in bags where they can be used for building and other purposes.
2.2 Impacts on environmental and health from cement and lime manufacturing
Manufacturing cement and lime causes a lot of environmental and health issues which primarily include the following:
2.2.1 Air emissions – Air emissions are generated in many forms in a cement industry. Handling, storage of intermediate, operation of kiln systems, clinker coolers and mills where they can mostly be generated. Particulate Matter emissions(PM) has most impacts of cement and lime manufacturing. Particulate Matter emissions develop from intermediate and finial material handling such as crushing and grinding of raw materials. They can also be found in handling and storage of solid fuels.
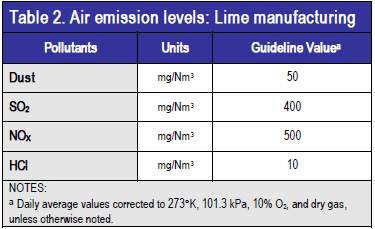
Figure 10 Air Emission Levels : Lime manufacturing (IFC, 2007)
- Dust is produced when fine particulates is associated with work in most of cement and lime manufacturing, and most importantly quarry operation, raw material handling and clinker / cement grinding. Exposure to active (crystalline) silica dust(SiO2) when present in the raw materials.
- Nitrogen oxide (NOx) emissions are generated in the high temperature combustion process of the cement kiln.
- Sulphur dioxides (SO2) emissions in cement manufacturing are primarily associated with the content of volatile or reactive sulphur in the raw materials.
2.2.2 Energy consumption and fuels- cement and lime manufacturing are energy intensive industries where electric energy and fuel costs can be 40%-50% of total production costs. Production of cement clinker involves the use of dry process kiln with multistage preheating and precalcination (PHP kilns). PHP kilns have the lowest heat consumption due to the high heat recovery from kiln gas in the cyclones, and low kiln heat losses. Long dry (LD), semidry, semi wet, and wet process kilns are known to be more energy consuming. The most commonly used fuel in the cement industry is pulverized coal (Black coal and lignite) where the lower cost of petroleum coke (Pet-coke) has resulted in increased use of this fuel type. Coal and pet-coke generate higher emissions of greenhouse gases than fuel oil and natural gas.
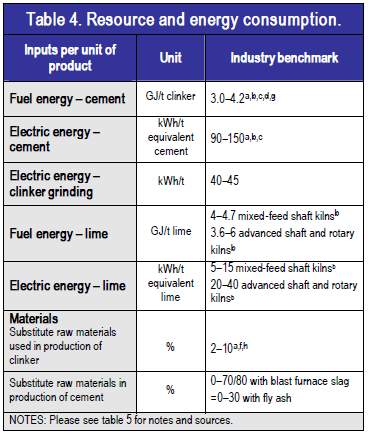
Figure 11( Environmental, health and safety guidelines 2007)
2.2.3 Solid wastes- sources of solid waste in cement and lime manufacturing include clinker production waste mainly consumed from spoil rocks which are removed from the raw materials during the raw preparation. Another form of waste stream involves the kiln dust removed from the bypass flow and the stack when it’s not recycled in the process. Other waste materials which can be produced during the process may include alkali or chloride/fluoride containing dust build up from the kiln.
2.2.4 Noise- Noise pollution is produced during cement and lime manufacturing phases including raw material extraction, grinding and storage. Whilst from the operation of exhaust fans.
2.2.5 Physical hazards- injuries during the manufacturing operations are related to slips, trips and falls. Activities related to maintenance of equipment, including crushers, mills, mill separators, fans, coolers, and belt conveyors represents a significant source of exposure to physical hazards.(IFC, 2007)
2.3 Material and energy flow diagram: Dry process
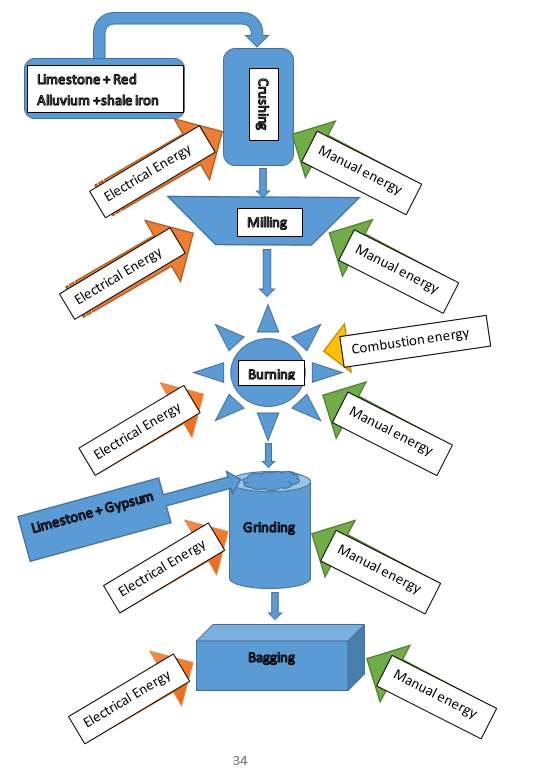
Figure 12 Material and Energy flow diagram: Dry process
Dry process involves limestone, chalk and clay are crushed into gyratory crusher to get 2-5cm size pieces. The crushed particle then ground to get fine particles, then each material screened and then stored in a separate hopper. The powder is mixed using required proportions to get dry raw mix which is then stored in silos. Its kept in silos till it’s ready to be transferred into the rotary kiln. Raw materials are mixed using required proportions which ensures that average composition of the final product is maintained properly.
2.3.1 Material and energy flow diagram: Wet process
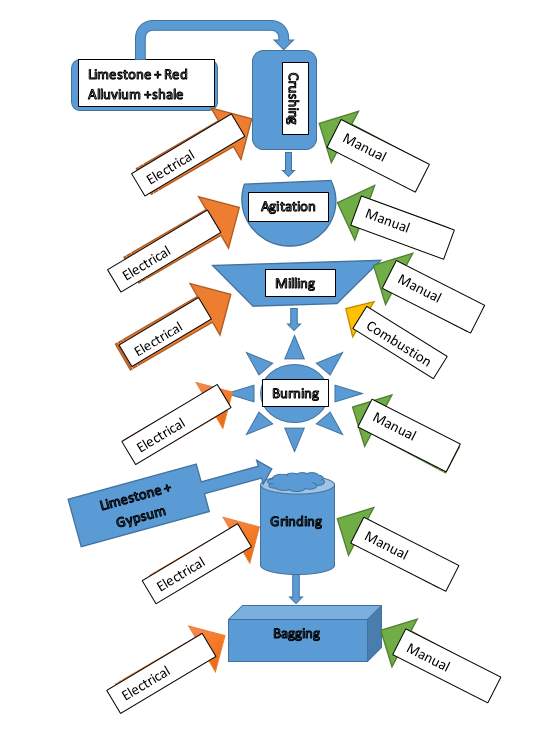
Figure 13 Material and Energy flow diagram: Wet process
During wet process the raw materials are crushed, powdered and stored in silos. In order to remove adhering organic, matter the clay is washed with water in wash mills. The washed clay is then stored separately. Slurry is then formed by powdered limestone and wet clay are made to flow in channel and transfer to grinding mills where they are mixed. 38-40% water stored in slurry, stored in storage tanks where they kept ready to be transferred into rotary kiln.
2.3.2 Comparison of Dry and wet process
| Criteria | Dry Process | Wet process |
| Fuel consumption | Low | High |
| Process time | Less time | More time required |
| Quality | Inferior quality | Superior Quality |
| Overall cost | High | Less |
| Physical state | Raw mix, solid | Slurry, liquid |
Figure 14 Existing and Potential Technologies for Carbon Emissions Reductions in the Indian cement industry 2013
2.4 Types of cement produced
Ordinary Portland cement (OPC)- 70% of Cement produced are this type of cement and they are sold in 3 grades as follows; 1. Grade 33, 2. Grade 43, 3. Grade 53. The grades are normally printed on the cement bags.
Portland pozzolana cement (PPC)- This type of cement is being widely used in India, it’s made by blending 10-25% pozzolana like flyash or others like calcined clay mixed with ordinary Portland cement.
Sulphate resisting Portland cement (SRPC/SRC)- Small quantity of this kind of cement is produced in India. This type of cement is a special OPC with less than 5% Tricalcium Aluminate (C3A).
Portland blast furnace slag cement or Portland slag cement (BFSC or PSC)– 10% of this type of cement is produced in India where the slag mixtures are 25%-60%. The blast furnace slag is produced from cast Iron where every ton of cast iron can produce up to 0.3tons of iron cast. Blast furnace slag cements that contains more than 50% of slag has good sulphate resistance.
Hydrophobic Cement- This type of cement is made by grinding the cement clinker with water repellent film which forms into a substance like oleic acid, this water repellent film forms around the cement particles while manufacturing process takes place. Formed water repellent prevents cement from setting during storage.
Until around 1973 Grade 33 is the only cement which was available in India, however with the help of improved technology, Indian cement industry started to produce more grades of cements as follows;
- Grade 33 as per IS 269 (1989)-C 33
- Grade 43 as per IS 8112 (1989) C 43
- Grade 53 as per IS 12236 (1987) C 53
- Sleeper cements as per IRS-T40-85 (Varghese, 2015)
| Concrete type | Amount of Cement (Kg/mᶾ) | Fly ash (Kg/mᶾ) | MFGG BS/SF/MK (Kg/mᶾ) | Aggregate (kg/mᶾ) (20mm) | Aggregate (kg/mᶾ) (20mm)2 | Sand (Kg/mᶾ) | Water (Kg) | W/Binder |
| Ref. mix (OPC) | 430 | 0 | 0 | 546 | 546 | 728 | 149 | 0.35 |
| OPC+FA+M FGGBS/SF/MK | 280 | 108 | 43 | 546 | 546 | 728 | 149 | 0.35 |
 (OPC)– Ordinary Portland cement
(PPC)- Portland Pozzolana cement
(PSC)- Portland Slag cement
(LCᶟ)- Limestone Calcined Clay cement
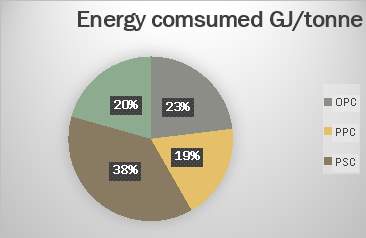
Figure 15 Energy consumption level from different types of cement (Gettu, Patel and Rathi, 2016)
Figure 15 shows that PSC requires 38% of energy when compared to other kind of cements that are mentioned above. This is due to the energy demand for the process quenching/granulation, grinding, and energy needed when storing in silos. Portland pozzolana cement uses less energy consumption of 2.32 GJ/tonne.
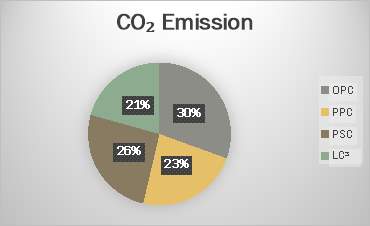
Figure 16 Types of cement produced in India and the level of CO2 Emissions (Gettu, Patel and Rathi, 2016)
Ordinary Portland cement (OPC) is the leading cement, it’s made of compounds produced from burning limestone and clay together using a rotary kiln at the temperature 1450°C. Almost 40% of CO2 is produced during burning of fossil fuel to operate the kiln, other 50% is produced manufacturing process and the remaining 10% of CO2 is produced from transporting products.
2.5 Energy intensive
Cement industry is very energy intensive and involves chemical combination of calcium carbonate (Limestone), Silica, Alumina, Iron ore and small amount of other materials. Cement production involves quarrying, preparing raw materials and production of clinker through heating the materials through massive rotary kilns at high temperature. (Schumacher and Sathaye, 1999)
Theoretical heat requirements for clinker making and the main substance of cement is calculated to be about 1.75 ± 0.1 MJ per kg (taylor,1992). Cement production consist of different processes such as Wet process, Semi wet process, Semi dry, Lepol process and Dry Process. During the production of clinker two types of kilns are distinguished such as rotary kilns and shaft kilns.
| Energy use | Rotary Kilns (Wet ) | Rotary Kilns (Lepol) | Rotary Kilns (long dry) | Short dry kiln |
| Fuel use (MJ/kg) | 5.9 | 3.6 | 4.2 | 2.9-3.4 |
| Power use (kWh/kg) | 0.025 | 0.03 | 0.025 | 0.022 |
| Primary energy (MJ/kg) | 6.2 | 3.9 | 4.5 | 3.5-3.7 |
Table 1 summary table of the main energy use (MJ per kg) (C.A et al., 2004)
During cement manufacturing Carbon dioxide emissions comes directly from combustion of fossil fuels and from calcining the limestone in the raw mix. There’s an indirect and smaller amount of CO2 is released from consumption of electricity which is also generated from fossil fuels. Roughly 50% of the CO2 emitted is from fuel and the other 50% originates from the conversion of the raw material.
During calcining CO2 is formed which can be expressed as:
CaCOз+Heat=CaO+CO₂
Cement production is responsible for almost 5% of the total global CO2 emissions. ((Gorbatenko and Sharabaroff, 2014)
Different cement plants use different fuels however in most countries the primary fuel is coal because its cheap and coal ash adds necessary minerals to the cement product.
3.0 Methodology
3.1 Indicators
Cement industry in India plays a major part in Indian economy by having more than one million people working on it, this has made Indian cement industry the second largest in the world (IBEF, 2015). By 2011 Indian cement industry has installed capacity of 300 tonnes by 2011 and expecting to increase to 600 million tonnes by 2020. (Confederation of Indian Industry, 2013). When installing capacity 99% dry process has been used. Indian cement industry has also been adopting to latest technologies for energy and material efficiency.
The greatest level achieved by the Indian cement industry is at about 680kcal/kg clinker, (2.85GJ/ton clinker) and used 66kWH per tonne cement.(Confederation of Indian Industry, 2013) However Indian cement industry also uses plants which are installed before the 1990’s which tend to operate using higher energy consumption level. In order to improve the situation Cement industry in India have been retrofitting new technologies to minimize those plants energy consumption level closer to the best achieved level.
The cement sector is one of the largest emitter of greenhouse gas CO2, however the Indian cement industry has been putting efforts towards emissions control, preservation of ecology and voluntary initiatives such as corporate responsibility for environmental protection (CREP). Moreover, the industry tries to reduce carbon footprint by adopting the best available technologies and environmental practices which has been reflected in the achievement of reducing CO2 emissions to an industrial average of 0.719 tonne CO2 per tonne of cement produced which is quite a lot compared to CO2 produced on 1996 which is about 1.12 tonne. (Confederation of Indian Industry, 2013)
IC is used as energy consumption indicator using the ratio between consumed energy and the value of production obtained using that energy. For energy analysis in Cement production in India specific energy consumption(SEC) is used and it is defined as;
- Specific Energy ConsumptionSEC=Energy Consumption (kWh)Production (tonne) (1)
Cement plant in India consists of Electrical energy and thermal energy. Best Indian cement plant’s Average specific energy consumption (SEC) for electrical energy is 63kWh/T of cement and average specific energy consumption (SEC) for thermal energy is 663kCal/kg of Clinker. (Anamika, Yogesh and Shammi, 2004)
- Final energy consumption=Thermal energykCal+(Electrical energykWh*860kCalkWh) (2)
Note: 1 kWh of electric energy is equivalent to 860 kCal of heat. (Rosillo-Calle, De Groot and Hemstock, 2006)
Energy consumption can vary depending on the technology that has been used in cement manufacturing. Dry process of cement manufacturing uses more electrical energy and less thermal energy when compared to Wet process. Around 29% of the expense is spent on energy, 27% spent on raw materials, 32% spent on labour and 12% on depreciation. (Schumacher and Sathaye, 1999).
3.1.1 Steps taken to conduct the analysis:
Step 1: Collection of energy consumption data in cement plants, India.
Step 2: Calculation of specific energy consumption for each selected Indian cement plants.
Specific Energy ConsumptionSEC=Energy Consumption (kWh)Production (tonne)
Step 3: When data is missing for some year, data has been interpolated assuming the variation is linear between the years.
Step 4: Plot specific energy consumption for the selected 5 Indian cement plant.
Step 5: Calculation of final energy consumption using thermal energy and electrical energy consumption.
Final energy consumption=Thermal energykCal+(Electrical energykWh*860kCalkWh)
Step 6: Plot Final energy consumption for the years of data collected and compare the trend.
3.2 Data collection
94% of the thermal energy is satisfied by coal in Indian cement industry. The rest of the energy used is met by fuel oil and high speed diesel oil. Due to power cuts and interruption of power affects the industry in a negative way causing production losses, low capacity utilization, thermal losses while reheating etc. In 1993, 974 GWh of electricity produced onsite (Government of India, Annual survey of industry, 1993). Due to insufficient data availability for Indian cement industry makes the energy analysis challenging.
NOTE: Electrical energy consumption of cement manufacturing is estimated using the electrical energy consumed per tonne of cement produced. Thermal energy is estimated using thermal energy consumed per tonne of clinker.
| year | Electrical energy (GWh) | Thermal energy (Million GJ) | Clinker (MT) |
| 2010 | 3822 | 294.29 | 98.1 |
| 2011 | 4173.6 | 321.37 | 107.12 |
| 2012 | 4555.6 | 350.9 | 116.98 |
| 2013 | 4976.9 | 383.22 | 127.74 |
| 2014 | 5434.77 | 418.48 | 139.49 |
| 2015 | 5934.77 | 456.98 | 152.33 |
| 2016 | 6480.77 | 499.02 | 166.34 |
Table 2 Projection of thermal energy, electrical energy and clinker production
Table 3. Specific Energy consumption for Ultra Cement, India
| Year | Ultra tech cement- Annual power consumption (kWh) | Ultra tech cement- Annual cement production(MT) | Specific energy consumption (SEC) (kWh/MT) |
| 2004-2005 | 87 | 12.1 | 7.190082645 |
| 2005-2006 | 89 | 19.9 | 4.472361809 |
| 2006-2007 | 87 | 14.6 | 5.95890411 |
| 2007-2008 | 85 | 15.1 | 5.629139073 |
| 2008-2009 | 85 | 15.9 | 5.34591195 |
| 2009-2010 | 83 | 17.6 | 4.715909091 |
| 2010-2011 | 82 | 32.9 | 2.492401216 |
| 2011-2012 | 81 | 39.4 | 2.055837563 |
Table 3 (Salgaonkar, Dasgupta and Srinivasan, 2013)
Table 4. Specific Energy consumption for Acc Limited, India.
| Year | ACC Limited- Annual power consumption (kWh) | Acc Limited- Annual cement production(MT) | Specific energy consumption (SEC) (kWh/MT) |
| 2004-2005 | 86 | 16.9 | 5.088757396 |
| 2005-2006 | 88 | 12.9 | 6.821705426 |
| 2006-2007 | 88 | 18.7 | 4.705882353 |
| 2007-2008 | 89 | 19.9 | 4.472361809 |
| 2008-2009 | 87 | 20.8 | 4.182692308 |
| 2009-2010 | 85 | 21.4 | 3.971962617 |
| 2010-2011 | 87 | 21.4 | 4.065420561 |
| 2011-2012 | 84 | 23.6 | 3.559322034 |
Table 4 (Salgaonkar, Dasgupta and Srinivasan, 2013)
Table 5. Specific Energy Consumption for Ambuja Cements Ltd, India.
| Year | Ambuja Cement Ltd- Annual power consumption (kWh) | Ambuja Cement Ltd- Annual cement production(MT) | Specific energy consumption (SEC) (kWh/MT) |
| 2004-2005 | 84 | 10.4 | 8.076923077 |
| 2005-2006 | 0 | 12.8 | 0 |
| 2006-2007 | 86 | 22.6 | 3.805309735 |
| 2007-2008 | 84 | 16.9 | 4.970414201 |
| 2008-2009 | 86 | 17.8 | 4.831460674 |
| 2009-2010 | 86 | 18.8 | 4.574468085 |
| 2010-2011 | 86 | 20.1 | 4.278606965 |
| 2011-2012 | 85 | 21 | 4.047619048 |
Table 5 (Salgaonkar, Dasgupta and Srinivasan, 2013)
Table 6. Specific Energy Consumption for India Cements Limited, India.
| Year | India Cements Limited – Annual power consumption (kWh) | India Cements Limited- Annual cement production(MT) | Specific energy consumption (SEC) (kWh/MT) |
| 2004-2005 | 125 | 5.5 | 22.72727273 |
| 2005-2006 | 130 | 7.3 | 17.80821918 |
| 2006-2007 | 130 | 8.4 | 15.47619048 |
| 2007-2008 | 89 | 9.2 | 9.673913043 |
| 2008-2009 | 91 | 9.1 | 10 |
| 2009-2010 | 93 | 10.5 | 8.857142857 |
| 2010-2011 | 93 | 10 | 9.3 |
| 2011-2012 | 92 | 9.5 | 9.684210526 |
Table 6 (Salgaonkar, Dasgupta and Srinivasan, 2013)
Table 7. Specific Energy Consumption for Madras Cements Limited, India.
| Year | Madras Cements Limited – Annual power consumption (kWh) | Madras Cements Limited- Annual cement production(MT) | Specific energy consumption (SEC) (kWh/MT) |
| 2004-2005 | 72 | 3.8 | 18.94736842 |
| 2005-2006 | 72 | 4.7 | 15.31914894 |
| 2006-2007 | 73 | 5.7 | 12.80701754 |
| 2007-2008 | 78 | 5.8 | 13.44827586 |
| 2008-2009 | 79 | 6.5 | 12.15384615 |
| 2009-2010 | 83 | 8 | 10.375 |
| 2010-2011 | 83 | 7.3 | 11.36986301 |
| 2011-2012 | 78 | 7.5 | 10.4 |
Table 8. Annual Coal Consumption for those five selected Cement plants, India.
| Year | Ultratech Cement – Annual Coal consumption (GJ) | ACC Limited – Annual Coal consumption (GJ) | Ambuja Cement Limited – Annual Coal consumption (GJ) | India Cements Limited – Annual Coal consumption (GJ) | Madras Cements Limited – Annual Coal consumption (GJ) |
| 2005-2006 | 0 | 0.00309 | 0.00299 | 0 | 0.00005 |
| 2006-2007 | 0 | 0.00308 | 0.00306 | 0 | 0.00005 |
| 2007-2008 | 0 | 0.00315 | 0.0031 | 0.00007 | 0.00006 |
| 2008-2009 | 0 | 0.00316 | 0.00311 | 0.00007 | 0.00006 |
| 2009-2010 | 0.00297 | 0.00312 | 0.00316 | 0.00007 | 0.00006 |
| 2010-2011 | 0.00296 | 0.00314 | 0.00314 | 0.00007 | 0.00006 |
| 2011-2012 | 0.00298 | 0.00311 | 0.00309 | 0.00007 | 0.00005 |
Note: When the values have been converted to Gigajoules from Kilocalorie the answer is rounded up 5d. p
4.0 Data Analysis and Comparison
The collected data in chapter 3 has been analysed as per the methodology steps mentioned in section 3.1. the results are discussed and compared for cement sector in India.
4.1 Energy efficiency in Indian cement industry
Total amount of cement produced by the company Ultra Cement is shown in figure 12. Power consumption from 2004-2012 has been collected and plotted on the graph below. Power consumption in Cement production means the amount of electrical energy is supplied to operate an electrical appliance, in this case the power consumption indicates the amount of electrical energy used to make Cement in Ultra Cements India. Grey area represents the specific energy consumption which has been worked out using (SEC) as explained in chapter 3.1. Annual Power consumption was high during 2005-2006 using up to 89kWh and the lowest amount of power consumed during 2011-2012 using up to 81kWh. This change is due to the improvements in machineries that has been used.
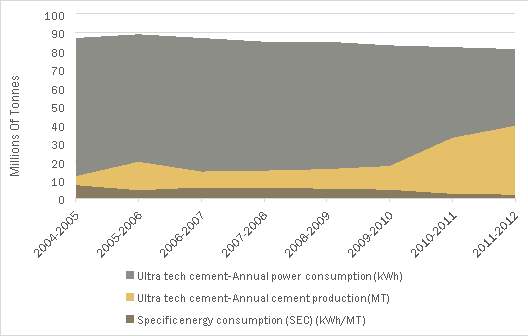
Figure 17 Specific Energy consumption for Ultra Cement.
Annual Cement production and the power consumption for ACC limited is shown on the graph below. The highest power consumed by ACC limited is 89kWh during 2007-2008 where the annual cement production for that time period was 19.9MT. However, when comparing to the results obtained during 2011-2012 only 84kWh power consumed and 23.6MT of cement produced having the lowest energy consumption of 3.559 kWh/MT.
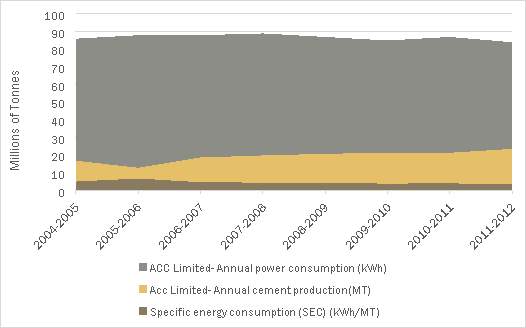
Figure 18 Specific Energy Consumption for Acc Limited.
Annual power consumption for Ambuja cement during year 2005-2006 left blank due to unavailability of data. The lowest power consumed by Ambuja Cement is during 2004-05 and 2007-2008 where they have used 84kWh and produced 10.4 and 16.9MT of cements. The lowest specific energy consumed was during 2006-2007 with (SEC) 3.805kWh/MT.
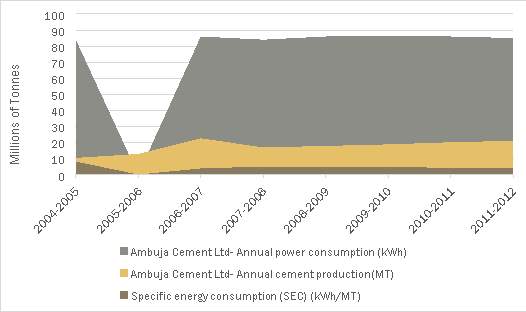
Figure 19 Specific Energy consumption for Ambuja Cement Limited
India Cements limited has a higher power consumption compared to the other plants that’s mentioned above. The highest amount of power consumed is during 2005-2006 and 2006-2007 where they consumed 130kWh of power and produced 7.3 and 8.4MT cement. Specific energy consumption (SEC) for the mentioned time periods were 17.808kWh/MT and 15.476 kWh/MT. which is fairly high compared to other plants.
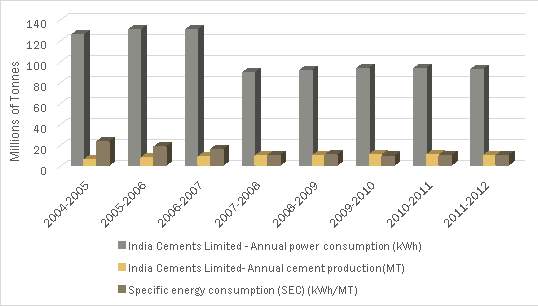
Figure 20 Specific Energy Consumption for India Cements Limited
The highest specific energy is consumed by Madras Cements during 2004-2005 having 18.947 kWh/MT where the company has produced only 3.8MT of cement while using 72kWh of power. Madras cement seems to have improved their energy efficiency since and the results can be seen during the production in 2011-2012 where the specific energy consumption is reduced to 10.4kWh/MT.
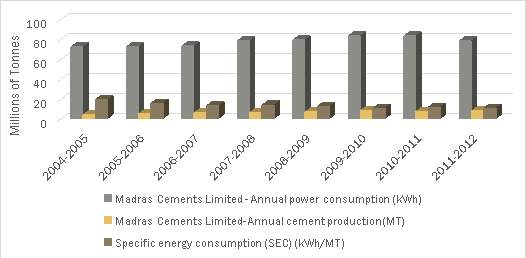
Figure 21 Specific Energy Consumption for Madras Cements Limited
4.1.1 Annual Coal consumption by the cements plants, India
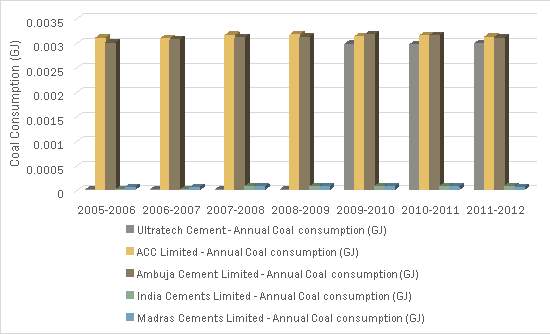
Figure 22 Annual Coal Consumption for Five Selected Cements plants, India.
One of the main fuel for burning Portland Cement is clinker coal. Cement industry in India uses up to 3.5 to 4.0 million tons of coal a year, (Mohan, 1969). ACC Limited and Ambuja Cement had the most Coal consumption compared to other Cement companies that’s mentioned on the graph above. Data for Ultratech cement is not found between 2005-2008 which is left empty hence it’s not shown on the graph. However, since 2009-2012 coal consumption by them kept below 0.003 (GJ).
There are six major varieties of coal which have been used in India known as Raniganj, Jharia, Talcher, Assam, Kutch Lignite and Neyveli Lignite coals. Raniganj, Jharia and Assam coals are good varieties of Indian coal which have high carbon and low ash content. (SAWHNEY and Verma, 1989)
4.2 Comparison
Specific energy consumption for all five different cements plants are compared for year 2004 – 2012.
| Year | Ultra Cements (SEC) KWh/MT | Acc Cements (SEC)KWh/MT | Ambuja cements (SEC) KWh/MT | India Cements (SEC) KWh/MT | Madras Cements (SEC) KWh/MT |
| 2004-2005 | 7.190082645 | 5.088757396 | 8.076923077 | 22.72727273 | 18.94736842 |
| 2005-2006 | 4.472361809 | 6.821705426 | 0 | 17.80821918 | 15.31914894 |
| 2006-2007 | 5.95890411 | 4.705882353 | 3.805309735 | 15.47619048 | 12.80701754 |
| 2007-2008 | 5.629139073 | 4.472361809 | 4.970414201 | 9.673913043 | 13.44827586 |
| 2008-2009 | 5.34591195 | 4.182692308 | 4.831460674 | 10 | 12.15384615 |
| 2009-2010 | 4.715909091 | 3.971962617 | 4.574498085 | 8.857142857 | 10.375 |
| 2010-2011 | 2.492401216 | 4.065420561 | 4.278606965 | 9.3 | 11.36986301 |
| 2011-2012 | 2.055837563 | 3.559322034 | 4.047619048 | 9.684210526 | 10.4 |
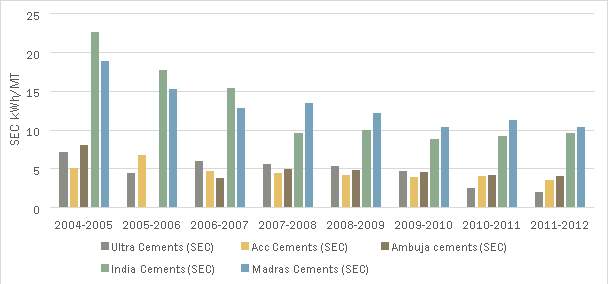 Figure 23 SEC for selected Cement plants, India
Figure 24 SEC for Selected Cement plants, India
From figure 22, it is observed that the India cements had the highest specific energy consumption during 2004-2007 compared to other cement plants that are mentioned on figure 22. During the period, 2005-2006 India cements had their highest SEC of 17.808 KWh/MT. This is due to having 130KWh power consumed in that period while 7.3MT of cement produced.
5.0 History
India is the second largest cement producers in the world, having 130 large cement plants, 206 mini cement plants comprising with 13 rotary kiln plants and 193 vertical shaft kiln plants. Indian cement industry has large cement companies such as Holcim, Lafarge, ACC, Ambuja Cement and Lafarge Birla Cement. (Thirugnanasambanda and Hasanuzzaman, 2011). Indian Cement industry is broadly home-grown while having the country’s largest firm producing 22% of the domestic market called Ultratech Cement, with ACC (50% owned by Holcim) and Ambuja (50% owned by Holcim) while having 15% and 13% shares respectively.
Other top players are respectively Jaiprakash Associates (10%), The India Cements Ltd (7%), Shree Cements (6%), Century Textiles and Industries(5%), Lafarge(5%), Birla Cement(4%) and Binani Cement(4%).(G.C.M, 2013).
The per capita consumption of cement in India is 125kg which is a third of the world average. Production of cement rose from 23.5 m.t in 1983 to 44.1 m.t in 1989 and as of march 2007 the installed capacity of the cement industry produced up to 160 m.t. between 2005- 2006 four of the top five cement companies of the world entered into India through either mergers, acquisitions, joint ventures or green field projects. These include France’s Lafarge, Switzerland’s Holicm, Italy’s Italcementi and Germany’s Heidelberg cement. (Kumar, 2013)
As the growth in housing and infrastructure started to increase the demand for cement increased significantly which helped the cement industry to grow remarkably. The table below shows the collected data from the period of 1991 to 2006 of installed capacity, production and export quantity.
From the table below we can see that the clinker capacity and cement production in India are near enough equal which shows that the clinker produced throughout the process is used to make cement, reducing clinker wastes. Over 2012-2013 the clinker capacity stayed the same where cement production in India increased from 270Mt to 280Mt showing 1.85% growth rate annually. (Gorbatenko and Sharabaroff, 2014)
| year | Installed capacity (m.t.) | production (m.t.) | Exports (m.t.) |
| 1991-92 | 66.56 | 53.61 | 0.29 |
| 1992-93 | 70.09 | 53.72 | 0.67 |
| 1993-94 | 76.88 | 57.96 | 1.99 |
| 1994-95 | 82.69 | 62.35 | 1.7 |
| 1995-96 | 97.25 | 69.57 | 1.57 |
| 1996-97 | 105.25 | 76.22 | 1.97 |
| 1997-98 | 109.3 | 83.16 | 2.68 |
| 1998-99 | 118.97 | 87.91 | 2.06 |
| 1999-00 | 119.1 | 100.45 | 1.95 |
| 2000-01 | 130.4 | 97.61 | 3.15 |
| 2001-02 | 146.13 | 108.4 | 3.38 |
| 2002-03 | 151.17 | 116.35 | 3.47 |
| 2003-04 | 157.48 | 123.5 | 3.36 |
| 2004-05 | 164.69 | 133.57 | 4.07 |
| 2005-06 | 160.24 | 141.81 | 6.01 |
Figure 25 Indian Cement Installed capacity (m.t) and their production (m.t) during 1991-2006. (IFC,2014)
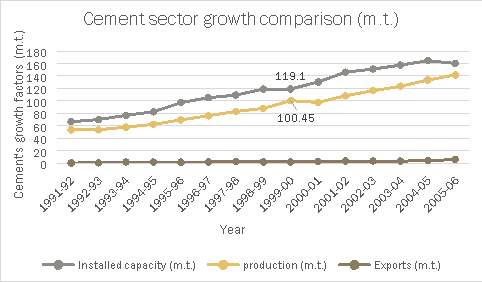
Figure 26 Cement sector growth India 1991-2006
During 1996 Indian cement industry used to in fourth position in terms of their production following China, japan and the USA, and today they have improved their production with almost 390 million tonnes (MT) of cement production capacity making them the second largest in the world today after China.
4.1 Prices and Viability
In India cement prices have been subject to government control, under the dual pricing policy instituted in 1982. Cement units (other than mini plants) are required to sell a specified portion of their output at a fixed price. Where a remainder may be sold at the open market price. A system of freight equalization operates in a manner to ensure a uniform levy price throughout the country, theoretically compensating the regions furthest from cement plants for additional transport costs involved. The bulk of the levy cement allocations serve to meet the requirements of central and state government. The levy cement retention price (i.e. price ex-factory net of taxes and packing) was fixed at RS 339/tonne in 1982.
The net profit margin increased from 9.2% to 17.3% during 2006-2007 (Thombre, 2007)
| Year | Operating profit (Rs.Million) | Net worth (Rs. Million) |
| 1991-1992 | 9606 | 13466 |
| 1992-1993 | 5430 | 15404 |
| 1993-1994 | 5253 | 20136 |
| 1994-1995 | 9752 | 35335 |
| 1995-1996 | 15803 | 48478 |
| 1996-1997 | 10068 | 50920 |
| 1997-1998 | 5206 | 52381 |
| 1998-1999 | 6877 | 37277 |
| 1999-2000 | 5212 | 40131 |
| 2000-2001 | 9572 | 41311 |
| 2001-2002 | 12985 | 36528 |
| 2002-2003 | 6892 | 31838 |
| 2003-2004 | 9126 | 33084 |
| 2004-2005 | 17491 | 57199 |
| 2005-2006 | 20115 | 65779 |
Figure 27 Operating profit and Net worth of Indian cement company 1991-2006
Note: 1 Million Indian rupees is equal to £120,66.890.
According The Hindu news, the price of cement in Chennai (south India) has reached to Rs. 400 for 50kg of cement. Whereas its old for Rs. 260 a bag in North India. (Manikandan, 2015) Reason for the increase in price is because of the marginal decline in demand and the average cement operating rates in the region is around 60% during 2011-2012 in south India.
| Expenses (Rs) | 2010 | 2011 | 2012 | 2013 | 2014 |
| Raw material | 41 | 42 | 44 | 46 | 47 |
| power and Fuel | 39 | 46 | 51 | 50 | 55 |
| Freight | 29 | 32 | 40 | 47 | 51 |
| Other Costs | 30 | 36 | 44 | 47 | 49 |
Figure 28 Indian cement expenditures between 2010-2014 (Rs.) (Salgaonkar, Dasgupta and Srinivasan, 2013)
Figure 26 shows the cost of expenses in a typical Indian cement plant however there is also other expenses such as net realisations and operating cost etc.
4.2 CO2
Calcination process of limestone from combustion of fuels in kiln as well as from power stations during cement production releases CO2. In cement industry coal constitutes a major share in the fuels. Table 2 below shows the carbon dioxide intensity for each state in each year. This carbon dioxide includes only emissions from coal combustion.
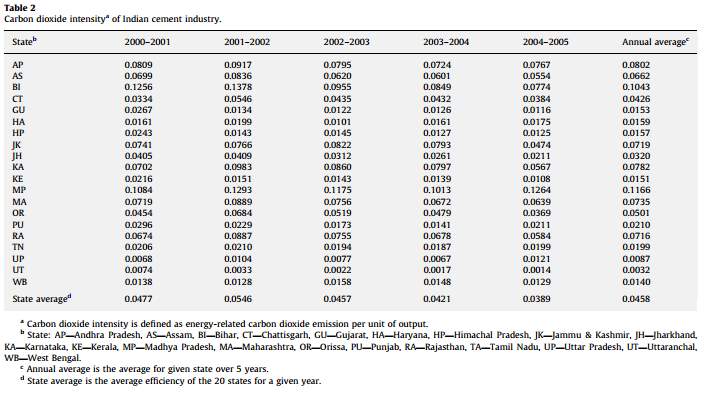
Figure 29 Carbondioxide Intensity of Indian cement industry (Kumar Mandal and Madheswaran, 2010)
The average value of carbon dioxide intensity of Indian cement industry worked out from the table is 0.0458. From the table above we can see that cement industries in Madhya Pradesh, Bihar, Andhra Pradesh, Karnataka and Maharashtra are the most carbon dioxide intensive. (Kumar Mandal and Madheswaran, 2010)
Alternative fuels and other similar measures focusing on the production facilities are of importance from an environmental perspective however they do not reduce the amount of CO2 produced. Production of Portland cement involves burning of limestone which means that a lot of CO2 is released due to calcination as well as combustion of fuels.
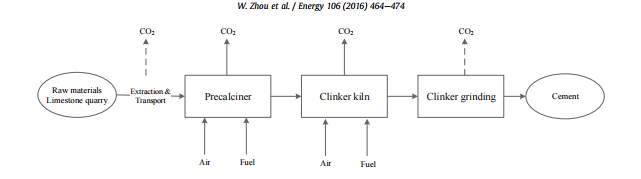
Figure 30 Inputs and outputs of the cement production (Zhou et al., 2016)
Figure 12 shows the outputs of cement production, CO2 is released from four stages of cement making Extraction and transport, Precalciner, Clinker Kiln and clinker grinding.
4.2.1 Calcination: in this step the yielded CO2 results from both fuel combustion and feedstock combustion. The CO2 found in flue gas is more concentrated than it is in conventional power plants. The largest portion of CO2 comes from this step.
4.2.2 Combustion:This type of emissions depends on the type of kilns and type of fuel used. The most widely used fuel is NSP (new suspension pre-calcination).
4.2.3 Indirect Emission:This type of emissions released from the result of generating the power used for cement production. Mainly in the production of clinker grinding. CO2 emissions can also be found from the process of extraction and transportation. (Zhou et al., 2016)
4.3 Electricity Demand
Cement production consumes a lot of energy, as India is the second largest cement producers in the world it requires consumes a lot of energy. Cement production consumes 20% of total energy consumption involving both thermal and electrical energy. Electricity is required mainly during Raw material extraction, grinding, finished grinding and packaging. During the production of cement electricity also be used on Conveyors, compressors, fans and pumps. Indian plants mainly based on the dry process as it uses about 9% less power compared to conventional wet process. Another energy saving method that’s being used in India is when the cement gets blended which consumes less power without affecting the quality.
Cement production in India uses up to 10 Billion kWh of electricity in 2005. Electricity is used to drive different motors in the plant such as compressors, fans conveyor belts, crushers etc. 60% of total electricity gets used in raw material grinding and cement grinding.
Figure 31 Amount of electricity usage by each section in Cement industry, India. (Rane,)
Producing a fine quality cement also requires a lot of electricity, in some cases improving thermal energy has led to an increase on electricity consumption. For example, grate cooler technique for cooling clinker reduces thermal energy where it requires a lot of electrical energy.
4.4 Energy saving options in Indian cement production
| Energy Saving options | Annual energy serving (GWh) |
| Automation | 5.78 |
| Additives | 1.78 |
| Optimisation | 24.19 |
| Energy Efficient lighting | 0.87 |
| Efficient motor system | 9.47 |
| Variable Speed drive | 6.42 |
| Additional Equipment | 15.32 |
| Equipment Modification & retrofits | 30.66 |
| Waste heat recovery | 23.45 |
Figure 32 Energy saving options tested in Indian cement industry (Rane,)
Figure 30 showing the energy saving options which can be applied to Indian cement industry, by having a factory automation in cement plants 5.78 GWh of energy can be saved. This is through using the available technology to monitor all the processes, control, regulation and optimisation systems.
Indian cement industry has a high potential for generation of renewable energy from different sources such as Wind, Solar, Small hydro, Biomass and cogeneration bagasse. It is estimated to have 896603 MW of potential renewable energy which can be consumed for the use in cement plants. This including Wind power potential of 102772 MW, Small hydro power of 19749 MW, Biomass power potential of 17538 MW, 500 MW which can be consumed from cogeneration in sugar mills and Solar power of 748990 MW. (Bhawan, 2016)
Cement sector has energy saving potential of 2190.3 GWh which can be achieved by choosing the right product mix. This believed to contribute 20% of the total consumption of the cement sector in 2005 and 1% of total industrial electricity consumption. (Rane,)
4.5 Alternative materials and possible improvements
Use of alternative fuels and raw material can benefit cement manufacture in various ways, such as replacing demand for fossil fuels like coal and can avoid deposits of raw material sources such as limestone, bauxite and others. Alternative fuels can also benefit on an energy basis as it can help reduce CO2 emissions at plant level. One of the main issue of using alternative fuels and materials is that the available facilities and machines should be ensured that they can handle the alternative fuels and materials in a most efficient way. Moreover, when using alternative fuels and alternative raw materials the quality controls for cement products are done carefully and the waste with recoverable calorific or material value is selected.
Several factors such as potential impacts on health and safety of workers and public, plant emissions, existing operations and final product performance are considered when choosing an alternative materials and fuels.
4.5.1 Mines
4.5.1.1 Medium and soft material: A surface miner with single stage impact crusher and wobblers can be used.
4.5.1.2 Hard material: conventional mining with two-stage crushing can be used.
Advanced mining with mine plan software can be used to reduce raw material additives, over-burden handling and enhanced mine life. Also Overland conveyors are used to transport crushed limestone will benefit when transporting for a long distance between mines and plants. Installation of mobile crushers can be beneficial for productivity improvement and installing radio controlled mines machinery monitoring system for better control and optimization.
Many of the components found in raw materials and fuels such as halogens, metals, and organic compounds are identical to the components found in wastes used as alternative fuels. Chlorine can be found in raw materials such as clay and limestone and in both coal and waste derived fuels. Moreover, Alkalis (Na2O and K2O) are normally found in the raw materials such as clay or shale, where they can also be found in alternative fuels and raw materials such as fly ash and blast furnace slag. Cement production undergoes quality control system whether they are conventional or alternative.
4.6 Alternative Fuels and possible improvements
There are numerous alternative methods have been replacing the old method to ensure cement production’s energy efficiency is kept to its minimum. Some of the alternative steps has been explained below:
4.6.1 Raw Mill
Vertical Roller Mills with the latest generation classifier are being installed with mechanical recirculation system, High efficiency fans with high tension(HT) Variable frequency (VFD), automatic sampler and cross-belt analyser in the mill feed for better quality control and adaptive predictive control for mill operation for limestone with more than 5% moisture content and hardness classified as medium and soft. However, for limestone with low moisture content with less than 3% roller press with separator in finished mode can be installed with high efficiency separators and cyclones, Automatic sampler and cross belt analyser in the mill feeding for better quality control and adaptive control mill operation.(Confederation of Indian Industry, 2013)
4.6.2 Kiln and preheater system- Modern cement plant is equipped with six stage pre heaters with in-line or separate-line calciner, Kilns with volumetric loading of about 5-6.5tpd/cu.m and advanced automation system. Installation of high efficiency cyclones offers significant energy efficiency improvement opportunity in cement kilns. Six-stage preheater system offers pressure drop of about 300mmWC in latest designs. Oxygen enrichment is also an option for energy efficiency as well as increased alternative fuel utilization.
Benefits
- Low pressure drop and high efficiency cyclones
- High tension variable drive for precise control of preheater fans
- Computational fluid dynamics(CFD) studies to reduce the pressure drop and improve energy efficiency
- Installation of additional preheater stages in older kilns
- Improved insulation for minimizing radiation loss in kiln and preheater sections
- Adaptive-predictive control systems for precise control of kiln system, increased productivity and better energy efficiency.
- Online automation systems for flame control, free-lime and inlet NOx, among others
- Online thermograph scanning and triggering corrective action to reduce kiln heat loss
| Energy saved | Clinker level |
| Thermal | 15-20kcal/kg clinker |
| Electrical | 2-3 kWh/mt clinker |
| CO2 reduction potential | 7-10 kg CO2/mt clinker |
Indian cement industry also working on using kilns with zero waste heat concept which will help to utilizing all waste heat in process itself without a separate WHR system, recovery from kiln shell radiation, fluidized bed combustion kilns, cogeneration of cement and powder and limestone enrichment technology. These alternative will help Indian cement production to be energy and productivity efficient.
Cost estimation for this type of method estimated to be around INR 20 million to 60million. (approximately £241,756.00 British pounds)
4.6.3 High efficiency clinker coolers-Indian cement industry has been successfully adopting to the reciprocating grate coolers where use of rotary cooler is getting wiped out. More than 50% of cement produced from kilns less than 10 years old and reciprocating coolers have become common practice in the industry. They have also use the enthalpy from the hot clinker which is then recovered to preheat the incoming secondary and tertiary air to improve thermal efficiency. Conventional grate coolers tend to provide a recuperation efficiency of 50-60%, depending on the mechanical condition. The latest generation clinker coolers have better clinker properties, has lower exit gas and clinker temperature.
when thermal efficiency in the kiln and preheater system increased the clinker coolers should be able to supply reduced secondary and tertiary air volumes with higher recuperation efficiency.
| Energy saved | Clinker level |
| Thermal | 10-30kcal/kg clinker |
| Electrical | 0-1 kWh/MT clinker |
| CO2 reduction potential | 8-10 kg CO2/MT clinker |
Cost of installation in Indian rupees is around 100-150/tonne of clinker, which is equal to USD 2-3/ tonne clinker.
4.6.4 More efficiency in grinding systems- in cement manufacturing grinding consumes the largest amount of energy. India’s cement production uses several grinding systems such as ball mills, ball mills with pre-grinder and VRM for clinker grinding. The newly installed plants have VRM for raw material and coal grinding and VRM ball mill with HPGR used for cement grinding which has taken up to 50% of the cement manufacturing capacity. Grinding mill is selected in the basis of the moisture content and the material hardness where VRM consumes less energy as it’s known for combined drying and grinding of the raw materials and coal.
External circulation system for material, latest generation classifier, adjustable louvre ring and modification of mill body are some examples of which are used to improve energy efficiency. VRM is widely known option for raw material and coal grinding and clinker grinding while closed circuit ball mill with high efficiency separator is used the most for common type of clinker grinding system.
| Parameters | Closed Circuit Ball Mill (CCBM) | Semi finish grinding- ball mill and HPGR pre grinder | HPG finish mode | VRM |
| Air flow requirement | Low | Low | Low | High |
| No of auxiliary equipment | More | More | Less | Less |
| Expected specific consumption, kWh/t OPC 3,400cm2/gm | 32-34 | 26-28 | 26-28 | 24-26 |
| Ease of operation | High | Medium | Medium | Low |
Figure 33 Existing and Potential Technologies for Carbon Emissions Reductions in the Indian cement industry 2013
Vertical Roller Mills (VRM) easy to use and less auxiliary equipment which in return reduce the maintenance cost. More over 6-10kWh/MT cement of electricity can be saved while 7-12kg CO2/MT is reduced.
Cost of installation varies for different grinding requirements however the vertical roller mill costs 2.3-2.5% more than the cost of installation of ball mill with closed circuit.(Confederation of Indian Industry, 2013)
4.6.5 Energy efficiency upgrades on Process fans-
Process fans among others the second largest energy consumers in cement industry. Like other cement industries in the world India also tried to increase energy efficiency and reduce operating cost by upgrading process fans. The modern process fans are capable of higher energy efficiency, low material build up, better speed control, higher wear resistance, low vibration and operation stability is fairly high. Process fans such as pre heater fans, coal mill fans, raw mill fans and cooler fans consume more than 40% of the total electrical energy.
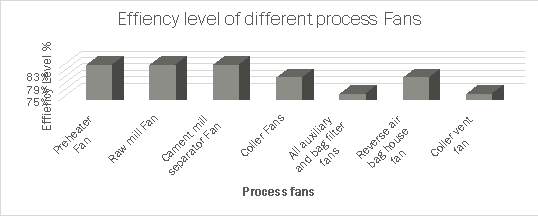
Figure 34 Table 1Existing and Potential Technologies for Carbon Emissions Reductions in the Indian cement industry 2013
The chart above shows the level of efficiency on different type of process fans. An appropriate speed control mechanism would be able to provide optimum energy efficiency when its worked with the right process fan. By monitoring the performance of the existing fans and replacing them when it needs replacement will improve energy efficiency.
4.6.6 Improvements in auxiliary equipment-
Conveyors, blowers, compressors, elevators and pumps are examples of auxiliary equipment, which consumes 10% of the electrical energy of cement manufacturing.
4.6.6.1Single pipe conveyors can be replaced for the combination of belt conveyor and bucket elevator.
4.6.6.2 Centrifugal compressorscan be used for lower energy consumption compared to screw compressor. As the demand for compressed air has been increased it is beneficial include a centrifugal compressor to achieve the lowest specific energy consumption.
4.6.6.3 Use of VFD for capacity control has higher operating range and reduced harmonics. Installation of VFD in a compressor can result in constant pressure and zero unloading which can result in power reduction.
4.6.6.4 Wobbler screen for crusher can ensure the undersized material from going into crusher avoiding the mixture of excessive fine material. They are known to run with moisture content of less than 5% and reduction of 0.5kWh/mt specific energy consumption.
By improving the auxiliary equipment’s there can be 0.5-1kWh/tonne of electrical energy can be saved and 0-1kg CO2/tonne of cement can be eliminated.
4.7 Use of renewable energy in cement industry
India is one of top five countries that uses renewable energy with the capacity of 20GW installed base. This represents 11% of India’s total power generation capacity.
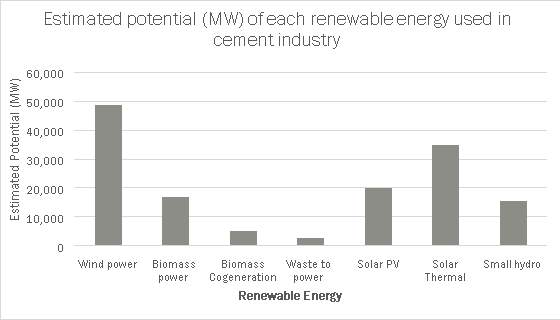
Table 7Table 1Existing and Potential Technologies for Carbon Emissions Reductions in the Indian cement industry 2013
The graph above indicates the potential of different renewable energy source which is available in India.
4.7.1 Wind poweris of main renewable energy source which is used around India and has the ability of power transmission through national electricity and banking, known as keeping power for the later use of the grid which can help by higher benefits.
4.7.2 Biomass fuels needs to be cleaned, prepared, dried and homogenized to have uniform heating value. All biomass fuels can be converted into producer gas to be used in cement industry.
4.7.3 Waste to power is a way of generating power by recovering heat from waste gas discharged in cement industry. This system can be used to save approximately 30% of the total electric consumption.
4.7.4 Solar PV’s are relatively unobtrusive with no noise impact. One of the main reasons of decreasing number of use in Solar PV’s is because they are expensive and requires large area to install.
4.7.5 Solar thermal can be used for hot water generation and vapour absorption machines. This process can be used to produce cement with no carbon dioxide emissions. Solar thermal energy is used to heat limestone while assist in electrolysis producing a different chemical reaction producing zero carbon dioxide by product.
4.7.6 Small hydro power generationis used for the purpose of low cost of electricity generated. Hydropower is the only large scale and cost efficient storage technology available today.
1.0 Conclusion
The report focuses on the energy and material efficiency in the cement sector India. Cement production in India has improved from where it has started by adapting to new technologies and working towards the carbon footprint. By using new technologies, harmful gases can be reduced in the cement industry. Out of many cement plants in India only a few has invested into new technologies to increase their production more efficient way at low cost.
References
Aı̈tcin, P.C., 2000. Cements of yesterday and today: concrete of tomorrow. Cement and Concrete research, 30(9), pp.1349-1359.
HENDRIKS, C.A., WORRELL, E., DE JAGER, D., BLOK, K. and RIEMER, P., 1998. Emission reduction of greenhouse gases from the cement industry, Proceedings of the fourth international conference on greenhouse gas control technologies 1998, pp. 939-944.
ANAMIKA, S., YOGESH, S. and SHAMMI, N. (2004) Sustainble Energy Solutions in Reinforcing Cement Manufacturing with Energy Efficiency.
BHAWAN, S.P. (2016) Energy Statistics.
CONFEDERATION OF INDIAN INDUSTRY (2013) Existing and Potential Technologies for Carbon Emissions Reductions in the Indian cement industry: International Finance cooperation.
G.C.M, P.E. (2013) The “Incredible” Indian Cement Industry.
GORBATENKO, Y. and SHARABAROFF, A. (2014) waste heat recovery for the cement sector: IFC.
IBEF (2015) Cement industry in India: Indian Brand Equity Foundation.
IFC (2007) Environmental, Health and Safety Guideliness: World bank.
KUMAR MANDAL, S. and MADHESWARAN, S. (2010) Environmental efficiency of the Indian cement industry: An interstate analysis. Energy Policy, 38 (2), pp. 1108-1118.
KUMAR, K. (2013) A STUDY ON THE PROGRESS OF INDIAN CEMENT INDUSTRY.
MANIKANDAN, K. (ed.) (2015) Cement price touches Rs. 400 a bag. The Hindu, retrieved from: http://www.thehindu.com/news/cities/chennai/cement-price-touches-rs-400-a-bag/article6965857.ece.
MOHAN, A.R. (1969) Cement making in India.
RANE, M. analysis of energy saving oportunities in energy saving.
ROSILLO-CALLE, F., DE GROOT, P. and HEMSTOCK, S. L. (2006) Energy for a sustainable environment second eddition: Earth scan.
SALGAONKAR, S., DASGUPTA, J. and SRINIVASAN, A. (2013) Cement annual review: CRISIL Research.
SAWHNEY, B.K. and VERMA, S.S. (1989)
Suitability of Indian Coal For Coal-Fired MHD Generators
.
SCHUMACHER, K. and SATHAYE, J. (1999) India’s Cement Industry:Productivity, Energy Efficiency and Carbon Emissions
.
THIRUGNANASAMBANDA, M. and HASANUZZAMAN, M. (2011) Analysis of electrical motors load factors and energy savings in an Indian cement industry: Elsevier.
THOMBRE, D. (2007) The Hindu Survey Of Indian Industry. Changing Growth Dynamic.
VARGHESE, P.C. (2015) Building Materials. Second edition ed: Prentice-Hall Of India.
ZHOU, W. et al. (2016) Capturing CO2 from cement plants: A priority for reducing CO2 emissions in China. Energy, 106, pp. 464-474.
IEA, 2008. Energy Technology Perspectives – Scenarios and Strategies to 2050. International Energy Agency.
https://www.statista.com/statistics/420530/production-of-cement-in-india/
Hewlett, P., 2003. Lea’s chemistry of cement and concrete. Butterworth-Heinemann.
Appendix
| Year | Cement plant India | Electrical energy (kWh/Cement) |
| 2001-2002 | Aditya Cement, Chittogarh | 84 |
| 2001-2002 | Birla Corporation Ltd – Chittorgarh | 91 |
| 2001-2002 | Vikram Cement, Grasim Industries | 94 |
| 2001-2002 | J.K. Cement, Nimbaheda | 101 |
Table 8 electrical energy consumption for selected cement plants in India. (Ramesh, 2012)
3.4 Some of the many cement companies annual Power consumption, India 2004-2012
| Name of the company | 2004-2005 (kWh) | 2005-2006 | 2006-2007 | 2007-2008 | 2008-2009 | 2009-2010 | 2010-2011 | 2011-2012 |
| Ultratech Cement | 87 | 89 | 87 | 85 | 85 | 83 | 82 | 81 |
| Acc limited | 86 | 88 | 88 | 89 | 87 | 85 | 87 | 84 |
| Ambuja Cement Limited | 84 | – | 86 | 84 | 86 | 86 | 86 | 85 |
| India Cements Limited | 125 | 130 | 130 | 89 | 91 | 93 | 93 | 92 |
| Madras Cements Limited | 72 | 72 | 73 | 78 | 79 | 83 | 83 | 78 |
Table 9 Annual Power Consumption India (Salgaonkar, Dasgupta and Srinivasan, 2013)
3.41 Annual coal consumption 2004-2012
| Name of the company | 2005-2006
(GJ) |
2006-2007 | 2007-2008 | 2008-2009 | 2009-2010 | 2010-2011 | 2011-2012 | |
| Ultratech Cement | – | – | – | – | 0.00297 | 0.00296 | 0.00298 | |
| Acc limited | 0.00309 | 0.00308 | 0.00315 | 0.00316 | 0.00312 | 0.00314 | 0.00311 | |
| Ambuja Cement Limited | 0.00299 | 0.00306 | 0.00310 | 0.00311 | 0.00316 | 0.00314 | 0.00309 | |
| India Cements Limited | – | – | 0.00007 | 0.00007 | 0.00007 | 0.00007 | 0.00007 | |
| Madras Cements Limited | 0.00005 | 0.00005 | 0.00006 | 0.00006 | 0.00006 | 0.00006 | 0.00005 |
Table 10 Annual Coal Consumption India (Salgaonkar, Dasgupta and Srinivasan, 2013)
3.42 Annual Cement production, India 2004-2012
| Name of the company | 2004-2005 (MT) | 2005-2006 | 2006-2007 | 2007-2008 | 2008-2009 | 2009-2010 | 2010-2011 | 2011-2012 |
| Ultratech Cement | 12.1 | 19.9 | 14.6 | 15.1 | 15.9 | 17.6 | 32.9 | 39.4 |
| Acc limited | 16.9 | 12.9 | 18.7 | 19.9 | 20.8 | 21.4 | 21.4 | 23.6 |
| Ambuja Cement Limited | 10.4 | 12.8 | 22.6 | 16.9 | 17.8 | 18.8 | 20.1 | 21.0 |
| India Cements Limited | 5.5 | 7.3 | 8.4 | 9.2 | 9.1 | 10.5 | 10.0 | 9.5 |
| Madras Cements Limited | 3.8 | 4.7 | 5.7 | 5.8 | 6.5 | 8.0 | 7.3 | 7.5 |
Table 11 Annual Cement Production, India (Salgaonkar, Dasgupta and Srinivasan, 2013)
Cite This Work
To export a reference to this article please select a referencing stye below:
Related Services
View all


Related Content
All TagsContent relating to: "Energy"
Energy regards the power derived from a fuel source such as electricity or gas that can do work such as provide light or heat. Energy sources can be non-renewable such as fossil fuels or nuclear, or renewable such as solar, wind, hydro or geothermal. Renewable energies are also known as green energy with reference to the environmental benefits they provide.
Related Articles

DMCA / Removal Request
If you are the original writer of this dissertation and no longer wish to have your work published on the UKDiss.com website then please: