Social and Economic Impact of Poorly Maintained Roads on Cyclists
Info: 17987 words (72 pages) Dissertation
Published: 9th Dec 2019
Contents
2.2 Social and Economic Implications
3.3 Safety and Why We Need to Improve It
3.5 Current Safety Initiatives
3.7 Current Road Maintenance Plans
4.2 Structure and Distribution
1.0 Lists
Figure 1 – UK Population in millions
Figure 2 – Million Miles Cycled Per Annum (UK)
Figure 3 – Percentage of Population cycling
Figure 4 – Cycling casualties per kilometre cycled
Figure 5 – Typical Advanced Stopping Line
Figure 7 – Share the Road Sign
Figure 8 – Poor Quality Patch Repair
Figure 9 – Good Quality Patch Repair
Figure 15 – Genders of Different Age Groups
Figure 16 – Effect of Road Defects
Figure 17 – Social Effect of Road Defects
Figure 18 – Road Defects involved in Cycling Accidents
Figure 19 – Percentage of Accidents involving Road Defects
Figure 20 – Effect of Road Defects versus Cycling Frequency
Figure 21 – Percentage of Cyclists involved in Accidents
Figure 22 – Causes of Cycling Accidents
Figure 23 – Percentage who knew to report potholes to the council
Figure 24 – Safety Improvement Scheme Choices
Figure 25 – Percentage of cyclists in accidents
Figure 26 – Way to Improve Road Safety
Figure 27 – Effect of Defect depending on the cause of crash
Figure 28 – Effect of Road Defect on Different Bicycle Types
Figure 29 – Percentage of genders across all case studes
Figure 30 – Types of Bicycle Ridden
Figure 32 – Path taken when encountering the Lower Bristol Road defect.
Figure 33 – Movement prior to the road defect on Lower Bristol Road
Figure 34 – Unsafe practices observed on Lower Bristol Road
Figure 35 – Path when encountering road defect on Widcombe Hill
Figure 36 – Movement prior to road defect on Widcombe Hill
Figure 37 – Unsafe practices observed on Widcombe Hill
Table 1 – Cycling Casualties per annum (UK)
Table 3 – Types of Bicycles Ridden
Table 4 – Accidents involving Cyclists
- List of Abbreviations
BANES – Bath and North East Somerset
AIA – Asphalt Industry Alliance
DfT – Department for Transport
2.0 Introduction
2.1 The Problem
The UK currently has a 14 year and £12 billion backlog on road maintenance (AIA, 2016); UK roads are struggling to deal with the quantities of traffic and the damage each vehicle causes. Poorly maintained roads are problems for all users; lorries, cars and cyclists. Poor roads are formed in multiple ways; repetitive loadings, low quality road repairs, sub-pavement works by utility companies, and harsh weather. The most common is formed by a combination of repeated high loads due to heavy vehicles and harsh weather; the repetitive loading causes cracks in the surface of the road, water then penetrates through the layers. Due to freeze/thaw action the water tears apart the structure of the pavement. Any loose material is then carried away by vehicles or flowing water, allowing the process to be repeated deeper into the pavement build up. The deterioration of the road needs attention before it causes larger infrastructure problems further down the line. Impacts with road defects can cause damage to the motor vehicles, or avoiding them can cause damage to themselves and other motor vehicles. It is a larger problem for cyclists; smaller wheels, lighter bikes, and with little to no suspension the impacts that are felt by a cyclist are much worse. This can cause damage to the bike, cause the rider to fall off or possibly collide with a motor vehicle which would likely result in serious injuries.
2.2 Social and Economic Implications
While it is currently problem, the situation is only going to deteriorate. Each year the majority of councils in England and Wales face a budget deficit in the road maintenance department; and following each winter the roads are typically in similar state of disrepair. With a collective annual budget deficit of £80 million the state of the road is difficult to improve. Many of the road repairs completed are short term solutions; repairs occur multiple times in succession on the same original defect, which only adds to the cost of road repairs each year. This continual expenditure is exacerbated by the compensation that is paid out each year by local councils to people injured due to poorly maintained roads, and the legal cost associated with the these claims.
Poorly maintained roads are a nuisance for all that use them, especially cyclists. It makes the road awkward and uncomfortable to use, and increases the risks faced on the road due to added dangers of avoiding or cycling through road defects. Every year people are killed or seriously injured while cycling on the roads, causing untold pain to families across the UK. The discomfort, risk and chance of injury are discouraging people from cycling, increasing the use of cars which is causing traffic and environmental problems which will affect future generations.
2.3 Project Scope
The scope of the project is to understand the negative effect of poor roads focusing on the impact on cyclists. It will do this by understanding how severely road defects affect the public, the number of accidents that are caused by them, the action taken by cyclist when encountering a road defect and looking at the potential savings that could be made with different maintenance schemes.
To make the project more realistically achievable it will be focusing on the BANES area, where there is more complete data, and the ability to interview the council to understand the scale and complexity of their operations. However, it is believed that the results will be applicable to most UK councils due to the similarities in their organisations.
While ice and fallen leaves are also a common road defects that cause of crashes (Nyberg et al, 2009), they will not form major part of my study. This is because their influence on accidents and the public opinion on them is quite clear and solutions to these problems have been previously investigated.
2.4 Aims and Objectives
The aim of the project is to evaluate the seriousness of the impact of poorly maintained roads both socially and economically, focusing on the effect on cyclists. In order to achieve this a survey of the local public will be completed to understand their opinions and the extent of accidents that are caused by road defects, a case study on Bath roads will take place to observe the actions of cyclists when encountering road defects and a cost benefit analysis on local BANES area will be performed to identify possible saving.
3.0 Literature Review
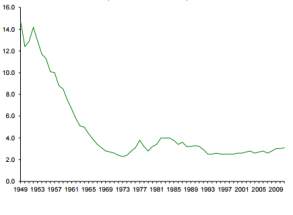
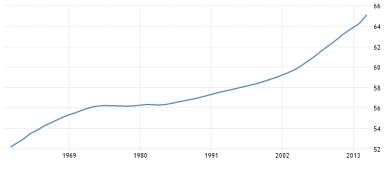
Cycling as a mode of transport has been around for centuries, and remains the most common form of transport worldwide with the obvious exception of walking. The rise of the motor vehicle in developed countries has led to a drop-in participation for cycling in recent years however cycling still remains popular throughout mainland Europe. In the UK, the picture could not be more different; the UK’s drop in the number of cyclists has led to years of low uptake even with the UK’s rise in population (DfT, 2016). While in the most recent years cycling participation in the UK has increased; there is still a long way to go to catch up with our European neighbours.
3.1 The UK Vs Mainland Europe
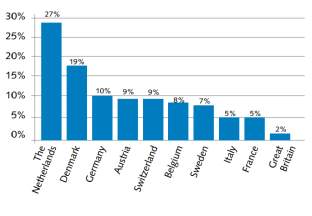 In mainland Europe, the percentage of people cycling in each nation is much higher than the UK with many more kilometres cycled per person per day. The average person only cycles 0.2km per day in the UK, while in the Netherlands this average is 3km per day (Wegman et al, 2012; Fietsberaad, 2009). This disparity leads to there being more kilometres cycled in a year in many countries even though they have a smaller population than the UK.
So, there must be reasons behind the higher uptake in cycling in these countries. If the UK was mainly taking long journeys then it would have a clear impact on the number of cyclists; however, 66% of all journeys were less than 8 kilometres (DfT, 2016), a distance that is not dissimilar to that of The Netherlands with 70% of journeys being under 7.5 kilometres (Fietsberaad, 2009). While the climate may be better in some of the other nations, this does not hold true for all; Portugal has much lower cycling participation while its climate is warmer; Sweden has higher participation even with its colder climate. The terrain in UK cities is not much different from many European cities where cycling rates are much higher; there must be another underlying cause of this low participation.
3.2 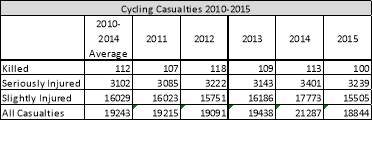 The Number of Crashes
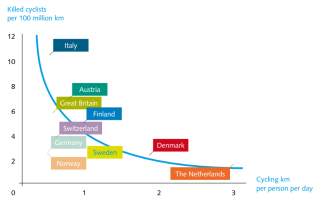 As shown Table 1there are a large amount of cycling accidents recorded in the UK each year; ranging from the minor all the way to fatal crashes (DfT, 2015). These publicised accident numbers are higher than those reported in other European nations, comparing them to the distance cycled in each country highlights the problem even further. Figure 4 shows that the UK fatality rate is much higher even though the exposure rate of our cyclists is much lower than those in other nations as cyclists spend less time on the roads. There is also research that indicates that there is an underreporting of bicycle crashes, especially those only involving one bicycle. The majority of these accident figures come from hospitalisation where cause of injury must be recorded before receiving treatment; it is thought, therefore, that these figures are the tip of the iceberg in terms of real accident numbers. This gives the appearance that it is causing less of a problem that it may be (Wegman et al, 2012).
But even with the possible underreporting, the number of accidents has led to the belief that cycling is the most dangerous form of transport in the UK, especially for commuting. Studies have shown that perceived risk is one of the biggest inhibitors in participation in an activity; so with the high accident rate it is not surprising that people in the UK are not taking up cycling (Heinen et al, 2010; Heinen et al 2012).
3.3 Safety and Why We Need to Improve It
Councils and governments in the UK and across the world have been looking to improve the safety of cyclists on the road. They have a duty of care towards their citizens who cycle and improving the safety would encourage more people to cycle. Cycling is a low impact exercise which is easy for many people to get in to while having major health benefits including reductions in cardiovascular disease, stroke, cancer and Type II diabetes (Cavill et al, 2007; Deeniham et al, 2014). These health benefits reduce the amount of time people spend off work as well as reducing their burden on public health services leading to an economical gain for the country (TNO, 2009). Increasing the number of cyclists inherently reduces the number of motor vehicles on the road, this also has health benefit. This reduces the local emissions, improving the air quality for all those in the vicinity. This reduction in vehicles has two further benefits; the overall environmental benefit of fewer emissions and better air quality, and a reduction in road maintenance; the impact of a bike is 50,000 times less than that of a car on a pavement.
Increasing the number of cyclists via implemented safety initiatives has a greater effect on safety than the scheme themselves. Known as the Safety in Numbers phenomenon the increase in the number of cyclists leads to it being safer per cyclist (Thompson et al, 2016). The current theories suggest that this is due to a couple reasons; drivers are more likely to be cyclists themselves and therefore treat cyclists how they would like to be treated when cycling; drivers encountering cyclists more often come to associate with driving with cyclists, they are more aware of the possibility of there being a cyclist and are better at sharing the road with them (Johnson et al, 2014). This is then a feedback loop; safer roads means an increase in cyclists; more cyclists leads to safer roads, and councils and governments are looking to exploit this.
3.4 The Causes of Crashes
There are different classifications of crashes depending on the seriousness of any injuries, the number and type of vehicles involved, and the cause of the crash. To improve safety the cause of the crash is the main focus in the majority of investigations into them; as to eliminate the cause of the crash would be to eliminate the crash itself and therefore increasing safety on the roads.
Looking at accident report records, a picture of what causes crashes can be built. The most common cause of accidents is simply falling off, followed an object in the road or the state of the road, with collisions with motor vehicles either moving or stationary and collisions with pedestrians, animals or other cyclists just behind (Heesch et al, 2011). There are many different things reported under the category of falling off, with many reports only listing falling off as the cause of injury when it may not have been the cause of the accident, which is why this number seems higher than expected. In terms of seriousness; collisions involving moving cars caused the most serious injuries, followed by hitting an object in the road which makes these crashes the more considered options to improve safety due to their continued serious effect on cycling accidents (Richardson, 2009).
3.5 Current Safety Initiatives
While separated dedicated cycle paths are the safest for cyclists due to the removal of motor vehicle interactions, it may not be feasible in many situations; there may not be enough space for separated paths; the cost may be larger than the budget; or there may not be enough cyclists to justify the disruption and cost. Authorities, therefore, have used different safety initiatives in which cyclists still share the roadway with motor vehicles; these are the ones that this project is interested in as it continues to lead to bicycle/vehicle interactions. These interactions are the greatest concern for safety on the road as they lead to the greatest number of serious injuries.
- Cycle Lanes
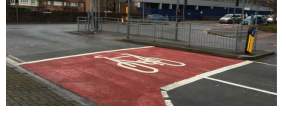
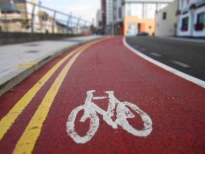 Cycle lanes are the most common safety device currently employed in the UK for cyclists. This is due to the ease of installation, its low cost, and the perceived effect it has for both cyclists and motor vehicles. A cycle lane is an area divided by a painted white line which indicates where cyclists will be and in most cases, forbids the entry of motor vehicles. This separation ensures that cyclists are guaranteed to have a space on the road to cycle. As well as informing vehicles to expect cyclists to be on the road in the area and indicate, to a degree, how far they should be away from a cyclist. Implementation of these has been shown to reduce the chance serious accidents occurring, reduces the speed of overtaking vehicles, and gives both drivers and cyclists a greater feeling of comfort when sharing the road (Parkin et al, 2010). These are often used alongside Advanced Stopping Lines. Here cyclists can, at junctions, allow themselves to be more visible to the vehicles before setting off, entering the junction first and gaining their balance before being overtaken by a vehicle.
However, while the effect has been seen it cannot be treated as statistically significant in the report, so further testing needs to be completed on its safety effect. Motor vehicles passed closer to the cyclists after the introduction of cycle lanes and the accidents which resulted in no injury actually increased. Even if a cyclist is unharmed in an accident it will have an effect on their confidence, and how safe they feel cycling afterwards. This is thought to be due to drivers putting less thought towards cyclists in cycling lanes as they are already separated, rather than considering whether the cyclist needs more room than they are currently being given (Parkin et al, 2010).
 Signs
Signs
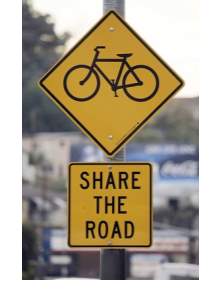
Signs are also used to bring the attention of drivers to the fact that cyclists may be on the road in the area, this makes drivers more expectant of encountering a cyclist in the near future. This expectation means encountering a cyclist is not a surprise and aims to encourage drivers to consider cyclists in advanced not at the point of interception. With a high proportion of cycling accidents occurring at non-junctions, overtaking of cyclists is clearly a problem. With the addition of signs, the distance between vehicle and bicycle did not increase significantly. It was found that on average vehicles tended to overtake at the same distance from the kerb regardless of the location of the cyclist. However, it did reduce the proportion of vehicles overtaking in the closest position to the cyclist, as well as a speed reducing effect; it reduces the average speed of vehicles by 4 kilometres per hour. This reduction in speed gives drivers a longer time to react and reduces the force felt by cyclists as a car passes (Kay et al, 2014).
- Speed Reduction Measures
The speed of a vehicle has a direct impact of the time the driver must deal with situations as they arise, as well as the seriousness of an accident should one occur. A general way thought to improve road safety for all users as well as pedestrians is speed reducing measures. This can involve audio-tactile road markings, central islands either from painted lines or physical constructions, priority passing areas and slaloms. These measures can reduce local average vehicle speeds by up to 14.9 kilometres per hour (Charlton et al, 2010). However, these road narrowings have unintended negative effects on a cyclist. While the speed reduction of vehicles naturally improves the safety of cyclists, the road narrowings create lengths of roads for the driver to try and “beat” the cyclist. This causes cars to heavily accelerate past cyclists, overtake them in positions they may not usually attempt and increases the number of attempted overtakes. These methods increase the stress and anxiety in cyclists: vehicles may attempt more unsafe overtakes between speed reduction zones; cyclists may be forced into the main stream of traffic; cyclist already squeezed for space being overtaken during narrowings. In the case of this study, a high proportion of replies reported having crashed in or around the speed reducing road narrowings (Gibbard et al, 2004). This increase in stress and accidents act as a deterrent in an area where cycling is supposed to be encouraged.
- Safety Campaigns
Road safety campaigns are associated with a reduction in accidents, reducing them by up to 12% (Philips et al, 2011), however it relies heavily on the driver understanding the bounds of their own driving ability and therefore rationally realising that they can improve their driving (Elvik, 2016).
It has been shown that safety-focused campaigns for cycling lead to no change in the perception of risk while cycling, and therefore no increase in cycling participation. However, when the campaign focused on enjoyment instead there was a noticeable increase in cycling (Gamble et al, 2015). This may counter other safety initiatives that when advertised promote cycling safety.
3.6 The State of Our Roads
How the state of the road affects the safety of cyclists has not been considered in great detail. Of the 20,000 cycling road accidents that occur in the UK each year 12-15% (Ward, 2013) are reported with the state of the road being the main reason behind the accident. The road surface is the only thing that connects to the bike to the ground and therefore is very important. Current research into the state of the road focuses around the instability caused by road markings, and the gaze behaviour of cyclists on poor road surfaces.
Road markings have been heavily researched against the stability of cyclists over them, while a minor loss in cycling stability has been detected it is not a great cause of accidents. However, these studies have been marred due to the high number of variables in cycling stability and human learning making repeat testing difficult (Cleland et al, 2005; Munster et al, 1999).
Existing studies have shown that narrower tracks increase the steering workload, where a higher proportion of concentration is on the steering of the vehicle or bike rather than checking the surrounding areas (Vansteenkiste et al, 2013). This is further backed up on a study on the implications of low quality paths; three times as much time is spent looking at the path rather than the surrounding environment due to the need to gain more visual information about the surface. This can detract from the ability to focus on other hazards that may be present (Vansteenkiste et al, 2014).
While 12-15% is a reasonable proportion of accidents there has not been researched into whether improving road conditions is a valid method of improving road safety. Improving road conditions may be an effective method of decreasing the number of accidents on the road and improving the safety of cyclists, while not costing as much as other safety schemes.
3.7 Current Road Maintenance Plans
The current approach to road maintenance in the UK is mainly reactive; defects in the road must reach a certain level before they are classed as an issue and are fixed by the local council. This can lead to defects that can be individually dangerous for cyclists or large numbers of them on a road. The current level that they must reach before fixing is one where they could start to cause damage to cars as they are seen as the primary road users (Council Connect, 2016). Across most councils in the UK this value is 40mm, although some do not class it as an issue till it is 50mm deep; these depths provide large problems for cyclists even before they reach the 40mm limit. For cyclists to get a defect repaired they must notify the council that it exists, in which case the council has a requirement to repair it if it exceeds safety thresholds, or be involved in an accident where the defect was a factor. Many cyclists do not know about the former as it is not widely advertised, and the latter often results in compensation claims against the council. In this way, the council effectively pays out twice for the road repair. There are a multitude of websites created with the aim of increasing awareness of the ability to report road defects, which also simplify the process of reporting however the reach of these websites is limited.
 Councils have their own team of inspectors who work to inspect the roads in their area at least once every six months, however defects can easily become a large problem in between inspections and may not be reported. These teams of inspectors are relied upon to the report the majority of the road defects, and account for the majority of defects fixed every year. Councils also employ laser scanners to cover large areas of roads, in this way all road defects can be logged and compared to previous scans. Being able to compare previous scans allows maintenance to target to the roads that deteriorate more quickly.
 As councils wait until the defect is large enough to cause problems the repair of such a defect is costlier than the repair when the defect first formed (Cycling UK, 2016). This is mainly due to the increase in size and therefore more material and labour to repair it.
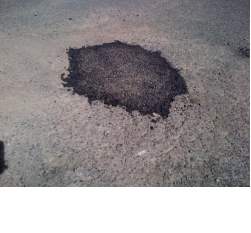
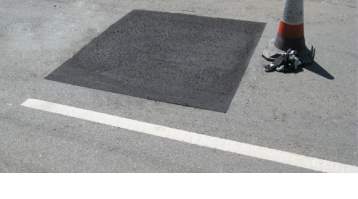
However, this is the start of the problem; the style of repair used by most councils is a patch repair, where the defect is cut and cleaned, then filled in and the new surface levelled to match the existing. When executed properly, as in Figure 8, this repair can last almost as long as the road itself, this however is not the case in most repairs, shown in Figure 9. In the worst case, the fill is not properly compacted and the patch ‘falls’ into the defect, so the defect forms again quickly. The patch could be made of a different material, this change in material can cause problems for cyclists and can wear quicker than the surrounding road surface, leading to the defect reforming. The most common issue with patch repairs is during colder weather. Freeze/thaw action takes place; while cracks had to be created originally by heavy use; the edges of patch repairs provide the perfect location for the ingress of water. Freeze/thaw action dislodges the patch material and damages the substructure of the road with motor vehicles exacerbating the loading and scrubbing away any loose material. This can lead to worse defects than prior to the repair. These issues cause the road to need more continuous and expensive repairs.
These issues are furthered in situations where the road has had to been dug up to install or access pipes or wires below the road. Utility companies can easily request access to work on the road; the problem arises once the work has been completed. Due to the size and length of these defects they can cause more of a problem than other road defects, and if the repair fails outside of its warranty it is the duty of the council for the repairs rather than the company that dug up the road.
Eventually the whole road surface has to be replaced as continual repairs are unfeasible, however there are alternatives to this continual repair process. These are often more expensive but longer lasting so may present a longer term saving for councils. There has not been any studies into these possible savings, and the time period needed for them to come into effect and therefore this will form part of this dissertation.
Alongside these road repair costs, the compensation and administration fees for them are also expensive to the council; £28.5 million in 2015 was spent by councils in England and Wales. Half of this was spent on the administration and legal fees associated with the compensation rather than the compensation itself (Asphalt Industry Alliance, 2016). If roads were kept in a perfect condition at all times this would disappear, however it is unreasonable to expect this to happen, it is therefore a case of balancing the cost of road repairs with the cost of compensation.
This dissertation will therefore be looking into the cost of alternative maintenance schemes that consider the safety of cyclists simultaneously . This improvement in safety would reduce the compensation paid out each year and therefore represent a possible saving for councils.
3.8 Public Opinion
Understanding the difference in cost is one side of the problem, understanding public perception and what part they play is the other. While there is a general consensus that road defects are a nuisance to the public there has not been a study into the full extent of their opinion. There is currently little understanding into which type of road defect causes the largest problem and therefore should be a priority in repairing, what affect it has in reducing the number or frequency of people cycling, and accurately what percentage of accidents are due to a defect due to the underreporting of accidents (Wegman et al, 2012).
This gain in knowledge about the effect on the public would allow councils to decide on which road safety scheme is best for them; if a large number of accidents each year are caused by road defects and it is a large inhibitor of cycling uptake then funding road repairs could be better at increasing safety and participation in cycling than installing cycling lanes may be. Understanding the full extent of accidents due to defects would highlight to what extent accidents were being underreported and allow better estimates for the number of accidents each year. This more precise estimate would give a better understanding of the size of the problem and allow a more appropriate reaction from authorities over their need to provide greater safety.
3.9 Conclusion
With little understanding into the effect that poor roads have on cyclists past the point that they create accidents, and even the extent of how many they do create is not known conclusively, this dissertation will therefore focus on this. This new knowledge will allow better safety schemes to be put in place and reduce the risks on the road to cyclists.
While fully understanding the cost of the current road maintenance schemes, both economically and socially, a potential saving may be found in terms of both lives and money.
Linking these two to produce a cheaper and more effective road maintenance scheme would encourage more people into cycling further improving road safety, their own health, and the health of the environment around them.
4.1 Aims
The aims of the survey were to establish an understanding into the opinions and thoughts of cyclists in the local area, and the effect that road defects have on them. The questions aimed to receive a wide range of responses from each participant to fully understand the multiple aspects that may affect what effect road defects have on them. Another aim was to gain a greater understanding of the percentage of cyclists that had been involved in an accident and to what extent road defects are the cause of them.
4.2 Structure and Distribution
The following are the questions that were asked in the questionnaire which was entitled ‘Cycling Safety and Road Defects: How does the state of the road affect you?’
- What is your age?
- What is your gender?
 On average how often do you ride a bicycle on the road?
For those who never cycled this additional question was asked:
- Why do you never cycle?
For the rest of the participants these following questions were asked:
- How would you rate your cycling ability?
- What type of bicycles do you ride?
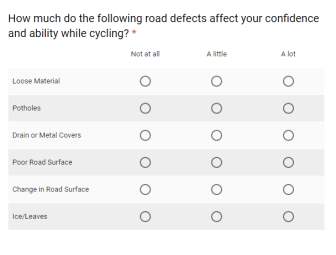
- How much do the following road defects affect your confidence and ability while cycling?
- Have you ever fallen off your bike/been involved in a bike accident?
For those who had:
- Did it occur in the last 2 years?
- Did it occur while you were cycling on a road?
And finally, for those who had fallen on the road:
- Did any of the road defects previously stated have a factor in that accident?
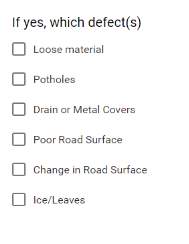 If yes, which defect(s)?
- Briefly sum up the accident(s)
- What do you think is the best method to improve the safety of cyclists on the road?
- Are you aware that you can report road defects to your local council?
- Do you think councils should spend a greater percentage of their current road budget on improving cycling safety?
The questionnaire was created using Google Forms, which allows the creation of sub-questions that are only seen by those who answer appropriately to the previous question. This allowed the collection of data without the worry of questions being filled in by participants who should not have. Figure 10 to Figure 14 show a representative sample of the questions asked to the participants to show the different styles of questions and answers faced.


The questionnaire was then distributed using social media, local forums and action groups in an attempt to receive a representative sample of cyclists and non-cyclists. It was also attempted to achieve a range of cycling ability and type of cyclist, whether it is a club rider or simply someone who commutes via bicycle.
4.3 Analysis
The analysis of the results was completed using Microsoft Excel; the small data set and qualitative answers meant that it was preferable than other software.
To create quantitative data in the responses to Question 3d. ‘How much do the following road defects affect your confidence and ability while cycling?’ the answers ‘Not at all’, ‘A little’, and ‘A lot’ were assigned the values 0, 1, and 2 respectively. This allowed trends to be found; whereby the higher the total number the greater effect that each defect presented to cyclists.
4.4 Results
 The responses to question 6 were in the vast majority positive with multiple possible reasons for this: the question was not fully understood, there is bias in the question, or that everyone who answered understood and believed that a greater percentage of the road maintenance budget should be spent on cycling safety. Unfortunately, due to this uncertainty in this result this question has been ignored in this dissertation to ensure that only credible trends are analysed.
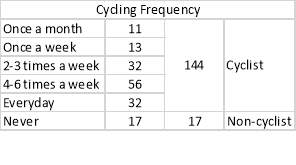
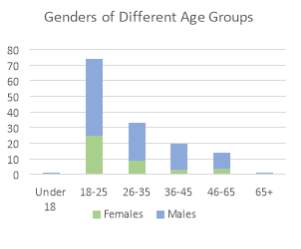 The majority of the responses, 89%, were cyclists, however there was a range in the frequency, as shown in Table 2. This level of cyclist response is not unexpected; the survey was distributed to cycling groups who typically have large memberships, and the issue that the survey addresses is close to the heart of many cyclists. The responses are weighted towards males between 18 and 25, which also was not unexpected as studies have shown that young males are more likely to cycle than any other group (Allan, 2016; Cycling Info, 2012). Apart from the Under 18 and 65+, the age groups are each well represented to be able to get statistically significant relationships, as shown in Figure 15.
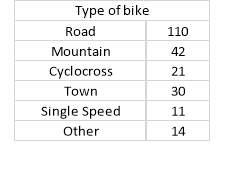 Road bikes were the most ridden style of bike by a sizeable margin, Table 3, which also was not unexpected as the survey was distributed to local cycling groups which are made up of mostly road riders only. This is further evident in the cycling ability with the majority of people rating themselves either a 3 or 4, where 4 is Excellent, and no responses replying 0, or Poor.
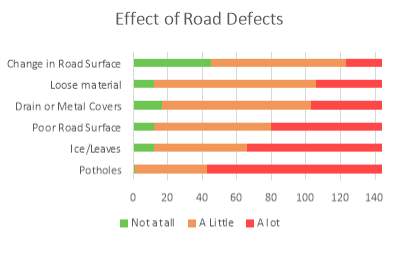 The road defect with the highest detrimental effect, Figure 16, is potholes. While they may occur less frequently in a stretch of road than the others, the large impact each individual pothole has is much higher than the other defects. One response stated that they were unaffected by potholes, however they also stated that they were unaffected by any of the defects and therefore thought to not represent many cyclists. Ice and leaves on the road are also a major cause of issues, this was expected as their affect is known due to previous research into their effects (Nyberg et al, 2009).As stated in the introduction this is why they are being ignored in this dissertation as a way of improving cycling safety. Changes in road surface is the defect with the lowest overall impact on cyclists, with a largest number of responses not affected by them at all.
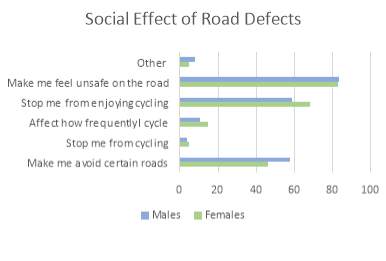
Figure 17 shows how road defects make cyclists feel, topping this list was feeling unsafe on the road with 83% of the cyclists questioned. This is a large proportion of cyclists, and when added to the high percentage of cyclists not enjoying cycling due to them it is easier to start building a picture of why more people do not cycle. Over half the participants changed the route that they travelled to avoid particularly bad stretches of road, willing to travel further than facing the risks of road defects highlighting the negative social impact they have.
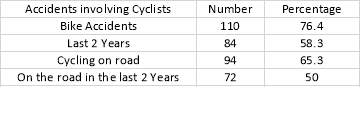
 A worryingly large percentage of cyclists have been involved in an accident when on their bicycles, Table 4. As only recent accidents that occurred on shared use highways were wanted for the analysis, follow up qualifying questions allowed the elimination of unwanted accidents, however even when accounting for differences time and location half of the cyclists had been involved in an accident. The number of crashes were balanced between males and females: 18-25 and 36-45 were much more likely to involved in a recent accident than other age ranges and the more frequently that you cycled the more likely you were to be involved, which is to be explored in more detail further on.
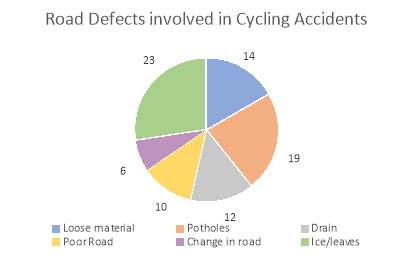
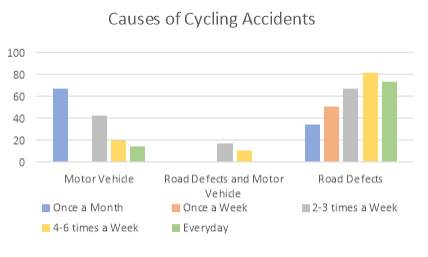
72% of accidents involved some form of road defect, which are detailed in Figure 18. Some accidents involved multiple road defects, explaining why the values add to over 72, the number of road accidents in the last 2 years.
Ice and leaves on the road were the biggest culprit followed by potholes, which was expected. Loose materials and drain or metal covers in the road cause a higher proportion of accidents than the effect of them demonstrated. However, whether this is due to the fact that cyclists are less on the lookout for them, or underestimate effect that they actually have on them is unknown.
 Comparing males against females the data remains similar across the majority of the questions. Males rated their own cycling ability as slightly higher than that of females, and this trend followed into the effect of road defects. Males consistently stated that defects caused less of a problem than females; both of these are supported by studies into self-evaluation; where males are more likely to rate their own ability higher than females (Szymanowicz et al, 2013). However, males were more likely to change their routes, which may be due to females having set destinations when cycling so have less choice to avoid poor roads and males cycling more for leisure. 82% of men compared to 68% of females have been involved in an accident; however, of those on the road in the last 2 years, 50% of both males and females have had a crash.
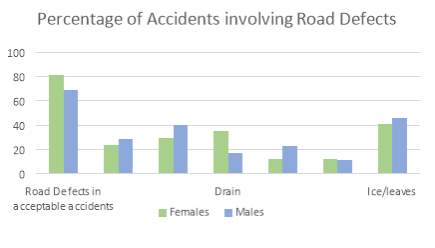
This may be due to the recent increase in uptake in females participating in cycling. Females in crashes tend to involve road defects more than men, Figure 19, while another vehicle is more likely to be the cause of the accident for males. This aligns with the fact that females tend to find road defects more of an issue than males.
Separating the cyclists into their respective age ranges, 26-35 year olds cycled more often than any other age group, and consequently rated themselves better than other ages. However, they were more affected by road defects on average and they are more likely to feel unsafe on the roads that they ride than any other age group, but they are less likely to avoid poor roads. Feeling unsafe on the road peaks at 26-35, reducing as the cyclists gets older but as cyclists age they are more likely to not enjoy cycling in poor conditions which may be in part due to the added discomfort that it causes. Interestingly 18-25 and 46-65 have very similar views on road defects while 26-35 and 36-45 are affected much more by road defects than the others. It would be expected that the older that you are the more likely to have been involved in a bicycle accident as they have had a much greater exposure to the risk; this is apparent in people over 46, however 26-35 has the lowest percentage of accidents as shown figure xx. [INSERT GRAPH OF AGE RANGE V CRASHES INCLUDING ROAD DEFECTS VS VEHICLES] The older the cyclist is the higher proportion of accidents involve road defects and the fewer that involve other vehicles, also shown in figure xx; this trend is supported by research into risk-taking in relation to age in which younger people were more likely to allow themselves into dangerous situations (Josef et al, 2013).
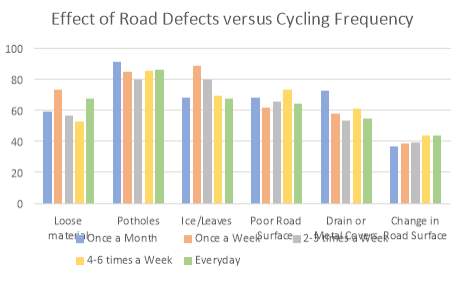 While looking at the results in terms of their cycling frequency; people cycling 4-6 times a week were the most common which would include keen cyclists and people who commute via bicycle. The more frequently a person cycled the better they would rate their cycling ability. Comparing their ability to handle road defects with their cycling frequency only a couple of trends were apparent. The more frequently a person cycled the more changes in road surface affected, Figure 20. This may be due to the higher speeds that they are travelling at and therefore the greater need in surface consistency. On the other hand, those who cycled more infrequently found drain and metal covers cause a significantly greater challenge than for more regular cyclist; more frequent cyclists may be more likely to avoid covers knowing the problems that they can cause. At the lower end of cycling frequency, poor roads had the largest effect of stopping people cycling. This is apparent as this is the group of respondents who cycled the least. While those who cycled once a week were the most likely to feel unsafe, this feeling reduces as you cycle more frequently. There is, however, an initial hump to get over which may deter people progressing to cycling more regularly.
 More frequent cyclists were more likely to avoid certain roads; this is a product of knowing which roads are too bad to ride on which is gained only from cycling them regularly and the willingness to cycle further for a more comfortable overall ride. There is a correlation between those who cycle more frequently and the likelihood to have been involved in an accident, and when looked at specifically in the last 2 years on the road there is a clear trend. Frequent cyclists have a much greater exposure to the risk which is why they make up a larger proportion of the accidents. Generally, frequent cyclists’ accidents more often involved road defects, and less often other vehicles; they are more likely to understand how to stay safe on a bicycle, including road positioning and attire, than those who do not.
 Just 11% of responses were from people who do not cycle, all of whom were between 18 and 25. The main reason for people not cycling was simply that they do not own a bicycle. Bicycles are not cheap and that is a barrier for people to start cycling, especially if they are unsure if they are going to enjoy and continue to ride. 50% of females who do not cycle do so because they are scared of cycling on the road; however due to the low number of people who do not cycle it is unsure whether this trend would continue with a larger sample size.
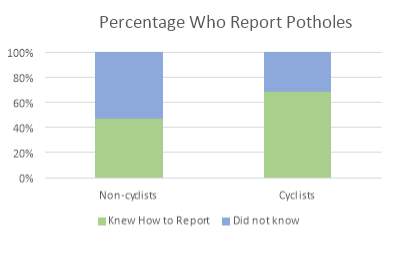
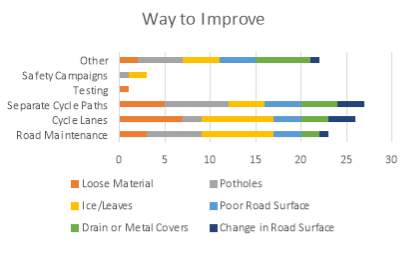
 Looking at questions 4 and 5 to compare those who do and do not cycle; those who cycle are more likely to know that they can report potholes to the council, however 30% and 50% of cyclists and non-cyclists respectively did not know, shown in Figure 23. While around a third of potholes repaired each year are reported to the council by the public (BANES, 2015), greater public knowledge about reporting potholes would increase this figure and may reduce the cost of inspections and maintenance if more defects were reported sooner. Cyclists were most likely to offer their own way to improve safety for cyclists, some of these fit under the categories stated in the question so have been reassigned so there are not two categories for the same solution.
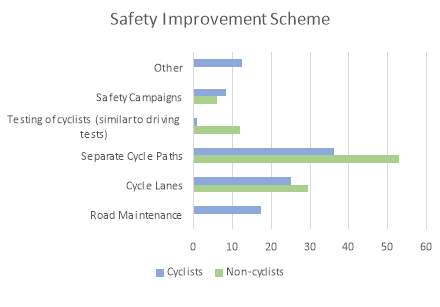
 No non-cyclists believed that better road maintenance would improve road safety, while 17% of cyclists did; showing how the effect of road defects is not known by those who do not cycle and why it is not thought of as a possible road safety improvement by many councils. While both cyclists and non-cyclists stated that separate cycle paths were the best way to improve safety, non-cyclists were much more in favour of it. It is clear that this would be a popular solution as it would remove the bike-vehicle interaction which is often the cause of accidents and the main source of fear while cycling. Separate cycle paths would also reduce the main cause of accidents in this survey, road defects. As previously stated they are caused by heavy and repeated loading of the pavement which in a separate path would be removed. However, the expense and the large space required makes this solution impractical. Cycle lanes are the next highest voted, which is supported by the literature review as a possible way to improve safety, although further testing is required to validate this research.
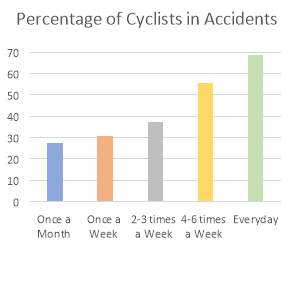
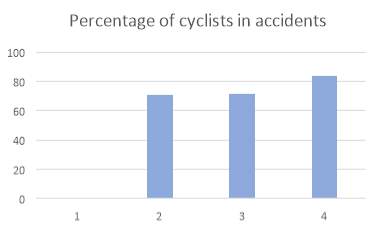
 It was found that those who rated themselves more highly were also more likely to have been involved in an accident, Figure 25. Typically, these people also cycled more often and so are more exposed. However, there is correlation between confidence and likelihood to crash even amongst the less frequent cyclists. Continuing to look at those who had crashed, they were over twice as likely to think that road maintenance would be the best way to improve cycling safety which lines up with the fact that the majority of crashes involved some form of poor road maintenance. Those who had not crashed were twice as likely to think that safety campaigns would be the best way; where for them other vehicles are thought to be the biggest risk.
When the cause of the accident was drain or metal covers, people were more likely to offer their own solution to the best way to improve which typically involved greater restrictions on what could be in a road, often focusing on the covers that are not directly adjacent to the kerb. For those whose accidents were in part due to poor road surface, road defects had a greater detrimental effect on them than for others as shown in Figure 27. Generally, those who had crashed but not involving a road defect stated than road defects caused less of a problem 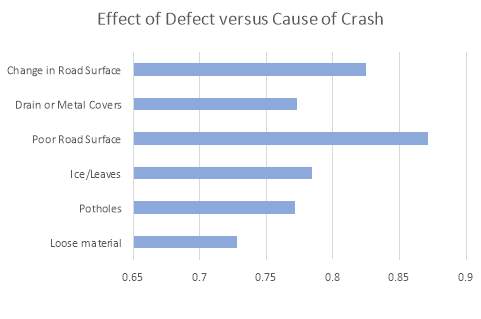 for them, which also aligns with those who had not crashed at all; a crash due to a road defect either highlights the existing issues that the rider was having with road defects or changes the cyclists’ perspective about road defects.
Those who stated that road defects affected them worse were also more likely to choose road maintenance as a way to improve, which is unsurprising as they are causing them a large issue when cycling on the road. While those who road defects effected the least were more likely to choose testing to improve safety.
While there is not a great variation in how much road defects effect different types of bikes; there is a trend to take note of, Figure 28.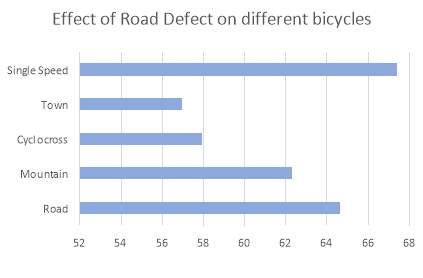 Bikes with smaller profile tyres, road bikes and single speeds, suffer worse when encountering defects with single speed bikes coming of worst of all. Single speed bikes often have a fixed gear and so cannot freewheel, which means the cyclists must pedal whenever the bike is in motion. They often only have a front brake, this allows them less ability to change their speed and can make controlling a bike harder. People riding town bikes tend to find road defects to be less of an issue than the others; town bikes are designed for slow speeds with comfort in mind, which reduces the impact of road defects on the cyclist. Cyclocross is the next type of bike; while there are a few similarities with road bikes, its more forgiving construction and larger profile tyres help negate the effect of defects. It may also be due to cyclocross riders being more used to cycling off road and on poor surfaces, compared to other cyclists. This practice in poor conditions may alleviate the issues caused by road defects.
4.5 Limitation
As discussed through the results there are limitations in the survey. The main limitation is the diversity in responses to question 6 which has had to be excluded from the analysis. This may be due to the other limitations of the survey; the majority of replies are from regular cyclists and from people who have been accident involving road defects. Due to the nature of how the survey was distributed, more significant numbers of replies came from Bath University’s Cycling and Triathlon Clubs as well as the action group, CycleBath. These are avid cyclists who have a greater interest in the state of their roads as they cycle more frequently than others, while CycleBath is a group specifically aimed improving the cycling conditions in and around Bath. As cycling regularly leads to greater exposure to risk, and with a sample group that has many frequent cyclists the percentage of cyclists involved in accidents may be higher in this survey than a truly representative sample of society.
4.6 Conclusion
As expected potholes are a large cause for concern amongst cyclists, however it is not simply the case that potholes are causing all of the accidents and problems; a lot of issues are caused by metal covers and loose materials on the road. A very high percentage of accidents involve some form of road defect and it is seen by a significant proportion of the public as a realistic way of preventing accidents. The survey results are from the publics own point of view; a case study is to be completed to understand the actions of cyclists from an outside view. Together they will form a better picture of the full effect that road defects have on cyclists.
5.0 Case Study
The aim of the case study was to back up the survey data and to understand the evasive action taken by cyclists. This also allowed an understanding of the other risks that cyclists expose themselves to while avoiding road defects. The case looked at three sites on frequently ridden routes in Bath. The sites are categorised into two different scenarios; downhill and flatland. Two sites were chosen on fast-downhill sections of road, while the remainder was on a slower section of flat road. This gives multiple comparison points between the scenarios with a focus on the different action taken at different speeds. The road defects at each location are not identical, however they cause a similar level of issue to cyclists and therefore were accepted as the case studies for this dissertation. The flat road case study was conducted on Lower Bristol Road, marked A on Figure XX, while the downhill sections are part of Widcombe Hill and are marked B. These road defects are not the most severe that can occur, but chosen to show that even minor road defects cause issues to cyclists.
The road defect chosen on Lower Bristol Road is a sunken section of road adjacent to the kerb, shown in Figure XX, which takes up over half of the lane. On Widcombe Hill at the two different locations the defect that they present is the same; metal covers in the road which have sunken causing an unintended bump in the roadway. Two separate ones were chosen as the first is worse than the other, but the second adds a secondary risk in the form of parked cars into the equation. This allows a greater investigation into the risks that cyclists bring upon themselves in the avoidance of road defects.
5.1 Method
To analyse the differences between cyclists, each cyclist was filmed as they passed the road defect using a camera on a tripod. This ensured that similar video was captured each time with the same reference points. Analysing the video was then completed by hand with the information shown in Figure XX recorded as observed. There was no interaction between the observer and the cyclists, therefore results were recorded at the analyser’s discretion. This is the reason for the broader results’ categories present in these case studies when compared to the survey.
While it would have been preferred to create road markings for ease of analysis of the videos, a trial case study found that it drew extra attention to the road defect and caused all cyclists to avoid it. It was then found in a follow up session that without the added references a variety of paths were taken. As this lead to what is thought to be truer reflection of the actions taken by cyclists all future case studies were conducted in this manner.
The videos were also used to look at possible other risks the cyclists exposed themselves to during the avoidance of the road defect; namely the increased risk from other vehicles on the road and other road defects in the vicinity. The other data recorded from the case study was whether the cyclist adjusted their position on their bicycle to prepare for the road defect and whether the cyclists took any general cycling risk such as riding without a helmet.
5.2 Limitations
The case study has more limitations than the survey; the demographic of the cyclists could only be assumed in the analysis and therefore the range for answers is less precise. As mentioned previously, including markings for the analysis effectively created warning lines for the cyclists. This brought greater attention to the road defect than it previously would have had. This meant that cyclists avoided the road defect when they may not have without these lines, however removing them meant that visual analysis was harder to complete.
The downhill sections chosen are on a main route from Bath University to the rest of Bath, this means that cyclists must cycle up the hill to be able to ride down. This reduces the number of casual cyclists that would take this route due to the high difficulty of the hill.
There were some cases of cyclists riding together, this could affect the results in a couple of ways. Riding side by side changes the path which both cyclists take due to them taking up a larger proportion of the road, here only one cyclists can avoid the defect on the outside without riding onto the other side of the road. The other is following another cyclist, here they are more likely to take the same path, especially if they know each other, or the leading rider may point out road defects giving the riders behind a better chance of avoiding them.
The two largest limitations, however, were that it is thought that all cyclists filmed are regular Bath cyclists and filming during rush hour cyclists would be predominantly commuters. Due to the high number of hills and their difficulty casual cycling levels in Bath tend to be lower than that of flatter cities. Cycling routes regularly, as someone who lives in a city would, allows knowledge of how best to deal with road defects. By extension, this means that cyclists will position themselves on the road to cause minimal risk, however where this position is on the road differs. Different cyclist may have individual preferences in combatting road defects; while some may prefer to cycle around in the middle of the road, others may prefer simply to ride through the road defect if they know how to handle it. What this means is that while some cyclists cycled through the middle of the road defect, due to experience they were safer than someone encountering them for the first time. This is impossible to conclude visually, and so limits the case study.
The other limitation is commuters, which follows on from the regular cyclists. Commuters along with regularly riding the same routes at the same time each day tend to have more relaxed geometry to their bikes, or ride more comfortable bikes in general. Road bikes will be set up more for comfort than racing with lower seats with more padding. Suspension built into bikes, or less stiff bikes, allows them to handle defects in the road much easier than the stiffer road bikes which makes riding mountain bikes, and certain hybrids more comfortable for commuters. This means the case study may not be representative sample of the different styles of cyclists that use the roads.
5.3 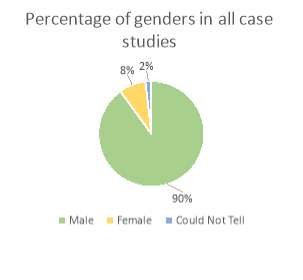 Results
The majority of cyclists recorded throughout the case studies were males, with a few which could not be determined. This is in contrast with the survey where there was a greater balance between genders. As previously found females tended to find road defects more of an issue. Therefore, the case study can be used as a baseline; the results found by the case study can be assumed to be a best-case scenario with the remainder of cyclists fairing worse on the roads.
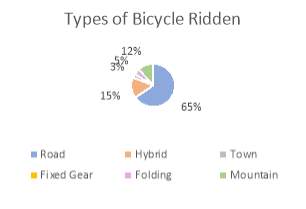 While close, cyclists in the case study were less likely to ride a road bike, but more likely to ride a hybrid than in the survey. As discussed in the limitations, due to the times the case studies were completed, cyclists are more likely to be commuters prioritising comfort over speed. Surprisingly, a much lower amount were found to ride mountain bikes, although there are possible reasons for this. In the survey participants could choose multiple bicycles, however in the case study it could only be observed what they were currently riding. Therefore, these cyclists may have a mountain bike as a secondary bicycle. The other reason may be due to that BUCC has its own off-road team, who all ride mountain bikes, bringing the percentage up in the survey.
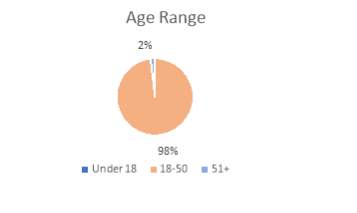 Also in the limitations was the difficultly in demographics, explaining why the age ranges for the case study are so broad. It is of little surprise then that all bar one were observed to be in the 18-50 category, this also a result of the cyclists mainly being commuters
5.3.1 Lower Bristol Road
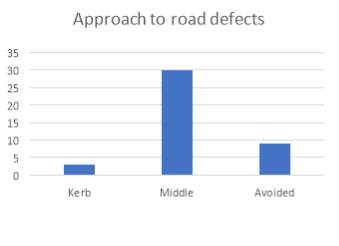 On Lower Bristol Road over half of the cyclists chose to cycle through the road defect, either directly through the middle or nearer the edges where the defect does not sink so far into the road. This is followed by cycling out into the lane to avoid the road defect completely, and finally cycling in the narrow area between kerb and road defect. Riding through a road defect adds extra risk to a cyclist whether they ride through the defect regularly or not. The road defect increases the bicycle handling difficulty which, with a slip in concentration or a change in steering workload, can quickly lead to an accident either with or without a motor vehicle involved. This risk is increased further with the presence of a motor vehicle; a vehicle overtaking a cyclist may not expect them to move out quickly as the cyclist regains control from cycling through road defect. It is, however, not as simple as saying that cyclists should therefore avoid the road defects in general, as this presents alternate risks. Avoiding the road defect on the kerb side of the road as presents handling challenges; the width of road to cycle on is much narrower and the kerb, especially when tall, can catch wheels or pedals causing an accident. While cycling into the middle of the road means the cyclists is further into traffic and is now at greater risk from motor vehicles on both sides of the carriageway. Therefore, it is up to the cyclists to choose what represents the lowest risk to them; but this flawed. As previous studies have found, people cannot be assumed to be entirely rational and always reduce the possible risks to them, this is compounded with the fact that it is difficult to calculate the lowest risk scenario on the move.
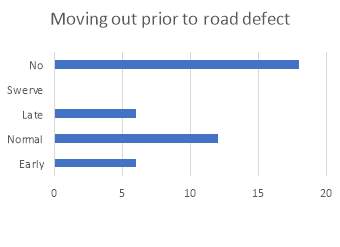
Almost half of cyclists on Lower Bristol Road did not change their path before encountering the road defect, this could be due to them having not seen the defect, or more likely due to them knowing the impact it would have on their cycling. Those who did move out did so with plenty of time before the road defect, however there was a minority who moved out late. Moving into the position that the cyclists wants to hold through the road defect in good time allows any adjustments to be made by the cyclists to ensure they are on the line of least risk. It also shows to the motor vehicle behind the position the cyclists will be taking through the road defects, which allows them to plan any overtakes with greater knowledge of the location of the cyclist. Moving late increases the risks of not being in the right position, whether through or around the defect, which may cause greater issues in bicycle handling.
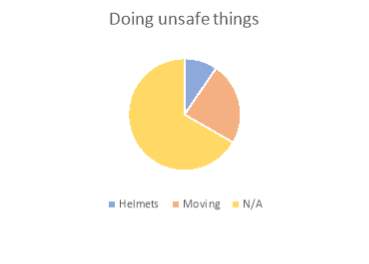 The case study also took note of what cyclists were doing to bring avoidable harm to themselves. A repeated argument against cyclists is that they do not take enough care about their own safety, and are often said to break the rules of the road and completing dangerous manoeuvres. Following on from the time before to move out, several cyclists were observed to move out into the middle of the road without checking behind them for a motor vehicle. While it could be argued that the cyclists could have been able to hear a motor vehicle behind them, the position of the vehicle would not have been able to be distinguished from sound alone. Without looking, the cyclist would be unsure if the motor vehicle was attempting an overtake at that time, which be put in jeopardy by the cyclists moving out suddenly. Cyclists were also observed riding without a helmet, while it is not illegal to ride without a helmet in the UK, the damage that can be caused to the rider is much greater than if they were wearing one. It could be argued that it lowers the chance of being involved in a vehicle accident (Walker, 2014), but the risk of serious head injuries outweighs this possible slight improvement.
Those who cycled through the road defect, were also the most likely to not move prior to encountering it. These cyclists did not deviate from their original cycling route even though there was a road defect. This is either again due to them not knowing about the defect, or that that was their preferred method of dealing with the defect.
Those who avoided the defect by cycling in the middle of the road tended to move out either early or in normal time, with only one moving late to completely avoid the defect. This may be due to the added distance that the cyclist needed to move to avoid the defect.
5.3.2 Widcombe Hill
Here a much lower percentage of cyclists were female, with only 1%. This figure is much lower than suggested by the survey and in the other case study. This may be due to there being multiple possible routes to descend from Bath University with others preferred by females.
As shown in Figures XX and XX, there is a greater space between the kerb, which in this case is replaced by either a wall or parked cars, than present on Lower Bristol Road. This leads to a large increase in the number of cyclists avoiding the road defect on the kerbside rather than in the middle of the road. While this seems safer due to the increased space it adds additional risks. Moving into the kerb increases the space on the road and may encourage vehicles behind to overtake when it may not be safe to do so. While cycling closer to parked cars has the risk of hitting a wing mirror which protrude into the road, or being hit by an opening door.
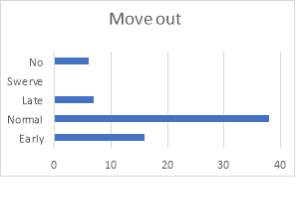
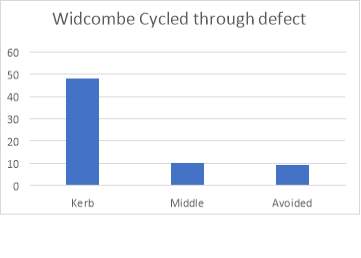 A much lower percentage of cyclists cycled through the road defect. Avoidance of the road defect seemed to be a higher priority than on the flatland. The higher speed, due to the road being downhill, amplifies the effect of the road defect meaning that cyclists are more likely to prioritise avoiding it to reduce the risk. As such a high number of cyclists avoiding the road defect the number of cyclists needing to adjust their position of their bike drops dramatically. There is, however, a noticeable drop in the relative percentage between those who did and did not adjust their position. This could be, due to the higher speeds, that those who did cycle through the road defect did not have enough time to adjust their position before riding through the defect.
Cyclists were less likely to not change their path approaching the road defect. Those who moved out were much more likely to move out early than on Lower Bristol Road. As previously stated the amplified risk of the defect means that cyclists prioritise avoiding it, which is much easier if given a greater amount of time to prepare.
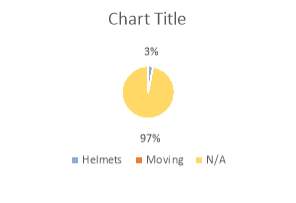 Widcombe Hill has many stretches of parked cars along both sides of the road. Riding close to parked cars, especially when cars are coming in the other direction, can be very dangerous for cyclists. People inside a parked car may not notice a cyclist and open their door; while a cyclist with good reactions may be able to avoid the door, many riders would not. Those who would may suffer loss of control from the quick change in direction or on narrow streets put them into the path of an oncoming vehicle, which is as dangerous as the risk of the original car door. There was, however, a drop in the percentage of cyclists not wearing a helmet; however due to faster nature of the road, if an accident did occur it would likely be more serious than on the flatter Lower Bristol Road. The seriousness of the injury would be increased by not wearing a helmet, making descending without a helmet a high risk to take when it is easily preventable.
While these dangers were observed, the bigger picture is that these cyclists are in the minority. The majority of cyclists are doing everything possible to keep themselves safe on the road and so it is the other risks that need to be reduced to improve safety.
5.4 Conclusion
 The case study has shown that road defects effect the majority of cyclists, backing up what was found in the survey. It has also shown that cyclists are putting themselves into riskier situations than they may realise themselves; moving too close to the kerb, further into traffic or close of parked car doors. Again, it showed that those on narrower tyres suffered greater than those on larger tyres; with road bikes taking up the majority of cyclists, this strengthens the argument that cyclists are suffering from the poor road conditions.
With only a minority of cyclists taking extra risk that are easily negated, not wearing a helmet or not checking for vehicles before moving out, it can be said that these risks are not due to bad cycling habits but as a consequence of the road conditions they have to ride on.
While it has been clearly shown that road defects are putting cyclists at risk, it is not simple for councils’ to just increase their road maintenance budgets to accommodate the extra cost needed. This is also compounded with the fact that not all road maintenances are entirely beneficial to cyclists. A balance must be found between the cost of improved road maintenance, the types of road maintenance completed as well as the economic impact of cycling accidents; a cost benefit analysis will therefore be conducted.
6.0 Cost Benefit Analysis
The survey and case studies paint a tough picture of the social impact of road defects on cyclists; there is a significant economic impact that accompanies it. Turning the loss of human life, or serious injury into a simple numerical figure may seem dehumanising but it is useful to show the wider impact that cycling accidents have on society. This figure is to be used in conjunction with the differing costs and lifespans of different road maintenance techniques. This figure includes the cost of compensation, as well as the other cost associated with accidents. The aim of this analysis is to produce a scheme that not only works to prevent cycling accidents occurring due to road defects, but also one that does not overspend the limited budget already faced by councils. To ensure a scheme that could be practically implemented into the real world the road maintenance techniques chosen are not ones that require constant upkeep or cause excessive disruption to motor vehicles. Their appropriateness for cyclists will be discussed in the cost benefit analysis.
The least time consuming, and always overlooked, method is to not repair the road between full scale road repairs. The roads are left to deteriorate until they no longer function as roads for motor vehicles as well. While no money is spent on road repairs in between full scale road repairs, the costs of this method would be much higher. Greater compensation to both cyclists and motor vehicles as they are damaged while traversing the road as well as the more frequent road replacements, as roads degradation is not checked by minor repairs, means that this method has many more costs associated with it. The added fallout from drivers and cyclists alike from this extreme scenario show that the maintenance scheme has many things to balance. These things may not be simple linear relationships but change elastically as other variables change. This makes the cost benefit analysis difficult, therefore there has been many simplifying assumptions to allow it to be completed.
This is not designed to be a comprehensive analysis of all possible road maintenance schemes as there are many differing types and the skills of contractors vary throughout the country which varies repairs’ lifespans and therefore their costs. However, it is aimed to show a system where the cost and prevention of cycling accidents is included in the cost benefit analysis and provide a framework that can be copied by others.
6.1 Limitations
The primary limitation of this analysis is to do with the difference between non-highway roads, as defined by the UK government, and roads which are actually trafficked by bicycle. While the length of roads in the UK and in BANES is easy to calculate, many of these roads are infrequently travelled by bicycle and motor vehicle alike. Most accidents occur on highly trafficked roads where bicycles and motor vehicles interact frequently and road conditions tend to dictate safety more. This information would not be possible to receive without tracking every single bicycle journey in the UK; while there are mobile applications that track this data, not every cyclist uses them and access to this data is restricted to only the individual rather than a country as a whole.
This cost benefit analysis looks purely at the economic costs of poor roads and bicycle accidents, however, there are many other forms of costs and benefits that could be considered. Most of which are hard to quantify as simply as the economic cost. The main one is the moral cost; the death of a friend or family member carries a much higher moral cost. While these accidents have been reduced to a monetary cost for this analysis, the moral cost is impossible to quantify. Even if the accident does not result in mortality a moral cost may still be there; the loss of enjoyment in cycling, the loss of a way of life, the loss of a transport method. There are also environmental costs and benefits to be considered and whether the increase in road maintenance would be offset by the reduction in motor vehicles on the road. To keep the roads in a better state, the rate of road repairs would probably have to increase. Road maintenance produces many harmful pollutants during both its manufacturing of the materials and installation. This gain would be offset by the expected reduction in motor vehicles, however whether it would benefit or cost more to the environment is unknown without further study which is outside the scope of this dissertation. The expected reduction in motor vehicles would lead to further benefits: reduced congestion on the road shortens journey times and pollution; reduced daily pollutant levels compounded with higher levels of physical exercise improves public health; reduced road wear leading to slower road deterioration and a reduction in future road maintenance.
As the cost benefit analysis is looking at solutions that do not require constant upkeep which would unfeasible for councils, crack repairs are not considered in this analysis. This is also due to the limited information regarding the frequency of crack appearance and the costs associated with repairing them. Crack repairs stop water ingress and further degradation in that area, however, they only affect a small area and is labour intensive to implement. While each crack does not cost much in time or money due to the number of them the costs quickly multiply leading to a large expense and wide spread disruptions.
6.2 Method
To complete this analysis data from local councils and DfT have been used in conjunction with information from BANES council. Using the length of roads in both the UK and BANES compared to the accident figures it can be seen, in Figure XX, that they are similar in terms of the number of accidents per annum. There is a small increase in cost per kilometre, however due to the smaller road length in BANES, the fatality has a much larger effect on economic impact per kilometre. Due to these similarities, it has therefore been assumed for the rest of the analysis that the BANES area is a representative sample for the other councils in the UK.
A theoretical 100m stretch of road has been assumed for this analysis. This road is assumed to be part of a main thoroughfare and can be assumed to take a standard mix of motor vehicles therefore facing similar degradation to most non-highway roads in the UK. The lifespans and costs of each type of road maintenance is combined, along with the economic cost of accidents, to create a variety of different maintenance schemes each with their own specific benefits. This total is then compared through a 75-year timespan to show which is the most economically viable solution to prevent cycling accidents. As the cost each year can vary massively for each maintenance scheme using a long-time period can be used to show over what time period each maintenance scheme is better, and whether there is clear divergence between the different schemes. As the analysis is covering a large timespan inflation takes a real effect on the cost of each scheme, therefore inflation has been considered. While it is understood that inflation fluctuates monthly, a conservative rate of 3% has been chosen to provide an upper estimate of lifetime costs.
The figures for the cost of different maintenance types has been taken from design documents from a variety of UK councils and then averaged. As the cost of road maintenance can vary between regions, choosing a more representative figure is important to ensuring that this analysis can be used by councils other than BANES council. It has been assumed throughout that the cost of labour is similar for each road maintenance scheme and therefore can be ignored in this analysis. As the labour cost may vary regionally, this again makes the analysis more applicable to a wider range of councils.
It has been assumed in this analysis that there is a linear relationship between road maintenance and the reduction in accidents. The expected increase in the number of cyclist due to the safer roads and the safety in numbers effect is not known with certainty. This increase would also lead to an increase in the number of accidents, and therefore economic impact. However, due to the uncertainty, this has been ignored.
6.3 Results
The chosen repair methods were patch repairs, microasphalt, surface dressing, and full depth repairs. As discussed in section 3.7, patch repairs involve repairing the immediate area of a defect to differing levels of effectiveness, in this analysis patch repairs are assumed to be of a good standard and do not require replacement every 6 months. Microasphalt is a mixture of bitumen, aggregate and filler and possibly an accelerant or retardant depending on weather conditions. The ready-mixed material is applied from a spreading truck directly onto the road surface. This mixture does not generally require compaction and can ready to traffic within 2 hours. Surface dressings are all similar but take slightly different forms depending on situational requirements, whether it is in a junction or necessary for vehicles to be quieter on the road. A binder is applied to the existing road surface, and then the aggregate is placed on top. This can either all be the same size, or more often a mixture to ensure strength and reduce noise from vehicles. Full depth repairs are required when, due to degradation, the underlying structure of the pavement has also failed. Here the damaged layers are removed to the solid subbase and then rebuilt as a new road ensuring all defects are removed.
These different methods provide differing lifespans, costs and disruption to the public. Patch repairs are the least disruptive as well as carrying the lowest cost, but this comes at the cost of the lowest lifespan of the others. Surface dressings provide the next cheapest method of road repairs but last longer than that of patch repairs; however, they suffer from the larger disruption to motor vehicles and cyclists. Microasphalt have a similar lifespan to that of surface dressing, and causes much lower disruption with its quick curing time but this comes at a price roughly double than that of surface dressings. The best method for ensuring minimum road defects and with the longest lifespan is the full depth repair; unfortunately, long disruptions and high costs hold it back from being a more suitable frequent repair method.
Surface dressings can cause issues for cyclists during or shortly after they have been installed. The aggregate can either be embedded further by motor vehicles, or scattered over the road. This material is swept up after installation, although material can be left behind after this and then only picked up during regular road sweeping. As seen in the survey results, loose material is a large concern to many cyclists and is often involved in cycling accidents. As microasphalt comes pre-mixed, the quantity loose material left behind is much less of a problem than with surface dressings.
As stated in the method, road repairs requirements are highly elastic and the smallest change in the starting information can change the results vastly. The following results are due to the parameters set out in Appendix D, and therefore can be updated as necessary in future.
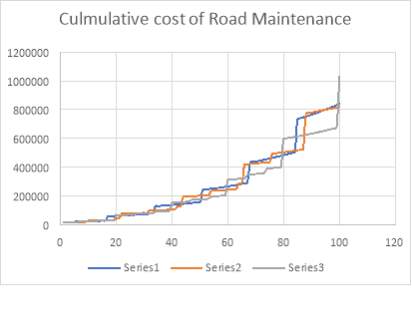 Figure XX compares only using patch repairs and full depth road repairs to the cost of using either microasphalt or surface dressing alongside full depth road repairs. Due to the reduced lifespan of the road, as well as the extra economic impact of accidents only using patch repairs is the most expensive method to ensure good quality roads. Even though it is more expensive than surface dressing the added lifespan and reduction in accidents means that microasphalt treatment is the cheapest. However, this still provides a level of accidents that is deemed unacceptable – while it is impossible to reduce accidents due to road defects to 0, as they cannot be treated instantly in reality, the level could still be lower. Using patch repairs alongside either surface dressing or microasphalt would reduce accidents further.
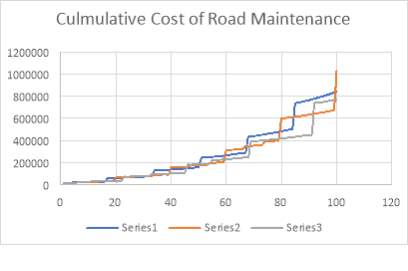 There are two main results to take from the cost benefit analysis; the cheapest and the fewest accidents as these are from two different combinations of road maintenance. Figure XX shows the cost of each of these combinations. A maintenance scheme composed of pothole repairs, alongside regular microasphalt treatment and full scale road treatments would provide the greatest reduction in the amount of cycling accidents as it would consistently provide the most well maintained surface. It is however slightly more expensive per annum when averaged over an extensive time period. Using only surface dressings instead of microasphalt and patching reduces the cost of road repairs; however, this comes at the cost of a lower reduction of cycling accidents. As previously discussed the loose material left behind after installation can cause significant issues for cyclists.
When looking in terms of disruption caused to the general public microasphalt has another advantage; its quicker installation process as well as a shorter time before being able to be trafficked means that roads are closed to motor vehicles for a shorter period of time. Both require a similar level of pre-work including removal of loose material and vegetation, but uneven surfaces may need addressing beforehand. Microasphalt can handle rutting and deformation of the road surface, and with multiple passes even deeper defects, however surface dressing can only handle small deviations. Larger deviations may require specific works, similar to patching, before surface dressing can take place which further extends the disruption that can be caused by surface dressing.
So, while being more expensive than surface dressing which may be a point of contention for many UK councils, the shorter disruption and longer lifespan alongside its effect in the reduction of accidents can make it the better choice.
6.4 Conclusion
The cost benefit analysis has shown that it is possible to produce a maintenance scheme that considers the effect on cyclists. Using an analysis like this allows a system which works for all road users rather than just motor vehicles. The higher cost of these maintenance schemes is offset when considering the economic cost involved in cycling accidents, leading to possible overall savings. Greater savings are made, however, when looking in combination with the possible social and environmental aspects of higher cycling participation.
As previously stated this analysis aims to leave a framework for future analyses that need to consider then economic cost of accidents. With analyses that also consider these accidents it is hoped that this will lead to a shift in the way road maintenance is planned.
7.0 Conclusion
There is a large negative impact on cyclists that stem from road defects from the obvious: accidents that are directly caused by defects, to the personal: reduction in enjoyment and cycling due to the poor roads.
Socially, the public is cycling less and in some case stop cycling all together due to the effect of road defects; they make most cyclists feel unsafe on the roads and take the enjoyment out of it. This is a large problem as two of the main reasons people stop doing something is because of the perceived risk or lack of enjoyment, therefore something is needed to change this perception. In attempts to continue cycling in areas of poor roads cyclists are forced to change their route to lessen this impact. Females tend to suffer worse than males, and this can be seen in the lower levels of cycling participation in females. But this is not a problem that only affects females, or even those who cycle infrequently; road defects cause issues to all cycling abilities not matter how frequently they cycle.
The results of the survey show that the percentage of accidents that are caused by poor roads is higher than that previously thought (Wegman et al, 2012). Even when taking into account the known issues that ice and leaves present, road defects are a significant proportion of accident causes. They were found to cause accidents a greater number of accidents than those involving motor vehicles, although severity was not considered. The social and moral impact of accidents is much greater than the general disruption caused by road defect with significant damaged caused to families and peoples’ livelihoods. Every accident involving cyclists adds to the perceived risk of cycling, further impacting cycling participation in the UK. While the economic impact of these accidents effects both the council and economy, reducing money available for other safety schemes and campaigns.
Cycling through a road defect can lead directly to an accident in the most severe cases, or to loss of control of the bicycle which may cause collisions with other road users or road furniture. The case study highlighted the other risks that the avoidance of road defects can present. Those moving further out into the carriageway increased the risk of collision from overtaking vehicles and even those travelling in the other direction, while those who choose to avoid road defects on the kerbside put themselves at risk of their tyres or pedals colliding with the kerb. Moving to avoid the defect itself can cause issues; for those who swerve at the last moments to avoid the defect the risk of collision is greatly increased. Only a minority of cyclists were observed to be taking extra risks upon themselves; cyclists try to reduce the risk to themselves as much as possible but are still presented with the risks of the road surface.
Reducing the number of accidents could be achieved by reducing the number of road defects that affect cyclists, however this would require an update to the current road maintenance schemes used in the UK. With UK councils already limited budgets, increasing the spending on road maintenance may not be possible. However the cost benefit analysis has shown that when including the economic cost of cycling accidents cost increases can be minimized or even negated. This leads to safer roads for cyclists, with a scheme that works for them as well as motor vehicles and the councils. This analysis also provides a framework that can be adjusted to account for regional differences in cycling accidents, availability of skills, and labour for maintenance techniques.
Poor roads have been overlooked for their social and economic impact, but the number of accidents and loss of life is not negligible. It has a clear impact on peoples’ lives, with added risks that often go unnoticed. However there is an economic and easily implementable system that can be used to reduce the impact of poor roads and increase cycling participation in the UK.
Future Work
Given greater resources and with the aim of improving this work several things could be completed. While the survey gives insight into the cause of cycling accidents using data from police records and hospital admittances would lead to a larger, more reflective view of the causes of cycling accidents nationally. This would allow councils to focus on the needs of cyclists in their area if certain road defects are more prevalent in their area. A more accurate representation of the length of roads cycled in the UK, as opposed to simply the lengths of non-highway roads, would allow for a better cost benefit analysis which could also pinpoint to local councils’ specific areas in which improvement is needed.
There is currently a standard of 40mm before road defects are classed as an issue however, as stated previously, they are an issue for cyclists before this depth. Creating an equality chart between road defects and their effect on cyclists and other motor vehicles would allow better comparisons of the impact that different road defects cause road users.
An interesting outcome of the case study was the reference lines that were trialled. They were discarded due to them creating warning lines for cyclists encountering the road defect. While it was unhelpful for this dissertation, research into the effect that road markings have on the avoidance of road defects could lead to effective temporary warnings to assist in the prevention of accidents.
References
Allan, C. (2016). Cycling UK’s Cycling Statistics. Available: http://www.cyclinguk.org/resources/cycling-uk-cycling-statistics. Last accessed 19th March 2017.
Asphalt Industry Alliance (2016). Annual Local Authority Road Maintenance Survey. Bristol: Asphalt Industry Alliance.
BANES Council. (2015). Pothole Statistics to 2015. Bath: BANES Council
Cavill, N., Kahlmeier, S., Rutter, H., Raccioppi, F., Oja, P., (2007). Economic Assessment of Transport Infrastructure and Policy. World Health Organisation.
Charlton, S. Mackie, H. Baas, P. Hay, K. Menezes, M. Dixon, C. (2010). Using endemic road features to create self-explaining roads and reduce vehicle speeds. Accident Analysis & Prevention. 42 (6), 1989-1998.
Cleland, B. Walton, D. Thomas, J. (2005). The relative effects of road markings on cycle stability. Satefy Science. 43 (2), 75-89.
Council Connect. (2016). Road Damage or Obstruction. Available: http://www.bathnes.gov.uk/services/streets-and-highway-maintenance/highways/road-damage-or-obstruction-0. Last accessed 13th Dec 2016.
Cycling Info. (2012). Cycling Stats in UK. Available: http://cyclinginfo.co.uk/blog/2636/cycling/stats-uk/. Last accessed 19th March 2017.
Cycling UK. (2016). Highway Maintenance. Available: http://www.cyclinguk.org/sites/default/files/file_public/highway-maintenance2qbrf.pdf. Last accessed 13th Dec 2016.
Deeniham, G. Caulfield, B. (2014). Estimating the health economic benefits of cycling. Journal of Transport & Health. 1 (2), 141-149.
Department for Transport. (2015). Reported road casualties in Great Britain: main results 2015. Reported road casualties Great Britain: 2015 annual report. – (1), p11.
Department for Transport. (2016) Road Traffic Statistics – Table TRA0401
Department for Transport. (2016). Road Use Statistics Great Britain 2016. Road Use Statistics., p28.
Elvik, R. (2016). A theoretical perspective on road safety communication campaigns. Accident Analysis & Prevention. 97 (1), 292-297.
Fietsberaad (2009). Cycling in the Netherlands. The Hague: Ministry of Transport, Public Works and Water Management Directorate-General for Passenger Transport. p10-15.
Gamble, T. Walker, I. Laketa, A. (2015). Bicycling campaigns promoting health versus campaigns promoting safety: A randomized controlled online study of ‘dangerization’. Journal of Transport & Health. 2 (1), 369-378.
Gibbard, A. Reid, S. Mitchell, J. Lawton, B. Brown, E. Harper, H (2004). The effect of road narrowings on cyclists. London: TRL Limited.
Heesch, K. Garrard, J. Sahlqvist, S. (2011). Incidence, severity and correlates of bicycling injuries in a sample of cyclists in Queensland, Australia. Accident Analysis & Prevention. 43 (1), 2085-2092.
Heinen, E., Van Wee, B., Maat, K., 2010. Commuting by bicycle: an overview of the literature. Transport Reviews 30 (1), 59–96.
Heinen, E., Handy, S., 2012. Similarities in attitudes and norms and the effect on bicycle commuting: evidence from the bicycle cities Davis and Delft. International Journal of Sustainable Transportation 6 (5), 257–281.
Johnson, M. Oxley, J. Newstead, S. Charlton, J. (2014). Safety in numbers? Investigating Australian driver behaviour, knowledge and attitudes towards cyclists. Accident Analysis Prevention. 70 (1), 148-154.
Josef, A.K.; Richter, D; Samanez-Larkin, G.R.; Wagner, G.G.; Hertwig, R; Mata, R. (2013). Stability and change in risk-taking propensity across the adult life span. Journal of Personality and Social Psychology. 111 (3), 430-450.
Kay, J. Savolainen, P. gates, T. Datta, T. (2014). Driver behavior during bicycle passing maneuvers in response to a Share the Road sign treatment. Accident Analysis & Prevention. 70 (1), 92-99.
Lusk, A.C., Furth, P.G., Morency, P., Miranda-Moreno, L.F., Willett, W.C., Dennerlein, J.T., 2011. Risk of injury for bicycling on cycle tracks versus in the street. Injury Prevention 17 (2), 131–135.
Munster, D.C., Dravitzki, V.K., Mitchell, T.J., 1999. Performance of thermoplastic markings and cyclists safety: Stage 2 Line thickness and skid resistance studies. Opus International Consultants, Central Laboratories Report 99-527550.02, Wellington, NZ.
Parkin, J. Meyers, C. (2010). The effect of cycle lanes on the proximity between motor traffic and cycle traffic. Accident Analysis & Prevention. 42 (1), 159-165.
Phillips, R.O., Ulleberg, P., Vaa, T., 2011. Meta-analysis of the effect of road safety campaigns on accidents. Accid. Anal. Prev. 43, 1204–1218.
Richardson, D.B., 2009. Amalgamation of Police and Hospital Trauma Data in the Australian Capital Territory 2001–2003. Australian National University Medical School, Canberra, Australia.
Szymanowicz,A. Furnham, A.. (2013). Gender and Gender Role Differences in Self- and Other-Estimates of Multiple Intelligences. The Journal of Social Psychology. 153 (4), 399-423.
Thompson, J. Savino, G. Stevenson, M. (2016). A model of behavioural adaptation as a contributor to the safety-in-numbers effect for cyclists. Transportation Research Part A: Policy and Practice. 85 (1), 65-75.
TNO. (2009). Reduced sickness absence in regular commuter cyclists can save employers 27 million euros. Prevention and Healthcare.
Vansteenkiste, P. Cardon, G. D’Hondt, E. Philippaerts, R. Lenoir, M.. (2013). The visual control of bicycle steering: The effects of speed and path width. Accident Analysis & Prevention. 51 (1), 222-227.
Vansteenkiste, P. Zeuwts, L. Cardon, G. Philippaerts, R. Lenoir, M.. (2014). The implications of low quality bicycle paths on gaze behavior of cyclists: A field test. Transportation Research Part F: Traffic Psychology and Behaviour. 23 (1), 81-87.
Walker, I; Garrard, I; Jowitt, F. (2014). The influence of a bicycle commuter’s appearance on drivers’ overtaking proximities: An on-road test of bicyclist stereotypes, high-visibility clothing and safety aids in the United Kingdom. Accident Analysis & Prevention. 64 (-), 69-77.
Ward, T. (2013). How to deal with potholes. Available: https://www.theguardian.com/environment/bike-blog/2013/jan/28/how-to-deal-with-potholes. Last accessed 13th Dec 2016.
Wegman, F. Zhang, F. Dijkstra, A. (2012). How to make more cycling good for road safety?. Accident Analysis & Prevention. 44 (1), 19-29.
Appendices
Appendix A
Survey Data
Appendix B
Case Study Videos
Appendix C
Case Study Video Analysis Results
Appendix D
Cost Benefit analysis Excel File
All of the above appendices are on the memory stick submitted with the dissertation and are named as above for ease of access.
Cite This Work
To export a reference to this article please select a referencing stye below:
Related Services
View all


Related Content
All TagsContent relating to: "Infrastructure Planning"
Infrastructure generally describes the resources, and systems required for a society to function such as transport networks, water, sewage, and electricity systems. Infrastructure planning concerns the creation of new infrastructure and the phasing out of old infrastructure.
Related Articles

DMCA / Removal Request
If you are the original writer of this dissertation and no longer wish to have your work published on the UKDiss.com website then please: