Dissertation on Train Overcrowding Park and Ride Station Choice
Info: 13295 words (53 pages) Dissertation
Published: 17th Nov 2021
Tagged: TransportationCivil EngineeringInfrastructure Planning
Modelling train station choice for park and ride users based on the effect of crowding on trains
Abstract
Crowding on trains has become one of the biggest public transport problems in Australian major cities. However, limited knowledge in the literature is available on how the overcrowding on trains influences park and ride (PnR) user’s choice of train stations. This paper presents an extended expected utility model and latent class model to explore PnR users’ station choice behaviour under the effect of crowding and measured their risk attitude towards crowding measures. The station choice under the risk of crowding behaviour data were collected using revealed preference (RP) and stated preference (SP) surveys. The questionnaires of the SP survey were designed based on D-efficiency. The results revealed how crowding attributes, such as in vehicle travel time, the percentage that seats have been taken the density of standee and the number of days per week on which the trains are too crowded to board, affect their train station choice. We also found that the more crowded on trains, the more risk aversion attitudes towards crowding that respondents have. Furthermore, the data implied that difference of individual’s annual income would influence the heterogeneity of individual’s station choice under the risk of crowding. Based on these, we may suggest a graded train ticket fare system is put in place to make rail travel more attractive to higher income passengers.
Key words: crowding, station choice, park and ride users, risk attitude, extended expected utility theory, latent class model
1. Introduction
Park and Ride (PnR) has been widely accepted as a means to encourage car drivers to combine public transport and private cars. It can reduce traffic demand (e.g. travel and parking demand) in the central of city by providing car parking facilities well outside the central area of the city and linking the facilities to the central city by public transport services. Correspondingly, it can decrease traffic congestion, energy use, emission levels, and other environmental impacts and keep urban sustainable development (Ginn 2009). According to the data from the Transport (2010), the capacity of PnR facilities in Perth, WA is only 17,000. It is inadequate to meet the overall PnR demand in Perth, Western Australia. However, a survey, conducted in 2 July, 2012 by jointing of the University of Western Australia, Curtin University, the Department of Planning (DoP), the Department of Transport (DoT) and Public Transport Authority (PTA), revealed that the demand for PnR facilities distributed unevenly. So far, it is not clear why some stations with PnR facilities are more likely to be chosen by commuters than the others.
Many factors, such as, parking availability, parking search time, travel time to access train stations and crowding on trains, have been identified to influence commuters’ choice (T.Lin and N.H.M.Wilson 1992; Anthony Chen, Ji and Recker 2001; Peter van der Waerden, Aloys Borgers and Timmermans 1998; Hess 2001). Crowding on trains is one of the most frequently encountered by Australian and other countries’ passengers (Thompson et al. 2012; Cox, Houndmont and Griffiths 2006). Generally, its effect can be concluded into two categories: 1) the effects on passengers and 2) the effects on operators. From a passenger’s perspective, these effects can be further divided into physical or psychological effects. T. Cox, J. Houdmont, and Griffiths (2006) and D. Katz (2010) stated that crowdedness on trains were perceived by railway commuters as serious safety and security issues;, Lundberg (1976), N. D. Mohd Mahudin, T. Cox1, and Griffiths (2011) found high density of passengers could increase anxiety and stress levels measured by the rate of catecholamine excretion. The discomfort feelings grew more intense as the density of passengers increased. T. Cox, J. Houdmont, and Griffiths (2006) and Gregory J. Nicosia et al. (1979) found that the stress related to rail travel has more variations in regards to the social and ecological trip conditions than the length or duration of trips. Kanhneman et al. (2004) explored its effect on commuters’ health. N. D. Mohd Mahudin, T. Cox1, and Griffiths (2011) showed evidence that crowding could lead to more somatic symptoms such as headaches, tension, stiff muscles, and sleeplessness.
Alejandro Tirachini, David A. Hensher, and Rose (2013) found that crowding could increase riding time, boarding time, alight time and waiting time due to friction among passengers as well and asserted crowding inside buses might be more problematic for alighting than for boarding. Fernández (2011) also achieved the similar result with a laboratory experiment. Overcrowding on a train can not only increase in-vehicle travel time and waiting time, but also influence travel time reliability which would frustrate commuters with uncertain arrival time for work. Correspondingly, crowdedness can affect commuters’ travel choice. Currently, only rout choice, travel mode choice and departure time choice were found. A. Sumalee, Z. Tan, and Lam (2009), Leurent and Liu (2009),Y. Hamdouch et al. (2011), and J.-D. Schmöcker et al. (2011) developed disutility functions for understanding the impact of crowding on passengers’ mode choice and access station choice. S. Raveau, J.C. Muñoz, and Grange (2011) also established a route choice model for public transit networks to explore the effect of overcrowding on train carriages on choosing a route in a transit network by public transit users; Joon-Ki, Backjin Lee, and Oh (2009) established a bus choice model with a binary logit design explaining why commuters did not choose the first bus with high occupancy rate. Bill Davidson et al. (2011) established a new strategic transport model, including capacity and crowding modules, for Metro network transport model (MNTM) to predict ridership.
From the operators’ perceptive, overcrowding could affect operating speed and cost and public transport ridership. Therefore, crowding was often considered as an index for evaluating public transport service quality. Some intervention strategies, such as increasing service frequency and enlarging vehicle size, can be implemented for further improvement. Batarce, Muñoz, and Ortúzar (2016) explored the effect of crowding on the public transport system’s demand and users’ benefit by comparing outcomes from three transport policies improving bus corrido operations. They found increasing frequency would overestimate demand and users’ benefit. Alejandro Tirachini, David A. Hensher, and Rose (2013) summarised the effect of crowding on public transport system’s reliability, optimal supply and pricing. Based on these, they suggested public transport operators should determine the service frequency and capacity with consideration of effect of crowding.
Crowding on trains was measured objectively and subjectively. Objective measurement is diverse. The most common metrics used in quantitative assessment include load factor, which is the ratio of the actual number of passengers inside vehicles to the number of seats (Whelan and Crockett, 2009); passenger loading based on levels of service (Lam, Cheung and Lam 1999); the percentage of standee class passengers standing (Sarah Blunden et al. 2011); standing passenger area (i.e., space (m2) per standing passenger); the number of standing passengers per square meter; the rolling hour average loads and the length of standing time (zheng Li and Hensher 2013). Given that these objective measurements cannot capture individual’s perception for crowding, some researchers suggested the crowding should be two dimensions including objective and subjective measurements and subjective measurements can be influenced by physical antecedents, interpersonal, individual characteristics and modifiers (Turner et al. 2004; Sundstrom, Busby and Asmus 1975). However, few quantitative metric of subjective crowding was identified to date (zheng Li and Hensher 2013).
The previous literature on station choice is also limited, especially for the study of the influence of crowding. Currently, only one nested logit model for access station choice, developed by Debrezion, Pels, and Rietveld (2009), was found. It only can test the effect of the accessibility indicator on station choice, rather the effect of crowding on trains directly, given that crowding measures were integrated with other factors into the accessibility indicator, rather an independent attribute contributing to the alternative’ utility. Other station choice models were developed within the discrete choice theory as well even though crowding was not taken as a factor. The simplest model is the linear logit model developed by Kastrenakes (1988) based on location of station, access time, frequency of service and generalised cost. This model is mainly used for prediction of rail ridership to specific stations by NJ transit. More complicated models, such as nested and cross nested logit models, were developed by some researchers (Fan, Miller and Badoe 1993; Davidson and Yang 1999; Lythgoe and Wardman 2004; Lythgoe, Wardman and Toner 2004; Wardman 1997) were applied to station choice modelling. In general, all current models were developed within discrete choice theory and aimed to understand the relationship between access mode and train station choice to forecast train ridership. In other words, the effect of crowding on station choice hasn’t been carefully studied so far.
Therefore, this paper focused on modelling train station choice under the effect of crowding for PnR users within discrete choice theory. Based on this model, we can estimate the effect of crowding on station choice directly and measured the PnR users’ risk attitude towards crowding in typical week day.
The rest of the paper is structured as follows.
Section 2 discusses data collection methods, followed by the modelling methodology in section 3.
The estimation results and the implications of the analysis for transportation planning are presented in section 4.
Section 5 elaborates the model validation.
Finally, in Section 6, the paper is concluded with some remarks, conclusions and limitations.
2. Data collection
2.1 Attribute identification
To quantitatively depict the effect of crowding on station choice for PnR users, four attributes were identified as the most important factors in the paper based on previous literature. They are the percentage that seats have been taken, the density of standee in a train carriage during normal situations, the number of days per week on which the trains are too crowded to board and in vehicle travel time. The first two factors belong to load factors, the third one indicates the probability of not being able to board on trains due to overcrowdings. The extreme situation in the paper is identified based on the crush capacity proposed by Conner (2011) and crowding rates suggested by Nicholls (2017). The crush capacity proposed by Conner (2011) is 7 passengers/m2 and the crowding rates is 1.25, so the maximum density of standee in a train carriage is 8 persons/m2. After all seats were taken, the crush density of standee in a carriage is 8 persons/m2. This means it is too crowded for anyone to board trains. Attributes and their levels are listed in the table 1.
Table 1. Attributes and attribute levels
| No. | Attributes | Level | Description | Explain |
| 1 | The percentage that seats have been taken at 7:00am on a typical weekday | 3 | ①50%
②75% ③100% |
①half seats taken
②three quarters seats taken ③all seats taken |
| 2 | The density of standee at 7:00am on a typical weekday | 3 | ① 2
② 4 ③ 6 |
① 2 passengers/m2
② 4 passengers/m2 ③ 6 passengers/m2 |
| 3 | Number of days per week on which the trains are too crowded to board | 3 | ① 0
② 20% ③ 40% |
①0 day per week
② 1 day per week ③ 2 days per week |
| 4 | In vehicle travel time | 3 | ① 10
② 20 ③ 30 |
① 10 mins
② 20 mins ③ 30 mins |
2.2 Stated preference (SP) experimental design
The SP experiment was designed based on D-efficient approach (citation) using solver tool in excel. It aims to minimise the standard errors of the parameter estimation or the elements of the asymptotic variance-covariance matrix (AVC), resulting in more reliable parameters estimation for a fixed number of choice observations. The combination of attributes and attribute levels in the SP experiment was determined by fractional factorial designs. Therefore, a reliable outcome of the parameter estimation can be obtained with a small amount of scenarios.
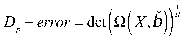
Many statistical indices can show the efficiency of an SP experimental design (John M.Rose and Bliemer 2009). The most common measure within the literature is that of D-error. The D-error of a design can be calculated by taking the determinants of AVC and applying a scaling factor  in order to take the number of parameters into account:
 (1)
(1)
Where  is an asymptotic variance-covariance matrix of parameter estimates, its specification given by Eq. (2)
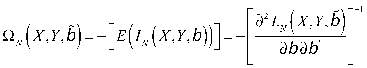 (2)
(2)
 is a fisher information matrix, its specification is shown as:
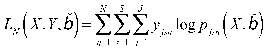 (3)
(3)
Finally, twelve scenarios were developed with a different combination of two choice sets, 4 attributes and their corresponding levels.
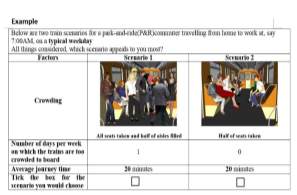
The outcome from the experimental design is questionnaires. In order to make them succinct and easily readable, we used a picture to depict crowding levels and simple words to explain the situations. An example of questionnaires is shown as figure 1.
2.3 Survey location and implementation
Seven train stations (i.e., Murdoch station, Claremont station, Greenwood station, Warwick station, Warnbro station, and Midland station and Cannington station) in Perth, WA were chosen by our industry partners as survey locations. The survey had been conducted for 7 working days from 8:00 am to 3:00 pm. Respondents invited to participate in the survey are those waiting for their trains coming on the platform. More than 600 respondents took part in the survey. Each respondent was presented 4 scenarios. A total of 2379 questionnaires have been completed in this survey.
3. Research method (Model formulation)
3.1 Introduction
According to Knight (1921), risk is a situation involving a randomness which is faced with. Crowding could be a random event for a train station due to a variation of the trip demand. Therefore, the train station choice based on the effect of crowding for PnR users was defined as a decision under risk. Roughly, there are two kinds of decision-making theories under risk, i.e., expected utility theory (EUT) and non-expected utility theory. Extended expected utility theory (EEUT) and prospect theory (PT) are two main representations of non-expected utility theories. In this paper, we attempted the EUT and EEUT methods in modelling the station choice behaviour under the effect of crowding on trains in this paper, given an assumption that people are expected utility or benefit maximising.
Different from previous literature, the pictorial displays of the two load factors (i.e., the number of people sitting and standing in a carriage) in the paper are front (i.e., horizontal view), rather from above (i.e. a bird’s eye view). Because these two factors were illustrated in one picture (see the figure 2), their effects on station choice may not independent. Therefore, we measured their interaction effect of these two factors. The unit is passengers/m2 .
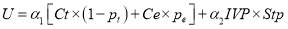
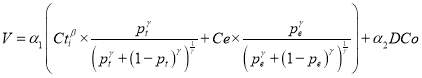
In this study, crowding and comfort on trains were taken as main contributors to the utility of station choice. We assume that their relationships are linear and additive. The utility function of station choice under the effect of crowding can be written as the follows:
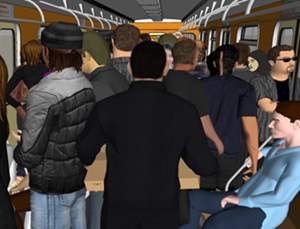
Figure 2. The situation which all seats have been taken, and all aisles have been filled.
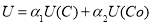 (4)
(4)
Where  is the utility;
 is the crowding on trains;
  is the comfort on trains; and
  are estimated parameters.
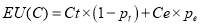
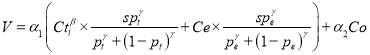
We assumed that the utility from the comfort on trains is measured by the interaction of the probability that seats have been taken with in-vehicle travel time, the utility function for comfort on trains can be written as the equation (5).
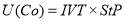 (5)
(5)
Where  is the utility from comfort on trains;
  is the in vehecile travel time, which is the amount of time spent travelling on trains; and
  is the probability that seats have been taken in a train carriage.
For the utility from crowding on trains, we assumed that it was determined based on crowding level in typical week day , the extreme crowding for all stations and their probabilities. The detailed specifications were developed within Expected utility theory and Extended expected utility theory separately.
3.2 Model specifications developed under the expected utility theory
3.2.1 Expected Utility Theory (EUT)
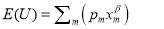
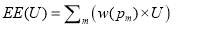
Expected utility theory (EUT), accepted as a normative model of rational choice, has dominated decision making under uncertainty (or risk) for many years(Kahneman and Tversky 1979). It states that all reasonable decision makers choose between risky or uncertain prospects by comparing their expected utility values, i.e., the weighted sums obtained by adding the utility values of outcomes multiplied by their respective probabilities (Hillel J. Einhorn and Hogarth 1981; Neumann and O.Morgenstern 1994). Therefore, the simplest utility function within EUT can be written as the mathematical expectation of the utility of the outcomes. Its specification is given in Eq. (4) when linear-additive of expected utility is assumed:
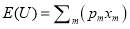 (6)
(6)
Where  is the expected utility of choosing a train station; m is a set of outcomes;
  is the objective probability of outcome m;
  is the utility of relevant outcome m.
EUT models also postulated non-linear functional forms. A power form utility function was used in the paper (see Eq. (7)).
 (7)
(7)
Where  is an estimated parameter indicating decision makers’ risk attitude towards the outcomes.
3.2.2 Utility function specification of station choice within EUT
3.2.2.1 Linear EUT model
Mentioned above, the expected utility of each train station was influenced by crowding level in typical weekday and extreme crowding. It is a weighted average of the utilities of each of its possible crowding outcomes.. A expected utility function for crowding on trains within EUT can be written as the sum of the product of crowding level and its probability. Its utility specification is given as the equation (8).
 (8)
(8)
Where  is the linear expected utility produced by crowding on trains;
  is the crowding level in typical week day;
 is the extreme crowding level, here is 8 passengers/m2 for all stations;
  is the probability that the extreme situation happened, it can be calculated based on the number of days per week on which trains are too crowded to board
 , i.e.,
  ; and
; and  is the probability that typical crowding level happened, it equals to
  .
.
Together with the effect of comfort on trains, the linear expected utility function of station choice within EUT can be written as the follows.
 (9)
(9)
3.2.2.2 Non-linear EUT model
The non-linear EUT model jointed all attributes containing in the linear EUT model and risk attitude parameter, as such it could not only explain PnR users’ preference for the factors influencing their choice, but also reveal their risk attitude towards these factors. In the paper, the simple power form was adapted for eliciting PnR users’ risk attitude towards crowding. Based on these, the non-linear utility function for measuring the effect of crowding on trains can be written as follows:
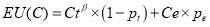 (10)
(10)
Where  is the parameter indicating P&R users’ risk attitude towards crowding on trains.
Insitituting the euqaiton (10) into the euqaiton (4), the non-linear utility fucntion of station choice under EUT was developed, its specifciation is given in the eqaution (11).
 (11)
(11)
3.2.2.3 Risk attitude and its measurement
Based on EUT, the decision is made based on the expect utility value for each station choice alternative. The risk aversion means the certainty equivalent is smaller than the alternative’s expected value; risk seeking is the certainty equivalent is larger than its expected value. Then, the value function is concave for risk aversion and convex for risk seeking (see figure 3).
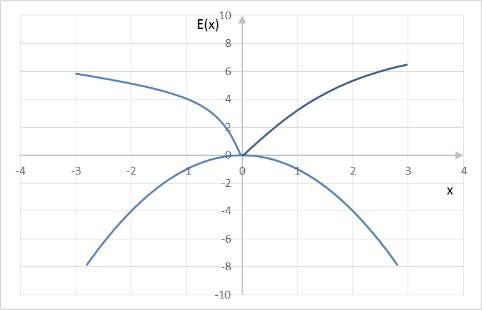
Figure 3.Risk aversion under EUT.
Usually, the EUT takes into account that individuals may be risk aversion and the risk attitudes are unchanged under affine transformations of utility functions and directly related to the curvature of the utility function Moreover, the bigger that curvature of the utility function is, the higher the risk aversion (Neumann and Morgenstern 1953). Different measures were defined to measure the scales of risk aversion since expected utility function is not unique. The most common and frequently used measures include Arrow-Pratt measures of absolute and relative risk-aversion named by W.Pratt (1964) and Arrow (1971).Here, we used the coefficient of relative risk aversion (CRRA) to measure risk aversion, given that it is a unit-free measurements of sensitivity (Rubsinstein 2006). Its specification is shown as:
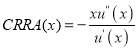 (12)
(12)
Where  and
and are the first and the second deviate of the utility function; and
  is the coefficient relative risk aversion.
Based on the equation (12), the coefficient of relative risk aversion for crowding on trains in the paper can be inferred as:

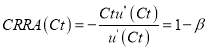 (13)
(13)
The bigger its absolute value, namely, the bigger that the curvature of the utility function, the more risk aversion that respondents presented.
3.3 Model specification developed under extended expect utility theory
3.3.1 Extended expected utility theory
For EUT models, the probabilities of different outcomes presented in a choice experiment were directly used to weight utility. Actually, respondents often transformed it based on their experience and cognition, so their perceptual probability can overweight or underweight the objective probability, especially at the extremes of the occurrence distribution. Given this, non-linear probability weighting was introduced into the non-EUT to form extended expected utility theory proposed by Zheng Li, David A. Hensher, and Rose (2009). In other words, it incorporates a non-linear probability weighting function in to the EU framework separately and refers to the EU model with non-linear probability weighting. Its specification is given in equation (14)
 (14)
(14)
Where  is a probability weighting function.
The probability weighting function, proposed by Daniel Kahneman and Tversky (1979), was widely used in behavioural economics, its specification is shown in the equation (15). It together with another three popular probability weighting functions, proposed by Goldstein and Einhorn (1987), and Prelec (1998), were used in the paper.
TK 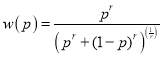 (15)
(15)
GE 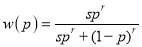 (16)
(16)
PreI 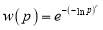 (17)
(17)
Pre II 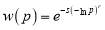 (18)
(18)
Where  are estimated parameters.
3.3.2 The station choice model developed under extended expect utility theory (EEUT)
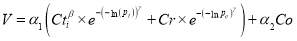
Instituting the equation (15)-(18) into the equation (14), the utility functions of station choice based on the effect of crowding on trains were developed within EEUT and its specifications were shown in the equations (19)-(22).
 (19)
(19)
 (20)
(20)
 (21)
(21)
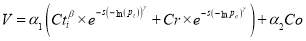 (22)
(22)
Given that the utility value function developed under EEUT is same as it in the non-linear EUT model, the CRRA can be gotten by the equation (13).
3.4 Latent class model
According to Train (2003) and Greene et al. (2014), The latent class model (LCM) is a semi-parametric approximation to the random parameters multinomial logit model that resembles the mixed logit model. It is somewhat less flexible than the mixed logit model but it does not require an analyst to make specific assumptions about the distributions of parameters across individuals. Hence it usually used to analyse individual heterogeneity and is popular in psychology and marketing studies.
Within the LCM, individual behaviour depends on observable attributes and latent heterogeneity that varies with factors that are unobserved by the analyst. Assuming that individuals are implicitly sorted into a set of  classes and mixing distribution
  is discrete, then the choice probability can be calculated based on the equation (23).
 (23)
(23)
Where  is the probability that the
  respondent chooses the
  alternative;
 is the share of the population in segment
 ;
;  is the number of class; and
  is estimated parameters for the
  class.
4. Results
4.1 Estimation of parameters
We started with linear EUT model, and then extended to non-linear EEUT models. All parameters in these models were estimated within multinomial logit model with Nlogit5 package.
4.1.1 Models within EUT
The parameters in the linear and non-linear EUT models were summarised in the table 2.
Table 2. Estimation of parameters for EUT models
| linear EUT model | non-linear EUT model | |
 |
-0.01341 | 0.000001 |
 |
-0.01310*** | -0.02070*** |
 |
10.4431*** | |
| Reference | 0.11392*** | 0.08967*** |
| Log Likelihood | -1648.25247 | -1641.85502 |
| Inf.Cr.AIC | 3302.5 | 3291.7 |
| Chi-square | 15.65955 | 37.85124 |
| Significance level | 0.00040 | 0.00000 |
Note: ***, **,* is Significance at 1%, 5% and 10% level
For the linear EUT model, all estimated parameters were statistically significant at 99 percent confidence interval with the exception of the parameter, namely, crowding on trains. The estimated parameter for was negative, which meant the more seats have been taken or the longer time the travel spent, the less utility that a train station had, which is aligned with what we expected. The reference (station 1) specific constant is positive, which indicated the sampled respondents prefer to the first alternative after account for observed influences.
Comparing with the linear EUT model, the non-linear EUT model delivered the similar behaviour response, even though it introduced an extra parameter, i.e., risk attitude parameter. The difference between these two models is that the value of parameters estimated within EUT model. The coefficients of variables of the non-linear EUT model is a little higher than these of the linear EUT model. In the non-linear EUT model, the parameter  , respondents’ risk attitude, is significant at 99 percent confidence interval, which means it does have an effect on station choice. Based on its value (i.e.,10.4431), the value function’s shape is concave in the third phrase (see the figure 4). Correspondingly, PnR users’ attitude towards crowding on trains in typical weekdays is risk aversion. Moreover, the CRRA for the non-linear EUT model is -9.4331.
Though both EUT models can fit the collected data based on the model’s significant level, their parameters estimation is similar with each other as well, we still believed the non-linear EUT model is better than the EUT model due to the AIC index (Akaike Information Criterion).. The smaller the AIC,, the better the model is. The index for the non-linear EUT model is 3291.7, which is smaller than the linear EUT model’s ( 3302.5). Therefore, the non-linear EUT model was considered to explore the station choice behaviour for PnR users in the following.
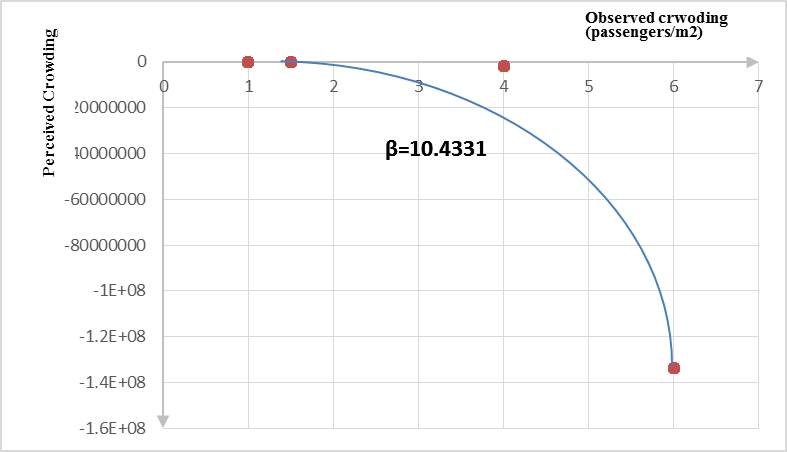
Figure 4. The value function in Non-linear EUT utility function
4.1.2 EEUT models
The parameters in the EEUT model with TK weighting risk function (see the equation (15)) were estimated by the Nlogit 5 and its result is shown as in the table 3.
Table 3. Estimation of parameters in the EEEU model with TK weighting function
| Eq. (14) | |
 |
-0.27669 |
|
-0.03335*** |
 |
2.65367*** |
 |
0.17229 |
| Reference | 0.05243 |
| Log Likelihood | -751.04433 |
| Inf.Cr.AIC | 1512.1 |
| Chi-square | 38.08438 |
| Significance level | 0.000000 |
Note: ***, **,* is Significance at 1%, 5% and 10% level
Similar with the non-linear EUT model, the sign of preference parameters were negative and the parameters, and , were significant at 99 percent confidential interval. Moreover, the parameter is also greater than 1, which means respondents’ attitude towards the crowding in the typical day based on the EEUT model is also risk aversion. Moreover, the curve of its value function is third phrase and its shape is concave (see the figure 5). Additionally, the CRRA in the EEUT model with TK weighting function is -1.65367. However, the parameter
 , indicating non-linearity of object probability, was not statistical significance, but it does an impact on the shape of weighting function. The
  in the EEUT model equals to 0.17229, which shows very obviously non-linear in probability weighting and its shape is verse S (See the figure 6), and also indicates people overweight crowding on trains that are merely probable in comparison with the crowding on trains that are mostly certain. (e.g.,
  ).
).
The parameter crowding () is not statistical significant, but it does have effect on PnR users’ choice for departure station choice (it equals to 0.27669). Moreover, its effect per unit is bigger than the effect of comfort environment(0.27669 vs 0.0335). In other words, the effect of crowding in a typical week day is more than the influence of comfort on trains for PnR users in choosing a departure train station.
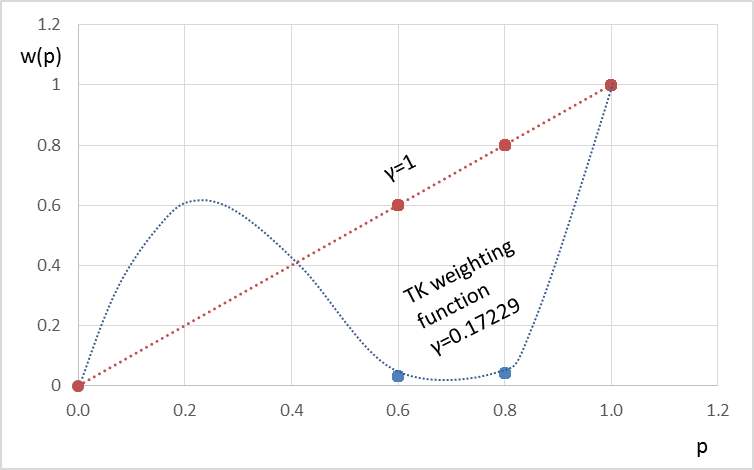
Figure 5. The value function in EEUT model
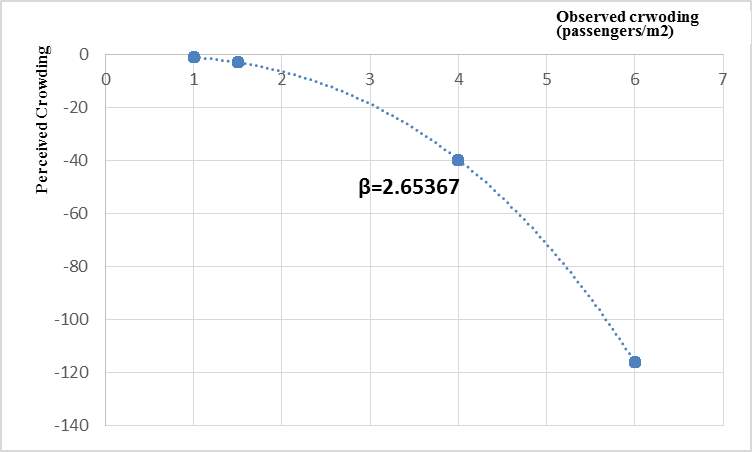
Figure 6. The shape of TK weighting function
4.1.3 The comparison of the non-linear and EEUT Models
Compared the non-linear EUT model with the EEUT model with TK weighting function, we found their results are similar, including PnR users’ response to station choice and risk attitude towards crowding. Moreover, both of them can fit the collected data well (significant level is near zero). Even these, EEUT model was considered to be better than the non-linear EUT model, the reasons are: 1) the parameter indicating respondents’ preference for crowding on trains, estimated under the non-linear EUT model is zero, which means the crowding has no influence on the station choice for PnR users. This is not according with what we surveyed and expected. 2) Both statistical indices, AIC and Log Likelihood, from the EEUT model are less than them from the non-linear EUT model (i.e., AIC: 1521.1 vs 3291.7 and Log Likelihood: │-751.0443│ vs │1641.85502│), which implied the EEUT model is better; 3) the respondents’ risk attitude measurement from the EEUT model is more reasonable.
Therefore, the following study will be carried out based on the EEUT model with TK weighting function.
4.1.4 The comparison of EEUT models
Another three popular weighting functions GE, PreI, PreII, together with value function with power form, were tested as well in the paper. The parameters in these models were estimated within MNL model in the table 4.
Table 4. Estimation of parameters in the EEUT models
| EEUT model with TK weighting function | EEUT model with GE weighting function | EEUT model with PreI weighting function | EEUT model with PreII weighting function | |
 |
-0.27669 | 6.03511 | -0.18290*** | 12.4712*** |
 |
-0.03335*** | -0.02117*** | -0.02219*** | -0.01590*** |
 |
2.65367*** | -0.19928 | 1.49265*** | 5.30915 |
 |
0.17229 | 0.24472 | 0.29140 | -2.61314*** |
 |
6.29036 | 0.30639D-04 | ||
| Reference | 0.05243 | 0.07004 | 0.07101* | 0.09837** |
| Log Likelihood | -751.04433 | -1638.87008 | -1638.81661 | -1645.21150 |
| Inf.Cr.AIC | 1521.1 | 3289.7 | 3287.6 | 31.13828 |
| Chi-square | 38.08438 | 43.82113 | 43.92807 | 3302.4 |
| Significance level | 0.00000 | 0.0000 | 0.000000 | 0.00002 |
The results in the table 4 showed the EEUT model with TK weighing function fit the collected data the best based on all statistical indices, specifically for AIC, a measure of the relative quality of statistical model for a given set of data, AIC from the EEUT model with TK weighting function is 1521.1 which is much less than the value from other three EEUT models.
From the table 4, we also found only the estimation from the models with TK and Pre I weighting functions were aligned with what we expected. In detailed, the effect of the attributes associated with crowding on station choice for PnR users in both models are negative, which implies the more crowded on trains, the more discomfort environment on trains, the less utility the station created. Moreover, the shape of value function is concave (see the figure 7) and the respondents’ attitude towards crowding on trains is risk aversion which are according with what the expected utility theory took into account. Furthermore, the estimations of  in the both models are 0.17229 and 0.29140, although, they are not statistically significant. The shape of their weighting functions is verse S shape and the outcome with high probabilities tend to be underweighted. The two models have some differences, one is parameters estimation from the model with TK weighting function is a little bit bigger than that of the model with PreI function. All of indices from the model with TK weighting function is smaller than these from the model with PreI weighting function, especially for the AIC (TK 1521.1 vs Pre I 3287.6), which implies the model with TK weighting function is better than the model with Pre I. Therefore, the EEUT model with TK weighting function was recommended to explain PnR users’ choice for departure train station.
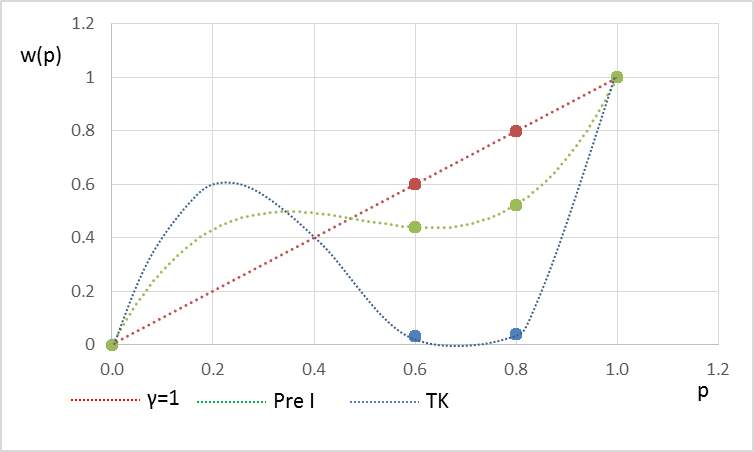
Figure 7. Value functions of both models
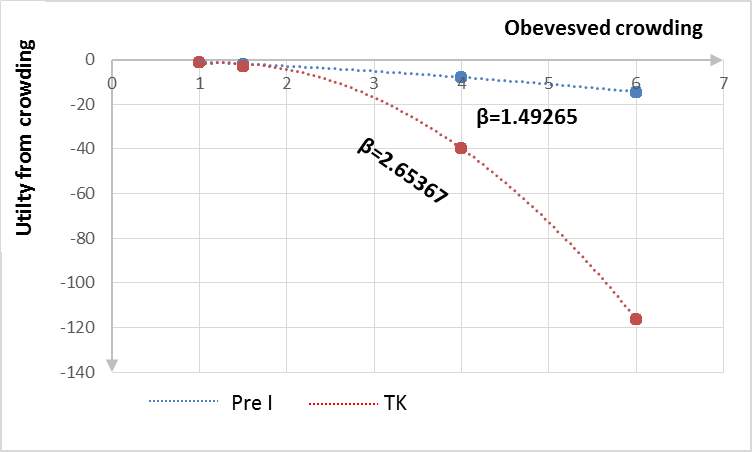
Figure 8. Weighting function of both models
4.2 Analysis for respondents ‘risk attitude
In this section, we applied the recommended model to measure the respondents’ risk attitude towards crowding on trains in typical week day by different train stations, and explore the impact of station boarding on the degree of risk attitude towards crowding on trains. In detail, we re-estimated the parameters in the recommended model with the data separately by different stations,, derived the risk attitude parameter for each train station, then analyse the relationship between the risk attitude parameter and the station boarding.
The parameter  for each train station is summarised in the table 5. The respondents on all stations, except Warnbro station and Warwick station, showed risk aversion towards crowding on trains. Moreover, the respondents on Claremont station are most risk aversion, while the respondents from Midland and Warnbro station showed less risk aversion than others (see the figure 9). This might because Midland station locates at the end of train lines and Warnbro station is the second last station to the end of the Mandurah line with large space to other neighbour stations. Maybe the train users from these stations are more captive and more tolerable to crowding.
Table 5. Parameters estimation for seven train station with the recommend model
| Greenwood | Cannington | Claremont | Midland | Warwick | Warnbro | Murdoch | |
|
-0.22580 | -0.23691 | -137.69 | -0.83389 | -0.05970 | 0.13158 | -0.07884 |
 |
-0.04244*** | -0.03614*** | -0.01658 | -0.04853 | -0.02630*** | -0.00658 | -0.00954 |
|
2.64657** | 2.59025* | 3.95820 | 1.39738 | 0.13191 | -0.62075 | 1.78158 |
|
0.2163 | 0.20395 | 0.04882 | 0.68065 | 0.13327 | 0.52732 | 0.39311 |
| Reference | -0.26022** | 0.39772*** | 0.06668 | 0.22340 | 0.21237** | -0.16785 | 0.13672 |
| Log Likelihood | -219.86746 | -223.80053 | -206.40577 | -74.36110 | -249.37362 | -193.65504 | -343.99830 |
| Inf.Cr.AIC | 449.7 | 457.6 | 422.8 | 158.7 | 708.7 | 397.3 | 698.0 |
| Chi-square | 20.51481 | 34.82937 | 3.07678 | 6.54278 | 16.58065 | 11.94269 | 5.15059 |
| Significance level | 0.001 | 0.0000 | 0.68815 | 0.25692 | 0.00537 | 0.03558 | 0.39778 |
| Sample size | 332 | 348 | 300 | 112 | 516 | 288 | 500 |
| CRRA | -1.64657 | -1.59025 | -2.95820 | -0.39738 | -0.78158 |
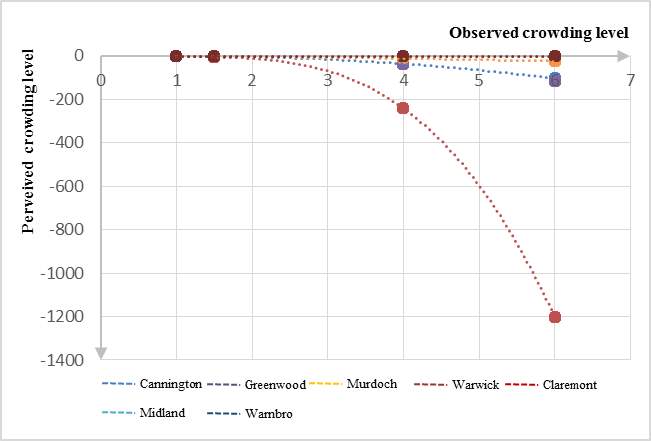
Figure 9. Risk attitude for respondents on different train stations
Additionally, we analysed the relationship between the estimation of the parameter  for each train station and its station boarding (see the table 6). We found that generally the negative relationship between individuals boarding on trains from the station and the parameter.. This may imply that the more risk aversion towards crowding on trains, the less preference of a train station a respondents may have or the other way around. For example, the respondents from Clermont station showed the most risk aversion, the boarding of the Clermont station is the least. While the respondents on Murdoch station showed the least risk aversion the boarding is the highest.
Table 6 the relationship between risk attitude and ridership
| Claremont | Greenwood | Cannington | Murdoch | Midland | |
 |
3.95820 | 2.64657 | 2.59025 | 1.78158 | 1.39738 |
| Boarding numbers | 1431 | 1921 | 2201 | 6369 | 3846 |
4.3 Sensitivity analysis for policy implication
A Sensitivity test was conducted to identify the effect of crowding on trains on the probability that a train station was chosen by holding other attributes at their mean. We set up two scenarios, each of which included two train stations. The only difference between the both scenarios is the crowding attributes level for station one. In detail, we set the density of standing passengers and the probability that seats taken for station one in scenario one is 6 passengers/m2 and 100%, while 2 passengers/m2 and 0.75 for scenario two. This design aims to test whether the probability that a station was chosen would be changed as crowding level varies . Therefore, our hypothesis is the more crowded that trains are at a station,, the less probability that the station is chosen by PnR users.
Crowding measurement of station one is 6 passengers/m2 in scenario one and 1.5 passengers/m2 in scenario two and the probabilities to choose station one in both scenarios are 26.06% and 54.16% separately, which indicates the crowding on trains has negative impact on station choice. Four times less crowding on trains led to twice higher chances of station choice. Therefore, improving crowding on trains (or decreasing crowding level) does be an efficient way to increase stations’ attraction for PnR commuters.
Table 7. The relationship between crowding level and the probability that a station is chosen
| The density of standing passengers in a carriage (passengers/m2) | The probability that seats taken | Crowding level | Probability choosing station 1 | |
| Scenario1 | 6 | 1 | 6 passengers/ m2 | 26.06% |
| Scenario2 | 2 | 0.75 | 1.5 passengers/m2 | 54.16% |
| Ratio of scenario 1 to scenario 2 | 4 | 2 |
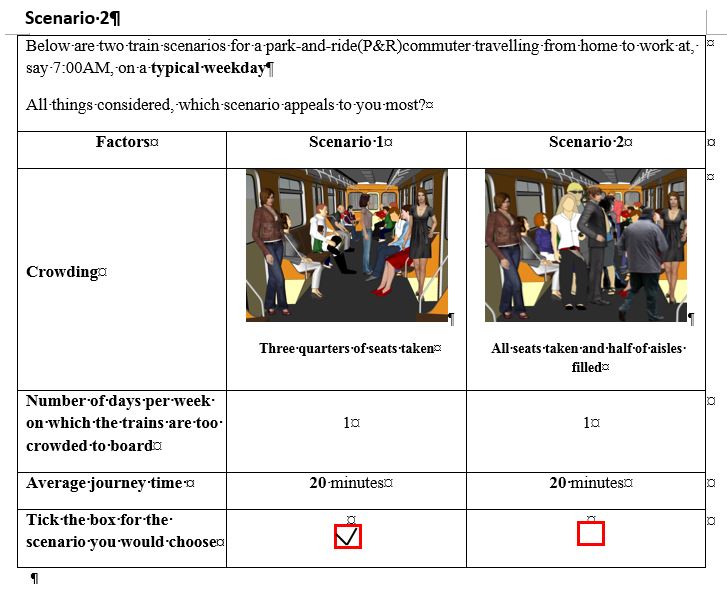
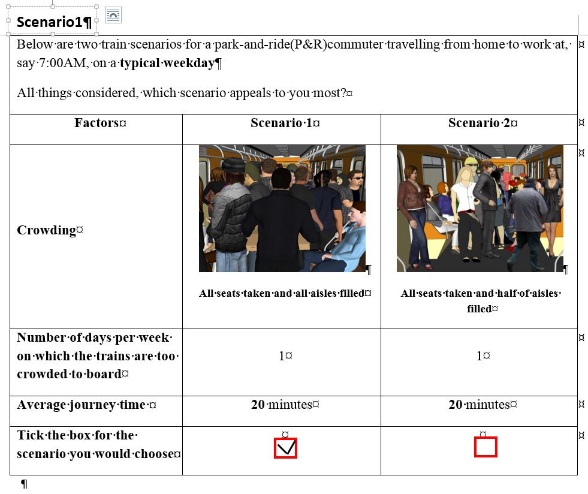
Figure 10. The hypothetic scenarios
4.5 PnR users’ preference heterogeneity led by individuals’ personalities
According to our questionnaires, respondents’ annual income was surveyed as well. Our aim is to test whether personal heterogeneity would affect individuals’ choice for departure train stations. Different from previous study, the annual income was not taken as an independent variable and introduced into the choice model. We took it as a latent variable and supposed its effect on station choice is realised by its effect on cognition for crowding attributes, as such a latent class model was set up. After testing, four latent classes were identified as the best fit from 2, 3, 4 and 5 classes, their estimation of parameters are given in the table 8.
Table 8. Estimated LCM: Utilities
| Multinominal logit model (MNL) | Class utility model | ||||
| Class one | Class two | Class three | Class four | ||
|
-0.01341 | 8.19232 | -13.1238 | 5.90785 | -0.49485 |
|
-0.1310*** | -2.33463 | -0.45409 | 2.48048 | -0.17198 |
| Reference | 0.11392 | -5.94053 | -7.18746 | 19.9449 | -0.98766 |
| Class probability model | |||||
| Constant | -0.06271 | -7.0121 | -0.0265 | 0.0 | |
| Annual Income | -3.7879* | -0.40290 | -0.03812 | 0.0 | |
| Log Likelihood | -1648.25247 | -1622.73492 | |||
| Inf.Cr.AIC | 3302.5 | 3281.5 | |||
The utility parameters for four classes are completely different, which indicated that the PnR users with heterogonous income have different preference for each crowding attribute, correspondingly they made different choice. The result is aligned with what our assumption asserted. However, only evaluating the absolute parameter estimates across models is not informative because of scale differences (Louviere et al 2000), we contrasted the probability for choosing different station as well. We applied the LC model into the left scenario in the figure 10 and found that the respondents in the class one prefer to station 1 which is more crowded, while the respondents in the other three classes tended to choose station 2 (see the table 9). The difference of chosen probability among different classes also indicated individual’s heterogeneity would affect their choice, which further confirmed our hypothesis.
Table 9 personal and preference heterogeneity
| Class one | Class two | Class three | Class four | ||
| Chosen probability | Station 1 | 99.92% | 0.00% | 0.00% | 14.44% |
| Station2 | 0.08% | 100.00% | 100.00% | 85.56% | |
| Prior class probability | 18.5% | 9,5% | 33.9% | 38.2% | |
| Posterior class probability | 21.27% | 9.63% | 32.69% | 36.41% | |
| Annual income | 1.186701 | 1.15487 | 2.018626 | 2.18566 | |
Additionally, we analysed the characteristics of each latent class through the estimation of conditional class probability. We found estimated conditional class probabilities (i.e., posterior class probability) are similar with its prior probabilities, which implies the model does work. Moreover, the latent class four is made of more wealthy individuals than other latent classes and most of individuals in the class four chose the station 2 which is less crowded train station. However, respondents in the latent class one are poorer than other latent classes except the class two, and most of individuals in the class chose the station 1. Therefore, we inferred the probabilities that a station is chosen is verse with annual income of individuals using that train station.
Given that the effect of income heterogeneity on individuals’ preference, it is necessary for the public transport industrials to propose a graded service based on the heterogeneity of passengers’ personality to attract more passengers to use railway, correspondingly increase rail ridership. For example, different price ticket fares according to crowding level on trains can satisfy the different demand proposed by passengers with various annual income.
5. Model Validation
According to Michael E.Miller, L.Hui, and Tierney (1991), the models developed for prediction need be validated to assure that they adequately perform the functions for which they are intended. For the station choice model developed in the paper, it is part of demand model for prediction of rail ridership, so it need to be validated as well.
Chi-square test was used to validate the station choice model developed within EEUT in the paper. Firstly, we predicated the probabilities with the recommended model for the 12 scenarios used for survey (see the table 10), then compared them with their observed outcomes and got the chi-square (0.98). Assuming the significance level is 0.05 and freedom is 11, then the critical value is 19.675. Given that the critical value is greater than the Chi-square, the difference between prediction and observation is not statistically significant.
Table 10. The comparison for the probability that a station is chosen between observation and prediction
| Scenarios | Observation | Prediction | ||
| Station 1 | Station 2 | Station 1 | Station 2 | |
| 1 | 57% | 43% | 68% | 32% |
| 2 | 43.2% | 56.9% | 57.5% | 42.5% |
| 3 | 55.3% | 44.7% | 70.9% | 29.1% |
| 4 | 35.7% | 64.3% | 43% | 57% |
| 5 | 57.2% | 42.8% | 29.7% | 70.3% |
| 6 | 57.2% | 42.8% | 69.2% | 30.8% |
| 7 | 52.2% | 47.8% | 35.9% | 64.1% |
| 8 | 42.3% | 57.7% | 45.1% | 54.9% |
| 9 | 56.8% | 43.2% | 66.4% | 33.6% |
| 10 | 55.8% | 44.2% | 27.1% | 72.9% |
| 11 | 63.5% | 36.5% | 29.4% | 70.6% |
| 12 | 61.1% | 49.9% | 75.6% | 24.4% |
6. Conclusion and limitation
Crowding can be a potential threat to health of rail passengers. Therefore, it is very important to quantify its effect on passengers for further intervention. This paper reviewed a few previous studies related to the effect of overcrowding on public transport system, stated choice models were found to be the major methods used by those literature. Different ways of measuring crowding levels presenting to respondents in SP experiment were identified, along with two crowding measures (i.e., the percentage that the seats have been taken and the density of standee in train cars). We presented respondents’ crowding levels at eye level, rather from bird eyes ‘view, so it is hard to distinguish the effect of the both crowding measure. Hence, we created a new crowding measurement, namely, the interaction of the both traditional crowding measures in the paper. Based on these, along with the interaction of seats taken and in vehicle travel time, linear and non-linear EUT models and EEUT models were developed. According to models’ goodness of fit and the parameters estimation, the EEUT model with power value function and TK probability weighting function was identified as the best model explaining respondents’ choice for access train station based on crowding on trains. The model was validated with Chi-squared test.
Based on the recommended model, the parameter estimation for all attributes contributing station choice utility is negative, which means the more crowded on trains and the longer time that individuals spent in boarding on trains from the station, the less utility that the station created. Moreover, the respondents’ attitude towards crowding on trains is risk aversion.
Furthermore, the model was applied to seven train stations identified by our industrial partners as well to test the relationship between the risk attitude and the numbers boarding on the train. The result showed the more risk aversion that the respondents displayed, the less individuals boarding on the train station.
Additionally, we also found the respondents’ preference for the effect of crowding on station choice under annual income was heterogeneous. The individuals with higher income would like to choose the station that is less crowding on trains. Cognitively, the commuters with higher income eager to more comfortable travel environment than those with low income.
Even though we assumed the interaction of both classic crowding measures should be taken as new crowding measures in the paper, given that the crowding is presented at eye’s level rather from above, we are not sure whether it is best measurements to explore the effect of crowding on station choice, especially for the scenario in which the density of standee is less. Another limitation is that sample size is not enough, so that not all the parameter estimation displayed statistical significance. Therefore, further work is to systematically review the factors affecting station choice and test their effect on station choice with amount data.
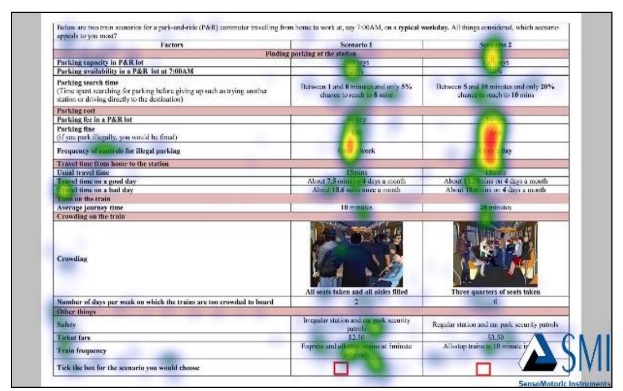
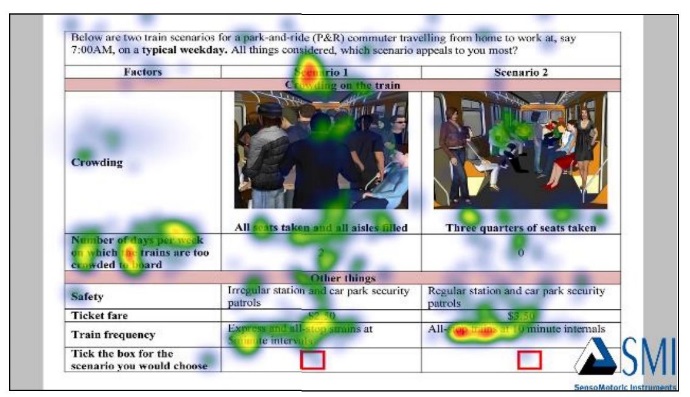
The third limitation of the research is the data used in the paper was collected with other attributes in a same questionnaire. Therefore, we are not sure that the attributes mentioned before are the most important factors affecting PnR users’ choice for access train station. To test this, we used an eye-tracking equipment to monitor respondents ‘eye, then identified the factors ‘significance for station choice based on visual attention. We insisted the more attention that participants paid to a variable, more influence on the choice decision that the factor should be. Figure 11 shows a snapshot of visual attention map (heatmap) of a participant. For the same participant, we displayed two different scenarios. The picture showing crowding attributes was found as the centre of attention (longer visual attention located at crowding area) for the questionnaire on the left. However, when we increased the number of factors in the survey, attention was shifted to other factors instead of crowding. Therefore, how to design SP survey and balance the number, order and levels of variables to explore choice behaviour in a most efficient way is still open to debate and more evidence is needed.
Figure 11 Heatmap analysis for both questionnaires (different choice)
References
A. Sumalee, Z. Tan, and W.H.K. Lam. 2009. “Dynamic Stochastic Transit Assignment with Explicit Seat Allocation Model.” Tranportation Research Part B 43 (8-9): 17.
Alejandro Tirachini, David A. Hensher, and John M. Rose. 2013. “Crowding in Public Transport Systems: Effects on Users, Operation and Implications for the Estimation of Demand.” Transportation research part A 53: 36-52.
Anthony Chen, Zhaowang Ji, and Will Recker. 2001. “Travel Time Relaibility with Risk-Sensitive Traverlers.” http://krypton.its.uci.edu/its/publications/papers/CTSS/UCI-ITS-TS-WP-01-8.pdf.
Arrow, Kenneth J. 1971. Essays in the Theory of Risk-Bearing. Amsterdam, London: North Holland Pub.Co.
Batarce, Marco, Juan Carlos Muñoz, and Juan de Dios Ortúzar. 2016. “Valuing Crowding in Public Transport: Implications for Cost-Benefit Analysis.” Transportation Research Part A: Policy and Practice 91: 358-378. doi: http://dx.doi.org/10.1016/j.tra.2016.06.025.
Bill Davidson, Peter Vovsha, Mohammad Abedini, Chaushie Chu, and Rory Garland. 2011. “Impatct of Capacity, Crowding, and Vehicle Arrival Adherence on Public Transport Ridership: Los Angeles and Sydney Experience and Forecasting Approach” Australasian Transport Research Forum 2011, Adelaide, Australia,
Conner, Piers. 2011. Railway Passenger Vehicle Capacity – an Overview of the Way Railway Vehilce Capacity Has Evolved. Accessed 12 Dec., http://www.railway-technical.com/Infopaper%202%20Railway%20Passenger%20Vehicle%20Capacity%20v1.pdf.
Cox, T., J. Houndmont, and A. Griffiths. 2006. “Rail Passenger Crwoding, Stress, Health and Safety in Britain.” Transportation Research Part B 43 (10): 913-921.
D. Katz, M.M. Rahman. 2010. “Levels of Overcrowding in Bus System of Dhaka, Bangladesh.” Tranportation Research Record 2143: 6.
Daniel Kahneman, and Amos Tversky. 1979. “Prospect Theory: An Analysis of Decision under Risk ” Econometrica 47 (2): 263-291.
Davidson, B., and L. Yang. 1999. “Modeling Commuter Rail Station Choice and Access Mode Combinations.” In the Transportation Research Board Annual Meeting, Washington, DC, 1999.
Debrezion, G., E. Pels, and P. Rietveld. 2009. “Modelling the Joint Access Mode and Railway Station Choice.” Transportation Research Part E: Logistics and Transportation Review 45 (1): 270-283.
Fan, K., E. Miller, and D. Badoe. 1993. “Modeling Rail Access Mode and Station Choice.” Transportation Research Record 1413: 49-59.
Fernández, R. 2011. “Experimental Study of Bus Boarding and Alighting Times.” In European Transport Conference Glasgow, October 10-12.
Ginn, Simon. 2009. “The Applicaiton of the Park & Ride and Tod Concepts to Develop a New Framework That Can Maximise Public Transport Traronage.” Queensland University of Technology Australia. http://eprints.qut.edu.au/31827/1/Simon_Ginn_Thesis.pdf.
Goldstein, William M., and Hillel J. Einhorn. 1987. “Expression Theory and the Preference Reversal Phenomena.” Psychological Review 94 (2): 236-254.
Greene, William, Mark N Harris, Bruce Hollingsworth, and Pushkar Maitra. 2014. “A Latent Class Model for Obesity.” Economics Letters 123 (1): 1-5.
Gregory J. Nicosia, Douglas Hyman, Robert A. Karlin, Yakov M Epstein, and John R. Aiello. 1979. Effects of Bodily Contact on Reations to Crowding. Accessed March 22,
Hess, Daniel Baldwin. 2001. “The Effects of Free Parking on Commuter Mode Choice: Evidence from Travel Diary Data.” Working Paper Series.
Hillel J. Einhorn, and Robin M. Hogarth. 1981. Behavioral Decision Theory: Processes of Judgment and Choice. Accessed May 26, http://psy2.ucsd.edu/~mckenzie/Einhorn%26Hogarth1981AnnualReview.pdf.
J.-D. Schmöcker, A. Fonzone, H. Shimamoto, F. Kurauchi, and M.G.H. Bell. 2011. “Frequency-Based Transit Assignment Considering Seat Capacities.” Tranportation Research Part B 45 (2): 16.
John M.Rose, and Michiel C. J. Bliemer. 2009. “Constructing Efficient Staed Choice Experimental Designs ” Transport Reviews 29 (5): 587-617.
Joon-Ki, Backjin Lee, and Sungho Oh. 2009. “Passenger Choice Models for Analysis of Impacts of Real-Time Bus Information on Crowdedness.” Tranportation Research Record 2112: 7.
Kahneman, D., and A. Tversky. 1979. “Prospect Theory: An Analysis of Decision under Risk.” Econometrica 47 (2): 263-292.
Kastrenakes, C.R. 1988. “Development of a Rail Staiton Choice Model for Nj Transit.” tranportation Research Record 3 (4): 393-408.
Knight, Frank H. 1921. Risk, Uncertainty and Profit: Boston, MA:Hart, Schaffner & Marx; Houghton Mifflin Company.
Lam, William H. K., Chung-Yu Cheung, and C. F. Lam. 1999. “A Study of Crowding Effects at the Hong Kong Light Rail Transit Stations.” Transportation Research Part A: Policy and Practice 33 (5): 401-415. doi: http://dx.doi.org/10.1016/S0965-8564(98)00050-0.
Leurent, F., and K. Liu. 2009. “On Seat Congestion, Pasenger Comfort and Route Choice in Urban Transit: A Network Equilibrium Assignment Model with Application to Paris.” In 88th Annual Transportation Research Board Meeting Washingtong, D.C., January 2009.
Lundberg, Ulf. 1976. “Urban Commuting:Crowdedness and Catecholamine Excretion ” Journal of Human Stress 2 (3): 7.
Lythgoe, W. F., and M. Wardman. 2004. “Modelling Passenger Demand for Parkway Rail Stations.” Transportation 31 (2): 125-151.
Lythgoe, W.F., M. Wardman, and J.P Toner. 2004. “Enhancing Rail Passenger Demand Models to Examine Station Choice and Access to the Rail Network.” In AET European Transport Conference, PTRC, London.
Michael E.Miller, Siu L.Hui, and William M. Tierney. 1991. “Validation Techniques for Logistic Regression Models.” Statistics in Medicine (10): 1213-1226.
N. D. Mohd Mahudin, T. Cox1, and A. Griffiths. 2011. “Modelling the Spillover Effects of Rail Passenger Crowding on Individual Well Being and Organisational Behaviour.” WIT Transactions on the built environment 116: 12.
Neumann, J.V., and O.Morgenstern. 1994. Theory of Games and Economic Behaviour: Princeton University Press.
Neumann, John von, and Oskar Morgenstern. 1953. Theory of Games and Economic Behavior (Third Ed.). Princeton, NJ: Princeton University Press.
Nicholls, Sean. 2017. Sydney Cbd and South East Light Rail Crowding Rates Exceed Bus and Train ‘Crush Capacity’. Accessed 2 May, http://www.smh.com.au/nsw/sydney-cbd-and-south-east-light-rail-crowding-rates-exceed-bus-and-train-crush-capacity-20170220-gugtx9.html.
Peter van der Waerden, Aloys Borgers , and Harry Timmermans. 1998. “The Impact of the Parking Situation in Shopping Centres on Store Choice Behaviour.” GeoJournal 45: 309-315.
Prelec, Drazen. 1998. “The Probability Weighting Function ” Econometrica 66 (3): 495-527. doi: 10.2307/2998573.
Rubsinstein, Ariel. 2006. Lecture Notes in Microeconomic Theory 41 William Street, Princeton, New Jersery: Princeton University Press
S. Raveau, J.C. Muñoz, and L. de Grange. 2011. “A Topological Route Choice Model for Metro.” Tranportation Research Part A: Policy and Practice 45 (2): 10.
Sarah Blunden, David Bray, Danielle Every, Lily Hirsch, Nicholas Holyoak, Sophia Rainbird, Raluca Raicu et al. 2011. A Socioeconomic Study of Carriage and Platform Crwoding in the Australian Railway Industry: Literature Review. Accessed May 27, file:///F:/school%20cumpter/ccm/2016/write%20paper/R2.104%20Literature%20Review.pdf.
Sundstrom, E. B., P. Busby, and C. Asmus. 1975. “An Experimental Study of Crowding: Effects of Room Size, Intrusion, and Goal Blocking on Nonverbal Behavior, Self-Disclosure, and Self-Reported Stress.” Jourenal of Personality and Social Psychology 32 (4): 9.
T. Cox, J. Houdmont, and A. Griffiths. 2006. “Rail Passenger Crowding, Stress, Health and Safety in Britain.” Transporatation Research Part A_policy and Practice 40: 244-258.
T.Lin, and N.H.M.Wilson. 1992. “Dwell Time Relationships for Light Rail Systems.” transportation Research REcord 1361: 287-295.
Thompson, K., L. Hirsh, S.Muller, and S.Rainbird. 2012. A Socio-Economic Study of Carriage and Platform Crowding in the Australian Railway Industry: Final Report. Brisban,Australia.
Train, K. 2003. Discrete Choice Methods with Simulation. Shaftesbury Rd, Cambridge CB2 8RU, UK: Cambridge University Press.
Transport, Department of. 2010. Car Parking at Stations.
Turner, S., E. Corbett, R. O’Hara, and White J. 2004. Health and Safety Effets of Rail Crowding-Hazard Idenification Accessed November 19, http://www.rssb.co.uk/SiteCollectionDocuments/pdf/reports/Research/T307_rpt_final.pdf.
W.Pratt, John. 1964. “Risk Aversion in the Small and in the Large ” Econometrica 32 (1/2): 122-136. http://www.jstor.org/stable/1913738.
Wardman, M. 1997. “Inter-Urban Rail Demand, Elasticities and Competition in Great Britain: Evidence from Direct Demand Models.” Transportation Research Part E: Logistics and Transportation Review 33 (1): 15-28.
Y. Hamdouch, H.W. Ho, A. Sumalee, and G. Wang. 2011. “Schedule-Based Transit Assignment Model with Vehicle Capacity and Seat Availability.” Tranportation Research Part B 45 (10): 16.
Zheng Li, David A. Hensher, and John M. Rose. 2009. Valuation of Travel Time Reliability in an Extended Expected Utility Theory Framework Accessed May 20, https://iatbr2009.asu.edu/ocs/custom/resource/Keynote_LiHensherRose.pdf.
zheng Li, and David A. Hensher. 2013. “Crowding in Public Transport: A Review of Objective and Subjective Measures.” Journal of public transportation 16 (2): 107-134. http://www.nctr.usf.edu/wp-content/uploads/2013/07/16.2_hensher.pdf.
Cite This Work
To export a reference to this article please select a referencing stye below:
Related Services
View all


Related Content
All TagsContent relating to: "Infrastructure Planning"
Infrastructure generally describes the resources, and systems required for a society to function such as transport networks, water, sewage, and electricity systems. Infrastructure planning concerns the creation of new infrastructure and the phasing out of old infrastructure.
Related Articles

DMCA / Removal Request
If you are the original writer of this dissertation and no longer wish to have your work published on the UKDiss.com website then please: