Interrelation of Spatial and Non-spatial Dimensions
Info: 15069 words (60 pages) Dissertation
Published: 16th Dec 2019
Tagged: Architecture
LIST OF SYMBOLS AND ABBREVIATIONS
| CSV | Comma Separated Value |
| BIM | Building Information Modeling |
| CAD | Computer Aided Design |
| HVAC | Heating, Ventilation, and Air Conditioning System |
| AFD | Adjacency Frame Difference |
| WiFi | Wireless Fidelity |
| GPS | Global Positioning System |
| GMS | Global Mobile System |
| RGB | Red, Green, and Blue data |
| BLE | Bloothoth Low Energy |
| RF /RFID | Radio Frequency |
| UWB | Ultra Wideband |
| RSS | Received Signal Strenght |
| RGBD | Red, Green, Blue and Depth data |
| LowRes | Low Resolution |
| FPS | Frames Per Second |
| ID | Identification |
| EBD | Evidence-based Design |
| VGA | Visibility Graph Analysis |
| ICU | Intensive Care Unit |
| VMS | Video Management Software |
| TB | Terabytes |
| GB | Gigabytes |
| PZQ | Image Format |
| PIC | Image Format |
| IRB | Institutional Review Regulations |
| JPEG | Image Format. Stands for Join Photograpich Expert Goup |
| AVI | Video Format. Stands for Audio Video Interleaved |
| MKV | Video Format. Stands for Matroska Multimedia Container |
| C, C++ | Programing Languages |
| Python | Programing Language |
| GPU | Graphical Processing Unit |
| I/O | Input/Output |
| HOG | Histogram of Oriented Gradients |
| RANSAC | Random Sample Consensus |
| ROI | Region of Interest |
| Bbox | Bounding Box |
| ANOVA | Analysis of Variance |
| GUI | Graphic User Interface |
| ACC | Accuracy |
| TPR | True Positive Rate |
| SPC | Specificity |
| FNR | False Negative Rate |
| FPR | False Positive Rate |
| 2D | Two Dimensional |
| 3D | Tridimensional |
| OCG | Occupancy Grid |
| OCC | Occupancy |
| AOI | Area of Interest |
| OOI | Object of Interest |
| SPOT | Spatial Positioning Tool |
| MATLAB | Multi-paradigm Numerical Computing Environment and Programming Language. It stands for Matrix Laboratory |
| Isovist | Field of View From a Vantage Point |
CHAPTER 1
1 INTRODUCTION
The built environment concept encompasses several aspects beyond the three traditional spatial dimensions. It also acknowledges an underlying social logic, incorporating the complexity of spatial configuration as well as its embedded social purposes (Hillier, 2007). The definition of built environments for this research also includes aspects such as the building program, activity programming, and time, considering human behavior not as actions that merely occur but as a distinct attribute of the built environment itself. Activities such as walking, congregating, dispersing, communicating, and interacting create distribution patterns for people in space, determined by the spatial and the non-spatial built environment’s dimensions, which in turn are altered by those distribution patterns. “Spaces are qualified by actions just as actions are qualified by spaces.” (Tschumi, 1996, p.130).
This dissertation addresses the interrelation of spatial and non-spatial dimensions, developing methods to capture one aspect of human behavior: occupancy, which maps to the location of humans in space during a designated period of time. This research requires high spatial-and-temporal resolution occupancy data that allowed occupancy patterns to display. The premise is that the errors that can be found in any spatiotemporal occupancy patterns capture process, are influenced by the built environment and could be described through a probabilistic model. Afterwards, These patterns, in combination with the spatial configuration and activity programing, allow the development of spatial-behavioral metrics, which in turn, attempt to quantify non-geometrical aspects of a built environment. The assumption is that the model will help us understand the character of spatiotemporal occupancy. The validation of this assumption involved the study of the following scenario as a proof-of-concept: surveillance of the heads of inpatient beds from public corridors in a hospitalization building, resulting in the proposal of a new metric that captures the relationship between space and occupancy, the Isovist-minute.
This research specifically focuses on developing a set of studies to demonstrate the value of spatiotemporal occupancy, going through the phases of capturing and analyzing spatial and temporal occupancy data towards achieving a meaningful metric that relates to both spatial configuration and occupancy by measuring a spatiotemporal feature of the built environment. In doing so, the study faced a number of challenges at the theoretical and technical levels. Each of these challenges is outlined as a sub-question of the general problem of this research, which encompassed the capture and analysis of spatiotemporal occupancy data and which is explored and presented in depth in the research steps. This chapter begins by briefly introducing the general problem of capturing spatiotemporal occupancy, a matter that extends into Chapter 2, and continues by introducing the research sub-questions in following sections.
1.1 The Problem of Capturing and Analyzing Spatiotemporal Occupancy
Numerous studies on human behavior in buildings have focused on exploring movements, occupancy, and specific events –such as interactions– as outcomes of the influence of space. These approaches to capturing global patterns of human behavior as an explanatory variable of space has led to obtain aggregated results, involving totals or averages of such behaviors, due to the data collection methods and systems, which either do not provide high spatial and temporal resoulition, or focus on particular events, i.e. visits to rooms. These research approaches, therefore, are subject to the following difficulties in data capture and data analyses: (1) limitations in using traditionally accessible methods, such as observation and manual mapping, which rely on human abilities that bring their own limitations to collect occupancy data of high temporal-and-spatial resolution and (2) the resulting limitations in the analyses of the obtained dataset based on the resolution achieved with such traditional methods. However, within the context of existing technologies, a remarkable opportunity for collecting data of high spatial and temporal resolution arises, allowing improved methods of behavioral data collection as well as the application of data processing to promote new research analyses, such as the influence of organizational activities, both scheduled and unscheduled in time. In conjunction with space configuration, these analyeses focus on the temporal component of specific questions, such as how movements are displayed in specific settings, how occupancy is distributed in spatial configurations, or how spatial characteristics correlate with such behaviors.
The question that first arises is “what is the most appropriate method for data collection that allow us to describe specific spatiotemporal occupancy patterns in specific building settings?” This question, which correspond to the first step of the research, may be broken down into two parts. The first part relates to the relative advantages and limitations of the existing technologies for capturing the data, considering the appropriateness of the use of the technology in a determined context, respectively outlined as its technical and social advantages and limitations, and the second part concerns the analyses that are endorsed based on such data.
This research focused on the problem of capturing and analyzing large datasets of high spatial-and-temporal resolution occupancy to explore for patterns and to formulate finer-grain questions at both the spatial and temporal dimensions. To outline the platform for this research, the general problem faced four steps: 1) defining the appropriate behavioral mapping method, which would, in turn, determine the occupancy analyses; 2) obtaining occupancy data accuracy and precision, helping us recognize the parameters and scene conditions that affect it; 3) understanding occupancy patterns to explain their distribution in specific scenarios, which are defined as the built environment at that specific period of time, under certain environmental and programming conditions; and 4) outlining a new spatial-behavioral metric, which attempts to capture both patterns of occupancy and their effect on specific behavioral outcomes.
Each of the above stages posed significant challenges. First, defining the appropriate behavioral mapping method required an understanding of the possibilities offered by the existing systems, including their technical capabilities and their social acceptance in the chosen environment, as well as an understanding of their interdependency to the nature of the questions that the resulting data would answer. Therefore, a survey and review of the existing systems was completed at this stage, weighting the technical and social aspects to link the characteristics of each behavioral mapping system and define the most appropriate one. Second, the selected system contains certain inherent data accuracy and precision, which required a recognition of the scenario parameters that would influence the system’s accuracy. To explain the influence of these parameters individually, a statistical method was proposed to model the probability of their influence on recognition. Third, understanding occupancy patterns implies recognizing their dependency on the space as well as on the activity programming at the architectural and organizational levels, requiring the proposal of a statistical method to understand the differences among the various scenarios. And fourth, suggesting a new metric for measuring a spatial-behavioral relationship required simultaneously processing the spatial information as well as the occupancy datasets, in order to obtain such a meaningful metric, defined by the building program context.
In developing this four-steps research, an interdependency arose between the specific architectural research question and the positioning technology that provided the appropriate data to answer such a question. Hence, the problem became a multi-dependent one, indicating the influence of one research variable over the next one, in a chain. Once a system was selected, the potential research question was narrowed down to a specific building program, a defined social context, particular scenarios, and data resolution and accuracy (see figure 1-1).
In this particular proof-of-concept study, an approach involving scene analyses using computer vision was selected as the method for positioning information. Specifically, the first challenge was to define the required data characteristics and, consequently the appropriate system that would allow capturing such data to answer the specific question of interest belonging to the specific scenario. This decision impacted the type of behavioral data collected and its resolution and accuracy, which was calculated using a statistical model, intended to determine the scene parameters that determine such accuracy, estimating the probability of occupancy detection.
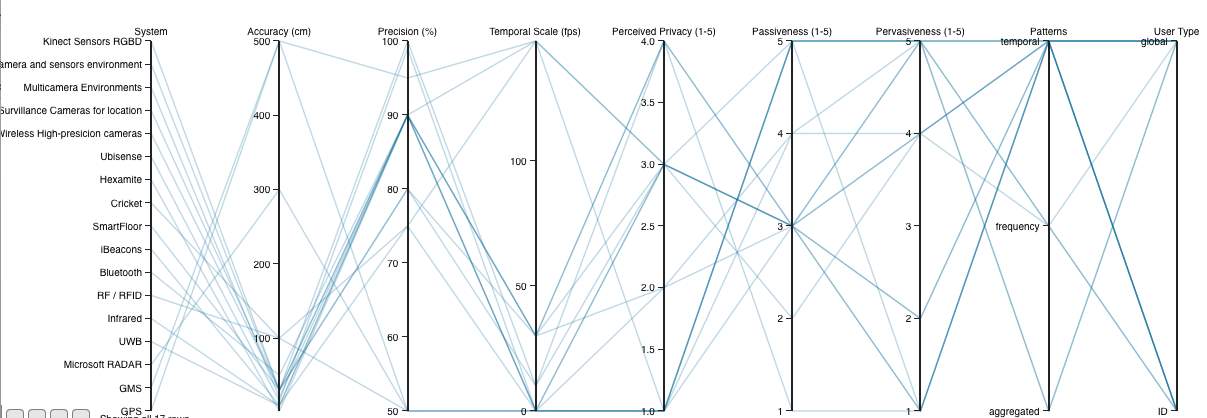
Figure 1‑1. A Parallel Coordinates Plot that represents the links of a multi-dependent problem, indicating the relation of the positioning system selection (left) with the potential research question to be answered (right). Highlighted is the Scene Analyses selected method, emphasizing its technical and social aspects. This content is presented here as an introduction, and further detail is presented in Chapter 2. This Parallel Coordinates plot was created using ‘Sprout Space Parallel Coordinates Plot’ developed by Perkins and Will Research Group.
1.2 Spatiotemporal occupancy patterns
The understanding of the spatiotemporal occupancy patterns required the study of the built environment in relation to the chosen scenarios. The set of methods proposed in this research aim to understand the influence of the scenarios’ underlying parameters on occupancy patterns by comparing a set of scenarios. The novelty of this research relies not on the traditionally studied global trends of occupancy, but on the use of scenario subsets determined by activity programming, helping to construct the arguments for understanding the difference between expected and emergent patterns of occupancy. Once these sub-sets of data were discerned, the goal was to measure the relationship between space and behavior in a specific scenario, delineating and developing a new key occupancy metric, the Isovist-minute, which is defined as the relationship between real and probable occupancy and their temporal visual fields towards a defined target.
All the methods proposed in this research are general enough to be applied to any specific built environment; however, this research focused on the occupancy of individuals in hospital corridors, as they are strong-program building spaces, which are characterized by their layout complexity, high spatial segregation, strong control over spatial divisions, strong control over the use of spaces and activities assigned to spaces, and strong control over inhabitants’ routines and visitors’ schedules (Koch and Steen, 2012).
In the process of understanding occupancy patterns as an aspect of the built environment, the formulation of a set of sub-questions materialized, addressing issues related to the description of the patterns and particularities of spatiotemporal occupancy. These questions included: what resolution would help to answer a specific fine-grain question in a particular scenario; what is the most appropriate method to capture the data to achieve such a resolution; what are the important aspects to consider in defining the specific scenario that would allow for plausible generalization; and what are the suitable models to describe occupancy patterns in buildings? These questions presented substantial challenges that can be outlined as objectives in each stage of this research. First, defining a suitable data resolution required a cohesive understanding of both the behavioral mapping method selected and the nature of the questions proposed. Second, defining in detail the hospital’s corridor scenario required consideration of two aspects: (1) the selection of a spatial setting robust enough to allow the isolation of variables such as spatial configuration and programming for later generalization and (2) the creation of access to the necessary data through the hospital’s existing surveillance system and the description of the practical and technical problems faced during the data capturing process. Third, analyzing the occupancy patterns included three steps: (1) revising the factors that impact the automatic data collection results; (2) constructing the spatiotemporal occupancy model based on the parameters that would impact it, such as the spaces’ program and the programming of activities linked to those spaces; and (3) proposing new analyses and metrics for measuring the space-occupancy relationship.
1.3 Description of the study
This research explored how a positioning system such as scene analyses can be used to develop metrics of spatiotemporal occupancy. The work involved first, adopting and adapting specific computational methods for people detection; second, it included statistical models to compute accuracy and precision of such detection; and third, a proof of concept study to illustrate a set of new metrics for the scenario characterization: dispersion and gravitation; and a new spatiotemporal-behavioral metric: the isovist-minute.
This dissertation addressed this task as a proof of concept study, by processing one week of surveillance videos over twelve corridors of a hospital in Chile. From the twelve surveillance videos, three datasets were discarded due to technical reasons regarding camera conditions, such as blurred cameras, and physical obstacles in the corridors that did not allowed to collect similar type of data. The resulting occupancy was captured at a spatiotemporal resolution of one feet per second using scene analysis methods based on computer vision.
Scene analysis allowed for the collection of high spatial-and-temporal occupancy data using one week of existing surveillance recordings from a hospital, avoiding interference with the social aspects arising from the pervasiveness of technology into daily routines, which directly compromises the legitimacy of the data collection. Afterwards, computational methods adapted from computer vision relied on pre-built algorithms for automatically recognizing occupancy. These algorithms can be trained and have a certain accuracy range influenced by environmental as well as occupancy parameters, which can be represented by a multiple regression model.
This dissertation presents the content of the research in five chapters, in addition to the introduction and conclusion. Chapter 2 reviews the traditional methods of behavioral mapping utilized in architecture research and the contemporary indoor positioning systems developed in the area of computer science and technology. The role of this part of the research is to construct the argument for selecting the scene analysis computational method for automatic occupancy detection, based on computer vision. Chapter 3 defines the following important aspects involved in selecting the proof-of-concept scenario: the building program type, the activity programming, and the specific areas of interest for mapping occupancy. The selection of a strong program – a hospital – restricted the building program variables and the activity program flexibility. The corridors of the hospital, which share an almost identical spatial configuration, are assumed to have no specific program or activity assigned to them other than their role as connectors of spaces; therefore, the description of a corridor was linked to its adjacent spaces and functions. The first two chapters present the framework for the contributions of scene analysis for occupancy detection in a restricted spatial and program context, assigning part of the responsibility for the outcomes to the activities scheduled over time.
While these chapters construct the argument from a technical as well as a theoretical perspective, Chapter 4 approaches the argument from an empirical perspective, introducing specific methods of scene analysis based on computer vision, including video acquisition and video processing, presenting in detail the computer vision detection algorithms as well as the practical and technical challenges faced in obtaining the required high-resolution occupancy data results. This chapter ends by presenting the linking connection between the research question of interest and the data type that the chosen system collected. Chapter 5 presents the computation of the accuracy and precision of the occupancy detection algorithm explained by the environmental and occupancy factors that influenced the errors obtained. It uses two statistical models to explain the distribution of occupancy accuracy in space and by scenario: logistic regression for calculating the probability of recognition errors and multiple regression for calculating the parameters’ influence on accuracy. Precision is calculated as a corrector factor of detected occupancy. Finally, Chapter 6 demonstrates the application of the proposed methodology, scene analysis of spatiotemporal occupancy, validating the results by proposing a set of analyses as well as a specific metric, the Isovist-minute. First, the set of analyses aim to demonstrate that the subsets of scenarios are statistically different, even though the space configuration remains the same, due to the influence of the activities. And the Isovist-minute demonstrates the correlation among four aspects of the scene: spatial configuration, programming of activities, actual scheduled and unscheduled activities, and occupancy, specifically, by the amount and the frequency of casual visual surveillance from the corridors over patients’ beds.
1.4 Toward Spatiotemporal Analyses in Architecture
The contribution of this research resides in its differentiation between the role that the space and the role that the actual activities play in the outcomes of human behavior, and the value of studying the spatiotemporal patterns of occupancy remains in the validation of spatiotemporal occupancy values through a new spatial-behavioral metric, measuring non-geometrical spatiotemporal performance aspects of the built environment. The contributions of this dissertation include a framework that formulates the relationships among the built environment dimensions and the scenario aspects; a platform for selecting the methodology for high-resolution spatiotemporal occupancy data collection and analyses; the parameters that allow the diversification of scenario conditions focused on answering a variety of research questions that are sensible to the scenario’s significance; the understanding of occupancy patterns by building the appropriate statistical models to compare and contrast the data; and the emergence of new metrics that respond to a particular scenario. In summary, spatiotemporal occupancy data collection and analyses methods endorse the integration of a temporal dimension into architectural research, proposing a branch of research towards the study of the relationship of spaces and their temporal occupancy dynamics.
CHAPTER 2
2 SURVEY AND REVIEW OF BUILDING OCCUPANCY DATA COLLECTION METHODS
Overview
This chapter provides a comprehensive review of the location methods utilized in architecture research and the systems developed in computer science for the same purpose. The first section reviews traditional behavioral data collection methods, focusing on their limitations in collecting high-resolution spatiotemporal data in real scenarios. The second section extends the survey to semi-automated methods. The third section presents a survey of location systems developed in computer science, identifying 10 technical and social criteria for comparison. The chapter concludes by introducing the system selected to meet this study’s objective of adopting and adapting systems of low pervasiveness for determining people’s location, exhaustively reviewing its 36 technical and social aspects, which offer new opportunities for research in architecture.
2.1 Behavioral Data Collection Methods Utilized in Architecture Research
For more than three decades, the influence of spatial configurations on human behavior in built environments has been an important focus architecture research. An understanding of these correlations required the collection of behavioral data and the development of new methods. Contemporarily, several systems for tracking individuals and the location of objects have been developed in the area of computer science. This section presents a review and a survey of the traditional behavioral data collection methods utilized in architectural research.
One of the most important models for spatial description, developed in the 1980s by Hillier and Hanson (1984), is space syntax theory, which “investigates the relationship between human societies and space, from the perspective of a general building theroy of structure on inhabited space in all diverse forms: buildings, cities, or even landscapes.” (Bafna, 2003). The major contributions of space syntax include not only the conecpt of configuration –or relations among discrete spatial units– but also the description of space through more abstract attributes –such as spatial depth, integration, and visual connectivity, and their correlation to social behavior. At building scale, researchers have focused on the effect of layout configuration of different building programs upon a specific behavior, with emphasis on occupancy, social interaction, and movements. These studies help to address a variety of issues such as the interplay of spatial configuration and face-to-face interactions, visual encounters, wayfinding, and navigation. Space syntax research has studied numerous building types, such as commercial, educational, residential and healthcare buildings, including buildings that support weak and strong programs, such as museums and office environments and healthcare environments (Cai and Zimring, 2012). A strongly programmed building is defined as a program with minimum flexibility since the activities assigned to the space are exclusive and hardly interchangeable, e.g., courts, prisons, hospitals, and airports. A weakly programmed building, on the other hand, is defined as a program with spatial flexibility regarding activities and users, e.g., offices, museums, and galleries (Hillier, Hanson and Peponis, 1984; Hillier and Penn, 1991). In museums, space syntax research has found strong correlations between the spatial structure of building layout, particularly visibility, and visitors’ circulations and movements, specifically with regard to accessibility, the patterns of exploration of art, art encounters, co-awareness, and encounters between visitors (Choi, 1999). Peponis and Stravroulaki (2003), for example, focused on the effects of spatial arrangements and visual perception – accessibility and visibility – on visitors’ paths and their engagement with art. They also stated that “[t]he symbolic function of the museum bears on three aspects of spatial arrangement: building layout, the positioning of displays within the layout, and the structure of ‘occupiable’ space,” which are primarily based on the visibility structure of space. Kaynar (2009) insisted that a crucial influence on visitors’ behavior, such as path choice and art-element engagement in open plan museums, is visibility, the implicit boundaries of which are stronger than physical partitions. Other studies have suggested that the length of an encounter with art, or ‘stop time’ (Peponis, 2003), predicted a visitor’s engagement with it, and, therefore, the process of learning (Falk, 1982; Serrel, 1995; Sandifer, 1997).
In mid-level weak programs, such as working environments, studies have focused on demonstrating the influences of spatial configurations on social interactions. The importance of these interactions relates to their impact on the organization, collaboration, and the transfer of knowledge. Some critical research questions addressed in this area include the influence of layouts on patterns of communication, occupancy and movements (Penn et al, 1997), as well as interconnectivity as a main factor for interaction and travels-for-interactions (Hillier and Grajewski, 1987; Grajewski, 1992). Layouts can either reinforce the segregation of organizational areas or diminish them (Hillier and Penn, 1991; 1992). At a local scale, within a building, the frequency of interactions among co-workers and their patterns of movement do not necessarily correlate to different layout types (Steen, 2001). At a global scale, however, spatial integration does correlate to human movement patterns. In support of this conclusion, Steen and Markede (2010) reported that visibility is an important factor for social behavior; however, across organizational borders, the spatial influence on spontaneous interactions is weak and their existence could be associated with programmed and scheduled activities (Steen and Markhede, 2010). Research in strong program buildings, such as hospitals, have focused on occupancy and movement – specifically visibility and accessibility – as important design criteria and the highest priorities for monitoring hospital patients. Previous studies have proven that visibility impacts patient observation as well as nurse responses, consequently decreasing nurses’ travel time and patients’ falls (Hendrich, Fay and Sorrels, 2002). These factors significantly increase nurse-patient caregiving and decrease the mortality rate of severely ill patients (Leaf, Home, and Factor, 2010). Visibility also impacts communication among staff and patients, improving patient satisfaction (Trites et al, 1970; Ulrich, Zimring, Joseph and Choudhary, 2004). Lu and Zimring (2011) explained the importance of visibility patterns for architects, planners and the healthcare organization by calculating patients’ targeted visibility in a health care setting from the head of each patient’s bed (Lu, 2009). In all the above studies, researchers utilized a series of manual methods to collect behavioral data. Those methods range from self-report to direct observation and mapping, either from a fixed vantage point or from shadowing individuals. Self-report refers to data collected through surveys or interviews of individuals about the events and activities occurring in a specific space and time setting (Weisman, 1981; Moeser, 1988). This method uses fewer resources since participants report their recollection of events, but it is also less accurate due to the fragility of memory to recall those events with precision. An example of a self-report method is the one utilized by the Steen and Markhede research (2010), in which researchers “asked every office worker on the three floor plans (in total 250 persons) to map all their interaction during (the) two (past) days.” (Steen and Markhede, 2010).
Observation and mapping is one of the most popular method for behavioral data collection. It requires the constant presence of observers to annotate, code, and classify people’s behavior, by mapping them on a layout or a space (Cosco, Moore, & Islam, 2009). Two factors influence the resulting data sets: the observers’ location and the mapping researcher’s criteria of a location in a conceptual space type. The mapping criteria is the association of the coded behavioral information to different conceptual spaces such as: (a) a specific location in a layout, (b) a convex space, (c) an axial line, or (d) another area defined by the radio of influence, such as the voronoi area of influence of a painting in a museum, which was defined for a specific research question for Choi’s research (1999). These spatial mapping categories affect the data spatial resolution since it depends on the conceptual space selected for the research. The observers’ location influences the data collection process since the observers’ positions could be from (a) a fixed vantage point, (b) by shadowing an individual, or (c) by doing surveillance rounds. Factors such as reaction time, influence of the observer’s presence, and lack of precision in spatial mapping, which depends on the observers’ estimation accuracy, may result in errors that cannot be controlled in a research design. The time variable is aggregated since the annotations occur with low frequency (i.e. 10 minutes), or by event.
Observation and mapping methods include counting the events occurring, independently of the frequency of occurrence. In studies of wayfinding, a fundamental technique for navigation studies, the focus is on the awareness of the environment by observation and the counting of the subjects that reach a destination (Peponis, Zimring, Choi, 1990). This method requires that an observer be located at a finish or crossing line, counting and annotating the number of individuals that reach that objective. In addition to standing at a fixed vantage point, an observer can also cover the space in movement by shadowing a specific individual or by doing rounds. In the first case, annotations are much more precise in time and location, but the presence of the observer following the individual could have a huge impact on daily activities. In the second case, annotations are less precise since the observer could miss some activities when he or she is not present or activities could be duplicated if the individuals observed are also in movement. An example is Choi’s research (2010) exploring the question of whether the spatial distribution of people can be explained in terms of configurational variables, which stated:
“ By a common technique of observation, the location of each visitor was recorded on a building plan during ten rounds of observations at regular intervals. Though people moving and standing when they were observed were identified separately, the observation data provide a static description of the visitor group.”
Observation and mapping methods have been adapted depending on the research needs and the data characteristics required to answer specific research questions. The set of classical methods presented above allowed research in architecture and spatial behavior to answer a certain range of research questions based on the data characteristics. Most of the studies have focused on the unidirectional influence of layout on human behavior, analyzing movements, flows, occupancy, and interaction among individuals in different layout configurations, as previously reviewed. These studies have answered questions such as how open-layouts influence patterns of exploration (Peponis, Conroy, Wineman, Dalton, 2004); how buildings become available as search structures (Peponis, Zimring, Choi, 1990); or how spatial layouts affect face-to-face interaction (Rashid, Kampschroer, Wineman, Zimring, 2006), to name a few. Some findings reported that in complex layouts, such as museums, the spatial configuration restricts human movements and directs their flow and viewing patterns (Bafna, 2003). In re-configurable layouts, such as offices, spatial configuration directs movements and influences the field of vision, directly affecting the co-presence of people and their face-to-face interaction (Choi, 1999). Such findings provide evidence that layouts, in fact, influence behavior and movements; however, most of the conclusions reached by these studies have been based on aggregated behavioral data correlated with geometrically derived attributes of space only. The range of such research questions has not broadened since data spatial and temporal resolution cannot increase as long as the data collection methods require human intervention and interpretation. Despite these observations, such traditional methods of data collection are very popular and accessible (See table 2-1).
Table 2‑1. Sample of studies on behavioral data capturing used in Architecture research.
| METHODS DATA CAPTURING | TITLE | AUTHOR | YEAR |
| SELF REPORT | |||
| Self-report data | Evaluating Architectural Legibility Way-Finding in the Built Environment | Weisman | 1981 |
| SR instrument | Space Syntax as a determinant of spatial orientation perception | Ortega, Jimenes, Mercado, Estrada | 2005 |
| SR Mapping | Children’s active free play in local neighborhoods: a behavioral mapping study | J. Veitch*, J. Salmon and K. Ball | 2007 |
| SR Mapping | Spatial and Social Configurations in Offices | Steen and Markhede | 2010 |
| OBSERVATION AND MAPPING | |||
| Observation | Behavioral Mapping: The Ecology of Child Behavior in a Planned Residential Setting | Coates, Sanoff | 1972 |
| Shadow | Finding the building in Wayfinding. Environment and Behavior | Peponis, Zimring, Choi | 1990 |
| Shadow | Space, Time, and Family Interaction: Visitor Behavior at the Sc. Museum of Minnesota | Cone | 1994 |
| Rounds | The morphology of exploration and encounter in museum layouts | Choi | 1999 |
| Observation | Floorplate shape as generators of circulation | Shpuza | 2001 |
| Observation | Measuring the effects of layout upon visitors’ spatial behaviors in open plan exhibition settings | Peponis, Conroy Dalton, Wineman, Dalton | 2004 |
| Observation | The effects of spatial behavior and layout attributes | Rashid | 2005 |
| Observation | A Study Of Variations Among Mies’s Courtyard Houses By A Combined Set Of Visual And Environmental Properties | Ruchi, Heo, Bafna | 2008 |
| Observation | Constructing Spatial Meaning: Spatial Affordances in Museum Design | Wineman, Peponis | 2009 |
Problems and Limitations
The characteristics of behavioral data collected through these classical methods lead the research questions toward general descriptions of behavioral data patterns, presenting three main issues that are central to this thesis. First, the data collection procedures include the investment of resources and the continuous presence of observers. Second, the variables collected usually refer to humans’ position in space and their role, as well as to some particular event that it is possible to be captured within a human reaction timeframe, which is ussually in the range of minutes. And third, the spatial and temporal resolution of the data obtained is limited to human capacity to observe and annotate. Observation methods require considerable resources and effort to collect the data in situ, involving the continuous presence of observers and, in practice, limiting the area covered. The constant presence of observers may also influence normal routines. Moreover, human capacity to annotate manually the fundamental variables of the data is limited, usually as to the location and the role of an individual in fairly regular intervals of time. Also, the methods are only conceptually, but not exactly, replicable, impacting the consistency of annotations among observers or findings among studies. To overcome these limitations, the area of computer science has developed a series of positioning systems and algorithms. However, very little architecture research has incorporated them. The few existing cases are presented in the following section, and a survey and review of all location systems are presented in detail in Section 3 of this dissertation, with the purpose of selecting the most appropriate system for this research.
2.2 Semi-automated systems utilized in Architecture Research
Since 2009, very few studies in architecture have adopted new technology for collecting behavioral data (See Table 2-2). Some attempts included the use of radio-frequency identification (RFID) proximity-tracking sensors (Choudhary, Bafna, Heo, Hendrich, and Chow, 2009; and Heo et atl., 2009), followed by scene analysis systems based on video capture (Gomez, Romero, and Do, 2012; Tomé and Heitor, 2012, 2013 and 2015 a and b), and proximity and triangulation sensors (Erickson, Lin, Kamthe, Brahme, Surana, Cerpa, Sohn, and Narayanan, 2009; Hormazábal, 2013).
The research motivation for each of these studies was completely different, ranging from health-care related, shapes of activity patterns, movements in education layouts, to individual energy consumption in houses. An example is RFID tracking, used in two studies in health-care environments where the goal was to “identify opportunities to increase direct care time through improvements in work process, technology, and unit layout” (Choundhary et al., 2009; Hendrich et al., 2009), demonstrated that higher spatial integration could lead to a higher frequency of visits to patient rooms and nurse stations. In both studies, technical and social issues appeared during the system review. Technically, RFID sensors allow the recognition of an individual’s area of location, but the sensors cannot specify in which convex space the individual is located. For example, individuals could be located in either of two adjacent rooms. Socially, the participants’ use of tags had both negative and positive implications. On the one hand, the participants had concerns about privacy, but on the other hand, the data set included participant’s roles such as doctors or nurses.
Other examples of the use of technology in collecting behavioral data for architectural research purposes can be found in the scene analysis systems employed in two different studies, Activity Shapes (Gomez, Romero and Do, 2012) and the Informal Learning Spaces (Tome me and Heitor, 2012). In both studies, the two technical issues of data amount and occlusion of the target were overcome by top-down orientation of the cameras. The Activity Shapes study was set in a multi-camera environment laboratory, where three of the cameras were strategically located on the ceiling, simultaneously recording three top-down videos to cover the entire area and facilitating floor layout mapping. Videos were stored on a server next door. For this study, the information was assigned to a spatial grid of 21 x 13 cells, of one square foot each, weighting each cell’s occupancy to understand the topology of the occupancy. This work had a similar basis to Bechtel’s work, the “Hodometer floor use study”, on topology of movements (Bechtel, 1967). The Informal Learning Spaces study analyzed movements using a single camera that was located in the ceiling of an atrium, recording top-view videos of a larger public atrium and using computer vision to capture movements. Socially, in both cases, the systems did not interfere with the scenarios’ routines. In the first case, three scenarios, each with a different activity set-up, were designed to study the differences of the occupancy patterns produced by the activities in a particular space. In the second case, the focus was on the effect of daily movements on a real scenario. Two major differences between these two studies were the focus on occupancy versus movements and the time aggregation range, with the first study having a time resolution of one second and the second having a time resolution of one hour.
Table 2‑2. Summary of semi-automated methods of behavioral data collection utilized in architectural research
| METHODSDATA CAPTURING | TITLE | AUTHOR | YEAR |
| SEMI-AUTOMATED | |||
| Tracking RFID | A Modeling Approach for Estimating the Impact of Spatial Configuration on Nurses’ Movement | Heo, Choudhary, Bafna, Hendrich, Chow | 2009 |
| Tracking RFID | Unit-related factors that affect nursing time with patients: spatial analysis of the time and motion study. | Hendrich, Chow, Bafna, Choudhary, Heo, Skierczynski. | 2009 |
| Tracking RFID | A predictive model for computing the influence of space layouts on nurses’ movement in hospital units | Choudhary, Bafna, Heo, Hendrich, Chow | 2010 |
| Wireless camera sensor network | Energy efficient building environment control strategies using real-time occupancy measurements | Erickson, Lin, Kamthe, Brahme, Surana, Cerpa, Sohn, and Narayanan | 2009 |
| Camera / Video Observation | Activity Shapes: Analysis methods of video‐recorded human activity in a co‐visible space | Gomez, Romero, Do | 2012 |
| Camera / Computer Vision | Computer Vision Of Mobility In Informal Learning Spaces | Tomé and Heitor | 2012, 2013, 2015 |
| Ubisense Sensors | Post Occupancy Evaluation Of Homes In The United Kingdom To Develop An Affordable P.O. Methodology For Homes In Chile | Hormazábal | 2013 |
Cameras and sensors were used to analyze building energy efficiency in two studies, the “Energy efficient building environment control strategies using real-time occupancy measurements” study by Erickson et al. (Erickson, Lin, Kamthe, Brahme, Surana, Cerpa, Sohn, and Narayanan, 2009) and the “Post Occupancy Evaluation Of Homes In The United Kingdom To Develop An Affordable P.O. Methodology For Homes In Chile” study by Hormazábal (2013). While Erickson et al. (2009) used the SCOPES system (Kamthe, Jiang, Dudys, and Cerpa, 2009), a wireless smart camera sensor network installed on the ceiling of real environments, to collect mobility patterns in a building’s floorplan, Hormazábal used the Ubisense system (ubisense.net) for the same purpose. Both studies focused on energy consumption in relation to individuals, but the first one predicted occupancy for the use of HVAC systems and the second one concerned the real use of appliances and systems.
Erickson et al. (2009) utilized SCOPES to capture the corridors of the science and engineering buildings at the University of California. Technical challenges, such as the cameras’ and sensor nodes’ location, were designed to catch movements at transition points. Other computational limitations were solved by using object detection algorithms after processing the data. However, social challenges are not mentioned in this study. Hormazábal’s research was conducted in a BASF house, a home-lab setting, where all technical challenges were previously designed and solved (www.basf.com). Participants agreed to use wearable sensors during the entire period of research, resulting in a high accuracy of positions and identification of roles. Social challenges, however, arose from the requirement that participants consent to live in a BASF house for at least one month, using the wearable sensors, which highly impacted pervasiveness, or effect on normal routines. Privacy was also an important issue, being poorly evaluated by 75% of participants (Hormazábal, 2013).
Three architectural-related computer science studies with a focus on technology development are also crucial to this research, i.e., “Vis-A-Viz” (Romero, 2008), “The History of Living Spaces” (Ivanov, 2007), and (WeWorkBIM, 2015). All the studies utilized information visualization techniques, including time as a variable for human occupancy and movement analysis. Vis-A-Viz provides a tool for visualizing human activity through computer vision (Romero et al., 2008), which automatically records and after-processes human movements from overhead videos, allowing a close one-to-one mapping of individuals’ positions over the architectural layout. It computes motion by adjacency frame difference (AFD); therefore, static presence is not taken into account. Vis-A-Viz constructs an activity map by aggregating images of people’s movements from a top view, and it displays an interactive activity cube, which a three-dimensional visualization displayed on “SketchUp” (www.sketchup.com). From the perspective of this thesis, the most important technical challenges of Vis-A-Vis involved assigning a specific type of movement to a specific person or role and discriminating static occupancy from lack of presence. The most important social challenge is to extrapolate the system installation and settings from a lab environment to a real and large-scale environment.
Another visualization tool for building occupancy is the History of Living Spaces (Ivanov et al., 2007), a mixed application composed of a small number of video cameras and a large number of motion sensors, making the monitoring of large-scale buildings possible. Technically, the system was designed to capture individuals’ positions, covering 3,000-square-feet of office space during one year; however, the spatial and temporal resolution of the data collected is low. Another important technical factor is the resources needed to replicate the study since it requires the reinstallation of the system using the same design criteria. Moreover, while cameras in buildings help to improve security levels, they also raise privacy issues due to the resolution of the information captured. However, motion sensors do not provide the same security level or enough information to extract positions in space with high precision as video cameras do. WeWorkBIM’s research (2015) by Davis and Payne, incorporated iBeacons, a protocol developed and introduced by Apple in 2013 (www.ibeacon.com), that uses Bluetooth low energy proximity sensors that transmit a unique identifier for the development of an application for indoor individuals’ tracking in real-time. Their goal was “to explore the potential of indoor positioning technology” since they believe that “[it] has the potential to transform the design and use of buildings, the same way we have seen GPS transform the design and use of cities.” (WeWorkBIM, 2015).
After reviewing the few architecture-related studies that have incorporated a location system, this paper next presents a survey and review of all location systems developed in the computer science area, with the purpose of selecting the most appropriate one for this research taking into account technical solutions, the social implications in the use of the systems in real environments, and an adequate spatiotemporal resolution of occupancy data.
2.3 Location Systems
As mentioned in the previous section, developments in location systems have been focused on the automation, precision and resolution of tracking, and positioning information of people and objects. Tracking and positioning systems differ by the privacy level involved. While tracking systems allow for following objects or individuals, positioning systems use the environment to calculate an object’s position (Cook and Das, 2004). The development of these systems was intended to address several specific needs, including Geo location; the location and tracking of objects stored in a warehouse; the location detection of medical personnel or equipment in a hospital; the location of firemen in a building; and behavior surveillance, monitoring, security, and sensing in smart environments (Liu, Darabi, Banerjee, and Liu, 2007).
Each aforementioned system was developed to solve a slightly different problem, differentiating themselves on the following six technical parameters, as Hightower and Borridello proposed (2001): (1) Location physical phenomena, (2) portable elements versus infrastructure, (3) form factor of sensing devices, (4) power requirements, (5) portable elements versus infrastructure, and (6) resolution in time and space. These technical parameters have a direct impact on social parameters. Physical phenomena impact privacy, allowing or hindering identity and the associated information.
Table 2‑3. List of systems, technologies, techniques, years of development, and years that technology was adopted by architectural research or Computer Science research related to indoor spaces (1).
| Computer | Architecture | |||
| System | Technology | Technique | Science | Research |
| Development | Related (1) | |||
| GPS | Global Positioning System | Triangulation | 1973 | |
| GMS | Global Mobile System | Triangulation | 1991 | |
| Microsoft RADAR | WLAN, Received Signal Strength (RSS) | Triangulation | 2000 | |
| UWB | Radio Ultra Wideband >500MHz | Triangulation | 2002 | 2010 |
| Infrared | Infrared waves | Proximity | 1992 | |
| RF / RFID | Low Radio frequency RF | Proximity | 2004 | 2009 |
| Bluetooth | Low Radio frequency RF | Proximity | 1994 | |
| iBeacons | Bluetooth Low Energy (BLE) | Proximity | 2013 | 2015 |
| Wifi signals | Cellphones and WiFi signals (avg acc-2mt) | (50%acc within 10m) Trilateration, fingerprints | 2002 | 2015 |
| SmartFloor | Pressure Sensors | Proximity*, physical contact | 1997 | |
| Cricket | Ultrasonic Pulses +RF | Proximity, Triangulation | 2000 | |
| Hexamite | Ultrasonic ID + RFID | Proximity, Triangulation | 2002 | |
| Ubisense | UWB+RF | Proximity Triangulation | 2005 | 2013 |
| Wireless High-presicion cameras | High-precision video cameras | Scene Analysis | 2000 | 2012 |
| Survillance Cameras for location | Low resolution cameras network | Scene Analysis | 1980’s | |
| Multicamera Environments | High-resolution cameras network | Scene Analysis | 2005 | 2008*/2012 |
| Accuware Wearabouts | WiFi, GMS, GPS,
Camera Visual Features |
2015 | ||
| Multicamera and sensors environment | LowRes cameras, Sensors network | Scene Analysis, Proximity and Triangulation | 2007 | 2009* |
| Kinect Sensors RGBD | Depth sensor, RGB camera | Scene Analysis, Proximity and Triangulation | 2011 |
Infrastructure or portability, form factor, and power requirements may impact the level of the systems’ intrusion on the scenario and the systems’ effect on normal routines, or pervasiveness. Power supply also has an impact on the duration and continuity of data recording. Additionally, resolution in time and space of collected data has an impact on research questions. The most influential technical parameter for determining the approach that best suits a specific study, interfering the least with the social parameters, is physical phenomenon that refers to the system’s automatic location sensing techniques, i.e., triangulation, proximity, and scene analysis. Triangulation uses lateration or distance measurements from three non-collinear points, as well as angulation or angle measurements to compute object location, which impacts on passiveness since it requires at least three vantage points. Proximity determines when the target is within range of the source by monitoring wireless cellular access points and by tracking automatic ID systems or by pressure, which increases the effect on normal routines. And scene analysis compares a sequence of observed sight, from a fixed vantage point, detecting the features in the observation. Although scene analysis does not require geometric information, motion, or emission of signals, it requires storing changes on the environment that alter the scene, usually visual images, compromising privacy (Hightower and Borridello, 2001).
As background for this thesis, a detailed survey and comprehensive review of existing indoor location systems was condructed by adapting and extending the taxonomy developed by Hightower and Borridello (2001) and Lui et al. (2007). The objective of the survey was to make an informed system selection, considering all technical and social aspects that may have an impact on this research’s objective of collecting high resolution physical and temporal location information for spatiotemporal analysis. The survey covers a subset of indoor location technologies that were developed over the last three decades, including: global positioning systems (GPS), global mobile systems (GMS), ultra-wideband sensors (UWB), infrared signals, fadio-frequency (RF) signals, RFID, Bluetooth, pressure sensors, and high-resolution cameras. Also, the survey includes a set of systems that represent a series of mixed technology, including RADAR, Cricket, Hexamite, Ubisense, multi-camera and sensor environments, and Kinect sensors.
To construct the survey, the systems were categorized under the three techniques they use for location: (1) triangulation; (2) proximity; and (3) scene analysis. Systems that use the triangulation technique are GPS, GMS, RADAR, UWB, Infrared, and RF/RFID. Proximity technique is used for Bluetooth applications, such as iBeacons. Also, pressure sensors under each tile, such as the ones used in a smart floor, could be considered a proximity technique. Wireless high-precision cameras, low-precision cameras, and multi-camera environments use scene analysis as the position calculation technique. Also, hybrid systems, which use two or three techniques for location calculation, are incorporated in the review. They include Cricket, Hexamite, Ubisense, multi-camera and sensor environments, and Kinect sensors. Each technology also implicates an object identification system or method, which could include the use of tags on triangulation and proximity or inferred location on scene analysis and pressure techniques.
For selecting the system to be utilized in this research, an exhaustive review of each system and technology was done based on previous research and the products’ online reviews. This review included ten specific technical and social criteria: accuracy, precision, range, dimensions, temporal scale, robustness, cost, privacy, passiveness and pervasiveness (See Table 1-4). Accuracy, in this context, refers to the system’s location error or the unit in which the data are collected (i.e. three seconds and two square feet), and precision refers to the system’s consistency of measurement unit. These first two measurements arise in the context of the technology assessment, and, therefore, they will be renamed in this document system accuracy and system precision.[1]
Table 2‑4. Summary of location systems survey organized by location techniques, and an exhaustive review of their technical and social aspects. (*) estimations that depend on the entire system set up.
|
|
System |
System Accuracy |
System Precision (consistency) |
Range (Coverage m.) |
Dimensions (2D, 3D, 4D) |
Temporal Scale (fps) |
Robustness (1-5) |
Cost (1-5 expensive) |
Perceived Privacy (1-5) |
Passiveness (1-5) |
Pervasiveness (1-5) |
power supply |
Infrastructure vs. portable |
identification system |
Expedite size and location (number of Devices) |
Recording Duration & continuity |
|
Triangulation |
GPS | 1 – 15 m | 95-99% | Outdoor | 3D | 40 nSec | 5 | 5 | 3 | 2 | 4 | battery | P | tag | 1 tag/object | |
| GMS | 50 m | *50% | 100-150m | 2D | 3 | 3 | 4 | battery | P | tag | 1 tag/object | |||||
| Microsoft RADAR | 3-4.3m | 50% | 1/floor | 2D | 4 | 2 | 4 | 4 | battery | P | tag | 1 tag/object | ||||
| UWB | 9 cm | 90-95% | 10.5 m | 1D, 2D | 5 | 2 | 1 | 4 | 5 | battery | P | tag | ||||
|
Proximity |
Infrared | 9 cm | 90-95% | < 5m | 2D | 10 sec | 5 | 1 | 3 | 3 | 4 | battery | P | tag | 1 tag/object | |
| RF / RFID | <1m | 50% | 10 m2 | 2D | 10 sec | 3 | 1 | 1 | 5 | 5 | battery | I P | tag | tag/ object, Nodes placed densely | ||
| Bluetooth | 0.5-1.5m | 90-95% | <10m | 3D | 15-30 sec | 3 | 3 | 3 | 3 | 5 | battery | P | tag | every 2-15 m | ||
| iBeacons | Few cm. | 75%-90% | 70 mt./ 450 mt. | 3D | 1ms | 3 | 4 | 1 | 3 | 5 | battery | P | tag | 1 tag/object | ||
| SmartFloor | grid cell | 100% | 0.5m / cell | 2D | by event | 3 | 5 | 3 | 5 | 1 | net | I | inferred | 1/cell (50cm) | ||
|
Proximity & Triangulation |
Cricket | 1-5m | 75-91% | 3m | 3D | 4 | 2 | 1 | 5 | 5 | battery | P | tag | 1 tag/object | ||
| Hexamite | 2 cm | High | 14 m | 2D, 3D | 4 | 2 | 1 | 5 | 5 | battery net | P | tag | 1 tag/object | |||
| Ubisense | 15 cm | 99% | 1000m | 2D, 3D | 6 sec | 1 | 4 | 1 | 5 | 5 | battery net | I P | tag | 1 tag/object | ||
|
Scene Analysis |
Wireless High-presicion cameras | 30 cm | 90% | 27m 170° | 4D | 148 fps | 4 | 4 | 3 | 3 | 1 | battery net | P | inferred | 1 / convex space | 2 hrs |
| Survillance Cameras for location | 30 cm | *80-90% | 27m | 2D, 4D | 1-30 fps | 4 | 1 | 4 | 1 | 1 | net | I | inferred | 1 / convex space | *1 week | |
| Multicamera Environments | 20 cm | 90% | 27m | 2D, 4D | 6-30 fps | 4 | 3 | 2 | 3 | 2 | net | I | inferred | <1/9m | 4 hrs | |
|
Scene Analysis, proximity and Triangulation |
Multicamera and sensors environment | *30 cm | *80-90% | *27 m | 4D | by event | 3 | 4 | 4 | 3 | 1 | net | I | inferred | 1 / 7m | *1 week |
| Kinect Sensors RGBD | *30 cm | *80-90% | 0.7m–6m 57° | 4D | 15-30 fps | 3 | 2 | 4 | 3 | 2 | net | P | inferred | 1 / 6m | 10 min.* |
Range refers to the area of coverage of a system or its radius of influence from the source that makes it possible to obtain accurate data. The term “dimensions” refers to the capacity of capturing 2D or 3D locations and details Temporal scale is the frequency of recording information (i.e. 24 fps, 60s, one hour, one month), and robustness refers to the normal functionality in exceptional cases. Cost includes the use of resources, such as money, time, space, installation, and maintenance. Privacy refers to whether the system allows individual recognition of or association to a person, and passiveness refers to the level of intrusion of the system in the use of tags or consent. Finally, pervasiveness relates to its effect on normal routines.
Regarding these technical aspects, nine of the seventeen reviewed systems provide a system accuracy of 30 cm or less; eight of them supply data with around 90% system precision, providing consistency between reality and the data obtained. Those systems include GPS, UWB, infrared, Bluetooth, Smartfloor, Ubisense, high precision video cameras, and multi-camera environments. Their individual coverages are as follows: UWB systems cover approximately 10 meters; seven systems including GPS, GMS (outdoor), RADAR and Ubisense cover areas up to 1000 meters; and scene analysis systems, such as high-precision cameras, surveillance cameras, and multi-camera environments, cover distances of approximately 27-36 meters (88-120 feet) in the direction of the scene. For this research, an accuracy of 30 cm (approximately 1 feet) and a range between 90-120 feet are the appropriate distances that provide enough resolution and cover a reasonable large area. Infrared technology is obstructed by physical objects like walls. Radio frequency and RFID, Smart Floor, Cricket, and Hexamite systems are based on UWB and RFID; therefore, they are obstructed by physical objects and have a radius shorter than 10 meters. Most of the scene analysis and triangulation systems capture 2D and 3D information, but only five really capture 4D information with a relatively high temporal resolution of six seconds or less, with some of them reaching 148 fps, like GoPro high-resolution cameras. Although the Kinect sensor belongs to the scene analysis and triangulation category, it is also based on infrared (IR) emitter and an IR depth sensor, therefore its coverage range is reduced to approximately 0.5 to 8 meters (1.6 to 26 feet). Some of the systems, such as Smart Floor and infrared, record data by event, and the data collection is not temporally continuous. Also, most of the systems ranked average in robustness, a variable that reflects users’ positive technical reception and confidence in the system.
Cost, privacy, passiveness, and pervasiveness are considered social variables for the purposes of this study, since they originate in the social context of the research. These variables are not exactly replicable since they depend on the research financing agreement and on the cultural aspects of the society in which the research is carried out. The cost of installing the system, for example, varies depending on the area of interest to be covered by the research and on the sponsoring institution’s investment in technology. Most of the systems are relatively expensive (above average), with the exception of infrastructure systems, which are conceived as part of the building infrastructure, such as infrared networks or surveillance camera networks. Some systems, such as Kinect sensors, are comparatively cheaper by unit, but since they cover a relatively small area, the amount of sensors needed to cover a building floor makes the total system’s installation expensive. Therefore, the cost of the system installation is the ratio between the areas of interest of the research and the number of devices needed to cover them, which in turn defines the system scalability. Privacy refers to the direct recognition and identification of individuals. Although some wearable technology does not link a person’s identification (ID) with an ID tag, participants perceive that by wearing them they are being continuously tracked. Therefore, privacy in this survey refers to “perceived privacy” by the user, which does not necessarily relate to an actual ID recognition. A high perception of privacy is directly related to not wearing the devices. An example of high perceived privacy involves a surveillance camera system, which calculates the location of individuals through scene analysis. Although this system continuously records actions and activities that could be interpretable, it does not automatically identify a specific person, resulting in a highly evaluated perceived privacy. Also, the use of scene analysis technology usually does not require an individually signed consent, since a general consent is obtained when the users agree to enter the space covered by the surveillance cameras in a building. Alternatively, systems that require the use of wearable tags normally relate the individual to an identification code, although not to an actual name or ID. Despite these technology specifics, users perceive a high level of privacy invasion in the use of wearable tags because they provide continuous tracking and require individual consent.
Other aspects, such as infrastructure or portability requirements, size, location, coverage and distribution of technology, and necessary power supply are addressed as they impact passiveness and pervasiveness of the system. More than 75% of the reviewed systems scored an above average level of intrusion on the environment – or passiveness – due to their physical invasion of architectural and personal space. The size and location of technology, as well as the number of devices needed to cover an area and the type of their required power supply (i.e., battery or plug), are the four most influential variables for system scalability, including coverage, duration, continuity, and resolution of the data collected, which directly impact the passiveness level. The distribution of wearable tags among participants plus their signed consent are the two most influential aspects affecting the effect of the use of the technology on normal routines – or pervasiveness. Ultimately, pervasiveness and passiveness levels impact the validation of the data collected since it defines the partial or total number of participants.
1 Problems and Limitations
Most of the systems studied hold real promise to inform architectural research practices since they are more automatic and less time-consuming than the traditional methods of behavioral data collection reviewed in the first section of this chapter. Also, they provide higher spatial and temporal data resolution due to their system accuracy and precision and the duration and continuity of data recording, as supported by their power supply capacity. Additionally, from the perspective of research methodology, the implementation of these systems allows almost exact research replication compared to the observation and mapping methods. However, all of these systems and methods require more concrete resources than the traditional ones and have diverse social implications. Further, some systems, compared with others, have a higher level of perceived privacy invasion and of passiveness – requiring a considerable benefit-to-cost ratio for participants to provide consent (Lachello & Abowd, 2006) and therefore affecting the number of participants and compromising the data sample. Also, they promote a high level of pervasiveness – affecting normal routines, therefore having an influence on real scenarios and thus on the research findings. Because this research seeks to accomplish the certain social objectives, scene analysis was the system selected to support the maximum perceived privacy and the minimum pervasiveness and passiveness levels, allowing for the collection of a dataset that most closely represents a real scenario.
2.4 Toward Spatiotemporal Data Collection: Why Scene Analysis?
Following the exhaustive review of location systems presented in the previous section, further assessment determined that the system that best contributes to the purpose of this study is a scene analysis system, specifically, a video surveillance data acquisition process, followed by a computer vision video process and video analysis. As with any system, scene analysis involves technical and social implications. However, the negative implications become minimal in relation to the accomplishment of one of the primary objectives of this research, i.e., to automatically collect spatiotemporal data of high resolution in a real scenario. This section presents a more detailed review and comparison of all location techniques, supporting the choice of the scene analysis system. Afterwards, a more comprehensive technical and social description of this specific system is presented, followed by a discussion building the argument for its selection. This assessment was performed by the principal researcher to rationalize the selection of the methodology, contemplating the context of this research. The selected technique – scene analysis – acts as a version of the implementation of the framework.
First, the comparative evaluation of the three computational location techniques –triangulation, proximity, and scene analysis – is presented to support the selection of scene analysis as the most appropriate one for this research. The classic method of behavioral observation and mapping is included for comparison purposes. This evaluation weighs the contribution, neutrality, or negative impact of each aspect as it relates to the objective of collecting spatiotemporal data of high resolution in a real scenario, assigning them the values of one (1), zero (0), or negative one (-1) respectively. The techniques are reviewed under the ten technical and social criteria presented earlier in this chapter. Each criterion, however, was more accurately subdivided in a number of aspects that concern this research. This review starts with the technical criteria, followed by the social ones.
From the technical perspective, the first criterion is system accuracy, which is composed of three crucial aspects, location error, units of data collection, and occlusion of the target. Second is system precision, which is composed of consistency of measurement units, consistency of target location, and access to the original data to validate it. As highlighted in Table 2-4, the system accuracy score is high for the triangulation and proximity techniques (0.7), but it is low for scene analysis (0.3) due to the occlusion of the targets from a particular vantage point. Although occlusion of the target is one of the weakest aspects of scene analysis, its precision score is the highest (0.7) due to the access it allows to original data, avoiding manipulation errors. The combination of system precision and system accuracy define data authenticity, which is constant and averages among the three computational location techniques (0.5).
Table 2‑5. The three location techniques: Triangulation, Proximity and Scene Analysis evaluated under the 10 technical and social criteria, and compared to the observation method.
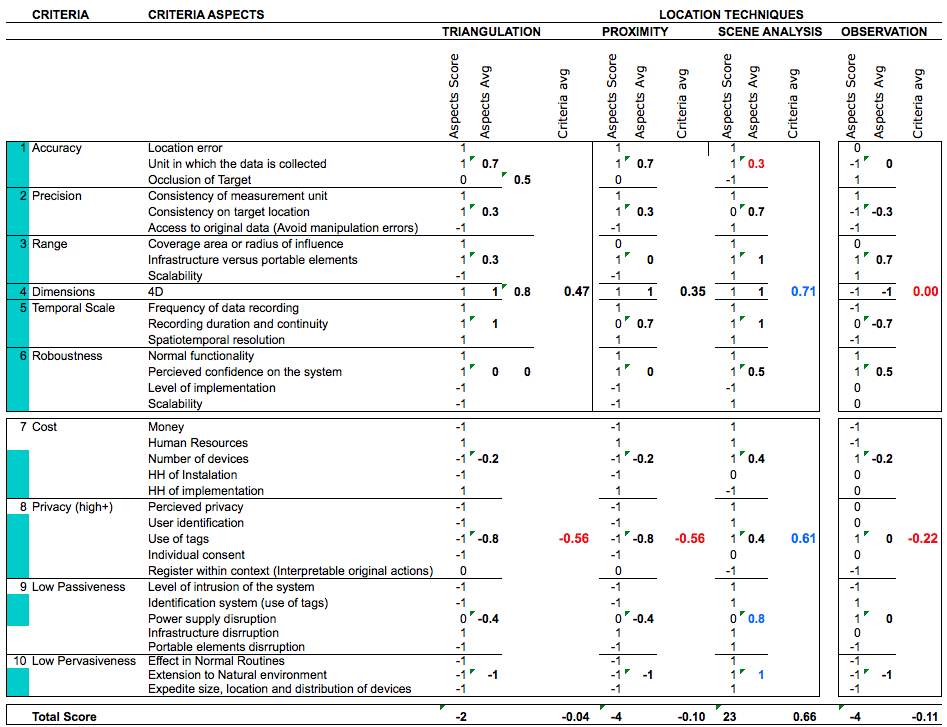
The third criterion is range, which refers to the area or range covered by the technology’s influence, its infrastructure or portable aspect, and the scalability of the system to cover the area of interest. Proximity location technique has the shortest range (0), followed by triangulation (0.3). Scene analysis, however, has the highest range (1) not only because of the distance it covers, but also due to its scalability (1). The fourth criterion shows that the number of dimensions captured is 4D for all the techniques, except the classic observation method, as reviewed in the first section. Fifth, temporal scale is characterized by the frequency of the data recorded (i.e. fps), the duration and continuity of recording capacity, and the spatiotemporal resolution. Its scores are very high for the three techniques, with proximity the lowest among them (0.7). Sixth, robustness refers to the system’s functionality in normal and extreme conditions, the perceived confidence in the system, the level of implementation, and its scalability to larger areas. Robustness is not the strongest characteristic of any of the techniques (0 – 0.5), mostly due to the current developmental stage and scalability of all systems, which is constantly improving.
This assessment also reviews the social aspects of cost, privacy, passiveness, and pervasiveness. First, cost is considered a social criterion since it does not focus on budget as the principal aspect, but on the total resources of the research. Therefore, the social aspects of cost are monetary budget, human resources, number of devices to cover the necessary area, and the time invested on installation of devices and on implementation of the system or the time invested in mapping. The three techniques have similar scores on Cost (-0.2), with the exception of Scene analysis (0.4). The human resources needed scored high in the three computational techniques, excluding observation, making cost one of the crucial aspects for choosing computational methods over manual methods. However, differences in cost among the computational techniques appear in the hours of installation and implementation. Scene analysis is the only system that requires more hours for implementation than installation.
The eighth criteria, privacy, refers to the perceived privacy, which is the fundamental factor for users to agree to participate in the research. Scene analysis is the only technique that scores positively in this aspect. Potential participant identification, the use of tags, the individual consent requirement, and the capacity to interpret the original actions are the other aspects that impact privacy. Triangulation and proximity both scored similarly negative in privacy (-0.56), followed by the observation method. Scene analysis is the least invasive method in regard to privacy (0.61). Although the data format allows accessing the data captured and interpreting original actions, which allows for individual identification, the participants accept this aspect as part of the system. The ninth criteria, low passiveness, refers to the level of intrusion of the system, the use of tags, power supply, and infrastructure or portable elements disruption. Triangulation and proximity score negatively (-0.4) compared to observation methods (0), and scene analysis is the only one that scored positively in low passiveness (0.8). The last criteria, low pervasiveness, refers to the effect of technology on normal routines, the ease of extending the system to natural environments, and the expedited size, location and distribution of the devices. All these aspects scored negatively for all technologies, except for scene analysis. In conclusion, despite occlusion of the target, a fundamental negative aspect of scene analysis, the capture of real occupancy data from a real scenario, with no intrusion of the system and no effect on normal routines, proved the most crucial factor for selecting scene analysis over other technologies.
2 Scene Analysis Assessment
Scene analysis is organized in two components, hardware and software, and the following three stages: (1) video acquisition supported by a hardware system, (2) video processing and (3) video analysis, all supported by software systems. In this section, a comparison of hardware among all scene analysis methods is presented, supporting the selection of the most suitable one for this research – surveillance environment. By itself, the surveillance environment is not capable of obtaining people’s location in space and time, since the data are stored in a video format. Therefore, it is crucial to implement video processing for occupancy detection based on computer vision, as well as video analysis, in the later stages. This section will review the scene analysis hardware component. The three stages will be presented in detail in Chapter 4, after introducing the proof-of-concept scenario for the specific characterization of the methods in Chapter 3.
This review addresses the total variety of scene analysis technologies under the same ten criteria presented in the previous section (see Table 2-6). First, it covers the technical aspects followed by the social ones, and then, it weighs the contribution (1), neutrality (0), or negative impact of each aspect toward the objective of collecting spatiotemporal data of high resolution in a real scenario, exactly like the previous review.
Table 2‑6. Four Scene Analysis systems evaluated under the 10 technical and social criteria, and compared to Kinect hybrid system.
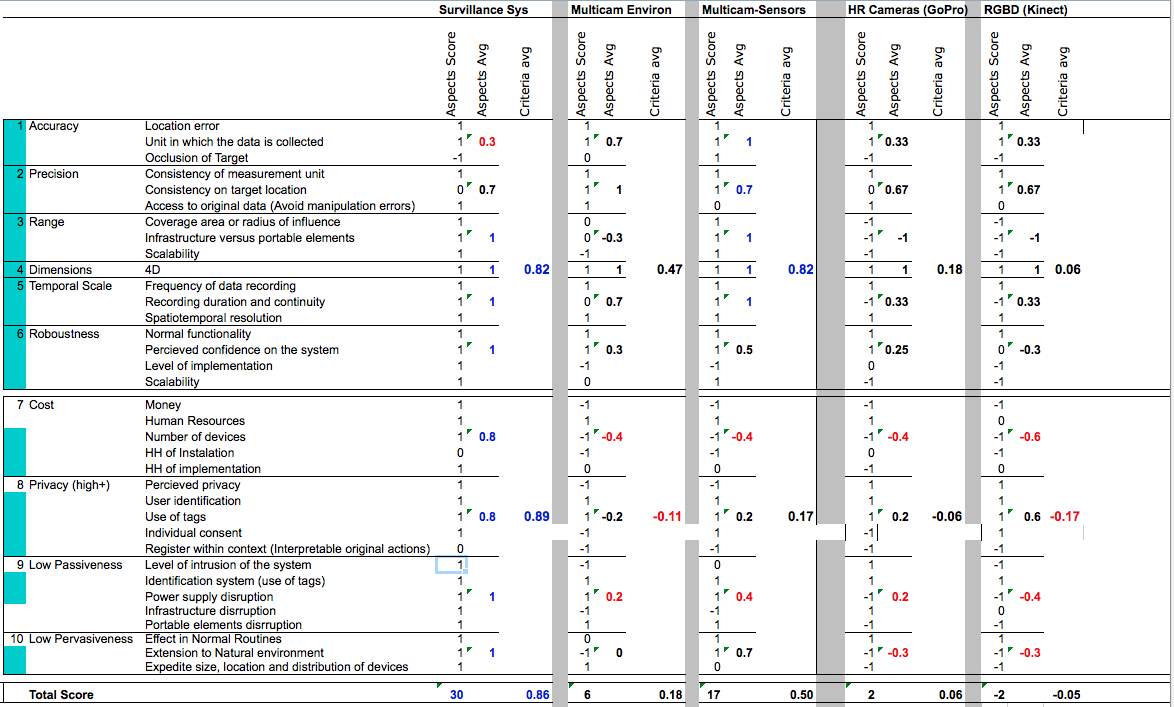
From the technical perspective, the highest total average belongs to multi-camera sensor systems (0.82), which is obvious result since it utilizes the best aspects of two technologies, cameras and sensors. These systems are closely followed by surveillance systems (0.71). The multi-camera environment takes third place, and high-resolution cameras (GoPro) and RGBD sensors (Kinect) fall far below (0.18 and 0.06 respectively). Comparing multi-camera sensor environments and surveillance systems, they significantly differ on system accuracy and system precision. System accuracy has an average of 0.7 over 0.3, and system precision 1 over 0.7, respectively. This crucial difference may be explained by the occlusion of target and the consistency of target locations, both due to the same factor, the position of camera vantage points on surveillance cameras and multi-camera environments. This assumes that multi-camera environments distribute more cameras in different and more appropriate locations for the location task as compared to the distribution of surveillance cameras for the surveillance task. Multi-camera sensor environments and surveillance systems are equally evaluated in range (1), dimensions captured (1), temporal scale (1), and precision (0.7).
From the perspective of social criteria, most scene analysis systems score low, with the exception of the surveillance system. In terms of cost, most systems require a huge amount of resources since they are not pre-installed in the building infrastructure like existing surveillance systems. Money, human, technical, and time resources are indispensable to mounting the new systems; therefore, all systems scored below (-0.4), with the exception of surveillance systems, which scored 0.6. In terms of privacy, only surveillance systems score over the average (0.6), primarily because of perceived privacy by users and the absence of individual consent. As previously reviewed, the interpretation of original actions from videos in a surveillance system could negatively affect privacy, as in all scene analysis systems; however, perceived privacy increases over time with the acceptance of the systems into daily routines. The surveillance system has the highest score on passiveness and pervasiveness (1) mostly due to the power, infrastructure, and low elements of disruption but also because of its potential for an extension to natural environments and their device sizes, location, and distribution into the infrastructure.
In conclusion, from a hardware perspective, a surveillance system is by far the best choice for the objectives of this specific research, with a total score of 28 over 36 contributions, and averages of 0.82 in technical aspects and 0.78 in social aspects. Nevertheless, because the data acquisition is in video format, the scene analysis process must be complemented by implementing the second stage, video processing, in order to obtain spatiotemporal occupancy data. The assessment of this stage uncovered only two important social restrictions, cost and privacy. Video processing is the most expensive stage in terms of resources, since it requires hundreds of hours of implementation. Video processing also allows access to original videos within context, permitting the interpretation of actions, thus reducing privacy. However, from a technical perspective, this aspect allows for the generation of a model for activity and occupancy data that can be used as a baseline for data accuracy and precision, the most significant technical challenges of this stage. Overcoming these challenges is crucial, since they have a direct impact on data quality and the authentication of the results. Consequently, an entire chapter (Chapter 5) of this dissertation is dedicated to studying such parameters, designing a test to construct the baseline parameters and validating the results.
2.5 Summary
This chapter first presented a review of the traditional occupancy data collection methods utilized in architecture research, i.e., self-report and observation and mapping methods, either from fixed vantage points or with movement, such as “shadowing” a person or doing rounds. Some key variables of the traditional methods were identified, which helped construct the argument for the adoption of semi-automated systems developed in the area of computer science. These key variables are (1) the resources, including constant presence of observers, 2) the limitation in capturing dimensions and number of variables, and (3) the spatial and temporal resolution of the data collected. This chapter also reviewed the technological developments of the location systems, identifying ten criteria for exhaustively comparing them: system accuracy, system precision, range, dimensions, temporal scale, robustness, cost, privacy, passiveness and pervasiveness. The first six are classified as technical criteria and the last four as social criteria.
Additionally, a review and comparison of location techniques for people – proximity, triangulation, and scene analysis – was constructed with the purpose of selecting the most appropriate one for one for this thesis’s objective of collecting spatiotemporal data of high spatial and temporal resolution in a real scenario. Some of the influences of the technical aspects were discussed, such as system accuracy and precision contrasted with the social aspects, such as privacy, passiveness and pervasiveness. Further, a specific comparison of the scene analysis systems was presented, with the purpose of supporting the selection of a surveillance system, which permits researchers to obtain occupancy data in a real scenario with minimal disruption caused by the technology. This study cannot accurately provide a depiction of the applicable scene analysis and computer vision detection methods, without first introducing a detailed description of the proof-of-concept scenario in the context of this research, which is provided in the next chapter.
[1] Accuracy and Precision terms will be redefined later in Chapter 4, from the perspective of the statistical analysis.
Cite This Work
To export a reference to this article please select a referencing stye below:
Related Services
View all


Related Content
All TagsContent relating to: "Architecture"
Architecture relates to the design and construction of buildings and structures. Architecture also involves the complex planning of buildings and structures, before they can be designed and built.
Related Articles
DMCA / Removal Request
If you are the original writer of this dissertation and no longer wish to have your work published on the UKDiss.com website then please: