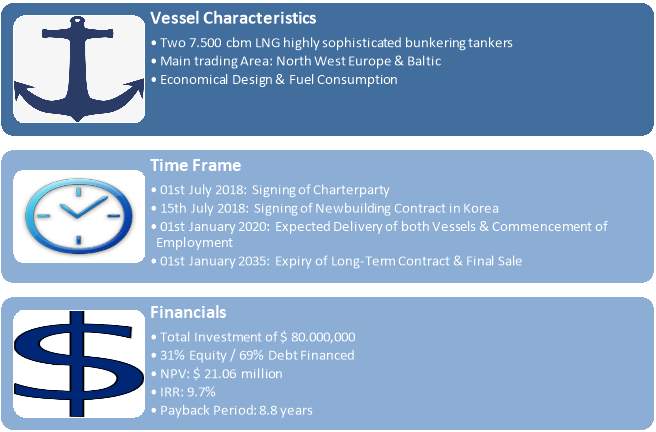
Investment into Two 7.500 cbm LNG Fuelled Bunker Vessels for Long-term Time Charter
Info: 23696 words (95 pages) Dissertation
Published: 9th Dec 2019
Tagged: EngineeringMechanicsSupply Chain
Investment into two 7.500 cbm LNG fuelled Bunker Vessels for long-term Time Charter
Cass Schiffahrtsgesellschaft GmbH & Co. KG
Contents
1. Strategy and Market Analysis
2.2. Economic Outlook Bunkering Market & Competition
2.4. Our long-term business Partner – Blue Gas LNG Trading GmbH
3. 7.500 cubic meter LNG fuelled Bunker Vessel
5. Capital Structure & Financing
5.1. Cash Flow & Profits – Pavel
5.2. P&L Statement – Pavel + TBA
Table of Figures
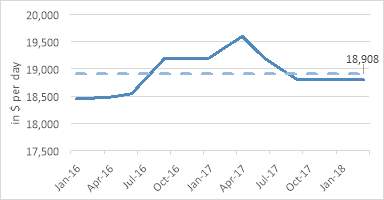
Figure 1: TCE Earning 7.500cbm LNG Carrier (Steem Broker, 2016-2018)
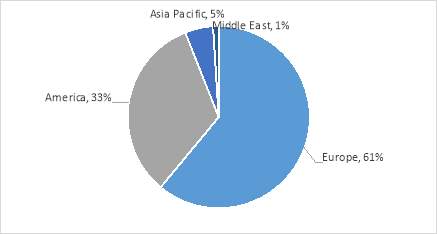
Figure 2: LNG Fuelled Ships main Trading Areas (Clarksons Research, 2016)
Figure 3: LNG fuelled Fleet Development (Clarkson Reseach, 2018)
Figure 4: Share of Bunker Fuels (Bomin Linde LNG, 2015)
Figure 5: LNG Terminals NWE (GIE, 2018)
Figure 6: Vessel Description (Q88, 2018)
Figure 9: Loan Payment Schedule
Executive Summary
Global warming and climate change are existent and have become a major global issue. Correspondingly, the shift towards cleaner fuels for the merchant fleet is pervasive. This is not only beneficial in the fight against climate change. In fact, it also offers investments opportunities in different segments. Natural gas is going to be used as a bridging fuel and it is expected that many ship owners tend to opt for liquefied natural gas (LNG) fuelled engines due to financial, regulatory and environmental incentives
Cass Plc therefore introduces to invest into two liquefied natural gas bunkering vessels by establishing a limited liability company called Cass Schiffahrtsgesellschaft GmbH & Co. KG. The investment will be backed by a long-term charter contract with a reliable German based company. After analysing and presenting the rationale behind our proposal, we will describe the investment in detail by giving a comprehensive analysis about the vessels characteristics. Furthermore, the German Shipping system will be familiarised showing the huge potential it implicates followed by a detailed financial analysis, which the investment offers.
1. Strategy and Market Analysis
Regulatory powers continuously push countries to become more environmentally friendly by making them develop new sustainable technologies, burn cleaner fuels and use cleaner resources to reduce carbon dioxide emissions. According to BP’s energy outlook, these circumstances will result in global growth in natural gas to be on a faster pace compared to both oil and coal between 2015 and 2035 (BP, 2017). Consequently, natural gas consumption and the associated global trade are going to increase offering a potential new field of investment.
In order to feed this rising appetite for Gas, Germany as one of the biggest energy markets in Europe is currently developing their first liquefaction plant. The shift towards the super cooled cleaner liquefied gas is also going to result in a greater demand for transportation in the form of alternative bunker fuels. This development is supported by the mandatory regulation set out through the International Maritime Organisation (IMO) to limit the usage of high sulphur fuel and marine gasoil forcing ship owners to look for competitive substitutes in the form of LNG.
2. Investment Proposal
In order to benefit, from the growing market of LNG bunkering from 2020, we consider it is the best choice to enter this market by investing into two specialised 7.500 cubic meter bunkering vessels trough a long-term time charter. To find out the potential market rate of comparable vessels, we took the benchmark time charter rate for 8,000 cubic meters ethylene carrier. By adding a current market premium of 20%, it was detected that the market offers an obtainable time-charter rate of up to $ 18.908 per day. However, by taking into account the considerable long period of 15 years it was agreed to reach a compromise at $ 18.000 per day (Perez, 2018).
2.2. Economic Outlook Bunkering Market & Competition
At present, a remarkable number of 85% of the current LNG-fuelled vessels are presently mainly trading in the big four areas in the world as show in figure 2. As of today, 65 different type of vessels are capable of using LNG as an alternative fuel (Clarkson’s, 2018). Figure 3 illustrate further that more ship owners decide to lay focus on LNG fuelled engines. As such, 108 vessel are still on order and expected to enter the market within the next six years – an increase of 37% compared to today.
After studying the competition in Northern Europe, we have identified merely three other major ship owners, who are engaged in the LNG bunker market in Norther Europe so far, namely Anthony Veder Group, Stolt Nielsen Limited and Bernhard Schulte GmbH (Clarkson’s, 2018). Only one vessel of our size has so far been delivered (MT Coral Methane) showing that the companies approach to invest into this field has a huge potential.
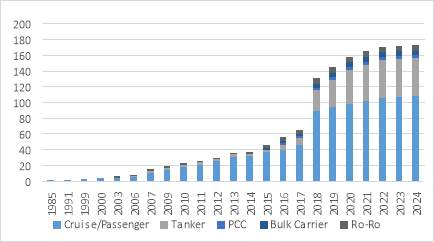
Figure 3: LNG fuelled Fleet Development (Clarkson Reseach, 2018)
Figure 3: LNG Fuelled Fleet Development (Clarkson Research, 2018)
Furthermore, considering the new Emission Controlled Areas (ECA) regulations it is expected that a huge number of owners are going to increase LNG as an alternative fuel from 2020. Although there are still a lot of uncertainties how ship owners are going to behave, a further increase of LNG demand can be expected. Especially NWE (North West Europe) and the related ECA zone will see a huge increase of LNG as the fleet trading in this area can easily access small bunkering ports and supply their vessels with the super cooled fuel.
2.3. ECA after 2020
Accounting for about 2.1% of global CO2 emissions yearly, there is continuous pressure on the shipping industry to become more environmentally friendly (Shipping Council, 2018). As a consequence, the industry has been subject to several environmental regulations over the past years. The latest regulatory, introduced through the global legislative International Maritime Organisation (IMO) sets a 0.5% global sulphur cap on marine fuels globally which applies beginning January 2020 (Cadden, 2018). Currently, the limit for the sulphur content of ships fuel oil is 3.50%, allowing ship owners to burn cheaper heavy fuel oils (HFO). The imposed cap in sulphur emissions leaves three options: burn expensive low sulphur fuel oils such as marine gas oil (MGO), marine diesel oil (MDO) and low sulphur fuel oil (ULSFO) install scrubbers which will allow them to burn HFO or, invest in vessels which are LNG fuelled and comparatively low priced.
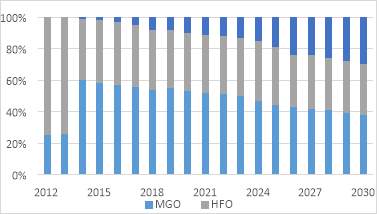
Figure 4: Share of Bunker Fuels (Bomin Linde LNG, 2015)
Therefore, the demand for low sulphur fuels is set to increase significantly in 2020. It is also speculated whether the supply of low sulphur fuels will be high enough to meet the demand, which means that the cost of low sulphur fuels will increase significantly in case of a supply shortage. These are the reasons why LNG fuelling is regarded as a sustainable long term solution: LNG is cheap and emits 0% sulphur.
2.4. Our long-term business Partner – Blue Gas LNG Trading GmbH
After long evaluations of investment’s potential, the management has decided to go into time charter negotiations with the LNG supplier “Bluegas LNG Trading GmbH”, mainly active in Germany. Blue Gas is conducting business mainly in LPG and LNG for over 30 years, owning a substantial network of gas stations as well as small scale liquefaction plains With the assistance of the highly recognised shipbroker firm “Cass Shipbroker Ltd”, we have been able to conclude a long-term charter agreement, which is still subject to our company’s board of directors approval, which is due latest on 01st July 2018 18:00 London (see copy of the sub-fixture in the appendix).
2.5. Trading Area
Blue Gas LNG Trading will mainly operate the vessels at the LNG Terminal in Brunsbuttel which will shortly become the first location of the first ever build LNG terminal in Germany. The terminal mainly aims to receive, store, regasify, transmit through a pipeline and distribute the LNG to other facilities via ship, truck and barges. Considering our project, Blue Gas Shipping GmbH & Co. KG will use the new terminal as their main hub in order to distribute the cargoes mainly to the German coast and the Baltic. Furthermore, Blue Gas LNG is planning to use different locations – as shown in figure 5 – to load cargoes.
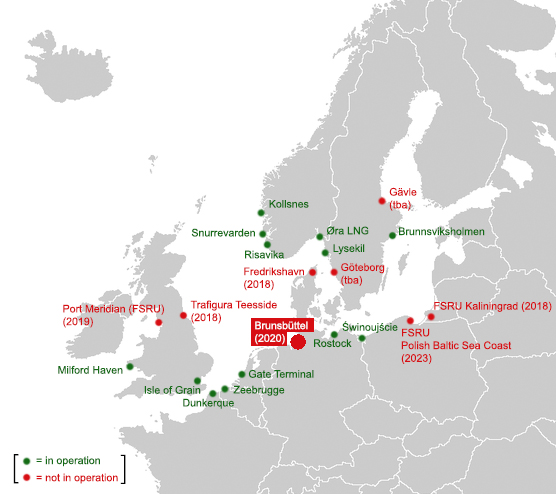
Located in the greater industrial and economic zone of Hamburg, the main competitive advantage is the location next to the Kiel Canal. In 2016, a remarkable number of 29.284 vessels passed the canal, making it the most important waterway in Northwest Europe and a considerable important point for future LNG bunkering operations.
The terminal is expected to have a turnover of 4-5 bcm (billion cubic meters) of LNG per annum and will be able to store about 220,000 cbm of liquefied Gas. Next to a truck loading facility one jetty will be able to receive and load vessels up to a size of 210,000 cbm, enabling the terminal to receive Q-Flex vessels (German LNG, 2018). Furthermore, a connection to the gas grid via a pipeline is being built as well and if needed future expansion plans can be easily accommodated, due to plenty of unused space in close area.
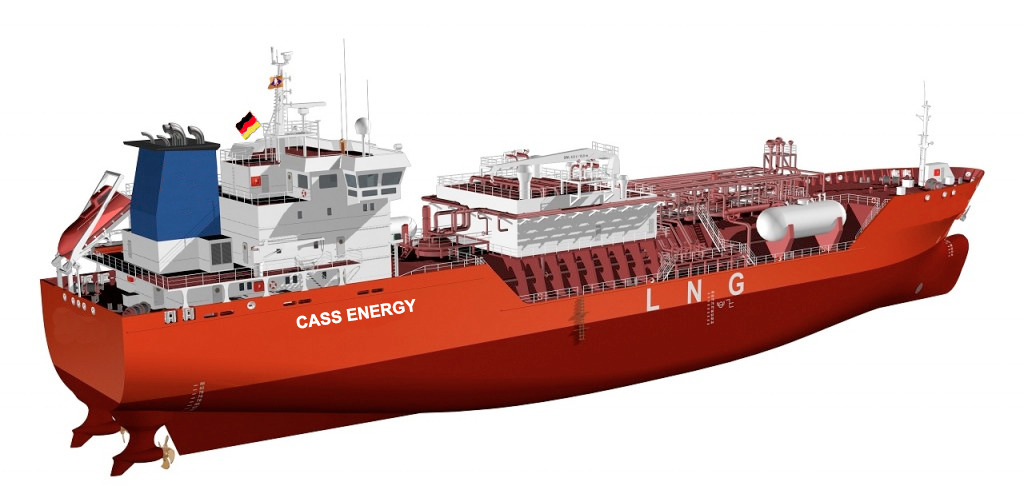
3. 7.500 cubic meter LNG fuelled Bunker Vessel
| Characteristics | Cargo Handling |
|
|
Figure 6: Vessel Description (Q88, 2018)
The 7,500 cbm LNG bunker vessel our company intends to invest in offers the most modern technological and characteristics in the world, enabling them to serve the customers need to work in two markets, namely bunkering operations as well as distributing LNG even to ports that are difficult to access. The vessel is able to break ice up to a thickness of 0,8m and will be able to perform ship-to-ship operations with all types of vessels. The dimensions also allow the vessel to operate in its most important trading hub, the Kiel Canal, as well as navigating mainly without the assistance of local pilots, enabling our contract partner to reduce voyage related expenses. As the vessel will mainly be working in the bunkering market, the vessel will be equipped with gas chromatograhs and a goriolis meters to ensure accurate measurements of LNG quality as well as quantity offering the end customers the most accurate service. Furthermore, the comparably high service speed combined with low bunker consumption adds value to the investments and through the re-liquefaction plant on board, cargo vapour losses are kept to a minimum.
The main fuel which will be used for both vessels will be LNG. This decision is based on several advantages provided by a dual heavy-duty fuel engine with LNG and marine diesel oil (MDO) both environmentally and financially. By liquefying the natural gas to -161 degrees, the volume of the natural gas shrinks by 600 times, which makes it convenient for shipping and bunkering purposes.
As far as fuel consumption is concerned, natural gas consumes approximately 13.5% less than marine diesel oil at the same power output. Furthermore, LNG is considered to be a more economic source of energy compared to commonly used ship fuels and LPG (Elghory & Seddiek, 2016). It is worth noting that a large amount of energy can be saved and generated during each voyage due to the LNG evaporation process. In addition, the overall efficiency of the LNG engine operation has been proven superior over the diesel engine due to the high degree of thermal and volumetric efficiency offering the customer a great possibility to safe costs significantly.
3.1. Insurance
Marine insurance is compulsory under the International Safety Management Code (ISM Code) and is a necessity for both vessels in order to maintain class and remain operative (IMO, n.d.). The company will purchase hull and machinery cover, protection and indemnity cover (P&I), war risk cover and loss of hire cover. These insurances will reduce the company’s risk and protect shareholders in case of unforeseen events.
Hull and machinery insurance will cover the company’s economic interest in the vessels and its equipment by covering damages and total losses (Warr, 2016). The loss of hire insurance will cover potential loss of income in the case of repairs caused by physical damage to the vessels e.g. TC hire payments will be paid to the charterer in cases where the vessel(s) is in a shipyard for repairs and is placed off-hire (Norwegian Hull Club , n.d.). The insurance against war perils covers total loss, damages, collision liability, loss of hire caused by war or war-like conditions (Norwegian Hull Club, n.d.). Finally, the P&I insurance protects the company from economic loss caused by third party risks, this could for instance be collision claims, property damage, pollution, environmental damage and removal of wrecks (Shipowners Club, 2017). The insurance policies will be renewed every year and the costs will be incorporated into the operating expenses.
4. Corporate Structure
The chosen ownership structure for the two acquisitions has been thoroughly evaluated to minimise the risk factors while maximising the profitability of the project. Cass Plc will establish Cass Schiffahrtsgesellschaft GmbH & Co. KG (Gesellschaft mit beschränkter Haftung) which translates to a limited liability company in Germany. The GmbH will be the general partner (shareholder) of each vessel’s Kommanditgesellschaft (KG). This single ship company structure means that the KG’s assets will be the ship registered in its name. For Cass Plc, this ensures limited liability in cases where there is a claim on one of the vessels. This can be claims such as failure to pay principal on loans, failure to pay crew wages or if the vessel fails to maintain class. In such cases, the vessel can be subject to arrest and the owning company must meet the claim. If the owner fails to do so, the claimant has the right to liquidate the asset to cover its financial loss. In cases where the defendant (owner) has several assets, such as sister ships, the claimant can claim in these assets as well. With the single ship company structure, the claimant is unable to do so. The general partner of a KG functions as a fully liable participant and is accountable for outside obligations of the KG in an unlimited manner to his own business assets (WWKN, 2017). As the GmbH & Co. KG covers this position through the GmbH, its liability is limited to its own business assets, which in our case is the relevant vessel.
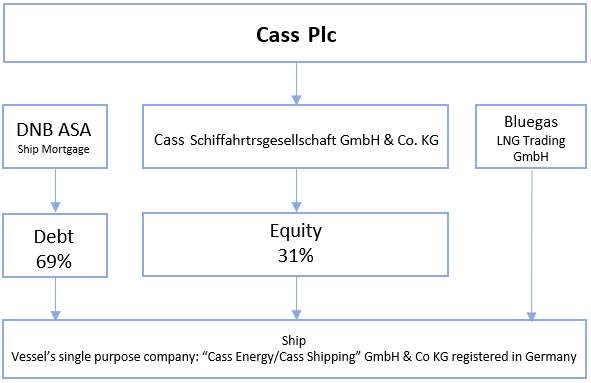
In a typical KG structure, as seen in figure 7 around 30% of the vessel are typically financed with equity, the remaining 70% is typically funded by compromising a secured bank loan with a mortgage in the financed vessel (Packard, 2015). The cash flows, which in Cass Plc’s case will be the time charter income, will be used to pay off the shareholders in respect of their interests and the bank by paying loan instalments and interest on the loan. During this repayment period the general partner will participate in the profits of the vessel through monthly payments and will share the profits accrued in a potential sale.
Because of the cabotage principle, which recognises that a country is entitled to restrict the activities of foreign vessels operating within its waters it has been decided that the vessels will fly a German flag as the vessels are likely to trade between German ports (Yee & Din, 2015). However, having a German flag still allows the owner to employ seafarers from low cost countries allowing the company to save costs as the seafarers will be paid according to their country’s wage conditions. The company will be subject to a number of fees related to the registration of the vessels under the German flag. These fees cover ship surveys, issuance of certificates and verifications of documents (Flagge, 2017). The total registration fees for the two vessels are estimated to be $20.047. The complete overview of the fees can be found in appendix TBN.
As Cass Plc has limited experience in the shipping industry and no experience in operating LNG carriers, it has been decided to outsource the management of the vessels for a management fee. This applies to the commercial management of the vessels, crewing and technical management of the vessels. In addition, the management company will deal with matters such as vessel accounting, new building supervision, insurance, dry docking, lay-up management and procurement services.
5. Capital Structure & Financing
Cass Schiffahrtsgesellschaft GmbH & Co. KG plans to invest in two bunkering vessels with a total cost of $80 million. The company’s policy regarding the capital structure consists of a mix of 30% coming from Cass Plc equity and 70% debt financing from DnB ASA Bank. Considering that the shipping industry is an intricate market, the mentioned above capital structure decision issuing debt is taken for two main reasons.
First of all, in shipping finance, debt is the main and traditional source of financing as it is regarded cheaper than equity. Furthermore, Cass Schiffahrtsgesellschaft GmbH & Co KG aims to create a strong banking relationship setting path for potential future need of expansion in in the shipping sector.
While being aware of the financial distress costs, we evaluate the cost of debt and equity as well as the overall riskiness of the project in order to verify our capital structure decision. The cost of debt (4.5%) consists of the 12-month LIBOR of 1.8% plus a spread of 2.7%. The cost of equity (6.3%) is calculated with the CAPM using the average beta of four comparable companies in the LNG sector and the risk-free rate (2.4%) which is equal to the 10-year US Treasury bill. As mentioned above, both vessels have secured a 15 year time charter contract with a reputable charterer which generate a stable cash flow and consequently the riskiness of the project is quite low.
| Discount rate | |
| Risk free rate | 2,5% |
| Market risk premium | 5,5% |
| Country risk premium (Germany) | 0,0% |
| Unlevered beta (comparables) | 0,68 |
| Unlevered cost of equity | 6,3% |
Considering the loan agreement, the two-vessel company are accumulated as a single-project and the repayment of any financial obligation is based on the cash flow of the project with no recourse to Cass Plc in the case of a default. This loan agreement will expedite the debt financing from the banking sector having a profile of 16 years, including 1 year pre-delivery and 15 years post-delivery.
Specifically, a mortgage on the vessel, duly registered in Germany, will be used as a collateral for the loan granted. Moreover, the agreement will take provision for a balloon repayment at the end of the operational life of the vessel reflectin the residual value of the vessel. This value will amount to $32 million or 25% of the initial investment, if we assume 25 years straight line depreciation.
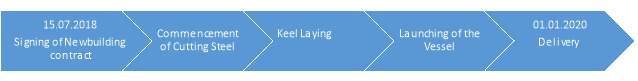 When the time charter expires, the company will sell the vessel on the second-hand market in order to repay the balloon and terminate the investment. Additionally, Cass Schiffahrtsgesellschaft GmbH & Co. KG will have a moratorium for the first year (time frame that the vessel will be in the shipyard) meaning, we will only pay interest for the loan granted. The payments on the yard will be in instalments during the period of the construction. Accordingly, the loan will be granted in stages from the signing of the shipbuilding contract to the delivery of the vessel constituted by five equal instalments:
5.1. Profitability Analysis
As we can be observed from the Income Statement, the project shows promising signs of financial efficiency. The Net Profit Margin throughout the years of employment has an average of 37%. A key reason contributing to the high profitability is the favourable tax environment that the company operates in thanks to tonnage tax which is substantially lower than corporate tax. From this ratio we can infer that the operating costs as well as the overall expenses are managed properly given the amount of charter revenue. The positive Net Margin means that the company has the advantage of retaining some of each earnings and possibly invest it into the business to generate more revenues in the future.
The Return on shareholders’ equity (ROE) of 18.8% on average indicates a considerable percentage of net income that equity holders obtain given their initial investment. We should note here that equity holders contribute by only 30,9% of the project’s cost, which means that the profit they realise is mainly “funded” by the debtholders.
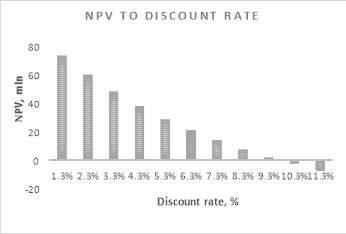
Under the present projections, with two-time charters earning each $18,000 per day, the Net Present Value would be $21,057,246 while the Internal Rate of Return would equal to 9.7%. Taking into consideration the project’s cost of capital (6.3%), which is less than the IRR, the project should be undertaken based on capital budgeting decision rules. Looking at the Payback period, the length of time required to recover the cost of the investment is approximately 8.8 years and discounted payback is 13 years.
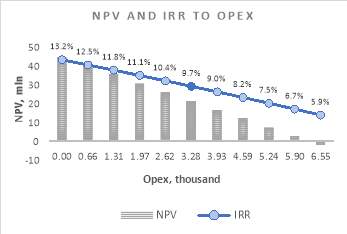
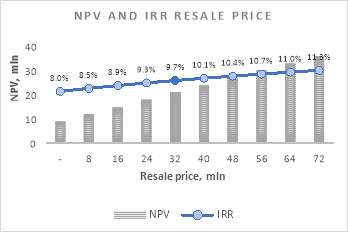
Finally, although our project is safeguarded by a stable time charter income and is therefore considered as riskless, we conducted a sensitivity analysis in order to keep track of the external changes in key variables (Appendix table?). The Net Present Value and the IRR of the project are relatively sensitive to the changes in operating expenses and the resale value of the vessels, but as the graphs present (Appendix figure?), they follow a steady trend.
5.1. Cash Flow & Profits – Pavel
5.2. P&L Statement – Pavel + TBA
6. Exit Strategy
By fixing a long-term contract, the charterer Blue Gas LNG is committed to fulfil the hire payment throughout the entire period. Considering the high number of assets and being recognised as a first class charterer our risk analysis has further shown, that there is almost no evidence for filing bankruptcy during the next 17 years. In the very unlikely case, that Blue Gas LNG is facing financial distress, we are confident to be able to renegotiate an alternative charter. This is underlined by the fact, that the time charter hire of $ 18,000 per day is about 5% less than current spot market earnings (see figure 1).
Furthermore, our company has successfully negotiated with the potential yard, that in the unforeseeable case of late delivery, the contract for both vessels can be terminated without penalty to either party.
7. SWOT Analysis
| Strength: | Weaknesses: |
|
as a more reliable method compared to LNG
|
| Opportunities: | Threats: |
|
|
Bibliography
Bank, F. R., 2018. [Online]
Available at: https://fred.stlouisfed.org/series/USD3MTD156N
BP, 2017. BP Energy Outlook 2017, London: BP.
Cadden, S., 2018. 2020 Sulphur Ca and LNG: A Step Change for LNG as a Marine Fuel, Oxford: LNG Journal.
Clarkson’s, 2018. Clarkson’s Intelligence Weekly, London: Clarkson’s.
Elghory, M. & Seddiek, I., 2016. Comparison between Natural Gas and Diesel Fuel Oil Onboard Gas Turbine Powered Ships, Jeddah: Marine Engineering Department.
Flagge, D., 2017. Deutsche Flagge. [Online]
Available at: https://www.deutsche-flagge.de/en/german-flag/changing-flag/subsidies-fees-1
[Accessed 12 March 2018].
German LNG, 2018. German LNG. [Online]
Available at: http://germanlng.com/company-profile/
IMO, n.d. International Safety Management Code. [Online]
Available at: http://www.imo.org/en/OurWork/HumanElement/SafetyManagement/Pages/ISMCode.aspx
[Accessed 18 March 2018].
LNG Bunkering, 2018. LNG Bunkering. [Online]
Available at: http://www.lngbunkering.org/lng/environment/benefits-of-LNG
[Accessed 20 March 2018].
Newland, D., 2016. Environmental Science. [Online]
Available at: https://www.environmentalscience.org/natural-gas
[Accessed 12 March 2018].
Norwegian Hull Club , n.d. Loss of Hire. [Online]
Available at: https://www.norclub.com/products/loss-of-hire/
[Accessed 18 March 2018].
Norwegian Hull Club, n.d. War. [Online]
Available at: https://www.norclub.com/products/war/
[Accessed 18 March 2018].
Packard, P., 2015. Shipping Finance, London: Institute of Chartered Shipbrokers.
Perez, E., 2018. Justifying Small LNG Shipping for Inter-Island Transportation and Distribution: Factors and Practical Allication for a Business Case, Blbao: s.n.
Shipowners Club, 2017. What is P&I?. [Online]
Available at: https://www.shipownersclub.com/what-is-pi/
[Accessed 18 March 2018].
Shipping Council, 2018. World Shipping. [Online]
Available at: http://www.worldshipping.org/industry-issues/environment/air-emissions/faqs-answers/a3-how-much-carbon-dioxide-does-the-international-shipping-industry-emit-per-year
Warr, C., 2016. Marine hull and machinery insurance. [Online]
Available at: http://www.cii.co.uk/knowledge/reference-resources/classes-of-insurance/marine-hull-and-machinery/
[Accessed 18 March 2018].
WWKN, 2017. WWKN. [Online]
Available at: https://wwkn.de/en/about-german-legal-forms/german-limited-partnership-gmbh-co-kg/
[Accessed 18 March 2018].
Yee, G. & Din, N., 2015. Cabotage and its Impact in Indonesia. [Online]
Available at: https://www.clydeco.com/insight/article/cabotage-and-its-impact-in-indonesia
[Accessed 17 March 2018].
| OPEX |
| Operational Expenses | 000’USD |
| Crew Wages | 732,00 |
| Provisions | 40,15 |
| Crew Other* | 20,00 |
| Crew Costs Total | 792,15 |
| Lubricants | 48,00 |
| Stores Other | 45,00 |
| Stores Total | 93,00 |
| Spares | 27,00 |
| Repairs & Maintenance | 18,00 |
| Repairs & Maintenance Total | 45,00 |
| P&I Insurance | 24,00 |
| Marine Insurance | 135,00 |
| Insurance Total | 159,00 |
| Classification fee | 3,00 |
| Flag | 4,09 |
| Sundries | 100,00 |
| Administration Total | 107,09 |
| Total Operating Costs | 1 196,24 |
| Daily Operating costs | 3,28 |
| Crew Wages 000’USD | month | year |
| Master | 15.00 | 180.00 |
| 2ND Officer | 5.00 | 60.00 |
| Chief Engineer | 13.50 | 162.00 |
| 3RD Engineer | 5.00 | 60.00 |
| GAS Engineer | 7.00 | 84.00 |
| Electrical Engineer | 7.00 | 84.00 |
| Bosun | 2.00 | 24.00 |
| AB | 1.40 | 16.80 |
| Fitter | 2.00 | 24.00 |
| Chief cook | 2.00 | 24.00 |
| Messman | 1.10 | 13.20 |
| Total | 61.00 | 732.00 |
Source: Shipping Company
Sensitivity analysis
| FLAG FEES & TONNAGE TAX
|
A German shipping company may choose between the tax system and tonnage tax system. The German tonnage tax regime provides a low affective tax rate on income of qualifying shipping companies.
Tonnage tax is not a tax but rather a method for determining taxable income. By this, the taxable income is calculated as a lump-sum amount depending on the size (net tonnage) of the ship, independent of the actual earnings (profit or loss). Normally, the taxable income as calculated by this method is considerably lower than the actual profit.
The decision to determine the taxable income according to the tonnage tax is binding for a period of ten years, any earlier change of method is not possible.
Source:https://eclass.unipi.gr/modules/document/file.php/NAS225/Shipping%2520Tax%2520Overviews%2520Brochure_Feb06.pdf
Appendix
| Assumptions | |||||||||||||||||||||||||
| 000’USD | units | Base | Jul.18 | Aug.18 | Sep.18 | Oct.18 | Nov.18 | Dec.18 | 2018 | 2019 | 2020 | 2021 | 2022 | 2023 | 2024 | 2025 | 2026 | 2027 | 2028 | 2029 | 2030 | 2031 | 2032 | 2033 | 2034 |
| Mactro | |||||||||||||||||||||||||
| Tonnage tax | $/year | 8,16 | 8,16 | 8,16 | 8,16 | 8,16 | 8,16 | 8,16 | 8,16 | 8,16 | 8,16 | 8,16 | 8,16 | 8,16 | 8,16 | 8,16 | 8,16 | ||||||||
| Inflation rate | % | 1,5% | 1,5% | 1,5% | 1,5% | 1,5% | 1,5% | 1,5% | 1,5% | 1,5% | 1,5% | 1,5% | 1,5% | 1,5% | 1,5% | 1,5% | 1,5% | 1,5% | 1,5% | ||||||
| Interest rate | % | 4,5% | 4,5% | 4,5% | 4,5% | 4,5% | 4,5% | 4,5% | 4,5% | 4,5% | 4,5% | 4,5% | 4,5% | 4,5% | 4,5% | 4,5% | 4,5% | 4,5% | 4,5% | ||||||
| LIBOR | % | 1,8% | 1,8% | 1,8% | 1,8% | 1,8% | 1,8% | 1,8% | 1,8% | 1,8% | 1,8% | 1,8% | 1,8% | 1,8% | 1,8% | 1,8% | 1,8% | 1,8% | 1,8% | ||||||
| Revenue | |||||||||||||||||||||||||
| T/C rate vessel 1 | $/day | 18,00 | 18,00 | 18,00 | 18,00 | 18,00 | 18,00 | 18,00 | 18,00 | 18,00 | 18,00 | 18,00 | 18,00 | 18,00 | 18,00 | 18,00 | 18,00 | ||||||||
| T/C rate vessel 2 | $/day | 18,00 | 18,00 | 18,00 | 18,00 | 18,00 | 18,00 | 18,00 | 18,00 | 18,00 | 18,00 | 18,00 | 18,00 | 18,00 | 18,00 | 18,00 | 18,00 | ||||||||
| Maintenance days | days/year | 9 | 9 | 9 | 9 | 9 | 13 | 13 | 13 | 13 | 13 | 16 | 16 | 16 | 16 | 16 | |||||||||
| Charter days | days/year | 365 | 356 | 356 | 356 | 356 | 356 | 352 | 352 | 352 | 352 | 352 | 349 | 349 | 349 | 349 | 349 | ||||||||
| Opex | |||||||||||||||||||||||||
| Daily opex ship 1 | $/day | 3,28 | 3,28 | 3,33 | 3,37 | 3,42 | 3,47 | 3,52 | 3,57 | 3,63 | 3,68 | 3,73 | 3,79 | 3,84 | 3,90 | 3,95 | 4,01 | ||||||||
| Daily opex ship 2 | $/day | 3,28 | 3,28 | 3,33 | 3,37 | 3,42 | 3,47 | 3,52 | 3,57 | 3,63 | 3,68 | 3,73 | 3,79 | 3,84 | 3,90 | 3,95 | 4,01 | ||||||||
| Operating days | days/year | 365 | 365 | 365 | 365 | 365 | 365 | 365 | 365 | 365 | 365 | 365 | 365 | 365 | 365 | 365 | 365 | ||||||||
| Expenses (2 vessels) | |||||||||||||||||||||||||
| Special survey | $ | 1 800 | 1 800 | 1 800 | |||||||||||||||||||||
| Broker commission | % | 1,0% | 128,16 | 128,16 | 128,16 | 128,16 | 128,16 | 126,72 | 126,72 | 126,72 | 126,72 | 126,72 | 125,64 | 125,64 | 125,64 | 125,64 | 125,64 | ||||||||
| Representative fees | $/day | 0,35 | 0,35 | 0,35 | 0,35 | 0,35 | 0,35 | 0,35 | 0,35 | 0,35 | 0,35 | 0,35 | |||||||||||||
| Representative service | days | 31 | 31 | 30 | 31 | 30 | 31 | 184 | 365 | 9 | 13 | ||||||||||||||
| Representative costs | $ | 21,70 | 21,70 | 21,00 | 21,70 | 21,00 | 21,70 | 128,80 | 255,50 | 6,30 | 9,10 | ||||||||||||||
| Flag registration fees | $ | 20,05 | 20,05 | ||||||||||||||||||||||
| Management fees | $/year | 150,00 | 150,00 | 152,18 | 154,39 | 156,64 | 158,91 | 161,22 | 163,56 | 165,94 | 168,35 | 170,80 | 173,28 | 175,80 | 178,36 | 180,95 | 183,58 | ||||||||
| Debt | |||||||||||||||||||||||||
| Loan repayable over years | years | 15 | |||||||||||||||||||||||
| Balloon payment | % | 25% | 25% | ||||||||||||||||||||||
| Capex | |||||||||||||||||||||||||
| Depreciation rate | years | 25 | 4,0% | 4,0% | 4,0% | 4,0% | 4,0% | 4,0% | 4,0% | 4,0% | 4,0% | 4,0% | 4,0% | 4,0% | 4,0% | 4,0% | 4,0% | ||||||||
| Payed over instalments: | %/period | 5 | 20% | 20% | 40% | 40% | 20% |
| Income Statement | |||||||||||||||||||||||
| 000’USD | Jul.18 | Aug.18 | Sep.18 | Oct.18 | Nov.18 | Dec.18 | 2018 | 2019 | 2020 | 2021 | 2022 | 2023 | 2024 | 2025 | 2026 | 2027 | 2028 | 2029 | 2030 | 2031 | 2032 | 2033 | 2034 |
| Revenue | – | – | – | – | – | – | – | – | 12 816,0 | 12 816,0 | 12 816,0 | 12 816,0 | 12 816,0 | 12 672,0 | 12 672,0 | 12 672,0 | 12 672,0 | 12 672,0 | 12 564,0 | 12 564,0 | 12 564,0 | 12 564,0 | 12 564,0 |
| Operating costs | – | – | – | – | – | – | – | – | (2 392,5) | (2 427,3) | (2 462,5) | (2 498,3) | (2 534,6) | (2 571,5) | (2 608,8) | (2 646,7) | (2 685,2) | (2 724,2) | (2 763,8) | (2 804,0) | (2 844,8) | (2 886,1) | (2 928,0) |
| Gross Profit | – | – | – | – | – | – | – | – | 10 423,5 | 10 388,7 | 10 353,5 | 10 317,7 | 10 281,4 | 10 100,5 | 10 063,2 | 10 025,3 | 9 986,8 | 9 947,8 | 9 800,2 | 9 760,0 | 9 719,2 | 9 677,9 | 9 636,0 |
| Drydock costs | – | – | – | – | – | – | – | – | – | – | – | – | (1 800,0) | – | – | – | – | (1 800,0) | – | – | – | – | – |
| Registration fees | – | – | – | – | – | – | – | (20,0) | – | – | – | – | – | – | – | – | – | – | – | – | – | – | – |
| Shipbroker commission | – | – | (128,2) | (128,2) | (128,2) | (128,2) | (128,2) | (126,7) | (126,7) | (126,7) | (126,7) | (126,7) | (125,6) | (125,6) | (125,6) | (125,6) | (125,6) | ||||||
| Representative costs | (21,7) | (21,7) | (21,0) | (21,7) | (21,0) | (21,7) | (128,8) | (255,5) | – | – | – | – | (6,3) | – | – | – | – | (9,1) | – | – | – | – | – |
| Management fees | – | – | – | – | – | – | – | – | (150,0) | (152,2) | (154,4) | (156,6) | (158,9) | (161,2) | (163,6) | (165,9) | (168,4) | (170,8) | (173,3) | (175,8) | (178,4) | (180,9) | (183,6) |
| Expenses | (21,7) | (21,7) | (21,0) | (21,7) | (21,0) | (21,7) | (128,8) | (275,5) | (278,2) | (280,3) | (282,6) | (284,8) | (2 093,4) | (287,9) | (290,3) | (292,7) | (295,1) | (2 106,6) | (298,9) | (301,4) | (304,0) | (306,6) | (309,2) |
| EBITDA | (21,7) | (21,7) | (21,0) | (21,7) | (21,0) | (21,7) | (128,8) | (275,5) | 10 145,4 | 10 108,4 | 10 070,9 | 10 032,9 | 8 188,0 | 9 812,6 | 9 772,9 | 9 732,6 | 9 691,7 | 7 841,1 | 9 501,2 | 9 458,6 | 9 415,3 | 9 371,3 | 9 326,7 |
| Depreciation | – | – | – | – | – | – | – | – | (3 200,0) | (3 200,0) | (3 200,0) | (3 200,0) | (3 200,0) | (3 200,0) | (3 200,0) | (3 200,0) | (3 200,0) | (3 200,0) | (3 200,0) | (3 200,0) | (3 200,0) | (3 200,0) | (3 200,0) |
| EBIT | (21,7) | (21,7) | (21,0) | (21,7) | (21,0) | (21,7) | (128,8) | (275,5) | 6 945,4 | 6 908,4 | 6 870,9 | 6 832,9 | 4 988,0 | 6 612,6 | 6 572,9 | 6 532,6 | 6 491,7 | 4 641,1 | 6 301,2 | 6 258,6 | 6 215,3 | 6 171,3 | 6 126,7 |
| Interest expenses | – | – | – | – | – | – | – | (360,0) | (1 800,0) | (2 394,0) | (2 268,0) | (2 142,0) | (2 016,0) | (1 890,0) | (1 764,0) | (1 638,0) | (1 512,0) | (1 386,0) | (1 260,0) | (1 134,0) | (1 008,0) | (882,0) | (756,0) |
| EBT | (21,7) | (21,7) | (21,0) | (21,7) | (21,0) | (21,7) | (128,8) | (635,5) | 5 145,4 | 4 514,4 | 4 602,9 | 4 690,9 | 2 972,0 | 4 722,6 | 4 808,9 | 4 894,6 | 4 979,7 | 3 255,1 | 5 041,2 | 5 124,6 | 5 207,3 | 5 289,3 | 5 370,7 |
| Income Tax | – | – | – | – | – | – | – | – | (8,2) | (8,2) | (8,2) | (8,2) | (8,2) | (8,2) | (8,2) | (8,2) | (8,2) | (8,2) | (8,2) | (8,2) | (8,2) | (8,2) | (8,2) |
| Net Income | (21,7) | (21,7) | (21,0) | (21,7) | (21,0) | (21,7) | (128,8) | (635,5) | 5 137,2 | 4 506,3 | 4 594,8 | 4 682,7 | 2 963,8 | 4 714,4 | 4 800,7 | 4 886,4 | 4 971,6 | 3 247,0 | 5 033,1 | 5 116,4 | 5 199,1 | 5 281,2 | 5 362,6 |
| Income Statement | |||||||||||||||||||||||
| 000’USD | Jul.18 | Aug.18 | Sep.18 | Oct.18 | Nov.18 | Dec.18 | 2018 | 2019 | 2020 | 2021 | 2022 | 2023 | 2024 | 2025 | 2026 | 2027 | 2028 | 2029 | 2030 | 2031 | 2032 | 2033 | 2034 |
| Revenue | – | – | – | – | – | – | – | – | 12 816 | 12 816 | 12 816 | 12 816 | 12 816 | 12 672 | 12 672 | 12 672 | 12 672 | 12 672 | 12 564 | 12 564 | 12 564 | 12 564 | 12 564 |
| Operating costs | – | – | – | – | – | – | – | – | (2 392) | (2 427) | (2 463) | (2 498) | (2 535) | (2 571) | (2 609) | (2 647) | (2 685) | (2 724) | (2 764) | (2 804) | (2 845) | (2 886) | (2 928) |
| Gross Profit | – | – | – | – | – | – | – | – | 10 424 | 10 389 | 10 353 | 10 318 | 10 281 | 10 101 | 10 063 | 10 025 | 9 987 | 9 948 | 9 800 | 9 760 | 9 719 | 9 678 | 9 636 |
| Drydock costs | – | – | – | – | – | – | – | – | – | – | – | – | (1 800) | – | – | – | – | (1 800) | – | – | – | – | – |
| Registration fees | – | – | – | – | – | – | – | (20) | – | – | – | – | – | – | – | – | – | – | – | – | – | – | – |
| Shipbroker commission | – | – | (128) | (128) | (128) | (128) | (128) | (127) | (127) | (127) | (127) | (127) | (126) | (126) | (126) | (126) | (126) | ||||||
| Representative costs | (22) | (22) | (21) | (22) | (21) | (22) | (129) | (256) | – | – | – | – | (6) | – | – | – | – | (9) | – | – | – | – | – |
| Management fees | – | – | – | – | – | – | – | – | (150) | (152) | (154) | (157) | (159) | (161) | (164) | (166) | (168) | (171) | (173) | (176) | (178) | (181) | (184) |
| Expenses | (22) | (22) | (21) | (22) | (21) | (22) | (129) | (276) | (278) | (280) | (283) | (285) | (2 093) | (288) | (290) | (293) | (295) | (2 107) | (299) | (301) | (304) | (307) | (309) |
| EBITDA | (22) | (22) | (21) | (22) | (21) | (22) | (129) | (276) | 10 145 | 10 108 | 10 071 | 10 033 | 8 188 | 9 813 | 9 773 | 9 733 | 9 692 | 7 841 | 9 501 | 9 459 | 9 415 | 9 371 | 9 327 |
| Depreciation | – | – | – | – | – | – | – | – | (3 200) | (3 200) | (3 200) | (3 200) | (3 200) | (3 200) | (3 200) | (3 200) | (3 200) | (3 200) | (3 200) | (3 200) | (3 200) | (3 200) | (3 200) |
| EBIT | (22) | (22) | (21) | (22) | (21) | (22) | (129) | (276) | 6 945 | 6 908 | 6 871 | 6 833 | 4 988 | 6 613 | 6 573 | 6 533 | 6 492 | 4 641 | 6 301 | 6 259 | 6 215 | 6 171 | 6 127 |
| Interest expenses | – | – | – | – | – | – | – | (360) | (1 800) | (2 394) | (2 268) | (2 142) | (2 016) | (1 890) | (1 764) | (1 638) | (1 512) | (1 386) | (1 260) | (1 134) | (1 008) | (882) | (756) |
| EBT | (22) | (22) | (21) | (22) | (21) | (22) | (129) | (636) | 5 145 | 4 514 | 4 603 | 4 691 | 2 972 | 4 723 | 4 809 | 4 895 | 4 980 | 3 255 | 5 041 | 5 125 | 5 207 | 5 289 | 5 371 |
| Tonnage tax | – | – | – | – | – | – | – | – | (8) | (8) | (8) | (8) | (8) | (8) | (8) | (8) | (8) | (8) | (8) | (8) | (8) | (8) | (8) |
| Net Income | (22) | (22) | (21) | (22) | (21) | (22) | (129) | (636) | 5 137 | 4 506 | 4 595 | 4 683 | 2 964 | 4 714 | 4 801 | 4 886 | 4 972 | 3 247 | 5 033 | 5 116 | 5 199 | 5 281 | 5 363 |
| Retained profit | Jul.18 | Aug.18 | Sep.18 | Oct.18 | Nov.18 | Dec.18 | 2018 | 2019 | 2020 | 2021 | 2022 | 2023 | 2024 | 2025 | 2026 | 2027 | 2028 | 2029 | 2030 | 2031 | 2032 | 2033 | 2034 |
| Opening balance | – | (129) | (764) | 4 373 | 8 879 | 13 474 | 18 157 | 21 120 | 25 835 | 30 636 | 35 522 | 40 494 | 43 741 | 48 774 | 53 890 | 59 089 | 64 370 | ||||||
| Net Profit | (129) | (636) | 5 137 | 4 506 | 4 595 | 4 683 | 2 964 | 4 714 | 4 801 | 4 886 | 4 972 | 3 247 | 5 033 | 5 116 | 5 199 | 5 281 | 5 363 | ||||||
| Dividends | – | – | – | – | – | – | – | – | – | – | – | – | – | – | – | – | – | ||||||
| Closing balance | (129) | (764) | 4 373 | 8 879 | 13 474 | 18 157 | 21 120 | 25 835 | 30 636 | 35 522 | 40 494 | 43 741 | 48 774 | 53 890 | 59 089 | 64 370 | 69 733 |
| Statement of Financial Position | |||||||||||||||||
| 000’USD | 2018(6m) | 2019 | 2020 | 2021 | 2022 | 2023 | 2024 | 2025 | 2026 | 2027 | 2028 | 2029 | 2030 | 2031 | 2032 | 2033 | 2034 |
| Non-Current Assets | 32 000 | 64 000 | 76 800 | 73 600 | 70 400 | 67 200 | 64 000 | 60 800 | 57 600 | 54 400 | 51 200 | 48 000 | 44 800 | 41 600 | 38 400 | 35 200 | – |
| Net book value of vessels | – | – | 76 800 | 73 600 | 70 400 | 67 200 | 64 000 | 60 800 | 57 600 | 54 400 | 51 200 | 48 000 | 44 800 | 41 600 | 38 400 | 35 200 | – |
| Advances for vessels under construction | 32 000 | 64 000 | – | – | – | – | – | – | – | – | – | – | – | – | – | – | |
| Current Assets | 871 | 236 | 6 073 | 10 980 | 15 974 | 21 057 | 24 421 | 29 532 | 34 733 | 40 019 | 45 391 | 49 038 | 54 468 | 59 985 | 65 584 | 71 265 | 95 028 |
| Current operation assets | – | – | 448 | 448 | 448 | 448 | 448 | 443 | 443 | 443 | 443 | 443 | 439 | 439 | 439 | 439 | 439 |
| Inventories | – | – | – | – | – | – | – | – | – | – | – | – | – | – | – | – | – |
| Receivables | – | – | 448 | 448 | 448 | 448 | 448 | 443 | 443 | 443 | 443 | 443 | 439 | 439 | 439 | 439 | 439 |
| Cash and Cash Equivalents | 871 | 236 | 5 626 | 10 532 | 15 527 | 20 610 | 23 973 | 29 089 | 34 290 | 39 577 | 44 948 | 48 595 | 54 029 | 59 546 | 65 145 | 70 826 | 94 589 |
| Total Assets | 32 871 | 64 236 | 82 873 | 84 580 | 86 374 | 88 257 | 88 421 | 90 332 | 92 333 | 94 419 | 96 591 | 97 038 | 99 268 | 101 585 | 103 984 | 106 465 | 95 028 |
| Total Equity | 24 871 | 24 236 | 29 373 | 33 879 | 38 474 | 43 157 | 46 120 | 50 835 | 55 636 | 60 522 | 65 494 | 68 741 | 73 774 | 78 890 | 84 089 | 89 370 | 94 733 |
| Equity | 25 000 | 25 000 | 25 000 | 25 000 | 25 000 | 25 000 | 25 000 | 25 000 | 25 000 | 25 000 | 25 000 | 25 000 | 25 000 | 25 000 | 25 000 | 25 000 | 25 000 |
| Retained earning | (129) | (764) | 4 373 | 8 879 | 13 474 | 18 157 | 21 120 | 25 835 | 30 636 | 35 522 | 40 494 | 43 741 | 48 774 | 53 890 | 59 089 | 64 370 | 69 733 |
| Long-Term Liabilities | 8 000 | 40 000 | 53 200 | 50 400 | 47 600 | 44 800 | 42 000 | 39 200 | 36 400 | 33 600 | 30 800 | 28 000 | 25 200 | 22 400 | 19 600 | 16 800 | – |
| Long-Term Loans | 8 000 | 40 000 | 53 200 | 50 400 | 47 600 | 44 800 | 42 000 | 39 200 | 36 400 | 33 600 | 30 800 | 28 000 | 25 200 | 22 400 | 19 600 | 16 800 | – |
| Current Liabilities | – | – | 301 | 301 | 301 | 301 | 301 | 297 | 297 | 297 | 297 | 297 | 295 | 295 | 295 | 295 | 295 |
| Short-Term Loans | – | – | – | – | – | – | – | – | – | – | – | – | – | – | – | – | – |
| Payables | – | – | 301 | 301 | 301 | 301 | 301 | 297 | 297 | 297 | 297 | 297 | 295 | 295 | 295 | 295 | 295 |
| Equity and liabilities | 32 871 | 64 236 | 82 873 | 84 580 | 86 374 | 88 257 | 88 421 | 90 332 | 92 333 | 94 419 | 96 591 | 97 038 | 99 268 | 101 585 | 103 984 | 106 465 | 95 028 |
| Cash Flow Statement | |||||||||||||||||||||||
| 000’USD | Jul.18 | Aug.18 | Sep.18 | Oct.18 | Nov.18 | Dec.18 | 2018 | 2019 | 2020 | 2021 | 2022 | 2023 | 2024 | 2025 | 2026 | 2027 | 2028 | 2029 | 2030 | 2031 | 2032 | 2033 | 2034 |
| Net Income | (22) | (22) | (21) | (22) | (21) | (22) | (129) | (636) | 5 137 | 4 506 | 4 595 | 4 683 | 2 964 | 4 714 | 4 801 | 4 886 | 4 972 | 3 247 | 5 033 | 5 116 | 5 199 | 5 281 | 5 363 |
| Adjustments | – | – | – | – | – | – | – | – | 3 053 | 3 200 | 3 200 | 3 200 | 3 200 | 3 202 | 3 200 | 3 200 | 3 200 | 3 200 | 3 201 | 3 200 | 3 200 | 3 200 | 3 200 |
| Depreciation | – | – | – | – | – | – | – | – | 3 200 | 3 200 | 3 200 | 3 200 | 3 200 | 3 200 | 3 200 | 3 200 | 3 200 | 3 200 | 3 200 | 3 200 | 3 200 | 3 200 | 3 200 |
| Changes in net working capital | – | – | – | – | – | – | – | – | (147) | – | – | – | – | 2 | – | – | – | – | 1 | – | – | – | – |
| Cash from operating activity | (22) | (22) | (21) | (22) | (21) | (22) | (129) | (636) | 8 190 | 7 706 | 7 795 | 7 883 | 6 164 | 7 916 | 8 001 | 8 086 | 8 172 | 6 447 | 8 234 | 8 316 | 8 399 | 8 481 | 8 563 |
| Capital expenditure | (16 000) | – | – | – | – | (16 000) | (32 000) | (32 000) | (16 000) | – | – | – | – | – | – | – | – | – | – | – | – | – | – |
| Proceeds from sale of equipment | 32 000 | ||||||||||||||||||||||
| Cash from investment activity | (16 000) | – | – | – | – | (16 000) | (32 000) | (32 000) | (16 000) | – | – | – | – | – | – | – | – | – | – | – | – | – | 32 000 |
| Proceeds from equity | 25 000 | 25 000 | |||||||||||||||||||||
| Changes in LT liabilities | – | – | – | – | – | 8 000 | 8 000 | 32 000 | 13 200 | (2 800) | (2 800) | (2 800) | (2 800) | (2 800) | (2 800) | (2 800) | (2 800) | (2 800) | (2 800) | (2 800) | (2 800) | (2 800) | (16 800) |
| Dividends paid | – | – | – | – | – | – | – | – | – | – | – | – | – | – | – | – | – | – | – | – | – | – | – |
| Cash from financial activity | 25 000 | – | – | – | – | 8 000 | 33 000 | 32 000 | 13 200 | (2 800) | (2 800) | (2 800) | (2 800) | (2 800) | (2 800) | (2 800) | (2 800) | (2 800) | (2 800) | (2 800) | (2 800) | (2 800) | (16 800) |
| Net Cash Flow | 8 978 | (22) | (21) | (22) | (21) | (8 022) | 871 | (636) | 5 390 | 4 906 | 4 995 | 5 083 | 3 364 | 5 116 | 5 201 | 5 286 | 5 372 | 3 647 | 5 434 | 5 516 | 5 599 | 5 681 | 23 763 |
| Opening balance | – | 8 978 | 8 957 | 8 936 | 8 914 | 8 893 | – | 871 | 236 | 5 626 | 10 532 | 15 527 | 20 610 | 23 973 | 29 089 | 34 290 | 39 577 | 44 948 | 48 595 | 54 029 | 59 546 | 65 145 | 70 826 |
| Closing balance | 8 978 | 8 957 | 8 936 | 8 914 | 8 893 | 871 | 871 | 236 | 5 626 | 10 532 | 15 527 | 20 610 | 23 973 | 29 089 | 34 290 | 39 577 | 44 948 | 48 595 | 54 029 | 59 546 | 65 145 | 70 826 | 94 589 |
| Free Cash Flow | |||||||||||||||||
| 000’USD | 2018(6m) | 2019 | 2020 | 2021 | 2022 | 2023 | 2024 | 2025 | 2026 | 2027 | 2028 | 2029 | 2030 | 2031 | 2032 | 2033 | 2034 |
| EBIT | (128,8) | (275,5) | 6 945,4 | 6 908,4 | 6 870,9 | 6 832,9 | 4 988,0 | 6 612,6 | 6 572,9 | 6 532,6 | 6 491,7 | 4 641,1 | 6 301,2 | 6 258,6 | 6 215,3 | 6 171,3 | 6 126,7 |
| Tonnage tax | – | – | (8,2) | (8,2) | (8,2) | (8,2) | (8,2) | (8,2) | (8,2) | (8,2) | (8,2) | (8,2) | (8,2) | (8,2) | (8,2) | (8,2) | (8,2) |
| Depreciation | – | – | 3 200,0 | 3 200,0 | 3 200,0 | 3 200,0 | 3 200,0 | 3 200,0 | 3 200,0 | 3 200,0 | 3 200,0 | 3 200,0 | 3 200,0 | 3 200,0 | 3 200,0 | 3 200,0 | 3 200,0 |
| Changes in net working capital | – | (147,1) | – | – | – | – | 1,7 | – | – | – | – | 1,2 | – | – | – | – | 144,2 |
| Capital expenditures | (32 000,0) | (32 000,0) | (16 000,0) | – | – | – | – | – | – | – | – | – | – | – | – | – | 32 000,0 |
| Unlevered Free Cash Flow | (32 128,8) | (32 422,6) | (5 862,8) | 10 100,3 | 10 062,8 | 10 024,7 | 8 181,5 | 9 804,4 | 9 764,7 | 9 724,4 | 9 683,6 | 7 834,2 | 9 493,1 | 9 450,4 | 9 407,1 | 9 363,2 | 41 462,8 |
| Discount rate | 6,3% | 6,3% | 6,3% | 6,3% | 6,3% | 6,3% | 6,3% | 6,3% | 6,3% | 6,3% | 6,3% | 6,3% | 6,3% | 6,3% | 6,3% | 6,3% | 6,3% |
| Discounted Free cash flow | (32 128,8) | (30 505,0) | (5 189,8) | 8 412,0 | 7 885,1 | 7 390,7 | 5 675,0 | 6 398,5 | 5 995,7 | 5 617,8 | 5 263,3 | 4 006,3 | 4 567,5 | 4 278,0 | 4 006,6 | 3 752,0 | 15 632,2 |
| NPV of the Project | 21 057,2 | ||||||||||||||||
| IRR | 9,7% | ||||||||||||||||
| Payback period | 8,8 | ||||||||||||||||
| Discounted payback period | 13,1 |
| Debt | |||||||||||||||||||||||
| 000’USD | Jul.18 | Aug.18 | Sep.18 | Oct.18 | Nov.18 | Dec.18 | 2018 | 2019 | 2020 | 2021 | 2022 | 2023 | 2024 | 2025 | 2026 | 2027 | 2028 | 2029 | 2030 | 2031 | 2032 | 2033 | 2034 |
| Long term liabilities opening balance | – | – | – | – | – | – | 8 000 | 8 000 | 40 000 | 53 200 | 50 400 | 47 600 | 44 800 | 42 000 | 39 200 | 36 400 | 33 600 | 30 800 | 28 000 | 25 200 | 22 400 | 19 600 | 16 800 |
| Financing $ | 8 000 | 8 000 | 32 000 | 16 000 | |||||||||||||||||||
| Principle repayment $ p.a. | (2 800) | (2 800) | (2 800) | (2 800) | (2 800) | (2 800) | (2 800) | (2 800) | (2 800) | (2 800) | (2 800) | (2 800) | (2 800) | (2 800) | (2 800) | ||||||||
| Interest rate | 4,5% | 4,5% | 4,5% | 4,5% | 4,5% | 4,5% | 4,5% | 4,5% | 4,5% | 4,5% | 4,5% | 4,5% | 4,5% | 4,5% | 4,5% | 4,5% | 4,5% | ||||||
| Interest $ p.a. | 360 | 1 800 | 2 394 | 2 268 | 2 142 | 2 016 | 1 890 | 1 764 | 1 638 | 1 512 | 1 386 | 1 260 | 1 134 | 1 008 | 882 | 756 | |||||||
| Balloon payment | (14 000) | ||||||||||||||||||||||
| Loan outstanding | 8 000 | 40 000 | 53 200 | 50 400 | 47 600 | 44 800 | 42 000 | 39 200 | 36 400 | 33 600 | 30 800 | 28 000 | 25 200 | 22 400 | 19 600 | 16 800 | – | ||||||
| Changes in liabilities | 8 000 | 8 000 | 32 000 | 13 200 | (2 800) | (2 800) | (2 800) | (2 800) | (2 800) | (2 800) | (2 800) | (2 800) | (2 800) | (2 800) | (2 800) | (2 800) | (2 800) | (16 800) | |||||
| Long term liabilities closing balance | 8 000 | 8 000 | 40 000 | 53 200 | 50 400 | 47 600 | 44 800 | 42 000 | 39 200 | 36 400 | 33 600 | 30 800 | 28 000 | 25 200 | 22 400 | 19 600 | 16 800 | – |
| Capital expenditure | |||||||||||||||||||||||
| 000’USD | Jul.18 | Aug.18 | Sep.18 | Oct.18 | Nov.18 | Dec.18 | 2018 | 2019 | 2020 | 2021 | 2022 | 2023 | 2024 | 2025 | 2026 | 2027 | 2028 | 2029 | 2030 | 2031 | 2032 | 2033 | 2034 |
| Expenditure | 16 000 | – | – | – | – | 16 000 | 32 000 | 32 000 | 16 000 | – | – | – | – | – | – | – | – | – | – | – | – | – | – |
| Additions | 16 000 | – | – | – | – | 16 000 | 32 000 | 32 000 | 16 000 | – | – | – | – | – | – | – | – | – | – | – | – | – | – |
| PPE accumulated value | 32 000 | 64 000 | 80 000 | ||||||||||||||||||||
| Vessels book value | 80 000 | 76 800 | 73 600 | 70 400 | 67 200 | 64 000 | 60 800 | 57 600 | 54 400 | 51 200 | 48 000 | 44 800 | 41 600 | 38 400 | 35 200 | ||||||||
| Depreciation rate | 4,0% | 4,0% | 4,0% | 4,0% | 4,0% | 4,0% | 4,0% | 4,0% | 4,0% | 4,0% | 4,0% | 4,0% | 4,0% | 4,0% | 4,0% | ||||||||
| Depreciation | 3 200 | 3 200 | 3 200 | 3 200 | 3 200 | 3 200 | 3 200 | 3 200 | 3 200 | 3 200 | 3 200 | 3 200 | 3 200 | 3 200 | 3 200 | ||||||||
| Residual Value | 76 800 | 73 600 | 70 400 | 67 200 | 64 000 | 60 800 | 57 600 | 54 400 | 51 200 | 48 000 | 44 800 | 41 600 | 38 400 | 35 200 | 32 000 | ||||||||
| Comparables | ||||||
| Name | Description | Equity beta | Debt/Equity | Tax rate | Unlevered beta | |
| AWILCO LNG/d | The Company is involved in the transport of liquefied natural gas (LNG), between LNG production plants and LNG regasification plants, where LNG is transferred to power plants. | 2,07 | 1,81 | 26% | 0,88 | |
| DYNAGAS LNG PA/d | The company focused on owning and operating LNG carriers that are employed on multi-year contracts with international energy companies, providing us with the benefits of stable cash flows and high utilization rates. | 1,40 | 1,74 | 0% | 0,51 | |
| GASLOG PRTNR U/d | The Company focuses on owning, operating and acquiring liquefied natural gas (LNG) carriers under multi-year charters. The Company’s fleet consists of 9 LNG carriers , each of which has a multi-year time charter. | 1,40 | 1,03 | 0% | 0,69 | |
| GASLOG LTD/d | The company is an international owner, operator and manager of LNG carriers. The Company’s owned fleet includes approximately 20 LNG carriers, including 10 ships in operation and five LNG carriers on order. | 1,56 | 1,49 | 0% | 0,63 | |
| Average | 1,61 | 0,68 | ||||
Appendix 1
LADIES AND GENTLEMEN,
AS PER TELCON, WE ARE PLEASED TO CONFIRM HAVING FIXED ON SUBS FOLLOWING TIMECHARTER AGREEMENT BETWEEN NAUTICOR GMBH & CO KG (HEREINAFTER CALLED CHARTERTERS) AND CASS SCHIFFAHRTRSGESELLSCHAFT GMBH & CO KG (HEREINAFTER CALLED OWNERS).
*********************************
STRICTLY PRIVATE AND CONFIDENTIAL
*********************************
SUBJECTS: THIS FIXTURE IS SUBJECT TO OWNERS BOD APPROVAL TO BE LIFTED LATEST 01ST OF July 2018 1800 LONDON TIME & SUBJECT TO CHARTERERS MANAGEMENT APPROVAL DECLARABLE LATEST 05 WORKING DAYS AFTER OWNERS HAVE LIFTED SUBJECTS.
CHARTER PATY DATED:
TBA
CHARTERERS:
Blue Gas LNG Trading GmbH
Ferdinandstrasse 19
20095 Hamburg
Germany
HEADOWNERS & CHARTERS CONTRACTUAL PARTNERS:
CASS SCHIFFAHRTRSGESELLSCHAFT GMBH & CO. KG
BALLINDAMM 17
20095 HAMBURG
CHARTERING@CASSSHIPING.CO.UK
PERFORMING VESSELS:
MT CASS SHIPPING
WSD50 7.5K 7,500m3 LNG Carrier
Latest Dual Fuel Engine technology: – reduces emissions in LNG operation: SOx (100%), CO2 (20%), NOx (80%) – compliant with MARPOL Tier III in gas mode t Vessel is fuelled by natural BOG and forced vaporizing
SPECIFICATIONS
Length over all 117.8 m
Draught, design 7.14 m Draught
Gross tonnage 7.833
Net tonnage 2,350
Deadweight, 6.018 mt
&
MT CASS ENERGY
WSD50 7.5K 7,500m3 LNG Carrier
Latest Dual Fuel Engine technology: – reduces emissions in LNG operation: SOx (100%), CO2 (20%), NOx (80%) – compliant with MARPOL Tier III in gas mode t Vessel is fuelled by natural BOG and forced vaporizing
SPECIFICATIONS
Length over all 117.8 m
Draught, design 7.14 m Draught
Gross tonnage 7.833
Net tonnage 2,350
Deadweight, 6.018 mt
OWNERS WARRANT THAT VSL WILL HAVE VALID CERTIFICATES NECESSARY TO PERFORM THE VOYAGE.
OWNERS’ BANK ACCOUNT FOR PAYMENTS UNDER THIS C/P:
================================================
BERENBERG BANK
JOH.BERENBERG, GOSSLER & CO.KG
NEUER JUNGFERNSTIEG 20, 20354 HAMBURG, GERMANY
SWIFT CODE: BEGODEHH
IBAN (USD): DE26 12345 7891 1234
USD ACCOUNT NO.: 05-64780000
BENEFICIARY NAME: SCHIFFAHRRTSGESELLSCHAFT CASS GMBH & CO KG
SPEED & CONSUMPTION
===================
WARANTED SPEED AND CONS (WITH 5% MARGIN BEFORE SUBMISSION OF UNDERPERFORMANCE CLAIM ON SPEED OR CONSUMPTION),
WEATHER SAFE NAVIGATION PERMITING AND UP TO 4 BF SCALE – INCLUDING AUXILIARIES:
LADEN
13.5 KNOTS 8.4 MTS LNG
13.5 knots 10.4 MTS MGO
BALLAST
14.0 KNOTS 7.9 MTS LNG
14.0 KNOTS 9.5 MTS MOG
OTHER CONSUMPTIONS:
LNG
LOADING 1.4 + PER 24 HOURS
DISCHARGING 2.5 + PER 24 HOURS (INCL. IG)
IDLE WITH BOILER 1.2 + PER 24 HOURS
AUXILIARIES LNG
1.25 MTS PER 24 HOURS / PER ENGINE
LAST 3 CARGOES: N/A TANKS VIRGIN
BUNKERS:
——-
BUNKER TANK LAYOUT: AS ATTACHED
VESSEL TO BE DELIVERED WITH SAFETEY MARGIN OF BUNKERS AND CHARTERERS BEST ENDEAVOURS TO ARRANGE BUNKERS UPON DELIVERY
INTAKES:
——-
OWNERS GUARENTEE MIN INTAKE OF 7.500CBM
STOWAGE:
——-
OWNERS WARRANT THAT ALL CARGO TANKS (INCLUDING SLOPS IF AVAILABLE) CAN BE FILLED UP TO 98%.
FOR:
—
2 T/C’S 15 YEARS
CARGOES:
——-
LIQUIFIED NATURAL GAS AND/OR ALL RELATED CARGOES MENTIONED IN VESSEL COF
OWNERS AGREE TO COOPERATE WITH CHARTERERS FOR THE INSERTION OF ADDITIONAL CARGOES ON THE VESSEL’S CERTIFICATE OF FITNESS (COF) AT CHARTERER’S REQUEST, IF REQUIRED, SUBJECT TO CLASS AND HEAD OWNERS APPROVAL. THIS INCLUDES CARGOES COMPATIBLE WITH (BUT MISSING FROM) VESSEL’S RESISTANCE LIST. ALWAYS SUBJECT TO WHETHER SUCH CARGOES ARE INCLUDED IN DISPONENT OWNERS SUB CHARTER WITH HEAD OWNERS
TRADING:
——-
NOTWITHSTANDING ANYTHING CONTAINED IN THIS CLAUSE OR ANY OTHER CLAUSE OF THIS CHARTER PARTY, VESSEL’S TRADING WILL ALWAYS BE IN ACCORDANCE WITH THE FOLLOWING WHICH IN ANYWAY WILL OVERIDE ANY OTHER RELEVANT CLAUSE OF THIS CHARTER PARTY. THE VESSEL IS PERMITTED TO TRADE WORLD-WIDE, ALWAYS AFLOAT, ALWAYS WIWL AND ALWAYS VIA SAFE PORTS/BERTHS AND OR ANCHORAGES. ALWAYS EXCLUDING WAR AND WAR LIKE ZONES, LIBERIA, ORINOCO RIVER, CUBA, CAMBODIA, ISRAEL, SYRIA, SOMALIA AND ALL UN EMBARGO COUNTRIES. EXCLUDING ALSO COUNTRIES THAT ARE OR MAYBE BECOME BANNED AND/OR SANCTIONED BY EU/US.
DELIVERY:
———
VESSEL TO BE DELIVERED IN SOUTH KOREA EX YARD DROPPING LAST OUTWARD PILOT
REDELIVERY:
——-
DLOSP 1 SP MED
OR DLSOP 1 SP UKC
OR DLOSP 1 SP USG-USAC
LAYDAYS:
——-
01ST JANUARY – 31ST JUNE 2020
OWNERS TO GIVE CHARTERS 24/18/12/09/06 MONTHS APPROXIMATE NOTICE &
5/4/3/2/1 MONTHS DEFINATE NOTICE
HIRE:
—–
USD 18.000 PDPR GROSS PER VESSEL
INCLUDING OVERTIME AND COMMUNICATION EXPENSES, PAYABLE 30 DAYS IN ADVANCE DIRECTLY TO OWNERS DESIGNATED BANK ACCOUNT
COMMISSION:
————
1.00 PCT BROKERAGE COMM TO cass SHIPBROKING LTD
TAXES:
——
ALL TAXES AND/OR DUTIES ON HIRE AND/OR CARGO TO BE FOR CHARTERERS ACCOUNT AND TO BE SETTLED DIRECTLY BY THEM.
CHARTER PARTY FORM:
——————-
SHELLTIME 4, 2003 TO APPLY, AMENDED AS PER ATTACHED LOUIS DREYFUS RIDER TERMS AND TC ADDITIONAL AMENDED AS ATTACHED
END ++
tONY gREAT
cASS sHIPBROKERS
106 BUNHILL ROW
London EC1Y 8TZ
CHARTERING@CASSSHIPBROKERS.CO.UK
Cite This Work
To export a reference to this article please select a referencing stye below:
Related Services
View all


Related Content
All TagsContent relating to: "Supply Chain"
A Supply Chain is a system in place between companies and their suppliers, from producing a product to distributing it ready to be sold. An effective and smooth running supply chain can contribute to the successful running of a business.
Related Articles
DMCA / Removal Request
If you are the original writer of this dissertation and no longer wish to have your work published on the UKDiss.com website then please: