Knowledge Assessment of STIs prevention Among the Population in Reproductive Age
Info: 8391 words (34 pages) Dissertation
Published: 10th Dec 2019
Tagged: Public Health
CHAPTER 3: METHODOLOGY
3.1 Study Design
In this study, cross-sectional descriptive study was use by the researcher. Cross sectional because the study was conducted in one place, which is Ademasajida, at one time. The study was descriptive because it seeks to describe the knowledge of the community members (population of reproductive age) towards prevention of STI as it exists at the time of study. It was also aimed at gathering data without any manipulation of the research context. Its non-intrusive and was with naturally occurring phenomena; the community attitude towards prevention of STIs.3.2 Study Area
The study was carried out in Ademasajida town, Ademasajida location. This is a residential and a commercial area where local residents reside. According to the National census 2009, Ademasajida had a population 23432 of which majority are youth.3.3 Study Population
The study population included men and women of reproductive age who are residents of Ademasajida town.3.4 Inclusion and Exclusion Criteria
3.4.1 Inclusion Criteria
The study included men and women of reproductive age (15-49) who are residents of Ademasajida Town who consented to participate in the study. According to the last 2009 Census the number of people at the ages of 15-49 stands at 7921.3.4.2 Exclusion Criteria
Those excluded from the study was men and women who are above reproductive age and who are not residents of Ademasajida Town or those not willing to participate in the study.3.5. Sample Size and Sampling Technique
3.5.1 Sample Size
The sample size will be calculated using the standard sample size calculation formula by Mugenda and Mugenda, (2003). nf= N1+Nn Where: N = z2 pqd2 nf = desired sample size where population is less than 10,000 P = The proportion of the target population estimated to have a particular characteristics being measured in this case proportion of men and women with STIs taken as 40% (0.4) z = Standard normal deviation which is 1.96 at 95 % level of confidence. q = 1 – p = 1-0.4 = 0.6 d = Degree of accuracy desired is 0.08 N = 1.962×0.4× 0.60.082 = 150 Therefore nf = 1501+1507921 = 147.20 = 147 respondents3.5.2 Sampling Technique
The sampling technique used was simple random sampling. This was to ensure there was no bias as it’s based on statistical methods and can be subjected to statistical analysis thus giving reliable results.3.6 Study variables
The dependent variable was the measures taken by men and women of reproductive age (15-49 years) in prevention of STIs The independent variables include: Age, level of education, beliefs and occupation.3.7 Data collection procedures
3.7.1 Instruments
A questionnaire was be used to collect data. The questionnaire entails close ended questions. The questions are based on the specific objectives to ensure that the researcher meets the broad objective of the study.3.7.2 Pre-Testing
The questionnaire was pre-tested in Ndege- Wajir South where 15 community members (10% of the sample) was given the questionnaire to fill. This is because Ndege has a similar population as Ademasajida Town. Adjustments will be done to ensure validity and reliability of the questionnaire.3.7.3 Data Collection Process
This employed both self-administered and researcher administered methods. In self-administered the community members was given the questionnaire to fill and then return upon completion. The researcher administering questionnaires was appropriate to ensure that community members of the different levels of education were catered for including those who can’t read for themselves. The researcher took the initiative of ensuring that translation was done for the respondents who can’t read for themselves.3.8 Data Management and Analysis
Presentation of quantitative information was done using statistical packages (tables and pie charts). Data categorization and coding was be carried out during preparation of questionnaires. Each data collected was entered, coded and keyed into variables using Microsoft office Excel. Quantitative and qualitative data was analyzed using Microsoft Office Excel.3.9 Study Limitations
Financial constraints which led to selection of a small sample size which may not be a true representation of the whole population. This was countered by using a good sampling technique that ensured equal chances of respondent selection.3.10 Ethical Considerations
- A letter of introduction from Kenyatta University was obtained by the researcher from the Environmental Health department.
- Permission from the Ademasajida sub-location chief who was informed about the study.
- Informed consent was obtained from Ademasajida community members fitting in the research study.
- Confidentiality and respect was maintained throughout the research process.
- Feedback was given after the study was over to the relevant administration.
CHAPTER 4: DATA ANALYSIS AND PRESENTATION
The purpose of this study was assessment of knowledge status on Prevention of sexually transmitted infections among population in Reproductive age in Ademasajida town Wajir West Sub County. The respondents were aged between 15-49 years.4.1 Introduction
The researcher administered 147 questionnaires to Ademasajida town residents and 136 respondents returned the questionnaires after filling. This represented 92% response rate to the study. This chapter represents the study findings. The data was analyzed using Microsoft Office excel and the data findings were presented in form of tables, pie charts, bar graphs, line and circle graphs. Percentage calculations on the responses were also done to clearly bring out comparisons on answers to the questions that were being asked during the study. Respondents comprised of 81 male respondents and 55 female respondents. Eleven respondents did not return the question papers used for data collection process. The Table below shows respondents met during the study. Table 4.1 Respondents Sex| SEX | RESPONDENTS | PERCENTAGE |
| MALE | 81 | 55% |
| FEMALE | 55 | 37% |
| TOTAL | 136 | 92% |
4.1.1 Age Demographics
The majority Fifty two percent (n=71) of the respondents met were between ages of 15-25 years. 34% (n=46) of respondents were between ages 26-35 and ages 36-49 had 14%. (n=19) of total respondents. .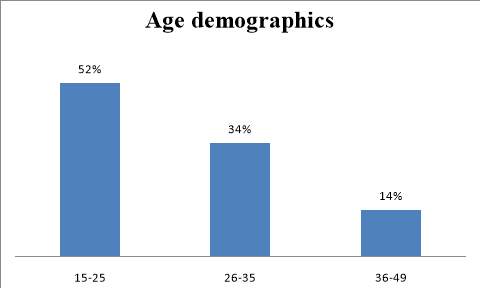 Source: field data( December 2016)
Figure 4.1.1 Age of the respondents
Source: field data( December 2016)
Figure 4.1.1 Age of the respondents
4.1.2 Marital Status
On marital status, majority 54% (n=73) of the respondents were single. Those married were 23% (n=31) while 12% (n=17) were separated and 11% (n=15) were widowed. Most of the residents of Ademasajida are youths who cited lack of job as a big role in this people’s inability to marry. Some are still students who are committed in studies and have no time to marry.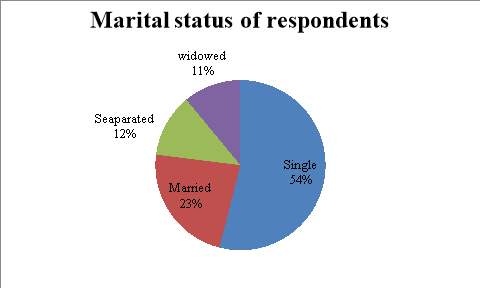 Source: field data( December 2016)
Figure 4.1.2 Marital status of respondents
Source: field data( December 2016)
Figure 4.1.2 Marital status of respondents
4.1.3 Religion
On religion, majority of Ademasajida Town profess Muslim faith. The areas situated in North Eastern region of Kenya is usually dominated by the Muslims. Of the total respondents, 81% (n=110) indicated that they were Muslims .Catholics account for 10% (n=14,) Protestants were 4% (n=5) while 5% (n=7) said they were neither of the above faiths.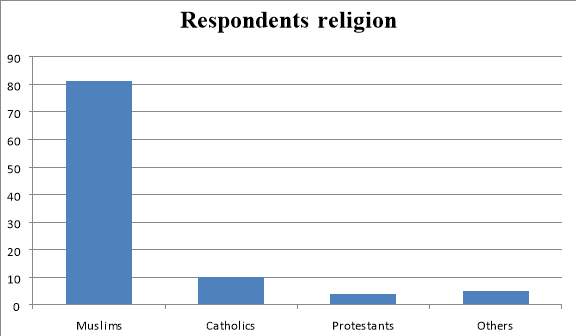 Source: field data( December 2016)
Figure 4.1.3 the religious status of respondents.
Source: field data( December 2016)
Figure 4.1.3 the religious status of respondents.
4.1.4 Level of Education
Literacy level is high among the respondents and stands at 92% (n=125) . This area is quite accessible to the education facilities since independence. There are many schools(primary and secondary schools) either public or private situated close or in the area. Those with post-secondary school qualification( diploma and degree) studied from distant places like Nairobi and other towns with higher institutions like colleges and universities. Most of those with post-secondary school qualification are working in the county government as accountants ,health workers,etc . Those who said they have never gone to school were older people involved in shop keeping and casual works mostly aged above 35 years. 23 percent (n=31) of the respondents indicated that they had graduated from secondary school while 21% percent (n=29) are either pursuing or graduated with Diploma and those with Degree are 6 %( n=8). Only 8% (n=11) of the respondents said they did not go to school and 42 %( n=57) reached primary level.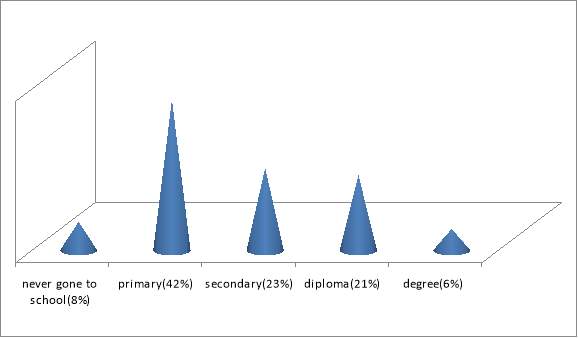 Source: field data( December 2016)
Figure 4.1.4 level of education of the Respondents
Source: field data( December 2016)
Figure 4.1.4 level of education of the Respondents
4.1.5 Occupation
Majority of the respondents said they are not employed 54% (n=73) and the self employed are 26% (n=36) and those employed by other people are 20 %( n=27)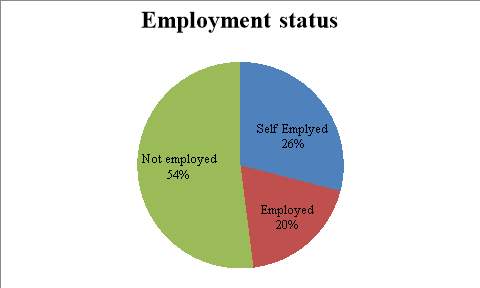 Source: field data( December 2016)
Figure 4.1.5 Occupation of the Respondents
Source: field data( December 2016)
Figure 4.1.5 Occupation of the Respondents
4.2.0 HEALTH KNOWLEDGE ON STIs.
To find out health knowledge on STI, the study used various questions directed to gather information whether the community have an understanding of STI and its health risks. Those who responded positively to the question whether they have heard or aware of the Sexually Transmitted infection conditions are 82% (n=112) those who said they are not aware of STIs are 16 % (n= 24)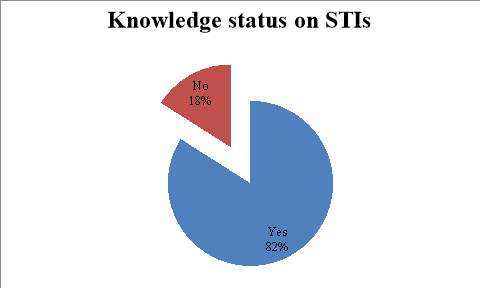 Source: field data( December 2016)
Figure 4.2 Awarenesson STI
Source: field data( December 2016)
Figure 4.2 Awarenesson STI
4.2.1 Response of transmission routes of STIs
All respondent knew the way in which STIs is transmitted from one person to another. This is again influenced by the level of education of the youth. The main route of STIs transmission cited by the youth was unprotected sexual intercourse with an infected person (65%). This knowledge makes the youth to avoid unprotected sexual intercourse hence contributing to the prevention of STIs. This was followed by having many sexual partners (21%). The youth were aware that engaging sexual relation with many sexual partners is a risky behavior of contracting STIs hence they tend to avoid it and instead have one sexual partner. Having many sexual partners is a risk behavior for contracting STDs easily (Kann and Kinchen, 1999). The youth had little knowledge on other ways in which STIs is transmitted. This included blood transfusion (15%), infected needles (13%) and mother to child transmission (8%). Table 4.2.1 Response on Transmission routes| ROUTES | Number of times each box was ticked | PERCENTAGE | |||
| Blood transfusion | 21 | 15% | |||
| Infected needles | 17 | 13% | |||
| Unprotected sexual intercourse | 89 | 65% | |||
| Mother to-baby transmission | 11 | 8% | |||
| Many sexual partners | 28 | 21% | |||
| Total | 166 | 122% | |||
4.2.2 Source of information on STIs
The percentage of respondents who said they got the information on STIs from Books are 23 %( n=31) while those who get their information form hospital staff and brochures are 10 %( n=14). 16% said the vital information is shared with them by friends which are 22 respondents. Media account for the largest sources of information 51% which stand for 69 respondents.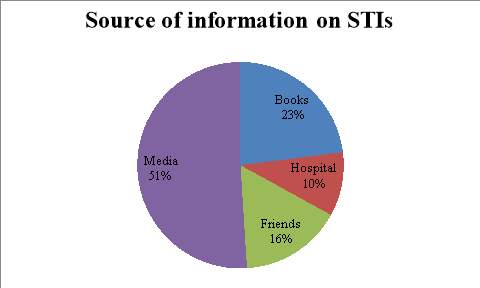 Source: field data( December 2016)
Figure 4.2.2 Source of information on STIs
Source: field data( December 2016)
Figure 4.2.2 Source of information on STIs
4.2.3 The various sexually transmitted infections known by the respon dents.
Table 4.2.3 STIs known to the respondents| DISEASE | Frequency out of 136 respondents | Percentage |
| HIV/AIDS | 136 | 100% |
| Syphilis | 99 | 73% |
| Gonorrhea | 118 | 87% |
| Chancroid | 13 | 10% |
| Vaginalis | 8 | 6% |
| Chylamidia | 9 | 7% |
| Human papilloma virus | 8 | 31% |
| Total ticked | 391 | - |
4.2.4 Asked whether the respondents have ever suffered from STI
Majority 54% (n=73) responded they have never suffered from the various disease ,but 46% said they caught the disease. Table 4.2.4 Whether respondents have ever suffered from STI| Frequency | Percentage | |
| Yes | 63 | 46 |
| No | 73 | 54 |
4.2.5 Number of times respondents suffered from any STI infections in the last 5 years
The study seeks to know how many times those who responded they have suffered, had suffered from the infection in the previous 5 years. Those who said suffered once are the majority 27%(n=18) while those who responded twice 20%(n=13) .14% (n=9) suffered three times, 21%(n=14) had the disease 5 times while more than 5 times stand at 18%(n=12) which bring total of those who suffered in the last 5 times to 66. Those not applicable to respond are 73 in number.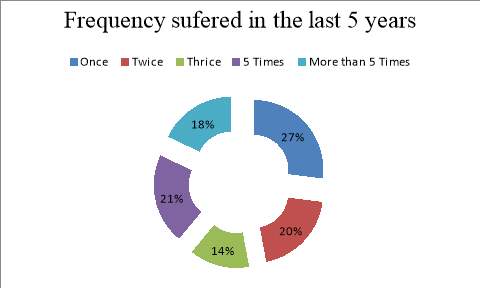 Source: field data( December 2016)
Figure 4.2.5 Frequency suffered in the last 5 years from STIs
Source: field data( December 2016)
Figure 4.2.5 Frequency suffered in the last 5 years from STIs
4.2.6 Symptoms suffered by those respondents who said they had STI previously
Table 4.2.6 Symptoms of STIs suffered| SYMPTOMS | SAMPLE | PERCENTAGES | |||
| FEVER | 25 | 29% | |||
| RASH IN THE GENITALS | 10 | 11% | |||
| ITCHING IN THE PRIVATE PARTS | 12 | 15% | |||
| DISCHARGE FROM THE GENITALS | 9 | 11% | |||
| PAIN DURING THE SEX | 11 | 13% | |||
| OTHERS | 18 | 21% | |||
| TOTAL | 85 | 100% | |||
4.3 Preventive measures against STIs
Majority of the respondents said they employ all the preventive measures mentioned combined like abstinence, use of condoms, knowing partners status and finally being faithful to partners. Those who said they prefer abstinence before marriage are 26%, while those who used condoms are 20%. Being faithful to partners and knowing partners status garnered 12% and 14% respectively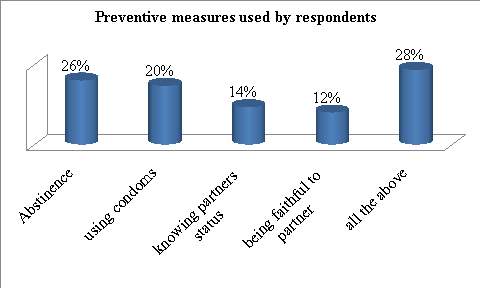 Source: field data( December 2016)
Figure 4.3 Preventive Measures used by Respondents
Source: field data( December 2016)
Figure 4.3 Preventive Measures used by Respondents
4.3.1 Frequency of checking STI status at the clinic
32% of the respondents stated that they check their status once in a year while 22% of the respondents confirmed to check their status more than twice in a year. 14% scarcely check their status posing risks of STIs. Some of the respondents check their status whenever they suspect symptoms of STIs(13%) and 19% of the respondents can’t remember the frequency they check their status. Table 4.3.1 Frequency of checking STI status at the clinic| Frequency | Number of people | Percentage | ||
| Once in a year | 43 | 32% | ||
| More than twice a year | 31 | 22% | ||
| Scarcely | 19 | 14% | ||
| Whenever I suspect the symptoms of STI | 17 | 13% | ||
| Can’t remember | 26 | 19% | ||
| Total | 136 | 100% | ||
4.3.2 Is there any Campaign done regularly to Educate the public on STIs
Those who said Yes are 72% (n= 98) and those who claimed there are no enough campaign done to educate the public are 28% (n=38)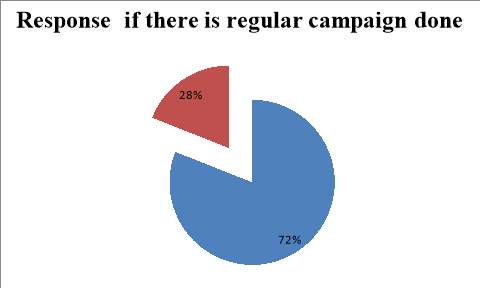 Source: field data( December 2016)
Figure 4.3.2 Response if there is regular campaign done
Source: field data( December 2016)
Figure 4.3.2 Response if there is regular campaign done
4.3.3 Who spearhead the campaign to teach the public against STIs
Majority believe that government agencies should spearhead campaign against STIs(33%), Non-Governmental Organizations is preferred by 15% of the respondents, 13% chose CBOs, Health workers got the nod of 21%, educational institutions such as universities was selected by 6% of the respondents while 12% of the respondents chose other appropriate agencies like religious leaders to spearhead the campaign against STIs. Table 4.3.3 Who should spearhead the campaign to teach the public against STIs| Who should do the campaign | Number of people who responded out of 111 | Percentage | ||
| Government agencies | 37 | 33% | ||
| NGOs | 17 | 15% | ||
| CBOs | 14 | 13% | ||
| Health workers | 23 | 21% | ||
| Educational institutions | 07 | 6% | ||
| Others(specify) | 13 | 12% | ||
| TOTAL | 111 | 100% | ||
4.3.4 Whether knowledge given on prevention of STI is adequate
Majority have disagreed (30%) that adequate knowledge given to the youth in Ademasajida Town area, with 15% agreed and 24% strongly disagreed. 15% agreed with the statement and 14% strongly agreed while 17% are not sure how adequate is the teaching campaign done.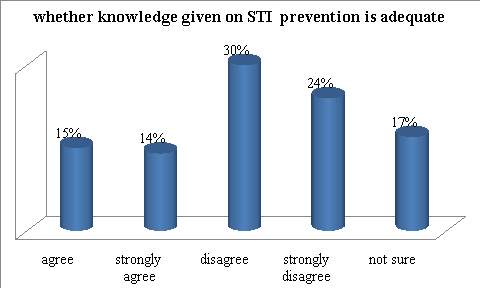 Source: field data( December 2016)
Figure 4.3.4 Whether knowledge given on prevention of STI is adequate
Source: field data( December 2016)
Figure 4.3.4 Whether knowledge given on prevention of STI is adequate
4.3.5 (a) Ever lost a colleague to STI
For those who responded Negatively to this question are 68 %( n=92). Those who responded positively are 44 people which represent 32%.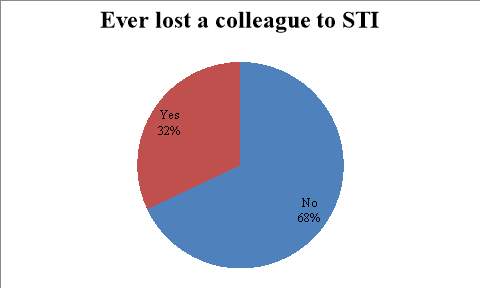 Source: field data( December 2016)
Figure 4.3.5 Ever lost a colleague to STI
(b) If yes from which infection
40 people responded and 4 avoided ticking the questionnaire. 33% of the respondents stated that they lost a colleague to HIV/AIDS, Gonnorhea(15%), syphilis was represented by 13%, Trichomanalis 21%, vaginalis was selected as the killer by 6% and chancroid 12%
Table 4.3.5 Lost a colleague from STI infection
Source: field data( December 2016)
Figure 4.3.5 Ever lost a colleague to STI
(b) If yes from which infection
40 people responded and 4 avoided ticking the questionnaire. 33% of the respondents stated that they lost a colleague to HIV/AIDS, Gonnorhea(15%), syphilis was represented by 13%, Trichomanalis 21%, vaginalis was selected as the killer by 6% and chancroid 12%
Table 4.3.5 Lost a colleague from STI infection
| Infections | Number of people responded out of 40 | Percentage | ||
| HIV/AIDS | 13 | 33% | ||
| Gonorrhea | 6 | 15% | ||
| Syphilis | 5 | 13% | ||
| Trichomanalis | 9 | 21% | ||
| Vaginalis | 2 | 6% | ||
| Chancroid | 5 | 12% | ||
| Others(specify) | 0 | 0% | ||
| TOTAL | 40 | |||
4.3.6 Who do you confide in?
It’s understood that sexually related infection are stigmatized and the victims tend to keep close to their heart to avoid embarrassment. Most respondents said that they are comfortable to confide in health workers (32%), spouse (22%), siblings (15%) and parents (15%).those that had close ties and believe in the input of peers and religious leaders tied at 8% apiece.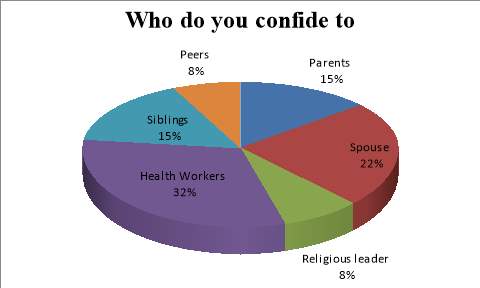 Source: field data( December 2016)
Figure 4.3.6 Who do you confide in
Source: field data( December 2016)
Figure 4.3.6 Who do you confide in
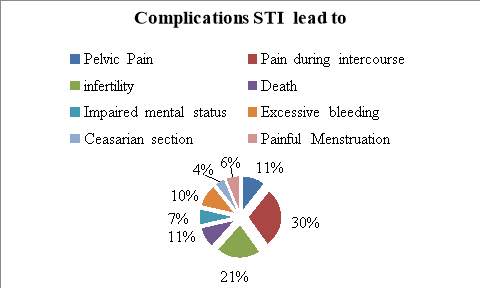
4.3.7 Which complications have you heard STI lead to?
 Source: field data( December 2016)
Figure 4.3.7 complications you have heard STI lead to
Source: field data( December 2016)
Figure 4.3.7 complications you have heard STI lead to
4.3.8 Most vulnerable groups
Most of the respondents belief the most vulnerable groups are sex workers which account for 53 %( n=72) and Adolescents at 17%. College students 10% and slum dwellers are 11%. Uncircumcised male and health workers are believed by respondents to be least vulnerable groups to be victims of the infectious disease scoring 3% and 6 % respectively.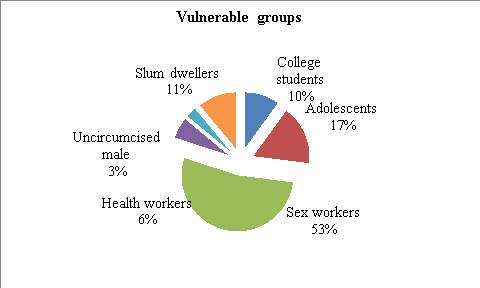 Source: field data( December 2016)
Figure 4.3.8 Most vulnerable groups
Source: field data( December 2016)
Figure 4.3.8 Most vulnerable groups
4.3.9 Who will lead the campaign against STIs?
When asked of opinion who should lead the campaign in effective public education, the respondents are divided on the best route to be used. Majority preferred Media outlet 46 %( n=63) as the best channel. 19% belief that political leaders can play much bigger role than religious leaders, which got the nod of 8%. Others belief youth groups 13% and teachers 8% can involve in the teaching of different groups of the community and parents role represents 6%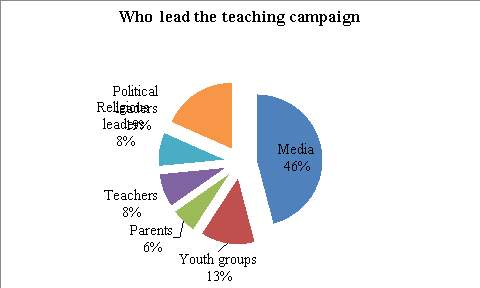 Source: field data( December 2016)
Figure 4.3.9 Who will lead the campaign
CHAPTER 5: DISCUSSION, CONCLUSIONS AND RECOMMENDATIONS
5.1 DISCUSSION
According to the results established for this study, most of the population in reproductive age who participated in this study were between 15 and 25 years, majority were Muslims (81%), single (54%), unemployed (54%) and had gone up to primary school (42%).The socio-demographic status had some influence on young people’s knowledge on prevention about sexually transmitted infections . Most of the young people who had gone up to post primary school had more information about the infection, symptoms, complications and medico-conservative management ; they had gotten the information from their media(51%) and through reading from books 23% both syllabus and health information publications.5.1.1 The ways that contribute to transmission of infection from one person to another among population in Reproductive age
The research showed that the major transmission routes are through unprotected sexual intercourse from infected person to healthy person which account for 65%. 21% of respondents pointed out that many sexual partners also play a bigger role in the spread of the disease. Blood transfusion from an infected donor to a recipient, before thorough screening of the blood at the laboratory during blood transfusion doesn’t help either. Not using condom, misuse or re-use of it can compromise its effective prevention of the disease. Mother to baby transmission during delivery and breastfeeding has led to spread of the disease in the younger generation. Infected needles used at the hospital for injection and poor hygienic body conditions are the least cause of the disease may be due to careful sterilization of the needles and observation of hygiene by the young people. Hygiene on the reproductive organs are very important as well as it’s vital on the whole body like skin, oral cavities etc. Lack of enough hygiene care can cause skin disease skin and other bacterial infections that colonize the mucosal membranes. Maintainace of cleanness is important in women in reproductive ages during menstrual flow, during pregnancy and post delivery time. Pre and post sex hygiene care is vital for couples during intimate sexual intercourse actions.5.1.2 Source of information for STIs and the STIs known to the respondents
The study found out that most young people get information from media(51%) on the update of the breakout of the disease ways of avoiding and its symptoms. Most of the media network had been informative bringing programs on health matters and interview with specialist on the various infections and disease. 100% of the respondents understand the disease and the enormous consequences of catching HIV/AIDS and its implication on the health of individual, society and the economic impact on the country. Gonorrhea 87% and syphilis 73% follow the list-of-the-known as the diseases most understood after HIV/AIDS. Most of the people who have not pursued any medical courses do not understand much about the disease like Human Papilloma Virus (HPV) 31%, Vaginalis 6%, Chancroid 10% and chylamiydia 7%.Government agencies and health workers remain vital source of information which combines their effort to rack up to 54% in the responses belief. Community based organization and Non-governmental organization 13% and 15% have scored below par belief with respondent though they are the institution which could have been close to the grassroots which clearly indicate that there is a gap in community cohesion. They are indispensable in spearheading in educating the community members on such important topic. A key part of prevention efforts is to offer HIV testing so that people can know their status and take steps to protect themselves and others. If they are negative, they can be counseled about safer sex and the need for regular screening for HIV and other STIs. If positive, they can receive counseling and swift referral for medical monitoring and discussion about the benefits of starting treatment for their personal health. Another benefit of treatment is that it reduces the amount of HIV in a person’s blood and genital fluids, thus reducing their sexual infectiousness. Social networking- The popularity of electronic social networking sites and so-called smartphones has resulted in the growth of virtual communities that are ripe for communicating messages about healthier living, including STI prevention. Such sites and technologies are used by some people to find sexual partners, therefore they are of growing importance for the encouragement of healthy behaviours.5.1.3 The symptoms suffered by those infected by sexually transmitted infections
Usually the symptoms alert the sick individual to seek medical attention from the nearest hospital. The symptoms are also useful in diagnosing the condition and separating from the differentials that may cause confusion in the right diagnosis. The ability to identify the specific symptoms from any other disease can help the young people to seek the specific treatment and avoid development of complications. Fever 29% is the symptoms that the respondents said affect them because of the inflammation as the result of the immunity ‘fight back’ of the body. Rash in the genitals , itching in the private parts are some of the sensitive responses respondent had to make .pain during sex 13% are ticked by those who had married and agreed to have suffered the infections. Discharge from the genitals and rash in the oral cavity are some of the symptoms the study found out to be out there affecting young people who are infected. STIs are spread through contact with: infected body fluids, such as blood, vaginal secretions, or semen infected skin or mucous membranes - for example, sores in the mouth5.1.4 Complications that arise as a result of STI infections among young men and women in the reproductive age
According to the findings from this research study, Among the complications as a result of STI infections is that it causes severe pelvic pain(11% of the respondents) and pain during intercourse as a result of inflammation(according to 30% respondents). In the longtime the complications cane lead to infertility (21%) which can cause mental problems(7%). The infertility can cause divorce as lack of children tends to strain the relation between couples. Severe complication can cause suicide. Urine incontinence can cause embarrassment and low self esteem. Stigma also play role in slowing health seeking behavior. chlamydial infection can affect neonates: many delivered vaginally become infected, developing conjunctivitis or, less often, chlamydia pneumonia5.1.5 The most vulnerable groups to STIs
The research established that majority (53%) of the community believe sex workers are the most vulnerable group while 17% believe adolescents are the second most vulnerable due to curiosity and inability for the society to open on the topic of sexuality. Most of the respondents believe the media should be utilized to disseminate information to the young people. Because most of them are techno savvy, and are very much connected on the social sites like face book and twitter.5.2 CONCLUSION
STIs remain global challenge. Sexually transmitted infections (STIs) contribute largely to the burden of health especially in Sub-African. It is equally evident from this research study that STIs remain a major threat to human health and to the economy of any country. STIs prevalence has led to the death of young and working population depriving the country of human resource force hence decline in economy and decline in general development. Complications that result from disabilities and mental problem results to creation of many people who are not able to work for themselves leading to increase to dependency ratio in a given area. Therefore based on the findings from this research, there is need to put a lot of interventions to minimize STIs cases and reduce the burden of STIs, The most effective way of preventing STIs is by not having sex. Some vaccinations may also decrease the risk of certain infections including hepatitis B and some types of HPV. Safer sex practices such as use of condoms, having a smaller number of sexual partners, and being in a relationship where each person only has sex with the other also decreases the risk. The government of Kenya should create jobs to get rid of dangerous activities such as commercial sex that ultimately led to spread of STIs. By creating jobs, employment opportunities will be available for many young women, hence eliminating commercial sex , this greatly minimizes cases of STIs. To save young people who are sexually active, it needs a collaborative interplay from all stakeholders in the community. These include men, women, girls, religious leaders, political leaders, circumcisers among other stakeholders. The government and non-governmental organizations need also to play their role in educating the community and in law enforcement.The key decision makers on the youth should be targeted. These were the parents, youth groups, spouse, peers and religious leaders.5.3 RECOMMENDATIONS
It is therefore recommended that:- The Ministry of health should design health education and promotion program on STI prevention with the aim of sensitizing the locals on the same.
- The locals of Ademasajida Town especially teenagers, adolescents and women of reproductive age should be educated on measures of STI prevention with the aim of increasing prevention practices among the population in reproductive age.
- There is a need for widespread and serious health education efforts through the mass media (especially radio and television) as well as through brochures and face to face encounters. Such efforts should provide information on the causes, symptoms and predisposing factors and how to prevent its occurrence.
5.4 FUTURE RESEARCH
Results of this study indicate other areas that need further study, these includes:- Study findings have shown that abstinence is the best and surest preventive measure of STIs. Therefore a study on why it is difficult for the youth to abstain despite believing that it is the best way of preventing STIs is necessary.
- Another area of study could be an assessment of the effectiveness of the three initials for STI prevention, that is, ABC. A-abstinence, B-being faithful and C-condom use.
REFERENCES
Askew, M. et. al., (2004). “A multi-sectoral approach to providing reproductive health information and services to young people in Western Kenya: Kenya Adolescent Reproductive Health Project”. Frontiers in Reproductive Health/Population Council Bertrand, J.T., Anhang, R (2006) The effectiveness of mass media in changing HIV/AIDS related behaviour among young people in developing countries. In: Preventing HIV/AIDS in young people: A systematic Review of the Evidence from Developing Countries. WHO Technical Report Series 938 , pp 205-339 Bloodindex, (2007). Comprehensive sex education is more effective at stopping the spread of HIV infection; Society views on AIDS/AIDS; ‘Posted by Ran, P’ Clark, L.R., Jackson, M., Allen-Taylor, L. (2002). Adolescent knowledge about sexually transmitted diseases; “sexually transmitted diseases” 29(8); 436-443. CDC 1993 “ Sexually Transmitted Diseases Surveillance Report” CDC 2008. “ Sexually Transmitted Diseases treatment guidelines ’’. Morbidity and Mortality Weekly Report; 55( RR-11) DeJong, J., Shepard, B., Roudi-Fahimi, F., Asford, L (2007). Young People’s Sexual and Reproductive Health in the Middle East and North Africa. Population Reference Bureau; pp 2 Gottvall et al ( 2009) “ HIV/AIDS- information and knowledge about its transmission” Jejeebhoy, S.J., (2006). Sexual and Reproductive Health of Young People: Expanding the Research and Program Agenda. Prepared for the David and Lucile Packard Foundation; Population Program Review Task Force. Keating, J., Meekersand, D., Adewuyi, A. (2006). Assessing effects of a media campaign on HIV/AIDS awareness and prevention in Nigeria: results from the VISION Project. BMC Public Health. 6: 123. Ministry Of Health (MOH) [Kenya] 1999. Strategic plan for the Kenya national HIV/AIDS/STIs control programme for 1999-2004. Nairobi: MOH. National Council for Population and Development, Nairobi (2009) “ Adolescent Reproductive Health and Development Policy for STI Managenment” National AIDS/STI Control Programme (NASCOP), Kenya.2009. 2007 Kenya AIDS indicator survey: final report. Nairobi: NASCOP. Piot, P (2008). Preventing new HIV infection is key to reversing the epidemic in Africa. The World Bank’s Commitment to HIV/AIDS in Africa: Our Agenda for Action 2007-2011 Population Council, Nairobi (1998) “ Improving the management of STIs among MCH/FP clients at Nakuru Municipal Council Health Clinics’’ Temin, M .J. et al, (1999). “Kaufman Perceptions of Sexual Behavior and Knowledge About Sexually Transmitted Diseases Among Adolescents in Benin City”, Nigeria.International Family Planning Perspectives, Vol. 25, No. 4, pp. 186-190 World Health Organization.(1998) The second decade: improving adolescent health and development. Geneva. Adolescent Health and Development Programme, WHO et al (2001) “ Sexually Transmitted Diseases amongst adolescents in the developing world’’, GENEVA( Draft Report) WHO ( 2001) “ Global Prevalence and incidence of selected curable Sexually Transmitted Infections ’’ GENEVA WHO (2007) “ Global Strategy for the prevention and control of Sexually Transmitted Infections, breaking the chain of transmission – 2006-2015” GenevaAPPENDICES
APPENDIX I: INFORMED CONSENT FORM
I am a fourth year student in the school of Public Health. In partial fulfillment of the degree course, I have to submit a research project. Therefore, I am requesting for your consent to participate in this study. The study is on the knowledge assessment of sexually transmitted infections (STIs) prevention among the population in Reproductive age in Ademasajida Town. The information that you will give us in this study will contribute towards the development of STIs prevention programmes for the population in reproductive age. In addition, the information will also benefit you and upcoming population in the said age bracket to be protected from contracting STIs. In participating in this study, you will be required to fill in a questionnaire that will take 10-15 minutes to answer. No names will be used on the questionnaire and individual responses will be kept confidential. Only the researcher and the research supervisor will have access to them. There are no risks associated with this study and your participation is important for the development of STIs prevention programmes specific for Ademasajida Town people. The participation is voluntary, and you are free to withdraw from the study if you wish with no resultant penalties. If you are interested to participate in this study, please sign the consent form provided and then respond to the questionnaire given. Participant I have agreed to participate in this study. I understand that all information will be confidential and anonymous. I have been given the opportunity to answer questions and know that I am free to withdraw my consent at any time. Signature:…………………………………….. Date:………………………………………….APPENDIX II: QUESTIONNAIRE
INSTRUCTIONS Please tick ( ) in the boxes representing the most appropriate response. Comment can also be made in appropriate spaces provided.
DATE STARTED ____________________ DATE ENDED ________________
Demographic data
Please tick ( ) in the boxes representing the most appropriate response. Comment can also be made in appropriate spaces provided.
DATE STARTED ____________________ DATE ENDED ________________
Demographic data
- Age: 15-25 [ ] 26-35 [ ] 36-49 [ ]
- Marital Status: Married [ ] Single [ ] Separated[ ]
- Religion: Catholic [ ] protestant [ ] Muslim [ ] others [ ]
- Education level: never gone to school [ ] primary [ ]
- Occupation: Self-employed [ ] Employed [ ]
- Do you know what sexually transmitted is? Yes [ ] No [ ]
- If yes, choose ways of transmitting infections from one person to another that you know. Tick all that apply.
- How did you get to know?
- From friends [ ]
- Hospital [ ]
- Books [ ]
- Through media [ ]
- Others (specify) ……………………………….
- Which of the following sexually transmitted Diseases do you know? Tick all you have heard or read about
APPENDIX III: LETTER FOR DATA COLLECTION

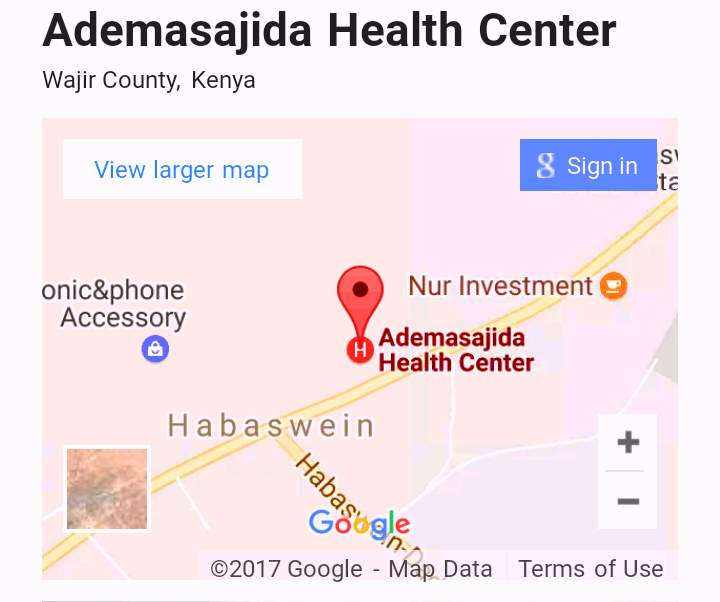
APPENDIX IV: MAP OF THE STUDY AREA
Cite This Work
To export a reference to this article please select a referencing stye below:
Reference Copied to Clipboard.
Reference Copied to Clipboard.
Reference Copied to Clipboard.
Reference Copied to Clipboard.
Reference Copied to Clipboard.
Reference Copied to Clipboard.
Reference Copied to Clipboard.
Related Services
View all


Related Content
All TagsContent relating to: "Public Health"
Public health concerns the wellbeing and health of the general public as a whole. Through organised efforts, public health bodies look to inform the choices of society to help protect from threats to their health and prolong and improve the quality of life.
Related Articles

DMCA / Removal Request
If you are the original writer of this dissertation and no longer wish to have your work published on the UKDiss.com website then please: