Methods for Anomaly Detection of Online Social Networks
Info: 7889 words (32 pages) Dissertation
Published: 1st Mar 2022
Tagged: Information SystemsSocial Media
Abstract
With the increasing trend of online social networks in different domains, it has become a convenient platforms for people to share, communicate, and collaborate with each other, which at the same time poses significant challenges in this area as many malicious behaviors, such as bullying, terror attack planning, steal other’s personal information, profile cloning, social phishing, neighborhood attack, physical threat etc can happen. These abnormal activities in a social network can be termed as anomaly. As social networks becomes a convenient platform for doing such malicious activities, so it is extremely important to detect these abnormal activities as accurately and early as possible to prevent disasters and attacks and to ensure safety in social networking for people. Now a days online social network has become the interest of many researchers for their analysis in terms of their usage as well as for detection of anomalous activities. There are so many anomaly detection techniques developed so far till days, some of them are developed for generic applications while most of them for specific application areas. This survey tries to provide a comprehensive overview of the recent researches on different types of anomalies and their novel categorization based on various characteristics. This review paper also presents a comprehensive and structured overview of the state-of-the-art methods for anomaly detection. Some challenging issues of existing state-of-the-art-methods for anomaly detection of online social networks are also covered. Finally, this paper concludes with different future directions and areas of research that could be addressed and worked upon.
Keywords: Online Social Networks (OSN), Anomaly Detection, Data Mining, Network Outlier Detection
1. Introduction
Today’s Information Age is mainly characterized by an explosion of large volumes of raw data, particularly data that involves social interactions in large groups. Online social networks provide hang out space for everybody and using this technology anybody can communicate with their interested friend and share their information, photos, and videos. As more information becomes available in online social networks, there are lots of useful patterns could be extracted from this influx of data, and there are ways to extract useful information about an individual or a group by observing the individual behavior of its members or their interconnections to peers in the network. And so this prominent technology also opens the door for unlawful activities. These illicit activities are also alluded to as anomalies [1]. Anomalies are typically defined in terms of deviation from some expected behavior. Different authors have defined anomalies in different ways but in general, anomalies can be defined as “patterns in data that do not conform to a well-defined notion of normal behavior”. Anomalies emerge in online social networks as a result of specific people, or gatherings of people, rolling out sudden improvements in their examples of connection or communicating in a way that extraordinarily contrasts from their companions. The effects of this strange conduct can be seen in the subsequent network structure. There are so many popular social networks usually websites such as Facebook, Twitter, LinkedIn etc. that aim to form a cyber-network amongst users. Though most of our daily lives are spent on digital devices now a days and it becomes easier to collect individual behavior for a range of features in a variety of contexts but we can get very few amount of relevant social groups that can be analyzed from these networks. Whereas interesting social patterns are likely appear in the everyday context, such as workplace politics and other substantial situation.
Data mining and knowledge discovery is a recent research area of interest and the branch of data mining that deals with discovering abnormal or unusual occurrences from mining the databases is called anomaly detection. This problem domain has numerous high-impact applications in security, finance, healthcare, law enforcement, and many others. There is a variety of techniques to detect anomalous accounts from online social networks. Every online social network has its own structure and nature. This survey explains both traditional and modern ways to detect anomalous users from all online social networks like Facebook, Twitter, Viber, WhatsApp, YouTube, WeChat etc. There exist lots of survey articles based on anomaly and outlier detection of the social network but these articles in general focus on point anomaly of multi-dimensional data instances. In particular, Chandola et al. [2], covers outlier detection techniques; Schubert et al. [3], deals with local outlier detection techniques and Zimek et al. [4], focuses on outlier detection in high dimensions. Some other examples include detecting network intrusion or network failure [5], credit card fraud [6], auto insurance fraud [7], email and Web spam [8], opinion deception and reviews spam [9], health insurance claim errors [10], accounting inefficiencies [11], auction fraud [11], tax evasion [12][13], customer activity monitoring and user profiling [14][15], click fraud [16][17] , securities fraud [18], malicious cargo shipments [5][19] malware/spyware detection [20], false advertising [20], insider threat [21], image/video surveillance [22][23], health insurance claim errors [10] , accounting inefficiencies [11] and many others. As anomalous events occur in wide-range of application domains, fraud detection has attracted many surveys [24][25] and there are lots of scopes to research in this field.
The rest of this paper is organized into different sections. Section 2 and 3 contains the novel categorization of anomalies on the basis of a number of parameters and a brief overview of existing techniques for social network anomaly detection respectively. The output of anomaly detection and different challenges of social network anomaly detection have been discussed in Sections 4 and 5 respectively. And finally, section 6 presents conclusion along with some future directions.
2. Types of Anomalies
Anomalies or the abnormal activities can be classified into various categories. This section describes the various types of anomalies with example that are found in the social network.
2.1 Based on nature of anomalies
Though anomalies can be classified into three main categories based upon the nature and scope of anomalies [2], however, there are actually four types of anomalies that may found in social networks:
2.1.1 Point anomalies
A point anomaly refers to detecting an anomalous data instance with regard to the remainder of the data. Point anomaly detection aims to detect suspicious individuals, whose behavioral patterns deviate significantly from the general public. It is also referred to as global anomalies if a data object (i.e. a point) shows a different behavior than that of the rest of the data. Although being the simplest kind of anomaly to be detected yet, a major problem associated with detecting point anomalies is finding a suitable measurement in deviation of the object from other objects. Let us assume that for a normal network every node must have at least two neighbors linked to it. As shown in Fig. 1, nodes in Group V2 form such type of network and thus represent a normal behavior but Group V1 contains isolated points. Because of their dissimilar behavior to other nodes they are predicted to be representing an anomalous behavior.
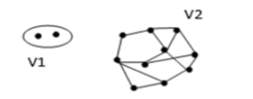
Fig 1: Point anomalies.
Similarly, we may also have local anomalies which are studied relative to their local neighborhood only. For example, if we group a set of individuals based on their links in the network as friends and check their income (some parameter), a particular individual, let say A, might be having a fairly low income compared to his friends suspecting a local anomaly while overall in the global context his income might be insignificant as many people may have similar income representing a normal behavior. This behavior is depicted in Fig. 2(a) and 2(b).
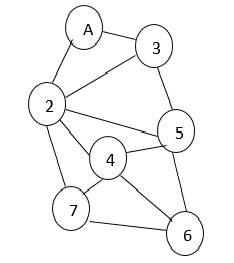
Fig 2a: Groups on the basis of friendship links.
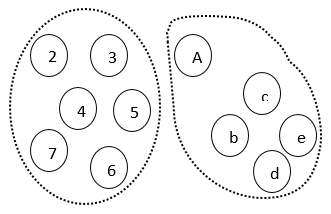
Fig 2b: Groups according to income.
2.1.2 Contextual anomalies
A contextual anomaly is also referred to the as conditional anomaly. It also refers to a data instance which is considered as anomalous in a specific context, but not in others. For instance, Figure 3 shows a temperature time series which shows the monthly temperature of an area over last few years. A temperature of 35F might be normal during the winter (at time t1) at that place, but the same value during summer (at time t2) would be an anomaly. Though the temperature at time t1 is same as that at time t2 but occurs in a different context and hence is considered as an anomaly [2]
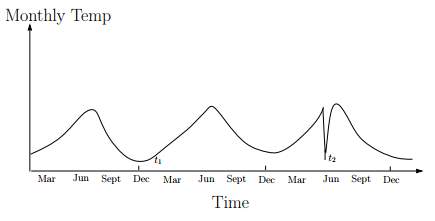
Figure 3: Contextual anomaly t2 in a temperature time series.
In a contextual anomaly data instance is defined by using contextual attributes and behavioral attributes [26][27][28][29][30], where contextual attributes only define the context of the object and behavioral attributes implies the characteristics of an object to identify an anomalous behavior of an object with respect to its context. A contextual anomaly occurs at a certain time or certain region. e.g. large spike at the middle of night.
2.1.3 Collective/Group anomalies
A collective anomaly refers to detecting an anomaly that calls a collection of data instances as anomalous with regard to the whole data set. The data instances themselves may perhaps not be anomalous if they do not occur together as a group. Noble & Cook [31] investigated collective anomalies for graph data. Group/collective anomalies occur whenever a collection of data objects as a whole behaves differently than others, whereas the individual data objects within this group may not be anomalous whenever we treat them individually. For example, in Fig. 4, we may assume a set of students who reserved a seat for a particular course and if one of them leaves a course, it may be considered as normal but if multiple students start leaving the course then they as a complete group represented by G are considered as anomalous. Collective anomalies are used only for related data instances. They have two variations: events in unexpected order ( e.g. breaking rhythm in ECG) and unexpected value combinations ( e.g. buying large number of expensive items).
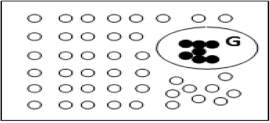
Figure 4: Collective anomalies
2.1.4 Horizontal anomalies
According to Gao J et al. [32], another type of anomaly is evolved in social networks, which is called horizontal anomaly which depicts the presence of anomalies based upon the different sources of data available. For example, the same user may be present in different communities on different social networks. For instance, the horizontal anomaly detection is that for a better business marketing, one wants to find out the person who bought quite different items compared to his peers in the same social community by analyzing data from users purchase history and friendship networks.
2.2 Based on static/dynamic nature of network/graph structure
Considering the network structure being used Savage D et al.[33] classified anomalies as being either static or dynamic.
2.2.1 Static anomalies
A static anomaly occurs with respect to the remainder of the network ignoring the time factor. As static networks allow the changes to happen slowly over time, so only the current behavior of a node is analyzed with respect to others in the network.
2.2.2 Dynamic anomalies
Dynamic networks such as mobile applications, allow the faster communications and continuous changes in the networks. A dynamic anomaly exists with respect to previous network behavior in which changes occur in the network with the passage of time.
2.3. Based on information available in network/graph structure
Based on the type of information available at a node or an edge of a graph structure, Savage D et al. [33] categorized anomalies as labeled or unlabeled.
2.3.1 Labeled anomalies
Labeled anomalies are related to both the structure of the network and the information gathered from the vertex or edge attributes. There are some other classifications of labeled anomalies:
Static labeled anomalies
When along with the network structure labels on the vertices and edges are also considered, then the anomalous substructures found are referred to as static labeled anomalies. For example, to detect opinion spam which involves the fake product reviews, static labeled anomalies are used.
Dynamic labeled anomalies
Dynamic networks are worked upon by considering the structure of the network at fixed time intervals and treating them in the same way as for a static network. When anomalous behavior in a dynamic network is observed by considering labels of the vertices and edges also then the anomalies observed are classified as dynamic labeled anomalies.
2.3.2 Unlabeled anomalies
No attribute of a node or an edge is taken into consideration for unlabeled anomalies. It only considers the network structure. Unlabeled anomalies is further classified as static and dynamic unlabeled anomalies:
Static unlabeled anomalies
This type of anomaly occurs when the behavior of an individual remains static and the attributes such as the age of individuals involved, type of interactions, and its duration are ignored due to unlabeled nature of the network. Only the pattern of interaction took place is important.
Dynamic unlabeled anomalies
This type of anomaly arises when the dynamic networks that change with time. Dynamic unlabeled anomalies can be found when the behavior of the data object is different with respect to the previous time period relative to the network structure. For example, while considering only the pattern of interactions, there is maximum of six ways in which a maximal clique can evolve: shrinking, growing, splitting, merging, appearing or vanishing [34]. All of these involve studying the network structure with respect to the network structure prevalent at some previous time period.
2.4 Based on behavior
Based on anomalous behavior another two classes of anomalies namely, ‘‘white crow anomalies” and ‘‘in-disguise anomalies” was proposed by Chen et al. [34].
2.4.1 White crow anomaly
As the name implies, it is totally an unusual/uncommon thing. It arises when one data object deviates significantly from other observations. For example, while examining the graduating student record, if a record is found where the age of a student is entered as 140 yr, which is impossible, then it is taken as a white crow anomaly.
2.4.2 In-disguise anomaly
It is considered as a small deviation from the normal pattern, defined by Eberle W et al. [35]. For example, anyone attempting to peep into someone’s social network account would not want to get caught; therefore, he will try to behave in the same manner as a normal user. Such anomalies are recognized through strange patterns, which also include uncommon nodes or entity alterations.
2.5 Based on structural operations on network/graph structure
When dealing with the graphical structures in social networks, anomalies can be classified according to the graphical properties as well. Eberle and Holder [35] classified anomalies according to the following three properties:
Insertion: Insertion deals with the existence of an unexpected vertex or an edge in the graph.
Modification: Modification deals with the presence of an unexpected label on a vertex or an edge.
Deletion: Deletion involves the absence of an expected vertex or an edge. Sometimes, it even incorporates the concept of dangling edges i.e. with the deletion of a particular vertex all the adjacent edges to it may also have been deleted.
2.6 Based on interaction pattern in network/graph structure
Based on the types of interaction pattern and links among nodes in graph anomalies can be categorized in in three ways [36]:
2.6.1 Near Stars/Cliques
As the presence of completely disconnected (Near Stars) or all connected neighbors (Near Clique) in a graph structure is very uncommon so it is considered as anomalies.
2.6.2 Heavy locality
Sometimes heavyweight around a particular area or a group represents suspicious activity and hence it may suggest the presence of anomaly.
2.6.3 Particular dominant links
An unexpected presence of heavy load at a particular node or link as compared to other node6s or links specifies an unusual activity.
3. Output of Anomaly Detection
The main objectives of anomaly detection is to detect data points in data that does not fit well with the rest of the data. But it is often very hard to find training data, and even when we can find them, most anomalies are 1:1000 to 1:10^6 events where classes are not balanced. Moreover, in some cases the most of the data are auto correlated. Hence, the precision of the output predicted from a given model (i.e. how likely it is to be true) and recall (how much anomalies the model can catch) trade-offs are different from normal classification use cases. In general, we consider scores and labels as the output of most of the anomaly detection techniques.
Scores: Scoring technique assigns an anomaly score to each instance in the test data depending on the degree to which that instance is considered as anomaly. Thus the output from this technique is a list of anomalies from a given network which are ranked by their score. Here we can also use a cut-off threshold to select the anomalies.
Labels: This technique assigns a label to each test instance either as normal or anomalous. Scoring based anomaly detection techniques allow the analyst to use a domain specific threshold to select the most relevant anomalies. Whereas this technique provide binary labels to the test instances which does not allow us to make such a choice for threshold detection.
4. Anomaly detection techniques in social networks
The increasing trend of social networks attracted their misuse by a number of malicious individuals as well as in groups. Hence, the detection of anomalous activities becomes the need of the hour. Sometimes, it becomes difficult to analyze the social networks because of their large size and complex nature. According to Singh L et al. [37], it becomes necessary to prune the networks to include only the most relevant and significant relationships. Usually, the presence of an anomaly is considered as a binary property in which anomaly is either present or not, and in some applications, the presence of anomaly is considered by giving the degree of being an outlier to each object in the dataset. As an example, Breunig et al. [38] referred this degree as Local Outlier factor (LOF).
Every online social network has its own structure and nature and there are a variety of techniques to detect anomalous accounts from online social networks. These techniques are evaluated to find the best technique to detect anomalous users from all online social networks like Facebook, twitter etc. The rest of this section will describe the various techniques associated with anomaly detection in OSN.
Based on the data mining approaches there are three techniques that can be used to detect anomalous users from online social networks [39].
- Supervised Learning Techniques.
- Unsupervised Learning Techniques.
- Semi-Supervised Learning Techniques.
4.1 Supervised anomaly detection techniques
Supervised learning techniques are used to model both normal and abnormal behaviors. These techniques require pre-labeled data for anomaly detection classified as normal or abnormal. Different training models are used to identify the normal or abnormal data from the dataset. Supervised techniques work on two approaches:
Training model is compared with the dataset to find analogues data from the dataset that is classified as normal data.
In opposite to above method some anomalous data is compared against training model to find abnormal data from dataset.
4.2 Unsupervised anomaly detection techniques
Unsupervised anomaly detection methods are used when labeled data objects are not available i.e. no predefined labels as ‘‘anomalous” or ‘‘normal” are attached to the data objects.
Unsupervised methods are usually studied as a clustering problem. These methods implicitly assume that the normal objects are a bit clustered forming one or more groups with distinct features whereas anomalies do not seem to behave in this manner. However, sometimes this assumption becomes wrong as many anomalies also make clusters with the similar pattern such as collective anomalies as shown in Fig. 4. So, in that case unsupervised methods work inefficiently by issuing a large number of false alarms especially when the normal objects are variedly scattered.
4.3 Semi-Supervised anomaly detection techniques
In semi-supervised techniques dataset is only labeled with one label as normal. Training model detects abnormal class by itself from dataset [40]. Since they do not require labels for the anomaly class, they are more widely applicable than supervised techniques. So, these methods are used when out of the complete data set only few instances of data labeled as normal are available and from this small amount of labeled data a classifier can be constructed which then tries to label the rest of the unlabeled data.
There are so many approaches based on the three data mining approaches discussed above which are highly helpful in determining anomalies in social networks. Some of the prominent approaches with their advantages and disadvantages are discussed below:
- Proximity based techniques
- Clustering based techniques
- Classification based techniques
- Behavior-based techniques
- Structure based techniques
- Spectral based techniques
- Graph based techniques
4.4 Proximity based (or nearest neighbor based) anomaly detection techniques
The key idea of proximity based approach is, an object is anomalous if it is distant from most point. One of the simplest way to measure whether an object is distant from most point is to use the distance to the k-nearest neighbor and the outlier score of an object is given by the distance to its k-nearest neighbor. However, a number of k-nearest neighbor methods can be used which make use of various measures such as distance, density and other similarity measures to determine the proximity between the nodes. Proximity-based methods can be mainly classified into the following two categories:
4.4.1 Distance based
Computes the anomaly score by using the distance of a data object to its k neighbors.. Distance-based anomalies are considered as ‘‘global anomalies”. Generally, Euclidean or Mahalanobis distance is taken as the distance metrics.
4.4.2 Density-based
Density-based approaches work by comparing the density of an object with density around its neighbors and computes anomaly score by using the relative density of each data object. For a normal object, both densities are assumed to be same whereas for anomalous objects they are different. The concept of relative density is often used to measure the degree of anomalous behavior of an object. Density-based methods overcome the difficulties associated with distance-based methods in detecting local anomalies.
4.5 Cluster based anomaly detection techniques
As stated by Berkhin [41], clustering is considered as an unsupervised learning of a hidden data concept. Cluster-based methods follow a simple assumption that usually anomalies either belong to a small sparse cluster or do not belong to any cluster whereas the normal objects are part of large and dense clusters. This approaches consider the presence of anomaly in the following three cases:
- If the object does not belong to any cluster.
- If the distance between object and cluster to which it is closest is large.
- If the object is a part of a small or sparse cluster, then not only the object but all the objects belonging to that cluster are considered as anomalous.
Clusters of the data objects can be constructed using numerous methods such as K-Means, K-Medoids [42] for small data sets and CLARA [43], CLARANS [44] for large data sets and BIRCH [45] Chameleon [46] for performing macro clustering on micro clusters.
4.6 Classification based anomaly detection techniques
Classification is defined by J. Han [47] as a supervised method with two steps: a learning step and a classification step. In the learning stage a trained set of labeled data instances are used to construct a classification model and in the classification step, the constructed model is used to predict the class labels for the data. Both the steps are respectively stated in the training and the testing stages. Classification based approaches can use either a one class model [42] or a multiclass model.
One-class model help to identify new anomalous objects that are far from the other anomalous objects present in the given training dataset and the multiclass model is used when the available data objects not only belong to a single class but to multiple classes. Some of the examples of one class models used for anomaly detection are one-class SVM [48], Gaussian model description (GAUSSD) [42], Principal component analysis description (PCAD) [42], Parzen window classifier (PWC) [42] etc. In each of them, a decision boundary is set up. The data objects falling outside the decision boundary are treated as anomalous [49].
4.7 Behavior-based anomaly detection techniques
Behavior-based techniques handle the behavioral properties of the users such as number and content of messages, number of likes or comments on a post, duration of a conversation, the content of the items shared, the status of the users etc. Some of the popular behavior-based techniques are discussed below.
4.7.1 Content-based filtering
Content-based filtering is one of the prominent and well-known behavior-based approaches in which anomalous behavior is detected by looking at the internal content of the sent and received messages. Vanetti et al. [50] proposed a Filtered Wall system in which certain set of filtering rules were used by the users to avoid unwanted and irrelevant posts from their walls. A Blacklist (BL) may be created using these filtering rules in which a number of constraints are imposed like ‘constraint on message creators’, ‘constraints on message contents’, and ‘action taken in the form of blocking, publishing or notification’ to handle attack. However, some smart malicious users are intelligent enough to be a fool and deceive others by behaving similarly to the legitimate users.
In social network scenario, two famous attacks, called Sybil attacks and cloning attacks are quite popular nowadays [51]. Though a number of techniques have been projected to handle such type of attacks yet most of them seem to fail because of one or the other reason. Some of the simple techniques such as clustering coefficient (CC) and voting scheme are botched by the spammers by behaving or creating a similar network structure to that of a normal user. In Clustering coefficient method, for normal users the value of clustering coefficient is high whereas that for spammers is close to 0. But in order to present themselves as legitimate, the spammers increase their CC value by making the neighborhood structure similar to that of the genuine users. Similarly, in voting schemes the illegitimate users make a number of fake profiles to increase the voting of a target post in the form of likes, views etc. or to avoid being classified as spam during voting. Even the advanced techniques such as honeypots proposed by Dagon D et al. [52] to detect the spammers fail to attract anomalous users in most of the situations.
4.7.2 Principal Component Analysis
Recently, an unsupervised statistical anomaly detection technique known as Principle component analysis (PCA) was used by Viswanath et al. [26] to detect the anomalous behavior in individuals. Unlabeled Facebook dataset was used and a number of fake and compromised users were identified. The criteria for normal and anomalous distributions were judged by observing the ‘like’ activities of the users, such as by studying the pages ‘liked’ by a user or the number of posts/pages liked by the user at a particular time period. Besides, a significant contribution made by them was the detection of click spams which is highly prevalent nowadays in ads where the users are unintentionally made to click on the spam links which seem to be genuine or some sort of malware hacks a person’s account and clicks ‘likes’, posts comments or reviews without the knowledge of the user. By experiments, it was inferred that most of the clicks on such sites were done by anomalous users. Xiao et al. [53] used the profile information of a user to detect fake accounts in online social networks using certain supervised machine learning techniques for feature extraction and cluster building. It is one of the efficient and faster method so far to identify fake accounts
4.8 Structure-based anomaly detection techniques
Structure-based methods work on the basic principle of using structural properties to find out the normal and anomalous users by checking their charateristics. A particular graph metric is figured out for different nodes or structures and the nodes showing different values than other users are considered as anomalous. The properties or metrics used may range from the simple properties such as the number of nodes, edges to highly complex centrality measures. Just like supervised learning, here also a predefined normal pattern is already known and any deviation from that known pattern depicts the anomalous behavior.
The structural properties have been used by most of the researchers working in social network domain to define a number of new approaches for identifying anomalies in online social networks. As an example, Link mining, used by Getoor and Diehl [54] studies the structural properties of the networks to predict different behaviors of individuals in social networks. They covered eight link mining tasks with their respective algorithms and grouped the defined tasks into three categories, namely object-related, link-related and graph-related. By analyzing the association between different nodes it is usually found that the linked objects often have a set of correlated attributes. In other words, connectivity of two users can be checked by examining the common properties and what is usually observed is that the objects sharing some sort of common features are often found to be linked with each other. However, most of the structure based link prediction methods show poor performance because of the assumption of prediction of future relationships likely to occur [55]. Earlier Rattigan et al. [56] proposed another advanced task such as anomalous link discovery (ALD), which involve only the prediction of anomalous relationships rather than all the involved relationships. It was seen that almost every prediction model performed quite well for ALD.
In social networks, link prediction is highly useful for detecting friendship links between different users as such techniques are a good way to examine connected, missing and corrupted links [57]. These techniques help to identify dynamic unlabeled anomalies by predicting future events and analyzing previous network behavior which is a prerequisite for dynamic anomalies. Shrivastava et al. [58] proposed a generic approach for detection of attacks, named as Random Link Attacks (RLAs). The basic motive behind such an attack resembles that of the Sybil attacks. These attacks are quite prominent in email spams, virtual marketing etc. with a fact that the victims are chosen randomly with each one having the equal probability to be a victim. This helps to analyze and detect the attacks efficiently as for an attacker by assuming that the structure of a set of random nodes in its neighborhood will be quite different from that of a good node. A set of two properties namely, a clustering test and a neighborhood independent test are conducted on the suspicious nodes which after creating groups mark them as anomalous. Two heuristic algorithms GREEDY and TRWALK algorithm were proposed to detect the attackers.
Many already existing node-based and egonet-based features were studied recursively by Henderson et al.[59]. Some aggregate values were calculated on the already existing characteristics. Neighborhood information was retrieved using both node and egonet-based features and behavioral information was extracted using recursive features. Akoglu et al. [36] utilized another structure-based approach in which a number of pattern and law discoveries were used to detect different types of anomalies in social network graph. To spot some abnormal nodes especially in weighted graphs an Oddball algorithm was proposed by them. A set of features were grouped into certain set of carefully chosen pairs and anomalous behavior was analyzed by examining the group structure. Groups were formed where the patterns of normal behavior (power laws) were observed and the points deviated from discovered patterns were considered as anomalous. A number of anomalous relationships were also observed namely Near Stars or Near Cliques, Heavy Vicinities and Dominant Edges. Hassanzadeh et al. [60] used the power laws defined in Oddball algorithm to analyze the relationship among various social network metrics, thereby detecting the anomalous relationships between different users. Among the different metrics used it was seen that the relationship between number of edges and average betweenness centrality of a user’s direct neighborhood helped to better predict the anomalous nodes. Similarly, Rezaei et al. [61] used the same approach for some Twitter dataset and predict Near Star/Clique behavior by analyzing the number of nodes and edges behavior.
4.9 Spectral anomaly detection techniques
Spectral anomaly detection techniques help in detecting anomalies using some spectral characteristics in the spectral space of a graph. Different complex measures such as eigenvalues or eigenvectors applicable to the adjacency matrix [13] or different hyper graph algorithms used for Laplacian graphs [62] are focused on these methods. In most of the techniques, a social network graph is partitioned into different groups or communities and this partitioning is done either by eliminating the links between different nodes or by using certain clustering/classification algorithms and measures. Even some of the advanced techniques use the structural concept of centrality. For example, community structures were worked upon by Girvan and Newman [63]. As shown in Fig. 5, communities in the form of different friendship groups were created in which the strength of links between the nodes within a community or friendship group is dense whereas among different groups is sparse.
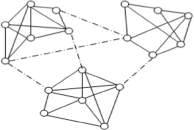
Figure 5: Friendship links depicting centrality also
The concept of betweenness centrality formulated by Freeman [64] is modified to work for edges instead of vertices to find the number of shortest paths between a set of vertices that pass through the edge under consideration. The edges with the high value of betweenness centrality state the points where a network is expected to break and hence are separated. Generally, in online social networks, high betweenness centrality is found to be at the intersection of densely connected network groups. As a result, a number of significant groups could be determined by removing the set of links from a graph, a concept also used by Newman [65]. Ying et al. [13] identified the malicious nodes by computing the spectral coordinates or the spectra i.e. the eigenvalues or eigenvectors for both the normal and anomalous user with a special reference to RLA’s. The use of RLA’s was stressed upon because of the absence of prior knowledge regarding which node is the attacker and which one the victim node. The presence of fake links or nodes affects the value of the graph spectra. Spectral coordinates of a victim node are used to analyze the interdependency between the victim and the attacker nodes, thereby calculating the spectral coordinates for attacking nodes. It was observed that malicious users govern the attack set and each attacking node is linked to a number of victim nodes as shown in Fig. 6.
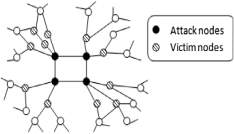
Figure 6: Describing relationship between attacking and victim nodes
4.10 Graph-based anomaly detection techniques
Based on the nature and type of anomaly being studied a variety of graph-based techniques have been proposed and implemented in the social network domain. Savage et al. [33] surveyed on different techniques for each of the static/dynamic unlabeled/labeled anomalies. For detecting dynamic unlabeled anomalies some new techniques such as Bayesian analysis and scan statistical approaches (mainly applicable to hyper-graphs) are used. In case of labeled anomalies, a number of techniques have been proposed for static and dynamic networks. As an example, for the detection of opinion spam a belief propagation method has been applied which deals with a set of hidden labels. Another approach called Trust Rank were proposed by Z. Gyöngyi et al. [66]. The fundamental principles behind this method is that trustworthy pages are unlikely to be linked immediately or within a predefined range to spam pages. One of the prominent methods employed for such static labeled anomalies is the use of Information theory, a quantitative measure such as entropy to detect the anomalies. In most of the approaches, the network structure is considered as static for a fixed time period and in order to add the dynamic concept the behavior of different nodes/modules is compared at different time intervals. Akoglu et al. [5] also surveyed on different graph-based anomaly detection methods for static/dynamic and labeled/unlabeled constraints. In each network structure, different quantitative and qualitative techniques have been categorized into different sub-modules such as structure-based, window based, community-based and feature based. Moreover, researchers have described a number of real-world applications where graph-based anomaly detection methods could be fit, for example, opinion spams, auction networks, social networks, telecommunication networks, cyber crimes, security networks, trading networks etc. Recently, there has been an inclination toward detecting anomalies in dynamic networks. So, a number of researchers are adding dynamic concept into their research work. For example, a number of anomaly detection techniques especially related to dynamic networks are recently surveyed by Ranshous et al. [67]. For instance, a scoring function is used to identify various types of anomalies. Categorization of anomalous behavior is based upon the scoring function being used along with the application area under consideration. Vigliotti and Hankin [68] used the most significant and pertinent subset of nodes to detect anomalous patterns in dynamic networks. In their work, the experiments were performed on the temporal networks.
Lately, community outliers have gained much attention and a number of approaches have been proposed for them. Harenberg et al. [69] studied various disjoint and overlapping community detection techniques used in large-scale networks. Disjoint communities involve the participation of an individual node in at most one community whereas in overlapping communities a node can participate in multiple communities. For the detection of disjoint communities different clustering or graph partitioning algorithms are frequently used. Similarly, the detection of overlapping communities makes use of various block modeling, clustering or clique extraction methods. Gao et al. [70] also worked a lot in the field of detecting community anomalies differentiating them from local and global anomalies. A simple approach to detect community anomalies is to make use of the approaches used for both the local and global anomalies i.e. DNODA (for local anomalies) and GLODA (for global anomalies).
Gao et al. [70] proposed an advancement in the above approach by integrating both the network and data object information to detect the community anomalies. The proposed approach is called Community Outlier Detection algorithm(CODA) which makes use of a probabilistic mixture model designed for multivariate data objects (objects with multiple attributes). Statistical anomaly detection approaches were used to detect the community anomalies where different distributions were analyzed on the associated data and it is assumed that normal data objects will follow the defined distribution whereas anomalous objects will deviate from it or follow some other distributions. A set of hidden variables for data objects and Hidden Markov Random Field (HMRF) for the network links are worked upon by the defined ICM and EM-based algorithms. In order to make it more effective a set of hypergraph parameters like, threshold (indicating few anomalies for its high value and more anomalies for the low value), link importance (for the prediction of confidence level), number of components(small determining global anomalies and large the local ones) were also defined and used.
Table 1 summarize the advantages and disadvantages of different anomaly detection techniques that has been discussed in this section.
Challenges in Social Media Anomaly Detection
Most existing approaches to anomaly detection suffer from a series of following shortcomings:
- Sensitiveness: high false alarm rate
- Interpretation: statistical test results with very limited insights about the detected anomaly
- Scalability: challenging for high-dimensional streaming data.
- Heterogeneous data with rich and complex information
- Beyond the typical iid assumptions
- Very limited labeled examples or benchmark datasets
- Varieties and dynamics in anomalies
Besides, there are some other challenges especially for group anomaly detection:
- Two forms of data co-exist in social media: one is the point-wise data, which characterize the features of an individual person. The other is pair-wise relational data, which describe the properties of social ties. So, it is important to take into account both point-wise and pair-wise data during anomaly detection. For example, teams with the same composition of member skills can perform very differently depending on the patterns of relationships among the members [97].
- Group anomaly is usually more precise than an individual anomaly. At the individual level, the activities might appear to be normal [98], but when we consider a group the same activities may appear as abnormal. Therefore, existing anomaly detection algorithms that deal with individual or point anomaly usually fails when it is related to a group.
- Empirical studies in social media analysis suggest the dynamic nature of individual network positions [99]. People’s activities and communications changes constantly over time and we can hardly know the groups beforehand. Thus developing a method that can be easily generalized to the dynamic setting is critical to anomaly detection that evolves social media data.
This paper reviews the basic concepts of anomalies, different types of anomalies in social networks and various possible anomaly detection techniques with their advantages and disadvantages. In this survey we have tried to provide a detail discussion on different ways in which the problem of anomaly detection has been formulated in literature, and also have attempted to give an overview of the huge literature on various techniques. As it would have been very difficult to cover each and every techniques in the review paper, best efforts have been made to cover most of the important ones. Ideally, the main purpose of a comprehensive survey on anomaly detection is not only to understand a particular or different existing anomaly detection techniques, but also to provide a comparative study on various techniques which we have tried to present in our paper thoroughly. In spite of enormous work that has been done so far in anomaly detection domain there remains a number of shortcomings that could be addressed and worked upon in future. There are also few works that have been done so far on contextual and collective anomaly detection techniques in several domains so there are huge scopes for development of new techniques and get insights in this area especially using graph theory. Another upcoming area where anomaly detection is finding more and more applicability is in complex systems. An example of such system would be an aircraft system with multiple components. Anomaly detection in such systems involves modeling the interaction between various components [2]. There also remains a scope for the exploration of graph metrics in behavior based, structure-based or spectral based anomaly detection techniques that could be used to detect some new kinds of anomalies present in online social networks which is still undiscovered.
Cite This Work
To export a reference to this article please select a referencing stye below:
Related Services
View all


Related Content
All TagsContent relating to: "Social Media"
Social Media is technology that enables people from around the world to connect with each other online. Social Media encourages discussion, the sharing of information, and the uploading of content.
Related Articles

DMCA / Removal Request
If you are the original writer of this dissertation and no longer wish to have your work published on the UKDiss.com website then please: