Improvements of the Upper Mahiao Power Plant Organic Rankine Cycle Efficiency
Info: 10624 words (42 pages) Dissertation
Published: 10th Dec 2019
Tagged: Environmental Studies
Improvements of the Upper Mahiao Power Plant Organic Rankine Cycle Efficiency
Abstract
The Upper Mahiao Power Plant (UMPP), a geothermal binary plant operating in Organic Rankine Cycle (ORC), has two problems that affect its efficiency. One is the effect of the ambient temperature, wherein actual temperature is normally higher than the design temperature. Second is the effect of Hot Air Recirculation (HAR) and wind in the pentane loop system. The fins of the bottom layer of the Air Cooled Condenser (ACC) tubes are damaged and dirt hanging on the bottom of the tubes restricts the air flow and reduces the cooling efficiency.
On the effects of ambient temperature, this project aims to investigate the effects of elevated ambient temperature and create a model of one ORMAT Energy Converter (OEC) from UMPP ORC system using simulation software (VMGSim). Data from the simulation will be used for thermodynamic optimization and generate a numerical computation to determine the optimum power output of the ORC. On the effects of HAR and wind, this study will include investigation of the ACC design and configuration.
The calculated effects of elevated ambient temperatures, using power generation as a function of inlet temperature, shows that power generated decreases as ambient temperature increases. The result of the simulation shows that the ambient temperature to yield the optimum power generation is at 26.1˚C. With this, the optimum gross power output of one pentane loop in the OEC is 2.28 MW which is 28% higher than the actual generation. The HAR investigation shows that wind has a significant influence in the performance of the ACC, the performance decreases as the wind speed increases. From the previous studies, the installation of a 3m wind skirt around the perimeter of the ACC increased the performance under windy conditions. Therefore, it is proposed that the same application will be installed on one OEC in UMPP to prevent HAR.
Table of Contents
2.1 Thermodynamic analysis of the pentane loop
2.2 Aerodynamics of air cooled condenser
2.3.1 Ambient temperature model
2.3.2 Optimization of ORC systems using VMGSim
3.1 On the effects of ambient temperature
3.1.2 Model specification and degrees of freedom
3.1.3 VMGSim model validation process
3.1.4 Effects of the ambient temperature in the model
3.1.5 Optimization on the VMGSim model
3.2 On the effects of hot air recirculation and wind
3.2.1 Fouling of the air condenser
3.2.2 Design of wind skirt proposal
Chapter 4. Results and Discussion
4.1 On the effects of ambient temperature
4.1.2 Effects of ambient temperature in the model
4.1.3 Optimization using VMGSim
4.2 On the effects of hot air recirculation and wind
4.2.1 Effect of fouling of the air condenser and airflow restrictions
4.2.3 Effect of wind with skirt
4.2.4 Potential solutions for the effect of wind and HAR
4.2.5 Proposal for experiment with skirt on OEC 11
Chapter 5. Conclusions and Recommendations
List of Figures
Figure 1. Upper Mahiao Main Power Plant Schematic Diagram
Figure 4. Process diagram for an integrated single-flash/binary plant (DiPippo, 2007)
Figure 5. Air-cooled Condenser Classification (Gibbard, 2014)
Figure 7. Measured power loss as function of the ambient temperature (Hopmans, 2015)
Figure 8. UMPP ORC steady state model
Figure 9. Effect of wind on the ACC effectiveness (van Rooyen & Kröger, 2008)
Figure 10. Effect of wind skirt on the ACC effectiveness (van Rooyen & Kröger, 2008)
Figure 11. Power output as a function of ambient temperature
Figure 13. Power production as function of overall cleanliness (UA)
Figure 14. Wind Effects on the Air-Cooled Condenser (Gibbard, 2014)
Figure 16. Wind skirt installation in the OEC
List of Tables
Table 1. Design vs actual ambient temperature
Table 2. Thermodynamic analysis of pentane loop in UM OEC (Hopmans, 2015)
Table 3. Results of VMGSim model validation (Lie, 2015)
Table 4. Design values of the specifications used in the steady state model.
Table 5. Design values of the specifications used in the model validation.
Table 6. Specifications used in varying the ambient temperature.
Table 8. Optimization results using Nelder-Mead method
Table 9. Summary of findings of test run on OEC 11 on November 25, 2016
Nomenclature
Abbreviations
UMPP Upper Mahiao Power Plant
LGBU Leyte Geothermal Business Unit
ORC Organic Rankine Cycle
GCCU Geothermal Combined Cycle Unit
OEC ORMAT Energy Converter
STG Steam Turbine Generator
NCG Non-Condensable Gas
HAR Hot Air Recirculation
ACC Air Cooled Condenser
CFD Computational Fluid Dynamics
VMGSim Virtual Materials Group Simulator
H2S Hydrogen Sulfide
Symbols
S entropy, KJ/kg.K
T hot temperature, oC
t cool temperature, oC
P pressure, kPa
H enthalpy, kJ/kg
X temperature for isentropic let-down, oC
η efficiency, %
ṁ mass flow rate, kg/s
F configuration factor (constant)
U overall heat transfer coefficient, W/m2.oC
A heat transfer area, m2
ρ density, kg/m3
W energy, kW
Q power, MW
V velocity, m/s
Subscripts
1 inlet
2 outlet
bs isentropic value after let-down
gen generator
out power output
con condenser
ph preheater
evap vaporizer
th thermal
vent ventilator
act actual
ref reference
w wind
Chapter 1. Introduction
1.1 Background
The Upper Mahiao Power Plant is a binary plant operated with four units Geothermal Combined Cycle Unit (GCCU) System at 32.33MWe each. One GCCU units is composed of three units ORMAT Energy Converter (OEC) operating on an Organic Rankine Cycle using pentane as the secondary fluid. It is a combination of a back pressure Steam Turbine Generator (STG). In addition, the brine heat energy is recovered in a bottoming binary plant using a separate OEC.
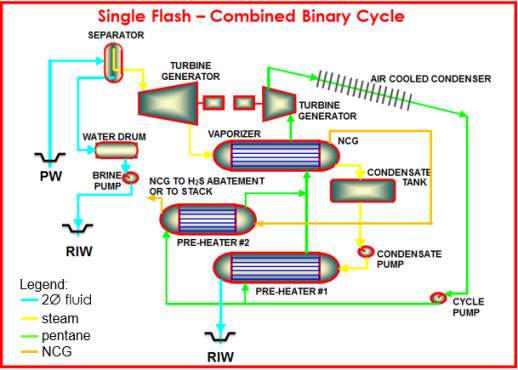
Figure 1. Upper Mahiao Main Power Plant Schematic Diagram
As shown in Figure 1, two-phase geothermal fluid from production wells undergoes separation of brine and steam. The separated brine is pumped back to the reinjection well. The energy from the separated steam is used to heat a pressurized secondary working fluid. The working fluid exits the vaporizer as a superheated vapor and subsequently expanded in the turbine coupled with the generator to produce power. The low pressure working fluid vapor exiting the turbine is condensed in an air-cooled heat exchanger and pumped back to a series of geothermal fluid pre-heaters and back to the vaporizer. The condensed geothermal fluid exiting the vaporizer is pumped back to the heat exchanger and the discharge is transported to the reinjection well or to another bottoming binary plant for optimization. The non-condensable gases (NCG), which is inherent in geothermal fluids, exits the vaporizer and goes back to the second pre-heater and is transported to the hydrogen sulfide (H2S) abatement or stack.
The power plant efficiency has declined over the course of its operation. The major contributing factor considered is the identified problem in the induced draft type air cooled condenser. One is the reduction in power output as affected by the ambient temperature. The air condenser has been designed for ambient temperature of 24.2 ˚C (Table 1).That is the 8% percentile value, while normally a value above 90% percentile would be selected. A consequence of this low design temperature is that the capacity suffers during warm weather conditions.
Table 1. Design vs actual ambient temperature
| T, ˚C (inlet) | T, ˚C (outlet) | |
| Design Ambient Temperature | 24.20 | 42.49 |
| Actual Ambient Temperature* | 25.50 | 43.72 |
*Based on the measurement taken last Nov. 25, 2016
As a consequence of the limited capacity during warm weather situations, questions are raised time and time again about cleaning the air condenser. Since this would be a major and expensive exercise, a balanced decision on this is important. Another concern on the air condenser is that the fins of the bottom layer of the air condenser tubes are damaged, allegedly because of high pressure jetting in the past. As a consequence of this damage, the flow path of the air flow to these tubes and to all downstream tubes might be disturbed. At certain patches, dirt is hanging on the bottom tubes as shown in Figure 2.
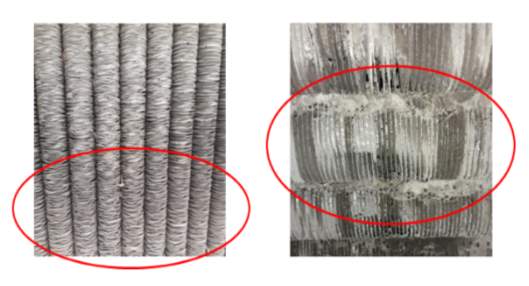
Figure 2. From left to right, (a) damaged fins of the bottom layer of the ACC tubes and (b) dirt hanging on the bottom tubes (Hopmans, 2015)
1.2 Scope and Objectives
This study will cover only one OEC of the UMPP main power plant. Input parameters on the model for the simulation will be based on the UMPP heat and mass balance diagram as of March 22, 1995. Data on actual ambient temperature will be based on the measurements taken on November 25, 2016.
This project aims to improve the efficiency of the UMPP through possible recommendations to address or mitigate the adverse effects of fluctuating ambient temperature and hot air recirculation in the pentane loop. The following areas will be investigated to make use of the available data:
- On the effects of ambient temperature:
- Create a model of UMPP ORC system using simulation software.
- Generate numerical computation to optimize the ORC.
- Recommend best options to improve the temperature.
- On the effects of Hot Air Recirculation (HAR) and wind:
- Investigate the effects of airflow patterns through the ACC.
- Recommend best options to improve the airflow.
Chapter 2. Literature Review
2.1 Thermodynamic analysis of the pentane loop
Understanding the thermodynamics of the pentane loop is essential for plant modelling and plant optimization. First of all, it has to be realized that a let-down of pressure in the turbine results in under-saturation of the pentane. The reason that this differs from steam is the shape of the vapor saturation line. For water, the slope is negative (see thin line in Figure 3) but for pentane which is a retrograde fluid, the slope is positive in the operating temperature range. Consequence of this is that the enthalpy at isentropic condition has to be calculated using a completely different method than for steam.
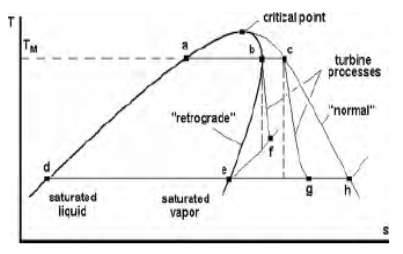
Figure 3. Temperature-Entropy diagram contrasting normal and retrograde saturated vapor curves (DiPippo, 2007)
Considering the Figure 4, a numerical study was conducted to investigate the thermodynamics of the pentane loop in Upper Mahiao (Hopmans, 2015).
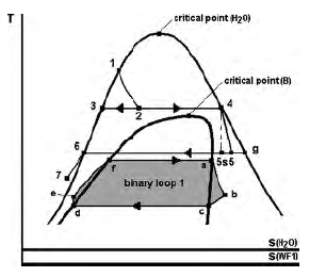
Figure 4. Process diagram for an integrated single-flash/binary plant (DiPippo, 2007)
All properties of pentane at state a, c, d and f were assumed to be known. Using the formula:
Sa = S bs= Sc+∫TcXCpT dT
(1)
In which X is the temperature for isentropic let-down, Tbs, and the subscript bs indicates the isentropic value after let-down. Using a third order polynomial, this integral can be solved analytically. However the resulting formula is implicit in X and requires a numerical method to determine X. Use Newton Raphson formula, this is very stable in this region and iterates in 3 steps.
Xn+1= Xn – F(Xn)F1(Xn)
(2)
Choose initial temperature 5oC above Tc. Once X = Tbs is known, the Hbs can be determined from:
Hbs=Hc+∫TcXCpdT
(3)
whereby Cp is a third order polynomial in T.
Next step is to determine the actual enthalpy Hb and Tb. Hb can be obtained from:
η=Ha-HbHa-Hbs
(4)
The actual outlet temperature can be calculated from:
Hb=Hbs+∫XYCpdT
(5)
X is known now but Y is not. Newton Raphson gives a very quick convergence. Choose initial temperature 5 oC above Tbs.
Duty of the condenser, kW becomes:
DutyC = ṁ×(Hb– Hd)
(6)
Duty of preheater plus evaporator, kW:
Dutyph+vap= ṁ×(Ha– He)
(7)
Power to the pump, kW:
Ppump= ṁ×(Pf –Pd)(ηpump× ρ)
(8)
Power generated, kW:
Pgen = ṁ×(Ha – Hb)
(9)
Net power output, kW:
Pout=Pgen×ηgen-Ppump-Pvent-Pcon
(10)
Thermal efficiency:
ηth=PoutDutyPH+vap
(11)
With these equations, the calculation for one OEC consisting of 4 pre-heaters (two condensate preheaters and 2 NCG preheaters), two vaporizers, two pumps (each with a flow of 61.389 kg/s), three banks of air coolers with a total 27 ventilators (22kW each), one generator with two generator cooling fans are shown in Table 2.
Table 2. Thermodynamic analysis of pentane loop in UM OEC (Hopmans, 2015)
| State | t | T | S (KJ/kg.K) | H (kJ/kg) | η | 79% | |
| a | 95.7 | 368.9 | 1.26094 | 452.564 | Ηgen | 97% | |
| bs | 67.7 | 340.8 | 1.26094 | 412.022 | Ηpump | 75% | |
| bs | 72 | 345.1 | 420.536 | Wpump | 99.17 | ||
| c | 54 | 327.2 | 1.18289 | 385.953 | Wgen | 38.14 | |
| d | 54 | 327.2 | 43.444 | Wout | 31.17 | ||
| es | 54 | 327.2 | 44.050 | Dutycon | 462.99 | ||
| es | 54 | 327.2 | 44.252 | Dutyph+vap | 501.32 | ||
| f | 95.7 | 368.9 | 151.288 | Ηth | 7.61% | ||
2.2 Aerodynamics of air cooled condenser
Air-cooled condensers (ACC) are heat exchangers that provide cooling by passing air over a tube bundle, and then exhausting the heated air to the atmosphere. ACCs are classified into forced draft and induced draft. Forced draft is when the tube bundle is located on the discharge side of the fan; the induced draft is when the tube bundle is located in the suction side of the fan. Figure 5 is the graphical representation for the ACC types.
Although ACCs are effective heat transfer devices, their performance can easily be influenced by air temperature, wind direction, wind speed and proximity of other ACCs and buildings.
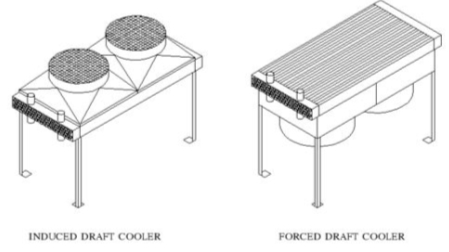
Figure 5. Air-cooled Condenser Classification (Gibbard, 2014)
Air-cooled binary plants are designed to produce the installed capacity of power production at a certain ambient air temperature. This air temperature is the annual mean or average air temperature for the plant location.
In the literature, which mostly originates from the period after the design of the air condenser, it is mentioned that wind reduces the efficiency of the fans dramatically and in steam power plants, trips have been experienced because of wind gusts. In addition, Hot Air Recirculation increases the air flow inlet temperature. Several measures are mentioned to reduce these phenomena such as high air condenser fan deck, a skirt around the fan deck, a screen below the fan deck, and a wind wall above the fan deck.
Many studies have been executed, both experimental and computational fluid dynamics (CFD) give a good overview of the findings and have made an extensive CFD study themselves (Owen & Kröger, 2011). Other studies found that the turbine performance was reduced measurably during windy conditions (Goldschagg, 1999). After extensive experimental and numerical investigations, wind walls were added. Due to the resultant improved air flow pattern, no further trips were experienced and the performance improved dramatically.
Laboratory experiments were conducted (Salta & Kröger, 1995) and found that the effectiveness of a single or multi fan row decreases exponentially if the fan deck is lowered. Their experiments also showed that the volumetric effectiveness of the edge or peripheral fans is always lower than that of the inner fans. Furthermore, their tests also showed that the volumetric efficiency of the ACC can be improved by addition of walkway (skirt) around the fan deck.
2.3 Modeling ORC systems
2.3.1 Ambient temperature model
A study was conducted to investigate the effect of changing the design air temperature has on power generation for an air-cooled binary plant producing power from a resource with a declining production fluid temperature and fluctuating ambient temperatures (Wendt & Mines, 2011). One investigation was on the design case without a geothermal fluid exit temperature limit. In this plant design, the higher ambient temperature design points is characterized by lower working fluid and air flow rates as well as smaller air-cooled condenser, pre-heater, and vaporizer heat exchangers.
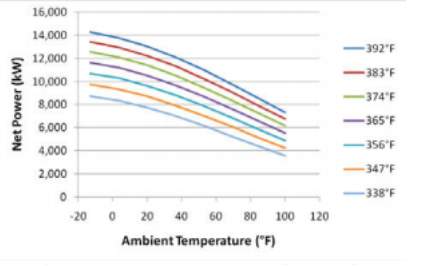
Figure 6. Net power output as a function of ambient and resource temperature without geothermal fluid exit temperature limit (Wendt & Mines, 2011)
As illustrated in Figure 6, the net power output decreases as the ambient temperature increases for every ambient temperature design. As the ambient temperature design is reduced, the maximum net power output is also reduced proportionally. The plant designed for higher ambient temperatures is at a disadvantage at lower ambient operating temperatures due to its inferior ability to reject heat to the ambient in addition to the efficiency penalty sustained when throttling the working fluid flow rate from the more powerful pump to meet the minimum turbine inlet entropy constraint (Wendt & Mines, 2011).
An “ambient temperature model” has been developed for calculating the effect of change of ambient temperature using air condenser air inlet temperature at design heat transfer and at design flow rates of UMPP (Hopmans, 2015).
The UM pentane loop model developed in LGBU, is used to curve fit the energy of condensation and the gross generation power as function of the condensation temperature by varying the condensation pressure. Doing the curve fitting which is the relation of the reaction of the pentane loop to a change in air inlet temperature. This means that the condensation temperature and therefore the system pressure go up as ambient temperature increases.
The power loss is 1.56% per °C increase in the air inlet temperature. This relates very well with the actual power loss as measured in UMPP which is presented by the green line in Figure 7 and presents a loss of 1.5% per °C.
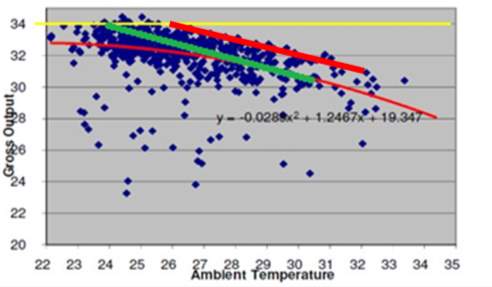
Figure 7. Measured power loss as function of the ambient temperature (Hopmans, 2015)
2.3.2 Optimization of ORC systems using VMGSim
In literature, several studies were conducted to create a steady state and dynamic modelling of an ORC. The steady state model is validated using design data from a geothermal ORC process and results from dynamic model are shown for the purposes of optimization and control system design (Proctor, Yu, & Young, 2013).
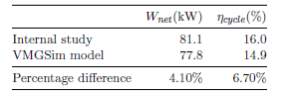
Another study on the optimisation of ORC systems for waste heat recovery purposes was conducted using VMGSim (Lie, 2015). A steady state VMGSim model was constructed to analyse a wide range of working fluids for the analysis and optimisation of the ORC system for both thermodynamic (net power) and thermoeconomic (specific investment cost) parameters across a range of working fluids. The working fluids investigated were R-245fa, R-123, isopentane, n-butane, n-hexane, n-pentane and toluene. The comparison of the different working fluids is crucial because power generated by the turbine is determined by the change in enthalpy of the working fluid as it passes through the turbine.
The VMGSim model was validated against an internal study and showed a 4.1% deviation in net power and a 6.7% deviation in system efficiency (Table 3). Both of these values are very small and do not signal any significant misalignments between the internal study and the constructed model.
Table 3. Results of VMGSim model validation (Lie, 2015)
It was mentioned that the thermoeconomic optimisation performed in this project was not guaranteed to locate the global optimum point. Economic analysis showed that the thermodynamic optimum produces a higher net present value as the larger power generation leads to greater long-term benefits and the analysis completed shows that ORC performance will always be a strong function of working fluid selection, as this heavily influences both the thermodynamic and thermoeconomic properties of the system.
Parameter fluctuations of the heat source temperature, heat source flow rate and cooling fluid temperature can have significant effects on the thermodynamic performance of the ORC system that are highly different to the steady state solution. One proposal to account for this in future projects is to employ a probabilistic approach in measuring the fluctuations at a variety of design conditions, both at the optimum point and at conditions around the optimum to verify the plant’s ability to handle these off-design conditions.
Chapter 3. Methodology
3.1 On the effects of ambient temperature
3.1.1 ORC model using VMGSim
This project will use VMGSim to create a steady state model of the Upper Mahiao Binary Plant OEC. This modelling process will use the built in VMGSim unit operations, thermodynamic properties and fluid packages for pentane which is the working fluid for the Upper Mahiao power plant. Figure 8 shows a schematic of the ORC system as modelled.
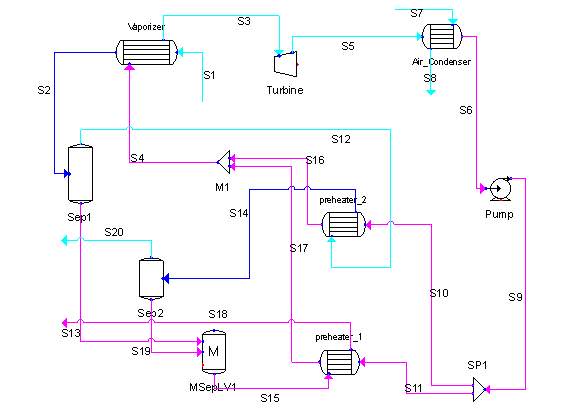
Figure 8. UMPP ORC steady state model
Each of the OECs in UMPP have two pentane loop systems which are designed to produce the same power output and designed with the same temperature and pressure settings. However, in actual measurements, the operating parameters may not necessarily be the same. This model will consider only one pentane loop system for one OEC.
3.1.2 Model specification and degrees of freedom
The steady state model is constructed by connecting unit operations together in the appropriate order. The specifications were based on design temperature, pressure, mass flow rates, power output and equipment efficiency values. The steady state solver works on a unit by unit basis and requires all specifications to meet the degrees of freedom to be able to solve the individual elements in the model. Summary of conditions which is a manual input to the VMGSim is provided in Table 4.
Table 4. Design values of the specifications used in the steady state model.
| Specifications | Values | Temperature, °C | Pressure, kPa |
| Turbine efficiency | 85% | ||
| Pump efficiency | 75% | ||
| S1 | 84916.7 kg/h | 107 | 123 |
| S3 | 95.3 | 540 | |
| S4 | 219600 kg/h | ||
| S5 | 180 | ||
| S6 | 176 | ||
| S7 | 4000000 kg/h | 24.2 | 101.3 |
| S9 | 620 | ||
| S16 | 65 | ||
| S17 | 64 |
The vaporiser is a shell and tube heat exchanger. The secondary working fluid isopentane flows through the tube side while the geothermal fluid flows in the shell side. Composition of the geothermal fluid at the inlet of vaporizer is considered 100% liquid and the isopentane is 100% gas. The inlet temperature of the geothermal fluid uses the actual temperature of 107°C instead of the design temperature of 105.4°C as this fails to solve. It is assumed that there is no pressure drop across the vaporiser on either side, and the efficiency of the vaporiser is 100% considering that all heat lost from the heat source is used in heating up the working fluid. The working fluid exits the vaporiser as a saturated vapour and the heat source inlet conditions remain constant. The tube outlet temperature is set by the pressure (which is set at the turbine inlet). The only remaining degrees of freedom are the working fluid mass flow rate, and the pinch temperature in the vaporiser. Hence there are two degrees of freedom.
The expander is modelled as a turbine with a fixed adiabatic efficiency of 85%. This is the simplest way to model the expander without knowledge of other restricting factors, such as turbine inlet area or other specific-to-equipment data. Other conditions such as the expansion ratio through the turbine and power produced are constrained by the specification of other equipment. Therefore there is no degrees of freedom.
The UMPP ORC has an air-cooled condenser but in the model, a shell and tube heat exchanger was used to reflect the ACC to be able to specify the values of the cooling fluid for heat and mass balance. The working fluid again flows on the tube side of the exchanger while air flows on the shell side. The ACC inlet temperature is based on the design ambient temperature of 24.2°C and pressure of 101.3 kPa. The key assumptions considered in modelling the condenser is that there is no pressure drop across the shell or tube sides of the condenser, the efficiency of the condenser is 100%, the working fluid exits the condenser as a saturated liquid, and the air inlet conditions remain constant.
There are two preheaters in the system that provides a series of heat up of the working fluid utilising the low temperature geothermal fluids from the outlet of the vaporizer. The working fluid undergo initial heat up in the two preheaters prior to the vaporizer. Preheater 2 tube outlet temperature is set at 65°C while preheater 1 is reduced to 64°C to be able to solve.
The cycle pump is used to pump the cooled working fluid back to the vaporizer. The only assumed specification is the adiabatic efficiency of 75%. Other conditions for temperature and pressure are constrained by the specification of other equipment. Therefore the pump has no degrees of freedom.
3.1.3 VMGSim model validation process
The model was validated by using the actual OEC data measurements last November 25, 2016 and comparing the model output to the behaviour of the power plant.
The VMGSim model design parameters used where the same as the specifications in the steady state model except for the actual data for the vaporizer tube outlet temperature, turbine outlet pressure, air cooling temperature at condenser inlet, preheater 2 tube outlet temperature, and pump efficiency (Table 5). Other conditions are constrained in the specifications of the other elements.
Table 5. Design values of the specifications used in the model validation.
| Specifications | Values | Temperature, C | Pressure, kPa |
| Turbine efficiency | 85% | ||
| Pump efficiency | 40% | ||
| S1 | 84916.7 kg/h | 107 | 123 |
| S3 | 99 | 540 | |
| S4 | 219600 kg/h | ||
| S5 | 170 | ||
| S6 | 170 | ||
| S7 | 4000000 kg/h | 25.5 | 101.3 |
| S9 | 620 | ||
| S16 | 76 | ||
| S17 | 64 |
3.1.4 Effects of the ambient temperature in the model
To investigate the effects of the ambient temperature in the power output, three process variables were considered such as the air cooling temperature at condenser inlet, turbine outlet pressure, and the vaporizer tube outlet temperature
An individual model was created to get the power output of each scenario with inputs of varying ambient temperatures and the calculated values of the other variables. The calculations for the other variables were based on the following equations:
General equation for any heat exchanger:
Q=mcpt2-t1=FUA[T2-t2-T1-t1]/ln[(T2-t2)/(T1-t1)]
(12)
For a single component condenser equation 12 simplifies to:
Q=mcpt2-t1=FUA[t1-t2]/ln[(T2-t2)/(T1-t1)]
(13)
This assumes only condensation and no pressure drop. However there is pressure drop and there is some cooling in the pentane loop (10% gas cooling before condensation). However, for comparisons these assumptions are fair as the trends work in the same direction.
For the pentane vaporizer the equation further simplifies because here there are two condensing/boiling single components fluids.
Q=mcpt2-t1=FUA[Ts-Tp]
(14)
Equation 13 is used to compare the design situation with increased ambient temperature situation by dividing equation (2) for those 2 situations. With UAF and mcp constant this equation becomes:
{T2-t2T1-t1
}actual =
{T2-t2T1-t1}design (15)
With design conditions:
T2 = T1 = 54.05 oC, where: t1 = 24.2 oC, t2 = 42.5 oC (16)
This gives the following equation:
t2 – t1 = 0.613 x (T- t1) (17)
All other VMGSim model design parameters used where the same as the specifications in the steady state model and other conditions are constrained in the specifications of the other elements. The resulting values for the variables as calculated are shown in Table 6.
Table 6. Specifications used in varying the ambient temperature.
| Condenser t1, °C | Vaporizer T2, °C | Turbine P2, kPa |
| 25 | 96.2 | 184 |
| 26 | 96.6 | 189 |
| 27 | 97.0 | 194 |
| 28 | 97.5 | 200 |
| 29 | 97.9 | 205 |
| 30 | 98.3 | 210 |
3.1.5 Optimization on the VMGSim model
The optimization method used is the Nelder-Mead method. It is an implementation of the Simplex or Amoeba method that is a built–in function of the VMGSim. This method is a derivative free method that manipulates variables consecutively and individually to reach an optimum point in the objective function, however, it does not have a global optimum so the results depends greatly on the order of variation of the variables (Lie, 2015).
The manipulated variables identified are the temperatures at the condenser shell input and vaporizer tube outlet and the pressures at the turbine outlet and condenser tube outlet. The objective is to find the maximum output by the changes in these variables using the steady state model of the UMPP ORC created in VMGSim. The optimization method will iterate these conditions based on the set limits of the variables, run the optimizer, then it will show the optimizer values for each variables and present the optimal value for the objective.
3.2 On the effects of hot air recirculation and wind
3.2.1 Fouling of the air condenser
From time to time the question comes up whether the air condenser should be cleaned. This is probably also caused by the fact that the air condenser has been designed for low air inlet temperature. Before a decision should be taken, it has to be investigated whether this condenser is really fouled because from a very superficial observation it does not look very much fouled. A careful decision is essential because overall chemical cleaning is a major and expensive job. It has been decided to do a thorough investigation into the degree of fouling and by studying historical data.
The effect of cleaning can be calculated as follows (Hopmans, 2015):
1c= (ln[(55.70-44.20)/(55.70-26.00)])ref (ln[(T2-t2)/(T1-26.00)])act (18)
And choosing as reference the air inlet temperature of 26°C:
123.76*(-1.1572* T + 436.54) = mcp*(t2-26) = 2530*(t2-26) (19)
The equations (18) and (19) are non-linear and have to be solved simultaneously and numerically.
3.2.2 Design of wind skirt proposal
As a result of the analysis, it was concluded that wind has a significant influence in the performance of the ACC. Low pressure regions and flow distortions contribute mainly to the net decrease in the ACC performance. The performance decreases as the wind speed increases. This is evident in Figure 9 below.
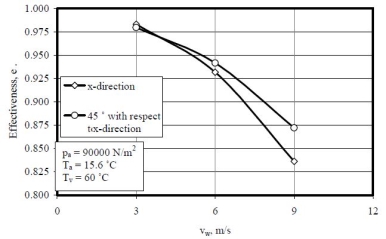
Figure 9. Effect of wind on the ACC effectiveness (van Rooyen & Kröger, 2008)
At a wind speed of 3 m/s in the x-direction, effectiveness is around 98% but decreases to 84% when wind is at 9 m/s. At 45° wind direction (x-y), effectiveness is about 97% at 3 m/s and decreases to around 87% when wind speed increases to 9 m/s.
On the other hand, the installation of a 3-m wind skirt around the perimeter of the ACC increased the performance under windy conditions. Its installation altered the flow into the ACC and prevented hot air from recirculating, especially in the downstream edge fans. The displacement of low pressure areas resulted in an increase in the effectiveness of the fans, thus increasing the effectiveness of the ACC. This is shown in Figure 10 below.
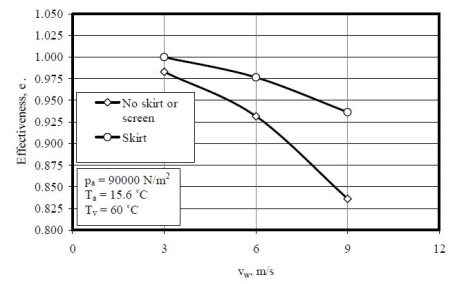
Figure 10. Effect of wind skirt on the ACC effectiveness (van Rooyen & Kröger, 2008)
At a wind speed of 9 m/s, the effectiveness increase to 94% or roughly about 12% greater compared to the effectiveness without the wind skirt. At lower wind speeds, 3 m/s, effectiveness of the ACC becomes 100%.
A Computational Fluid Dynamics simulation was conducted over an A-frame air-cooled steam condenser (ACC) with an elevation of 20m (van Rooyen & Kröger, 2008). In the study, the ACC performance was evaluated when: (a) the wind speed is at 3 m/s, 6 m/s and 9 m/s in the x-direction and x-y direction (45°), and (b) the wind speed is at 3 m/s, 6 m/s and 9 m/s in the x-direction and the ACC was installed with wind skirt.
The results of the effect of wind skirt on the ACC effectiveness (van Rooyen & Kröger, 2008) and the CFD study (Owen & Kröger, 2011) will also be the basis to identify the installation of wind skirts around the OEC perimeter that will improve the ACC efficiency by minimizing hot-air recirculation and increasing the volumetric efficiency of the ACC fans.
Chapter 4. Results and Discussion
4.1 On the effects of ambient temperature
4.1.1 VMGSim model validation
The model was validated by the comparison of two models with different input of specifications, one is using the design values and the other is using the actual measurements from the UMPP binary plant.
The five process input variables represent the major disturbance variables expected to impact the plant generation output. The key objective is to compare the power output of the design and the model. The design power output as modelled was higher than the original design by 12% and the actual power output as modelled was higher than the actual power output measured in the plant by 29%. These results are shown in Table 7.
| Specification | Pump η | Condenser t1, °C | Vaporizer T2, °C | Turbine
P2, kPa |
PH 2, T2, °C | Q, MW |
| Design | 75 | 24.2 | 95.3 | 180 | 65 | 1.92 |
| VMGSim Model (Design Specs) | 75 | 24.2 | 95.3 | 180 | 65 | 2.15 |
| Actual | 40 | 25.5 | 99 | 170 | 76 | 1.77 |
| VMGSim Model (Actual Specs) | 40 | 25.5 | 99 | 170 | 76 | 2.28 |
Although both of the power output results in the model have higher values, this indicates that the model have valid results especially when the input variables were solved in the simulator.
4.1.2 Effects of ambient temperature in the model
The process simulation using VMGSim was done to investigate the power output as a function of varying the ambient temperature and the subsequent effects of the varied ambient temperature on the vaporizer temperature and turbine and condenser pressure. The results of the power output for individual model are shown in the Figure 11.
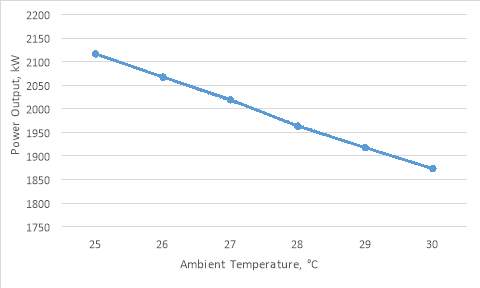
Figure 11. Power output as a function of ambient temperature
The pentane system reacts to an increase in ambient temperature by insufficient condensation which makes the pressure in the pentane loop rise. The disadvantage of this pressure increase is the temperature increase in the vaporizer: this reduces the driving force for vaporization. That results in insufficient condensation of steam and therefore in an increase in back pressure in the steam system. That gives an increase in condensation temperature of steam and the driving force is reinstated.
Of course this cannot continue. At a certain moment the control valve in the inlet of the STG starts throttling if the back pressure becomes too high. If the level of pentane in the vaporizer increases too much, the level controller starts throttling the control valve in the discharge of the pentane pump and that really costs production.
4.1.3 Optimization using VMGSim
The air inlet flow rate is set to a constant value for two reasons: the actual air flow in an ORC plant depends on the available fan area, and as its variation as an independent variable would be fairly trivial. Increases in the air flow rate would increase fan area and power required, but would also enable increased cooling in the cycle, resulting in an increase in the net power of the cycle (larger expansion ratio through the turbine). For this model, it was assumed that the volumetric flow rate of air was 4000000kg/h.
The manipulated variables identified are the temperatures at the condenser shell input and vaporizer tube outlet and the pressures at the turbine outlet and condenser tube outlet. With the manipulation of the four variables to get the optimum power output using the steady state model and the actual parameters, at 136 iterations, the optimizer value suggests 26.1°ambient temperature which is higher than the design ambient temperature of 24.2°C. This is contrary to the investigation on the power output as a function of varying ambient temperature where the power increases as the temperature decrease. The results of the VMGSim optimization using the Nelder-Mead method are shown in Table 8.
Table 8. Optimization results using Nelder-Mead method
| Specification | Condenser t1, °C | Vaporizer T2, °C | Turbine
P2, kPa |
Condenser, P2, kPa | Q, MW |
| VMGSim Model (Actual Specs) | 25.5 | 99 | 170 | 170 | 2.28 |
| Optimizer Value | 26.1 | 99 | 170 | 170 | 2.28 |
4.1.4 Model limitations
The tendency of the Nelder-Mead method to become stuck on local minima points is the main limitation on the software integration model (Lie, 2015). When performing optimisation, the optimum point that is found depends heavily on the current value of the set variables. The lower limit is set to be the same as the current values while the upper limit is set at the corresponding values calculated in the specifications used in varying the ambient temperature.
Due to this dependence of the optimal solution on the initial values and the range of limitations used in the optimisation process, a brute force method of calculating all data points would be more likely to find the true global optimum. As suggested by an optimisation study (Lie, 2015), solution to this problem would be to utilise a heuristic algorithm that begins at some randomly determined set of initial values and loops through the optimisation process multiple times (Figure 12). This method would be more likely to achieve the global optimum point, although it would also increase computation time.
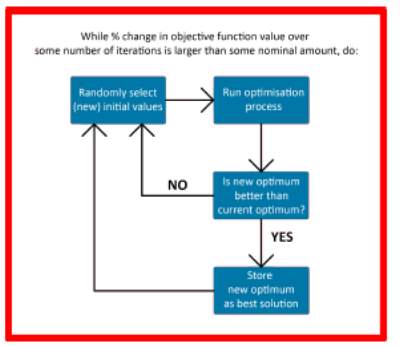
Figure 12. Pseudocode flowchart for a heuristic algorithm used to improve the optimization process (Lie, 2015)
One further limitation of the model is the fluctuation of thermodynamic properties of the streams, in particular, fluctuations in the heat source and the cooling air temperatures. The temperatures of the heat source and cooling air are instrumental in determining the total amount of energy available for extraction by the ORC system, and hence can greatly affect the power output from the system. For this model, the temperature of the heat source is considered constant.
The effect of the air temperature fluctuations have already been minimised by using the design temperature of 24.2°C and maximized using the high temperature of 30°C for the cooling air inlet. Typically, air temperature in LGBU fluctuates between 25°C and 33°C depending on the time of day and season of year. This means the actual air temperature is, for the most part, higher than the 24.2°C design temperature used in the model.
Lower air temperatures would increase the amount of available energy to be extracted from the working fluid by reducing the low end pressure to meet the heat balance across the condenser (Lie, 2015). Furthermore, a lower air inlet temperature would mean a lower air flow rate is needed to achieve the same degree of cooling of the working fluid, reducing power used by the fans to draw in air. The fixed high temperature inlet air provides a conservative estimate on the actual power produced by the cycle.
4.2 On the effects of hot air recirculation and wind
4.2.1 Effect of fouling of the air condenser and airflow restrictions
The calculations on the fouling effects using equations (18) and (19) results in the graphs presented in Figure 13.
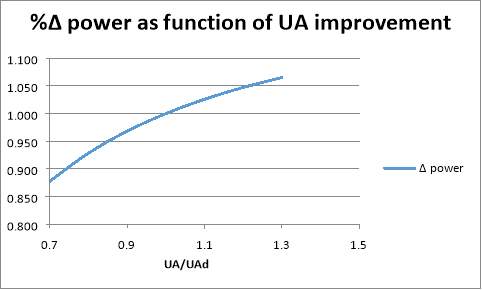
Figure 13. Power production as function of overall cleanliness (UA)
An important consequence of the general fouling model is that the air exit temperature decreases as fouling increases. This is not what is observed in the actual condition in the binary plant and also there is no general fouling on all tubes of the ACC. So this model is not further used for the conclusions and recommendations.
4.2.2 Test run results
On November 25, 2016, a test run was executed on UMPP OEC 11. During the test run, the air condenser air inlet temperatures and the fan outlet temperatures were measured. Using the “ambient temperature model” it was proven that under those circumstances the unit could not produce more than 3168 kW (generator efficiency at 97%). The calculated airflow was only 65% of the design air flow. The actual output was 2977 kW (wind gusts were observed and these are not included in the model). But the design gross output at these conditions is 4162 kW which is 1 MW more than the calculated 3168 kW from the performance run and 1.2 MW more than the actual gross output.
Table 9. Summary of findings of test run on OEC 11 on November 25, 2016 (Hopmans, 2015)
| t air in | t air out | work (kW) | ∆ work (kW) | Q
(kW) |
|||
| design ambient temp | 24.20 | 42.49 | 4379 | 0 | 4248 | ||
| actual ambient temp | 25.50 | 43.72 | 4291 | 88 | 4162 | ||
| actual inlet temp (HAR) | 29.01 | 47.06 | 4051 | 240 | 3929 | ||
| effect of restricted flow | 29.01 | 56.10 | 3266 | 785 | 3168 | ||
| actual output (average) | 2977 | ||||||
Detailed calculations showed that 88 kW was lost due to a higher than design ambient temperature, 240 kW due to HAR and 785 kW was lost due to restricted air flow (Table 9). The restricted flow could be caused by mal-performance or wrong settings of the fans or by the restriction of the flow by the bottom layer bent and plugged finned tubes.
4.2.3 Effect of wind with skirt
Hot Air Recirculation (HAR) and effect of wind on ventilator efficiency are discussed and based upon CFD studies in literature, two experiments have been suggested to monitor the HAR and effect of wind. Among the problems which are the effects of wind on the ACC are:
• Wind increases the risk of HAR:
- the plume of hot air rising from the ACC is pushed sideways which makes recirculation on the downwind side of the heat exchanger more likely and the hot air also has the potential to travel to another ACC;
- it creates a low pressure area on the downwind side of the heat exchanger. There is downward movement of air and the hot buoyant air plume is drawn back into the ACC inlet, increasing the effective temperature of the cooling air with a corresponding reduction in heat rejection rate, at the same time increasing the instability of the air flow in the ACC inlet. Figure 14 below is a visual representation of these effects.
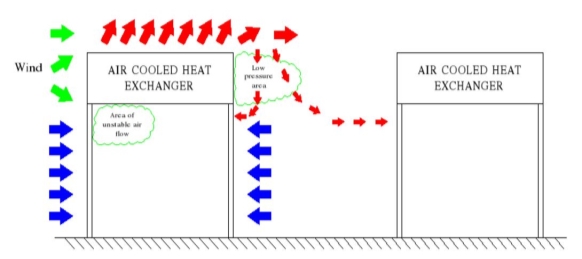
Figure 14. Wind Effects on the Air-Cooled Condenser (Gibbard, 2014)
• Decrease in air mass flow rate through the system. Fan performance is reduced due to distorted inlet air flow conditions (van Rooyen & Kröger, 2008). Significant results of the project are the following:
- Fan performance is reduced (decrease of air mass flow) due to distorted inlet air flow conditions.
- The increase of volumetric effectiveness due to the addition of the skirt is more evident at lower platforms. (The assumed platform was at 20 meter.)
- The upwind peripheral fans are more sensitive (lower efficiency) to wind.
- The calculation did not indicate Hot Air Recirculation because of the 10 meter high wind wall.
- No major effect of a screen was found in this study, which has something to do with the high wind wall used, as other studies find the screen to be effective.
4.2.4 Potential solutions for the effect of wind and HAR
If no wind wall, skirt of screen is installed, HAR can be explained from Bernoulli’s principle:
(V32-V12)/2 + (P3-P1)/ρ +g(z3 –z1)=0 (20)
So P3-P1 is negative if v3 > v1 because z3>z1. So velocity of air to the condenser area must be low and that is the reason why the platforms are nowadays very high (20 meter and not 8 meter).
According to several studies the skirt is very effective in windy conditions and the width has to be 3 meter (Figure 15). The reason is that it prevents disturbances at the peripheral fan. These disturbances are primarily low pressure areas in the inlet of the throat of the forced fan. Low pressures are reducing the capacity of the fan (increased head). The skirt straightens the flow pattern to the inlet of the fans, thereby normalizing the pressure profile.
4.2.5 Proposal for experiment with skirt on OEC
Some authors have found positive effects of a screen that reduces the velocity near the entrance of their condenser. So v1>v2 therefore p2>p1 which helps the fan. However it increases v1 and therefore has to be monitored carefully. This requires the screen not to be too long, maybe 0.4 meter.
Since the skirt and the screen can easily be tested it is suggested to do that on one OEC. A wind wall is not logical in Philippines due to frequent occurrence of typhoons with strong winds.
With the positive results in the previous studies (van Rooyen & Kröger, 2008), it is proposed that one (1) OEC in UMPP will be installed with a 3m wind skirt around its perimeter.
The material to be used for the experiment is tarpaulin: it is affordable, light-weight but rigid, and can easily be kept during inclement weather.
The tarpaulin will be attached to scaffoldings. This is convenient because it will be easier to dismantle the set-up during inclement weather.
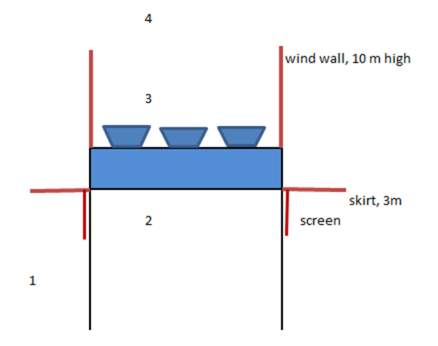
Figure 16 below shows the diagram for the experimental set-up.
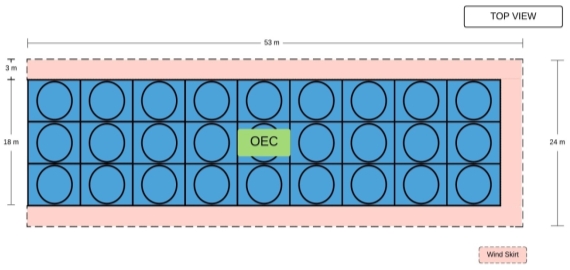
Figure 16. Wind skirt installation in the OEC
Chapter 5. Conclusions and Recommendations
5.1 Conclusions
In this project, a steady state model of the ORC system of the Upper Mahiao Binary Plant OEC was constructed. This modelling process will use the built in VMGSim unit operations, thermodynamic properties and fluid packages for pentane which is the working fluid for the Upper Mahiao power plant.
The VMGSim model was validated by the comparison of two models with different input of specifications, one is using the design values and the other is using the actual measurements from the UMPP binary plant. The design power output as modelled was higher than the original design by 12% and the actual power output as modelled was higher than the actual power output measured in the plant by 29%. Both of these values are consistent and acceptable.
The process simulation using VMGSim was done to investigate the power output as a function of varying the ambient temperature and the subsequent effects of the varied ambient temperature on the vaporizer temperature and turbine and condenser pressure. The pentane system reacts to an increase in ambient temperature by insufficient condensation which makes the pressure in the pentane loop rise. The disadvantage of this pressure increase is the temperature increase in the vaporizer: this reduces the driving force for vaporization. That results in insufficient condensation of steam and therefore in an increase in back pressure in the steam system. That gives an increase in condensation temperature of steam and the driving force is reinstated.
The ORC model was optimized using the built-in optimizer in the VMGSim, Nelder-Mead method. The manipulated variables identified are the temperatures at the condenser shell input and vaporizer tube outlet and the pressures at the turbine outlet and condenser tube outlet. With the manipulation of the four variables to get the optimum power output using the steady state model and the actual parameters, the optimizer value suggests 26.1oC ambient temperature which is higher than the design ambient temperature of 24.2oC. This is contrary to the investigation on the power output as a function of varying ambient temperature where the power increases as the temperature decrease.
The ambient temperature increase does not go without cost. Increasing the steam pressure will reduce the STG output with 3.5 MW. And at an air inlet air temperature of 30oC the pentane loop loses another 4.6 MW. So at 30oC a total of 8 MW can be calculated to be lost.
At the existing condition of the UMPP binary plant, it is necessary to accept the fact that the air condenser has been designed for 24.2 oC and not for 30oC because there is no easy solution. With do nothing scenario, the power loss at 30oC is 8 MW for 1 GCCU.
5.2 Recommendations
Historical data are very difficult to analyze for declining performance, because there are many disturbing factors like plant disturbances, curtailment, and other priorities with regard to steam distribution. Many plant visits by several people and supported by many pictures indicate that overall fouling is not the problem. The major problem is the restriction of flow to all tubes because of dirt collected on the bottom finned tubes or maybe lower than design air flow (fan settings). It is therefore suggested to approach the cleaning contractor for a quotation for cleaning the bottom tubes only. Meanwhile, manual cleaning method would be an alternative as it is dry dirt.
It is also recommended to communicate with air condenser manufacturer whether there is a chance that the air flow is restricted due to bent fins and whether this flow restriction can be removed by further bending the fins of the bottom layer. Calculations show that it is not wise to strip the fins of the tubes as it will dramatically reduce UA and therefore also power output.
Pursue the set up a test with a skirt, 3 meter wide and set up a test with a screen,1 meter high. This experiment aims to identify if the installation of wind skirts around the OEC perimeter will improve the ACC efficiency by minimizing hot-air recirculation and increasing the volumetric efficiency of the ACC fans.
References
DiPippo, R. (2007). Geothermal Power Plants: Principles, Applications, Case Studies, and Environmental Impact (Second Edition).
Gibbard, I. (2014). Heat Exchanger Problems – Part 3. Retrieved from https://www.calgavin.com/2014/09/heat-exchanger-problems-part-3/
Goldschagg, H. (1999). Winds of change at Eskom’s Matimba plant.
Hopmans, J. (2015). Ambient temperature model in UMPP.
Lie, M. (2015). Optimisation of Organic Rankine Cycle systems for waste heat recovery purposes.
Owen, M., & Kröger, D. (2011). An Investigation of Air-Cooled Steam Condenser Performance Under Windy Conditions Using Computational Fluid Dynamics.
Proctor, M., Yu, W., & Young, B. (2013). Steady state and dynamic modelling of an Organic Rankine Cycle. Proceedings of the 6th International Conference on Process Systems Engineering (PSE Asia). Kuala Lumpur.
Salta, C., & Kröger, D. (1995). Effect of inlet flow distortions on fan performance in forced draught air-cooled heat exchangers.
van Rooyen, J., & Kröger, D. (2008). Performance Trends of an Air-Cooled Steam Condenser Under Windy Conditions.
Wendt, D., & Mines, G. (2011). Effect of Ambient Design Temperature on Air-Cooled Binary Plant Output. Geothermal Resource Council Annual Meeting.
Cite This Work
To export a reference to this article please select a referencing stye below:
Related Services
View all


Related Content
All TagsContent relating to: "Environmental Studies"
Environmental studies is a broad field of study that combines scientific principles, economics, humanities and social science in the study of human interactions with the environment with the aim of addressing complex environmental issues.
Related Articles

DMCA / Removal Request
If you are the original writer of this dissertation and no longer wish to have your work published on the UKDiss.com website then please: