Influence of Information Systems on Organizational Decision Making
Info: 4299 words (17 pages) Dissertation
Published: 18th Jan 2022
Tagged: Information Systems
Table of Contents
INTRODUCTION
EVOLUTION OF DECISION MAKING
IS ORIENTATION
ANALYTICS IN DECISION MAKING
ANALYTICS 1.0 – THE ERA OF BUSINESS INTELLIGENCE AND TRADITIONAL ANALYTICS
ANALYTICS 2.0 – THE ERA OF ‘BIG DATA’
ANALYTICS 3.0 – THE ERA OF COMPETING ON DATA AND DATA ENRICHED SERVICES
CONCLUSION
REFERENCES
INTRODUCTION
“Information systems is a system to convert data from internal and external sources into information and to communicate that information in an appropriate form to managers at all levels in all functions to enable them to make timely and effective decisions for planning and controlling the activities for which they are responsible” (Lucey, 2005).
The way in which society has transcended from an industrial to a knowledge and information based one has had significant social, economic and cultural impact.
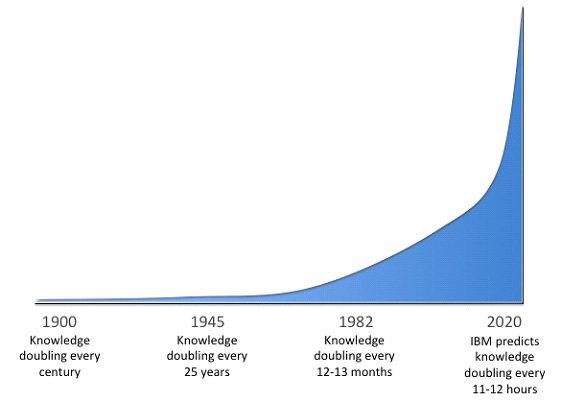
Figure 1. Knowledge doubling curve (Source: Ago, 2018)
The knowledge doubling curve was conceived and created by Buckminster Fuller. It predicted the transition to an information-based era. Noticed that human knowledge was doubled approximately every century. By the end of world war 2 it was noticed that this rate has come down to 25 years.
In the 1980’s with the invention and growth of technology that span of doubling came down to 12 to 13 months and IBM has predicted in the near future human knowledge will double every 11-12 hours.
There are barely few aspects of our lives that aren’t affected by information technology today. And this relationship between Information technology and organizational change has been central to Information systems (Markus and Robey, 1988). The use of information systems has helped changed fundamental business procedures over time (Gurbaxani and Whang, 1991).
There has been a mutual consensus amongst authors that information systems are integral to organizations irrespective of its size and can be used as a tool to improve management by informed decision making (Lucey, 2005; Hicks, 1997; Gordon and Olson, 1985; Ward and Peppard, 2002).
This report will be exploring literature on the application of information systems and technology in the context of how it has opened up newer opportunities to explore in terms of running and managing of organizations over time and how it has improved overall decision making which has been imperative to the organization’s success.
The first section will discuss the evolution and how the approach to decision making changed due to the shift in global economic structure and the internet.
The second section will see the implementation of information systems in organizations, and how the organizations have leveraged information systems over time.
The third section will address how analytics rose to prominence across different eras, and how it became integral to every decision strategical or tactical taken by an organization. Ranging from an advent of an industry type to being used by an organization to run more effectively, to increase sales and reducing costs at the same time.
EVOLUTION OF DECISION MAKING
Decision making is the action or process of making decisions that might be deemed imperative to an organization from a competitive, operational, strategical, tactical and performance standpoint.
Decision making has evolved notably over the last century. In the past, decisions made by managers, who were considered to be the nerve center of the organization was primarily based on intuition. Managers made their decision based on their own preferences among alternatives (OD. 2018). The one characteristic of intuition that was of interest to managers and academics, was its speed. Complex decisions were taken in short intervals of time.
Once the era of globalization commenced, the way in which companies operated changed.
The market got highly competitive and the internet began to make most of the organizations technology based. IT business value model (Melville, 2004) captures 3 factors or environments at a broader level that effects decisions taken a by an organization to capture value and operate efficiently in this era.
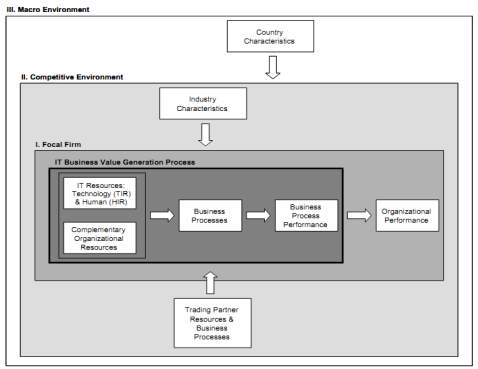
Figure 2. Resource-Based View IT Business Value Model (Melville, 2018)
This model emphasizes on internal and external factors organizations need to take into consideration while making business decisions. An example of this would be: Russia hasn’t evolved into a digital payment form of economy. Hard cash is still used to pay for services and products. This would affect how an organization would operate or accept payment for its value proposition. They will have to make decisions at an operational level and introduce new resources and a collection mechanism of money from a customer.
Management information systems can be used by organizations to accumulate and process data pertaining to these factors and speed up the decision time taken by organizations.
Management information systems can be defined as “a system or process that provides information needed to manage organizations effectively” (Lee,2001).
The information system provides decisions at three levels.
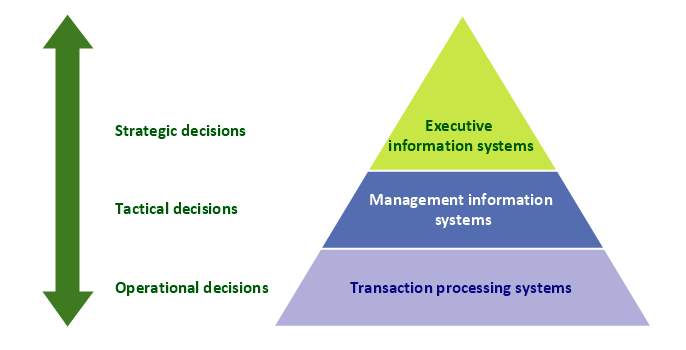
Figure 3. 3 Level pyramid model diagram – Information systems types (Diagram For Decision Making Process In Operations Management, 2018)
Currently, in a world of constant competition and disruptive innovations organizations are in a constant race for enhancing their capabilities to have an edge. Organizations are trying to advance their agility by improving their decision-making abilities as well by making it more analytics driven. Decision making has to be efficient to meet fluctuating market requirements and to capture the most value out of their business model.
IS ORIENTATION
IS orientation means the role of information systems in organizations. An approach to understanding how an organization uses its IS can be done by classifying companies into 3 categories based on its strategy dependency on IT.
- Traditional: IT supports only operations.
- Evolving: IT to support strategy.
- Integral: IT is crucial to strategy.
(Johnson, R.H., and Carrico, S.R., 1989).
Back in the 1950’s and 1970’s, the role of information systems (IS) was to support operational functions within the organization. IS was primarily used in transaction applications, involving accounting transactions. The focus was on IS efficiency and IS effectiveness (Teo and Too, 2000).
With the advent of internet and as information technology (IT) advanced over time, the methods to assess the data and the amount that could be processed increased significantly. Data became more quickly accessible and could be processed at greater speeds. This assisted organizations and managers to report and run data more effectively. Information systems have helped organizations improve their decision making process and help managers reduce the risk involved (Teo and Too, 2000).
“Today it isn’t just online and information firms that can create products and services from analyses of data. It’s every firm in every industry”(Davenport, 2013a).
Davenport stated that its virtually impossible to differentiate yourself from a competitor based on a product alone. With the industry lines becoming blurred since the advent of internet and information technology and communications becoming cheaper coupled with an increasingly competitive business environment. IS has become an analytics and strategic tool over the last two decades. Becoming an analytics competitor helps organizations develop a higher competitive edge.
ANALYTICS IN DECISION MAKING
Using data to analyze and make informed judgments is not a new idea. It has been present ever since economy and decision making has been in existence (Davenport, 2013b).
In recent years, decision making in organizations have been moving towards a more analytical approach over intuition. Hodgkinson and Sadler-Smith (2003) state that the switch between ‘habits of mind’ (intuition) and ‘active thinking” (analysis) is the ultimate skill in today’s organization.
There are essentially three forms of analytics that have been used over time:
Descriptive: using past data aggregation and data mining to provide insight into the past data to address what has happened.
Predictive: Using data, statistical models and forecast techniques to understand predict future behavior.
Prescriptive: Using models and algorithms to describe optimal behaviors and actions.
(Davenport, 2013b)
The way in which this field has evolved in terms of capabilities and volume is of significance. Analytics has evolved and has been perceived differently across different periods in time or eras.
ANALYTICS 1.0 – THE ERA OF BUSINESS INTELLIGENCE AND TRADITIONAL ANALYTICS
The term ‘Business analytics’ has been in use since the 1950’s where decision making was considered to be central to a manager’s job. It was something that consumed most of their time. And in order to take better and wide ranged decisions, managers needed the right set of information (Hicks, 1997).
This was a progressive time, as for the first time transaction data had been recorded, aggregated and analyzed (Davenport, 2013b). To facilitate this a team of internal analysts used to operate from a back office to provide managers with feedback and information analysis to help them make better decisions to run the organization on a day to day basis. New computing tools were used initially by companies large enough to justify this investment. And maximum of the time was invested in data gathering and creating data sets than in analyzing the data, and the process was slow often taking up to a few months. Data warehouses started being set up to query and report the structured data using business intelligent softwares.
This required recruitment of competencies to manage this data. Because of the long and slow analysis time. The primary form of analysis was done on past data and did not provide any explanation or prediction (Davenport, 2013b).
However, traditional models for decision making left out certain key factors. It ignored outside factors and assumed that the human decision makers knew all the permutations for making a decision.
ANALYTICS 2.0 – THE ERA OF ‘BIG DATA’
Organizations have started swimming in larger and ever-expanding sea of data. Where data is too voluminous and unstructured, which cannot be analyzed by traditional methods (Davenport, Barth and Bean, 2012). The term ‘big data’ entails data from a burgeoning number of sources. From clickstream data from the internet, social media profiles, online purchase history, video streaming data, call center voice data, data about biological research etc. big data companies, for example, google alone processes and analyses over 24,000 terabytes worth of data (Davenport et al., 2012). What distinguishes ‘big data’ from small data or data used in analytics 1.0 era is that big data goes beyond internal operations or transaction systems. It processes data from external sources such as the internet, sensors and ad campaigns (Davenport, 2013b). Organizations leverage this information to base their decisions on to create new offerings. They capitalize on 3 factors:
- They pay attention to data flow.
- They rely on data scientists rather than data analysts.
- Moving analytics beyond IT operations and into processes such as inventory, tracking, and production information (Davenport et al., 2012).
The decision to implement new offerings on the backbone of these factors help them in customer acquisition and retention.
Innovative technologies and big data firms had to be acquired and the requisite skills had to be mastered by organizations to implement this. Technologies like Hadoop and noSQL were used to process and store big data as the volume of data was plenty for a single server (Davenport, 2013b). And ‘Cloud’ has been a disruptive form of technology to deliver these big data capabilities and has also been a good source to capture data. Big data can be used to mine existing, old and new data sources constantly for patterns and opportunities to provide predictive and prescriptive analytics. This process requires extensive storage and high processing power and a reconfigurable flexible grid, all of which is provided by cloud.
Data scientists are the key resources in this era to carry forward the decisions based on this form of analytics. These professionals understand analytics, IT, have sound mathematical and statistical skills. This coupled with their high business acumen and their ability to communicate with key decision makers puts them in a position to shape businesses. This is what separates them from traditional data analysts (Davenport et al., 2012).
Examples of how companies use analytics in this era to decide how to create unique customer offerings include:
- Facebook tracks user’s clickstream activities, the people you follow, the pages you follow to make recommendations such as, people you may know, groups or pages you might want to join or like.
- Linked in matches your profile, work experience and skills to suggest People You May Know, Jobs You May Like, Groups You May Be Interested In, etc.
ANALYTICS 3.0 – THE ERA OF COMPETING ON DATA AND DATA ENRICHED SERVICES
When every big organization started noticing how Silicon Valley big data firms began to get more attention via targeted ads, and how they started investing big in analytics driven customer offerings. They decided to follow suit and this was the emergence of the analytics 3.0 era (Davenport, 2013b).
Every firm in every industry that sold assets, worked with customers, and were involved in shipment or delivery operations had data, which it could use to improve its operations.
Analytics 3.0 is when traditional analytics and big data were used together to improve an organizations overall efficiency. This trend can be attributed to diffusion of enterprise IT such as Enterprise Resource Planning (ERP), Supply Chain Management (SCM), and Customer Relationship Management (CRM) systems (Aral et al. 2006; McAfee 2002). These can capture and process vast amount of data as part of their operation, and these capabilities further extended by Business intelligent systems enable a wider set of data analytic tools to be applied to operational data (Brynjolfsson, Hitt and Kim, 2011). Furthermore, the sources and opportunities for data collection outside of operational systems such as Mobile phones, vehicles, factory automation systems, are routinely instrumented to generate streams of data on their activities, making “reality mining” a possibility (Pentland and Pentland 2008).
These enterprise solutions with related technologies allow organizations and its key decision makers to leverage information in one part to improve performance across the firm as a whole (Brynjolfsson, Hitt and Kim, 2011).
This form of data driven decision making is what firms compete on nowadays. By developing products and services around information, it helps them increase profitability and increase customer traction while reducing operating costs. Descriptive, predictive and prescriptive forms of analytics were all used together in this era. The Internet of Things (IoT) industry is a consequence of the analytics 3.0 era. The purpose of IoT is to provide interconnectivity between various devices and is hosted in a private cloud, such as Amazon Web Services. Analysing the data sent to/from amongst which is collected via sensors helps organizations observe various performance indicators which can support better decision making to calibrate and control the further working of the IoT devices. For example: A cloud platform that allows hospitals to record and analyze inventory data meticulously. Remote monitoring and support would help during the unavailability of the equipment having a control check by scheduling and restocking supplies would help to increase efficiency to serve patients (Harshini G, Sreeha M R, 2017).
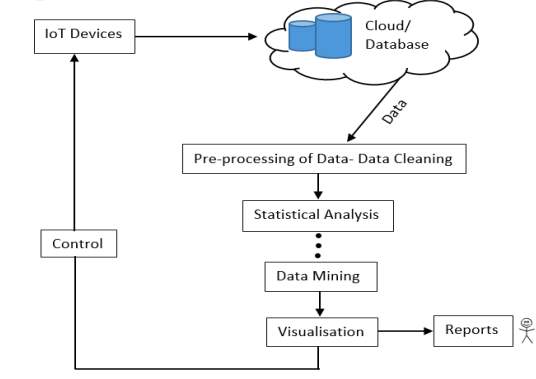
Figure 4. IoT analytics flow chart (Source: Harshini G, Sreeha M R, 2017, Internet of things and analytics)
Some examples of how companies use analytics in this era to make key business decisions:
- General electric. GE is becoming increasingly optimum in their services and providing assets which is a part of their manufacturing business. They use sensors that stream data from turbines, locomotives, medical imaging devices which helps them determine an efficient service interval for these devices (Davenport, 2013b).
- UPS has used analytics in the frontline of its operations. They track package movements of over 16.3 million packages on an average every day. The initiative ORION (On-Road integrated optimization and navigation) comprised of using telematic sensors in more than 46,000 delivery trucks which track various forms of metrics such as speed, direction, braking and drivetrain performance. This form of tracking helped them determine the best route and improve daily operation level efficiency, and ended up saving them 4.5 million gallons of fuel per year (Davenport, 2013b).
- Starbucks is another prominent user of analytics. Through its Loyalty Card program, Starbucks is able to amass individualized purchase data on millions of its customers. They used this information to predict what purchases and offers an individual customer would likely be interested in. They reach out to customers regarding these offers via mobile phones. This system drew customers to their stores more frequently, in turn increasing their volume of sales (CCS Technology Group, 2018).
- Amazon uses analytics along with business intelligence to provide product recommendations and market products tailored to individual user activity, and it also uses analytics for logistical operations. Its emphasis and in-depth analysis enables Amazon’s massive supply chain to run smoothly. They extend their use of analytics to optimizing shipping routes and inventory allocation in warehouses. Analytics constitutes for practically every step of Amazon’s supply process (CCS Technology Group, 2018).
- Uber is a technology company, that offers customers cabs from any location, without physically owning any cabs. They use GPS tracking to provide customer the location of their cab, the amount of time the trip will take, and the estimated fare for the trip.
The era of analytics 3.0 has given opportunities to many disruptive innovations to take place, which has replaced legacy industries that dominated for decades. Using this form of analytics has made business model innovation and decisions facilitating this crucial for organization’s to survive in today’s market. For example: Uber replaced legacy taxi services all around the globe. Netflix’s offerings made blockbuster go bankrupt.
CONCLUSION
Decision making and the factors influencing it have evolved over time. From basing them on gut instinct of a manager. Later, moving onto a feedback system provided by business intelligent tools and data analysts to understand transaction data and the implications of previous judgements to discover patterns to rectify changes in the present system. The invention of internet and the feasibility of technology coupled with globalisation changed the competitive landscape and decision making as a whole. It led to the emergence of disruptive innovations and a predominant use of analytics to process big data and operations, to identify newer opportunities to capitalize on, while making the current processes including manufacturing and frontline operations more efficient in some cases. The emergence of Data scientists and their role in shaping businesses, making fact based decisions which are key to strategy and competition. By having more data at their disposal, organizations have been able to identify and create :
- Individually targeted advertisements.
- New and innovative offerings for its customers.
- Providing a competitive price.
- Providing tailor made offers to its customers to increase volume sales.
- Cost allocation for financial performance.
- Overall operational efficiency (ex: minimizing inventory, ORION etc.).
REFERENCES
Ago, R.P.• 4 M., 2018. Limitless. [online] Steemit. Available at:
Anon 2018. 3 Level pyramid model diagram – Information systems types | Diagram For Decision Making Process In Operations Management. [online] https://www.conceptdraw.com. Available at:
Anon 2018. Figure 2.1: Resource-Based View IT Business Value Model. Melville,… [online] ResearchGate. Available at:
Aral, S., Brynjolfsson, E., and Wu, D. (2006). “Which Came First, It or Productivity? The Virtuous Cycle of Investment and Use in Enterprise Systems,” International Conference on Information Systems, pp. 1-22.
Brynjolfsson, E., Hitt, L.M. and Kim, H.H., 2011. Strength in Numbers: How Does Data-Driven Decisionmaking Affect Firm Performance? SSRN Electronic Journal. [online] Available at:
CCS Technology group (2018). Real-world examples of business intelligence, [online]. Available at: [Accesses 7 Nov. 2018]
Davenport, T.H., 2013a. Analytics 3.0. Harvard Business Review; Boston, [online] 91(12), Dec., pp.64–72. Available at:
Davenport, T.H., 2013b. Analytics 3.0. Harvard Business Review, [online] (December 2013), 1 Dec. Available at:
Davenport, T.H., Barth, P. and Bean, R., n.d. How ‘Big Data’ Is Different. p.5.
Gordon, B.D. & Olson, M.H. (1985): Management information systems, conceptual foundations, structure and development, 2nd edition, McGraw Hill Book Co, USA
Gurbaxani, V. and Whang, S., 1991. The impact of information systems on organizations and markets. Communications of the ACM, [online] 34(1), pp.59–73. Available at:
Harshini G, Sreeha M R (2017). Internet of things and analytics.[online] Available at:
Hicks, O. J. (1997): Management information systems, 3rd Edition, USA.
Johnson, R.H., and Carrico, S.R. Developing capabilities to use information strategically. MIS Quarterly 12,1 (1989), 37-48
Lee, A.S., (2001), Editorial. MIS Quarterly, 25(1), iii-vii.
Lucey, T. (2005) Management Information systems 9th Edition, Thomson Learning, London.
Markus, M.L. and Robey, D., 1988. Information Technology and Organizational Change: Casual St. Management Science; Linthicum, [online] 34(5), p.583. Available at:
McAfee, A. (2002). “The Impact of Enterprise Information Technology Adoption on Operational Performance: An Empirical Investigation,” Production and Operations Management (11:1), pp. 33-53.
Pentland, A., and Pentland, S. (2008). Honest Signals: How They Shape Our World. The MIT Press.
Teo, T.S.H. and Too, B.L., 2000. Information Systems Orientation and Business Use of the Internet: An Empirical Study. International Journal of Electronic Commerce, [online] 4(4), pp.105–130. Available at:
Ward, J. & Peppard, J. (2002): STrategic planning for information systems, Wiley Series in Information Systems, 3rd Edition, UK.
Cite This Work
To export a reference to this article please select a referencing stye below:
Related Services
View all


Related Content
All TagsContent relating to: "Information Systems"
Information Systems relates to systems that allow people and businesses to handle and use data in a multitude of ways. Information Systems can assist you in processing and filtering data, and can be used in many different environments.
Related Articles

DMCA / Removal Request
If you are the original writer of this dissertation and no longer wish to have your work published on the UKDiss.com website then please: