Design of a Plant for the Production of 750,000 Standard M3/Day of Hydrogen
Info: 51472 words (206 pages) Dissertation
Published: 10th Dec 2019
Tagged: Biology
DESIGN OF A PLANT FOR THE PRODUCTION OF 750,000 STANDARD M3/DAY OF HYDROGEN BY PARTIAL OXIDATION OF HEAVY OIL FEEDSTOCK
ABSTRACT
The design of a plant producing hydrogen by partial oxidation of oil feedstock has been carried out. Purity of hydrogen obtained from the process was set at 98%, with minimal levels of impurities. The main process involved include the partial oxidation of the heavy fuel oil feedstock in a flame lined reactor called a gasifier to produce hydrogen. The successive units in the plants are purification units to ensure that the product specification of 98% purity of hydrogen is met. A water gas shift converter was also present to improve hydrogen yield. Waste heat energy generated from the gasification process is used in the waste heat boiler to generate steam for the plant. These purification units include: Quencher, Initial H2S scrubber, final H2S removal, CO2absorption.
The chemical and mechanical design of the main equipments in the plants was carried out and the results presented. Costing and HAZOP analysis of each item of equipment is also provided. Detailed economic and profitability analysis was done and general safety and environmental issues were addressed.
TABLE OF CONTENTS
CONTENTS PAGE
1.1 HYDROGEN GAS: BRIEF HISTORY AND MARKET VALUE
1.3 LIMITATIONS OF HYDROGEN PRODUCTION
2.1.3 ENTRAINED FLOW GASIFIERS
2.2.1 TYPES OF WASTE HEAT BOILERS
2.2.2 WASTE HEAT BOILER DESIGN CONSIDERATIONS
2.3.1 HORIZONTAL DESIGN: CFQ QUENCHER
2.3.2 VERTICAL DESIGN: CCQ-QUENCHER
2.4 SCRUBBING SYSTEMS (INITIAL H2S REMOVAL)
2.5.1 DESIGN AND OPERATION OF WATER GAS SHIFT REACTORS
2.7 FINAL H2S REMOVAL (CHEMOSORPTION)
2.7.1 PRESSURE SWING ABSORBER DESIGN
2.8.3 HOT POTASSIUM CARBONATE (BENFIELD) FOR CO2 REMOVAL
2.9.3 AIR-COOLED EXCHANGERS 43
2.9.5 PLATE HEAT EXCHANGERS 45
2.9.6 SHELL AND TUBE HEAT EXCHANGERS 47
2.9.7 MEAN TEMPERATURE DIFFERENCE ( DRIVING FORCE) 48
3.2 ENERGY BALANCE AROUND CO CONVERSION STAGE
3.3 ENERGY BALANCE AROUND THE GASIFIER 58
CHAPTER FOUR 61
4 CHEMICAL ENGINEERING DESIGN 61
4.1 TANK ONE (FEED STORAGE TANK FARMS) 61
4.2 TANK 2 (FRESH FEED SURGE DRUM) 62
4.3 TANK 3 (STORAGE TANK FARM) 62
4.4 THE HEAVY FUEL OIL GASIFIER 64
4.6.5 HEIGHT OF THE COLUMN: Z 76
4.8 CARBON MONOXIDE CONVERSION UNIT 79
4.8.1 REACTOR TYPE: FIXED BED REACTOR 80
4.8.2 CATALYST: CHROMIUM – PROMOTED IRON OXIDE 81
4.8.3 CATALYTIC CONVERTER SIZING 84
4.9 FINAL H2S REMOVAL STAGE 85
4.9.2 REGENERATION OPERATION 86
4.10 CARBON DIOXIDE REMOVAL 92
4.10.1PACKING MATERIAL: PALL RINGS (PLASTIC) 94
4.11.3 VISCOSITY CORRECTION FACTOR 97
4.11.4 OXYGEN STREAM PRE-HEATER. 98
4.11.5 AIR-COOLED EXCHANGERS 102
4.12.1APPROXIMATE PUMP-SIZING CALCULATION PROCEDURE 109
4.12.2THE METERING RAM PUMP 111
5.1.3 MATERIAL OF CONSTRUCTION 115
5.1.4 THICKNESS OF THE REFRACTORY BRICK 116
5.1.5 MINIMUM WALL THICKNESS 116
5.1.6 MINIMUM HEAD THICKNESS 117
5.3.1 MATERIALS FOR CONSTRUCTION 118
5.4 THE INITIAL H2S ABSORBER 121
5.4.2 SUPPORT FOR ABSORBER 124
5.5.1 OPERATING AND DESIGN TEMPERATURES AND PRESSURES 125
5.5.2 VESSEL DIMENSIONS AND ORIENTATION 125
5.5.3 CONSTRUCTION MATERIALS 126
5.5.6 HEATING AND COOLING JACKETS OR COILS 127
5.5.7 INTERNAL FITTINGS SPECIFICATION 127
5.6 THE FINAL H2S ABSORBER 128
5.7.2 AXIAL STRESS DUE TO PRESSURE 130
5.7.3 STRESS DUE TO DEAD LOAD 130
5.7.4 EFFECT OF ATTACHMENTS 132
5.7.5 SUPPORT FOR ABSORBER 133
6 PLANT HAZARD AND OPERABILITY STUDY 138
6.8.4 SATURATOR – DESATURATOR 152
6.8.5 THE FINAL H2S ABSORBER 153
7.1 ECONOMIC AND PROFITABILITY ANALYSIS: GASIFIER 158
7.2 ECONOMIC AND PROFITABILITY ANALYSIS: QUENCHER 161
7.3 COSTING (CO CONVERSION) 163
7.4 COST AND FEASIBILITY ANALYSIS (FINAL H2S REMOVAL) 164
7.5 COSTING AND PROFITABILITY (CO2 REMOVAL) 166
7.6 ESTIMATION OF COST (1ST HEAT EXCHANGER) 168
7.7 ESTIMATION OF COST (2ND HEAT EXCHANGER) 169
CHAPTER EIGHT 170
8 CONCLUSION AND RECOMMENDATION 170
8.1 CONCLUSION 170
8.2 RECOMMENDATION 171
REFERENCES 172
A.1 SIMULATION 175
A.2 PLANT AND SITE LAYOUT 176
A.3 PROCESS INFORMATION 177
A.4 CALCULATIONS 178
LIST OF TABLES
| TABLE | TITLE | PAGE |
| 2.1 | Classification of Gasifiers | 10 |
| 2.2 | Comparison of Calculated and Experimental Solubility Data for Scrubbing Solvents | 23 |
| 3.1 | Composition before H2S Removal | 51 |
| 3.2 | Composition after H2S Removal | 51 |
| 3.3 | Composition Out of WGS Reactor | 53 |
| 3.4 | Final H2S Remover Outlet | 54 |
| 3.5 | Percentage Composition of Constituents from Final H2S Removal Outlet | 54 |
| 3.6 | Composition of the Inlet into the CO Conversion Stage | 57 |
| 3.7 | Composition of the Outlet from the CO Conversion Stage | 57 |
| 3.8 | Energy Balance of Outlet Stream from Gasifier | 59 |
| 3.9 | Energy Balance of Inlet Stream to Gasifier | 60 |
| 4.1 | Tank 1 Dimensions | 61 |
| 4.2 | Tank 2 Dimensions | 62 |
| 4.3 | Tankage Dimensions | 63 |
| 4.4 | Rate Constant Values At Specific Temperatures | 66 |
| 4.5 | Equilibrium Constants at Specific Temperatures | 66 |
| 4.6 | Composition of Crude Gas Exiting The Gasifier (Wet Basis) | 69 |
| 4.7 | Composition of Inlet Stream Into Quencher | 74 |
| 4.8 | Composition of Outlet Stream from Quencher | 75 |
| 4.9 | Equilibrium Data for CO at Different Temperatures | 80 |
| 4.10 | Catalyst Properties of Chromium Promoted Iron Catalyst | 82 |
| 4.11 | Reactor Dimensions of Catalytic Converter | 84 |
| 4.12 | Composition of Inlet and Outlet Streams for CO2 Removal | 93 |
| 4.13 | Equilibrium Data for CO2 Removal | 94 |
| 4.14 | Summary of CO2 Absorber Dimensions | 95 |
| 4.15 | Summary of Proposed Heat Exchanger Design | 96 |
| 4.16 | Heat Transfer Coefficients with Corresponding Area And Face Velocity Values | 105 |
| 4.17 | Corresponding Face-Area and Face-Velocity Values | 106 |
| 4.18 | Approximate Frictional Pressure Drop Across Process | 111 |
| 5.1 | Tensile Strength Values At Different Temperatures | 119 |
| 5.2 | Design Stress Values at Different Temperatures | 120 |
| 6.1 | Hazop Analysis for Gasifier | 138 |
| 6.2 | Hazop Analysis or Waste Heat Boiler | 139 |
| 6.3 | Hazop Analysis for Heat Exchangers | 140 |
| 6.4 | Hazop Analysis for Initial H2s Removal | 141 |
| 6.5A | Hazop Analysis for Saturator | 145 |
| 6.5B | Hazop Analysis for Desaturator | 146 |
| 6.5C | Hazop Analysis for Lines 1 And 2 | 146 |
| 6.6A | Hazop Analysis for Co2 Removal Inlet | 147 |
| 6.6B | Hazop Analysis for Co2 Removal Outlet | 148 |
| 6.7 | Hazop Analysis for Storage Tanks | 149 |
| 6.8 | Flammability Limits of Different Compounds | 155 |
| 7.1 | Inflation Rates By Month And Year (1999-2011), US Inflation Calculator | 159 |
| 7.2 | Refractory Brick Density Calculation | 160 |
| 7.3 | Inflation Rates By Month And Year (2005-2011) (For Bare Vessel) | 161 |
| 7.4 | Inflation Rates By Month And Year (2005-2011) (For Packing Material) | 162 |
| 7.5 | Inflation Rates By Year (2005-2011) ( For H2s Removal Vessel) | 165 |
LIST OF FIGURES
| FIGURE | TITLE | PAGE |
| 2.1 | Shell Oil Gasifier | 12 |
| 2.2 | The Quenching Unit As Conditioned By Design Specifications | 18 |
| 2.3 | Schematic Diagram of a Packed Column | 19 |
| 2.4 | Structure of Sterically Hindered Amines | 23 |
| 2.5 | Adiabatic Stages in Water Gas Shift Reaction | 26 |
| 2.6 | Schematic Diagram Of Final H2s Removal Stage | 32 |
| 2.7 | Benfield Process For Co2 Removal | 38 |
| 2.8 | Ram Pump Schematics | 39 |
| 2.9 | Ram Pump Schematics | 40 |
| 2.10 | Ram Pump | 41 |
| 2.11 | Air-Cooled Exchangers | 44 |
| 2.12 | Finned Tubes | 45 |
| 2.13 | A Plate Heat Exchanger | 46 |
| 2.14 | Assemblage Of Baffles And Tubes Inside A Shell And Tube Heat Exchanger | 48 |
| 2.15 | Counter-Current Flow In A Heat Exchanger And The Temperature Profile Within The Exchanger | 48 |
| 2.16 | Co-current Flow Through A Heat Exchanger With The Temperature Profile Through The Equipment | 49 |
| 4.1 | The Heavy Fuel Oil Gasifier | 64 |
| 4.2 | The Quencher | 72 |
| 4.3 | The Initial H2S Scrubber | 77 |
| 4.4 | The CO Catalytic Converter | 79 |
| 4.5 | The Final H2S Remover | 85 |
| 4.6 | CO2 Removal | 92 |
| 4.7 | Air-Cooled Exchangers | 103 |
| 4.8 | Finned Tubes | 104 |
| 5.1 | Skirt Support | 128 |
| 5.2 | Double Plate With Gusset | 128 |
| 5.3 | Physical Layout Of A 2-Tube Pass Shell And Tube Exchanger | 137 |
| 7.1 | Cost Estimation Data For Shell And Tube Heat Exchangers | 168 |
LIST OF SYMBOLS
2S left in output stream
B = amount of H2S removed from aP3
We are told that the H2S is scrubbed to 15ppm
aP3 = 0.0201Kmol/hr
so that
0.5 = 0.02011 + b
B = 0.4799 Kmol/hr
TABLE 3.1: COMPOSITION BEFORE H2S REMOVAL
| components | Kmol | Kmol % |
| H2 | 47.6 | 671.636 |
| Co | 42.1 | 594.031 |
| Co2 | 8.3 | 117.113 |
| N2 | 1.40 | 19.754 |
| CH4 | 0.1 | 1.411 |
| H2S | 0.5 | 7.055 |
| 1411 |
TABLE 3.2: COMPOSITION AFTER H2S REMOVAL
| components | Kmol | Kmol % |
| H2 | 671.636 | 47.839 |
| Co | 594.031 | 42.311 |
| Co2 | 117.113 | 8.342 |
| N2 | 19.754 | 1.401 |
| CH4 | 1.411 | 00.1005011 |
| H2S | 0.02011 | 0.001432 |
| 1403.9651 | 100.0000 |
From here, the scrubbed gas moves on to the water gas shift reactor, where CO is used up and H2, CO2 are produced.
Now, onto the CO conversion stage. The reaction stoichiometry ofWater gas shift is:
CO + H2O = CO2 + H2
Assuming 99.8% conversion was obtained from the simulation we can obtain the composition of the output from the 2nd stage CO conversion:
Overall conversion = 
0.998 = 
Where aP5 is the molar flow of CO out of the WGS reactor.
aP5 = 1.881Kmol
Amount of CO reacted = 594.031 – 1.881
= 592.8429 Kmol
Also, using the reaction stoichiometry,
Amount of CO produced = 592.8429 Kmol
Amount of H2 produced = 592.8429 Kmol
Amount of H2O reacted = 592.8429 Kmol**
** is the total amount of water reacted. From the problem statement, we now that this is made up of water from the gasification process from the saturation and from the water fed into the WGS Reactor.
An oxygen atom balance around the Reactorshould tell exactly how much of this water came from the gasified and this will be done later.
TABLE 3.3: COMPOSITION OUT OF THE WGS REACTOR
| Components | Kmol | Kmol % |
| H2 | 1264.4789 | 63.3335 |
| CO | 1.1881 | 0.05951 |
| CO2 | 709.9559 | 35.5593 |
| N2 | 19.754 | 0.9894 |
| CH4 | 1.411 | 0.0707 |
| H2S | 0.02011 | 0.001007 |
| 1996.541 | 100.001 |
From here, the gas mixture moves to the final H2S removal stage, where H2S is scrubbed to less this 1ppm. Assuming scrubbing of H2S to 0.8ppm,
TABLE 3.4: FINAL H2S REMOVAL OUTLET
| Components | Kmol |
| H2 | 1264.4789 |
| CO | 1.1889 |
| CO2 | 709.9559 |
| N2 | 19.754 |
| CH4 | 1.411 |
| H2S | 1.06583 x 10⁻³Kmol |
We are required to produce 750,000 stdm3/day of feed i.e. 31250 stdm3/hr. Using the ideal gas relation, this is equivalent to 1277.92 Kmol /hr
Using this, we can calculate the % composition of all constituent except Co2, since there are molar flows are already fixed
Table 3.5: PERCENTAGE COMPOSITION OF CONSTITUENTS FROM FINAL H2S REMOVAL OUTLET
| H2 | 98.00% |
| Co | 1.1889% |
| N2 | 1.55% |
| CH4 | 0.1104% |
| H2S | 0.0000834% |
CO2 = 100 – (98.00 + 0.093 + 1.55 + 0.1104 + 0.0000834)
= 0.247%
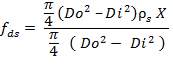
Molar flow of CO2 =  x 1277.92
= 3.1503 Kmol /hr
To obtain feed flow rate:
Moles of C in quenched gas
= 591.636 ( ) + 117.113 (
 ) + 1.411 (
 )
)
=287.842 Kmol of carbon
= 3454.104 kg
The mass of C calculated above amounts to 98.5% of the total carbon in the feed. Using this information, we can calculate the total weight of the Carbon in feed
0.985 C = 3454.104
C = 3506.705Kg
Now, we can calculate the total weight of feed:
85 wt. % of feed is carbon
0.85 (F) = 3506.705kg
F = 4125.535kg/hr feed
We can also calculate the flow rate of steam and air:
Mass of steam = 0.75 (1125.535)
= 3094.1511kg/hr
Now,
4125.535kg =  +
+  +
+ 
= 751.1912 kmol/hr
1.16kg of O2 = 0.03625 mole of O2
1.16kg of O2 = 0.03625 mol of O2/0.1821 mol feed
So that:
Total mole of (impure) feed = 
= 149.551 mol of impure O2
Actual mole of O2 fed = 0.95 (149.551)
= 142.073 moles of O2
= 4546.34kg of O2
3.2 ENERGY BALANCE AROUND CO CONVERSION STAGE
TABLE 3.6 COMPOSITION OF THE INLET INTO THE CO CONVERSION STAGE
| COMPONENT | COMPOSITION (Kmol) | Tref (K) | Href (J/gmol) | H380 | ∆H | MiHi |
| H | 671.636 | 298 | 718 | 10977.2 | 10259.2 | 6890448.051 |
| CO | 594.031 | 298 | 728 | 11243.5 | 10515.5 | 6246532.981 |
| C02 | 117.113 | 298 | 912 | 16200.5 | 15288.5 | 1790482.101 |
| N2 | 19.254 | 298 | 728 | 11099.5 | 10371.5 | 199692.861 |
| CH4 | 1.411 | 298 | 879 | 16800.5 | 15921.5 | 22465.237 |
| H2S | 0.02011 | 298 | 845 | 13522.3 | 12677.3 | 254.941 |
| H2O | 553438 | 298 | 837 | 13072.2 | 12235.2 | 653824617.6 |
| TOTAL | 668.97 ˣ 106 |
TABLE 3.7 COMPOSITION OF THE OUTLET FROM THE CO CONVERSION STAGE
| COMPONENT | COMPOSITION (Kmol) | Tref (K) | Href (J/gmol) | H380 | ∆H | MiHi |
| H | 1264.4789 | 298 | 718 | 10988.5 | 10278.5 | 12986830.54 |
| CO | 1.1888 | 298 | 728 | 11206.5 | 10478.5 | 12449.505 |
| C02 | 702.9559 | 298 | 912 | 16231.5 | 15319.5 | 10768.93291 |
| N2 | 19.754 | 298 | 728 | 11139.5 | 10411.5 | 205668.771 |
| CH4 | 1.411 | 298 | 879 | 16819.5 | 15940.5 | 22492.0455 |
| H2S | 0.02011 | 298 | 845 | 13729 | 12884 | 259.097 |
| H2O | 52854 | 298 | 837 | 13171 | 12334 | 651901.236 |
| TOTAL | 675652768.9 |
To obtain the heat of reaction with respect to H2 produced,
= (1264.4789 – 671.636) × (- 4.2 × 10⁴ KJ/hr Kgmol)
= 5928429Kgmol × 4.2 × 10⁴ KJ/ Kgmol
= – 24.899 × 10⁶ KJ
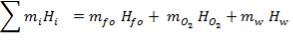
Q =  0H0 – 1H1 + ∆Hrn
= (675.652 × 10⁶ – 668.97 × 10⁶) + (- 24.899 × 10⁶)
= – 18.217 × 10⁶ KJ/hr
A total of 18.217 × 10⁶ KJ/hr of heat is given off in the CO conversion unit. This large amount of heat was utilised in the preheating of the unconverted gas in heat exchanger
The Geeral energy balance equation reduces to
ASSUMPTIONS
The enthalpy content of the crude gas leaving the gasifier is majorly due to the gasification reaction, which is:
But,
Ignoring all side reactions, the calorific value for the gasification reaction is equal to 4.29 x 10⁷KJ/Kg
The reference temperature of 50% is chosen for convenience, the general energy balance equation becomes;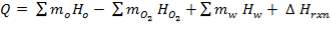
TABLE 3.8: ENERGY BALANCE OF OUTLET STREAM FROM GASIFIER
| Composition | Kgmol | Tref | Href,
J/gmol |
H1573
J/gmol |
 |
moHo |
| H2 | 671.636 | 323 | 1485.25 | 39064.25 | 37579 | 25.24 x 10⁶ |
| CO | 594.031 | 323 | 1514.25 | 41796.75 | 40282.5 | 23.93 x 10⁶ |
| CO2 | 117.113 | 323 | 1965.25 | 66368.25 | 64403 | 7.54 x 10⁶ |
| N2 | 19.754 | 323 | 1513.25 | 41343.75 | 39830.5 | 786.81 x 10³ |
| CH4 | 1.411 | 323 | 1897.5 | 81440.75 | 79543.25 | 112.24x 10³ |
| H2S | 7.055 | 323 | 1749.75 | 54078 | 52303.25 | 369.0 x 10³ |
| H2O | 94.031 | 323 | 1749.75 | 51823.75 | 50074 | 29.74 x 10⁶ |
| C | 323 | – | – | – | 87.72 x 10⁶ |
TABLE 3.4 ENERGY BALANCE OF INLET STREAM TO GASIFIER
| Htrh | Tref | Href,
J/gmol |
H1573
J/gmol |
J/gmol |
miHi | moHo |
| O2 | 323 | 1530.5 | 68.11 | 5280.5 | 1.95 x 10⁶ | 369.07 |
| N2 | 323 | 1513.25 | 6644 | 5130.75 | 99.66 x 10³ | 19.425 |
| H2O | 323 | 1749.75 | 7752 | 6002.25 | 1.03 x 10⁶ | 171.90 |
| 3.080 x 10⁶ |
 is considered here to be the calorific value of the fuel oil
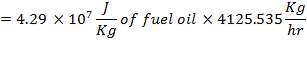
 = 87.72
CHAPTER FOUR
4 CHEMICAL ENGINEERING DESIGN
The feed storage tank farm will be designed in such a way that each tank will be able to hold about 5 days of feed in storage. There will be a total of ten feed storage tanks in the tank farm
- The tank is a vertical, cylindrical shaped storage tank with a fixed and floating roof
- Floating roof rises and falls with the liquid level inside the tank, thereby decreasing the vapor space above the liquid level. They are considered a safety requirement as well as a pollution prevention measure.
- A vertical tank is preferred over a horizontal tank since it takes up less space, is easily supported on concrete slabs and allows maximum mixing.
- The storage tanks are supported with a skirt support as they do not impose concentrated loads on the vessel shell
- A drain line is installed so that water at the bottom of the tank (caused by the difference between the internal and external temperature) can be regularly removed.
TABLE 4.1: TANK 1 DIMENSIONS
| Top of shell height | 100% | 23.21m |
| Design fill level | 95% | 22.05m |
| Normal fill level | 85% | 19.73m |
| Minimum fill level | 35% | 8.12m |
| Bottom of shell height | 0% | 0 |
This tank is similar to tank in function, configuration, material of construction and safety devices and structural supports used. The only difference is that it is a smaller tank used to aid the Start-up and shut down procedures. This tank is required to store enough heavy fuel oil for a 3 hour production run.
TABLE 4.2: TANK 2 DIMENSIONS
| Top of shell height | 100% | 6.75m |
| Design fill level | 95% | 6.41m |
| Normal fill level | 85% | 5.74m |
| Minimum fill level | 35% | 2.36m |
| Bottom of shell height | 0% | 0m |
This tank is used for the storage of the final product gas, hydrogen before it is supplied to the immediate consumers. They are designed as spherical tanks since this shape is more ideal for storage of the gaseous product.
TANK DIMENSIONS
For each of the 50 tanks, assume that H = 3D


Similar to tanks 1 and 2, there are safety allowances in the height of the tank.
So that D = 44m
Installed storage capacity is now
TABLE 4.3: TANK STORAGE CAPACITIES
| TANK | STORAGE CAPACITY |
| TANK 1 (FEED STORAGE TANK) | 531.25m3 |
| TANK 2 (FRESH FEED SURGE DRUM) | 13.281m3 |
| TANK 3 (PRODUCT STORAGE TANK) | 75000m3 |
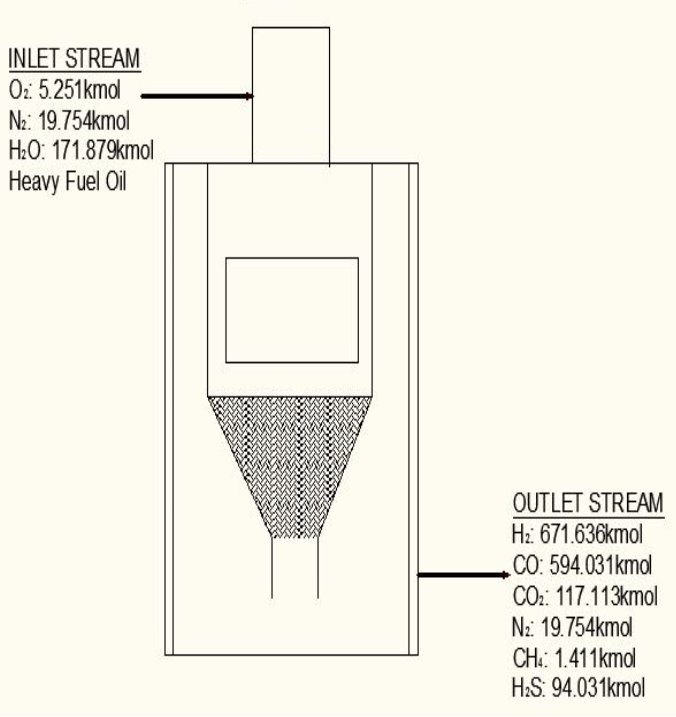
FIGURE 4.1 THE HEAVY FUEL OIL GASIFIER
The following reactions take place in the gasifier:
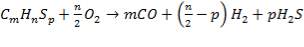 (4.4.1)
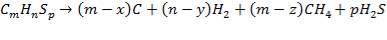 (4.4.2)
 (4.4.3)
 (4.4.4)
 (4.4.5)
The slowest reaction is reaction 4.4.4 (Carbon-steam reaction) and is therefore taken as the rate determining step for the reactor.
C + H2O → H2 + CO (rate-determining step)
The rate expression for this reaction is given as:
r = kv 
Where:
r = rate of reaction (in this case, the rate of disappearance of H2O)
kv = rate constant
K = equilibrium constant
CH2O, CH2 and CCO = molar concentrations of CH2O, CH2 and CCO respectively (kmol/m3)
Given the table below for rate constant, kv (from reference source)
TABLE 4.4 RATE CONSTANT VALUES AT SPECIFIC TEMPERATURES
| T (K) | 952.38 | 1000 |
| kv (cm3/gmol.s) | 1.62 | 8.6 |
TABLE 4.5 COMPOSITION OF CRUDE GAS EXITING THE GASIFIER (WET BASIS)
| COMPONENTS | AMOUNT (kmol/hr) | COMPOSITION |
| H2 | 671.636 | 0.4232 |
| CO | 594.031 | 0.3743 |
| CO2 | 117.113 | 0.0738 |
| CH4 | 1.411 | 0.0008 |
| H2O | 171.01 | 0.1077 |
| H2S | 7.055 | 0.0044 |
| N2 | 19.754 | 0.0124 |
| C | 5.16 | 0.0033 |
| Total | 1587.17 | 1.0000 |
Height of the gasifier = 9.64 m
Diameter of the gasifier = 1.99 m
Total molar flow rate of the exit crude gas = 1587.17 kmol/hr
Volumetric flow rate of the exit crude gas = 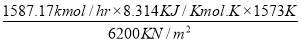 =3347.88 m3/hr
Residence time, τ = Volume/Volumetric flow rate =  = 0.0089 hr = 32.13s
Space velocity, υ = 1/ τ = 1/32.13s = 0.031 s-1
The waste heat boiler will be designed as a special type of shell and tube heat exchanger called a water tube waste heat boiler, initially mentioned in the previous semester’s work. The water tube design is a very difficult one to obtain but has been selected because of its ability to withstand very large pressure generation like the one specified in this design. Additional energy recovery and fuel conservation can be realized with the use of the water tube boiler, by adding a boiler feed water economizer to the boiler design.
Before we start designing the exchanger, we need to determine the heat duty of the demineralised feed water i.e how much heat it will be required to absorb from the hot flue gas stream.

The calculations leading to the determination of in the above equation are shown below:
Cp-values are dependent on temperature, so we have to determine the Cp of all the individual components that make up the inlet stream (i.e. at 1300°C)
The heat capacity equations are:
C: Cp = 11.18 + 1.095 × 10⁻² – 4.891 × 10⁵ -2
H2: Cp = 
CO: Cp = 
CO2: Cp = 
N2: Cp = 
CH4: Cp = 
H2S: Cp = 
Using these Cp values, we can calculate a bulk Cp for the stream as shown:
TABLE 4.6: BULK CP VALUES FOR STREAM COMPONENTS
|
COMPONENT |
Cp (J/KMOLOC)
|
MOLE FRACTION |
MOLAR FLOW |
IN-STREAM Cp (J/KMOLOC) |
| C | 28.207 | 0.00362 | 5.157 | 0.2089 |
| H2 | 32.585 | 0.47191 | 671.636 | 13.2328 |
| CO2 | 58.747 | 0.08229 | 117.113 | 4.1593 |
| CO | 35.412 | 0.41739 | 594.031 | 12.7199 |
| N2 | 35.222 | 0.01388 | 19.754 | 0.4191 |
| CH4 | 135.761 | 0.00099 | 1.411 | 0.1222 |
| H2S | 51.4787 | 0.00496 | 6.702 | 0.0360 |
From the addition of all the values in the in-stream Cp column, we obtain:
Cp = 35.92522 J/mol. °C
Substitute the value of Cp above into Equation (2.1):
From the material balance calculations, we can see that
Inside heat transfer coefficient:
hi = 1309379.395 W/m2k
Outside heat transfer coefficient
ho = 2000Btu/ ho ft2oF
= 11333.33W/ m2oC
Overall heat transfer coefficient:
Heat transfer area:
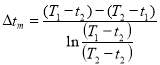
Mean temperature difference:
MTD = 
Number of tubes:
Tube lunght, L:
Tube pitch: Pi =
shell diameter: = 1.6646m
Pressure drop (shell side):
Pressure drop (tube side):
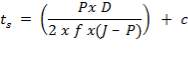
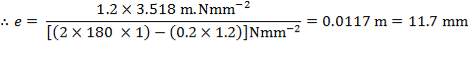
Shell wall thickness determination:
Pi= 3000 kPa
Di = 1.078 m
At the shell side mean temperature of 189.21oC,
f = 134 × 106N/m2
Therefore,
e = 3000000( 1.078)/ [2(134 × 106) – 3000000]
= 12.2 mm
Other design specifications include:
- Design Pressure = 110% of operating Pressure = 3300 kPa
- Design temperature = Maximum shell temperature = 220oC
- Corrosion Allowance = 4 mm
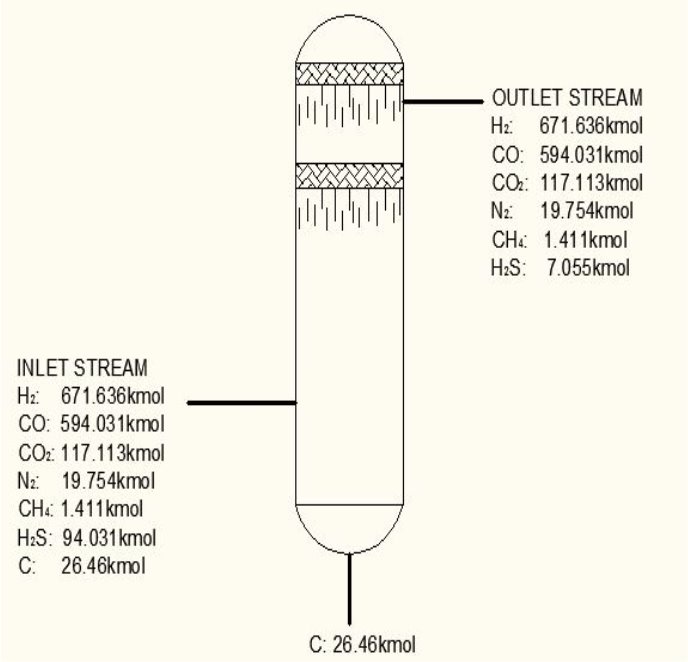
FIGURE 4.2 THE QUENCHER
The quencher is designed as a packed column, so as to increase the contact area between the gas and the water and thus allow for efficient removal of residual carbon from the gas stream.
4.6.1 Design Procedures
The design of a packed column will involve the following steps:
1. Select the type and size of packing.
2. Determine the column height required for the specified separation.
3. Determine the column diameter (capacity), to handle the liquid and vapour flow rates.
4. Select and design the column internal features: packing support, liquid distributor, redistributors.
4.6.2 Types of Packing
The principal requirements of a packing are that it should:
- Provide a large surface area: a high interfacial area between the gas and liquid.
- Have an open structure: low resistance to gas flow.
- Promote uniform liquid distribution on the packing surface.
- Promote uniform vapour gas flow across the column cross-section.
Random packing and structured packing elements are more commonly used in the process industries.
DATA GIVEN
Exit Gas stream composition
Moles of exit and inlet gas stream
From material balance, input and exit gas stream composition is calculated.
DATA REQUIRED
Heat Capacity
Amount of water required to achieve the desired temperature change
Tower Diameter
Tower Height
TO OBTAIN MASS OF COOLING WATER REQUIRED:
Heat lost by crude gas= heat gained by cooling water
Entering Crude gas temperature=250oC
Exiting Crude gas temperature=50oC
Entering Temperature of cooling water= 25oC
Exiting temperature of the cooling gas= this is assumed to be 90oC
Inlet Stream Into Quencher
TABLE 4.7: COMPOSITION OF INLET STREAM INTO QUENCHER
| COMPONENT | MOLE (Kmol) | MOLE FRACTION |
| C | 5.16 | 0.00364 |
| H₂ | 671.636 | 0.4743 |
| CO | 594.031 | 0.4195 |
| CO2 | 117.113 | 0.0827 |
| N₂ | 19.754 | 0.01395 |
| CH₄ | 1.411 | 0.000996 |
| H₂S | 7.055 | 0.00498 |
| 1416.16 |
4.6.3 HEAT CAPACITY
The heat capacity data can be obtained from heat capacity tables in available from literature
Taking a reference temperature of 15oC.
The heat capacity equations are:
C: Cp = 11.18 + 1.095 × 10⁻²T – 4.891 × 10⁵T-2
H2: Cp =
CO: Cp =
CO2: Cp =
N2: Cp =
CH4: Cp =
H2S: Cp =
TABLE 4.8: COMPOSITION OF OUTLET STREAM FROM QUENCHER
| COMPONENT | MOLE (Kmol) | MOLE FRACTION |
| H₂ | 671.636 | 0.476 |
| CO | 594.031 | 0.421 |
| CO₂ | 117.113 | 0.083 |
| N₂ | 19.754 | 0.014 |
| CH₄ | 1.411 | 0.001 |
| H₂S | 7.055 | 0.005 |
| 1411 |
Heat lost by the crude gas, ΔH is given by
 net dT
= 1039.525 KJ/Kmol
ΔHnet = (6984.618 × 1416.16) – (1039.525 × 1411) KJ/hr
= 2,340.157 KJ/s
Heat gained by the water = m
= 96,189.91 KJ/Kmol
Thus, Heat gained by water = (m/M x 96189.91KJ/Kmol)
Molecular weight of water = 18 Kg/Kmol
Heat gained by water = 96189.91/18 m = 5343.88 m
Since, heat lost by the crude gas = heat gained by water
Therefore,
5343.88m = 2340.157
m = 0.438 Kg/s
Allowing a minimum of 10 minutes hold-up of water,
Therefore, m = 0.438 Kg/s x 10mins x 60s = 262.748 Kg
4.6.4 COLUMN DIAMETER
D = (4S/π)1/2
= (4 × 0.2185/3.1429) ½
= 0.5275 m
4.6.5 HEIGHT OF THE COLUMN: Z
This is obtained, from Coulson and Richardson, using the following formula:
Z= HOGNOGS.F
= 3.0893 m
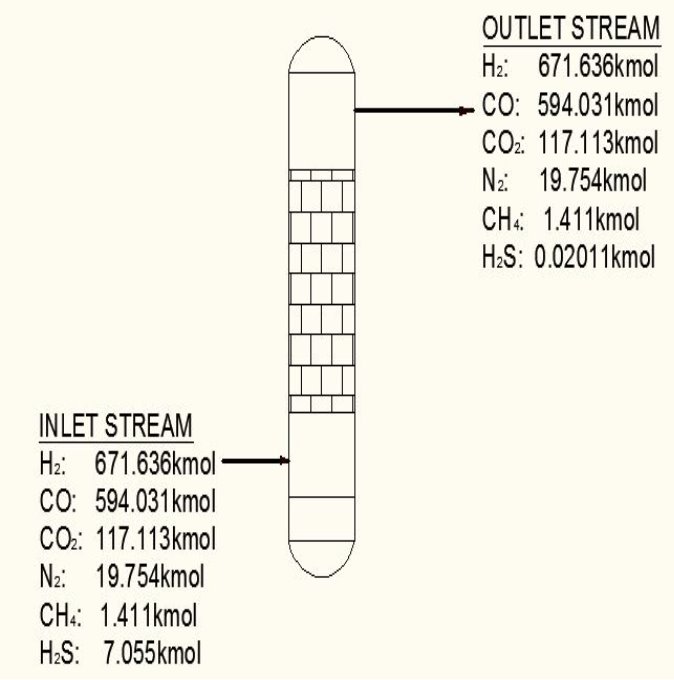
FIGURE 4.3 THE INITIAL H2S SCRUBBER
4.7.1 ASSUMPTIONS
- No NMP in Output gas stream
- Unit operates at 50% of the flooding gas mass velocity
- Flow rate of NMP is 40% more than the minimum
Given that
Henry’s law constant for NMP = 0.97
Density of gas stream = 31.49kg/m3
Density of NMP = 1020kg/m3
H2S concentration in the inlet stream = 0.5mol%
NMP has already been selected from the first semester preliminary design as our scrubbing liquid.
An energy balance is not require for this unit because there is very little temperature change between the unit’s inlet and exit streams and hence the unit can be assumed to be operating isothermally.
A packed column using 1 in. Raschig ring packing with a packing factor of 160 have been selected for use for this design. Raschig rings have been selected because they give a larger degree of contact between the gas phase and the liquid phase. It also gives a higher mass transfer area to work with.
Column height = 14m (approx.)
Column diameter = 2.44m (approx.)
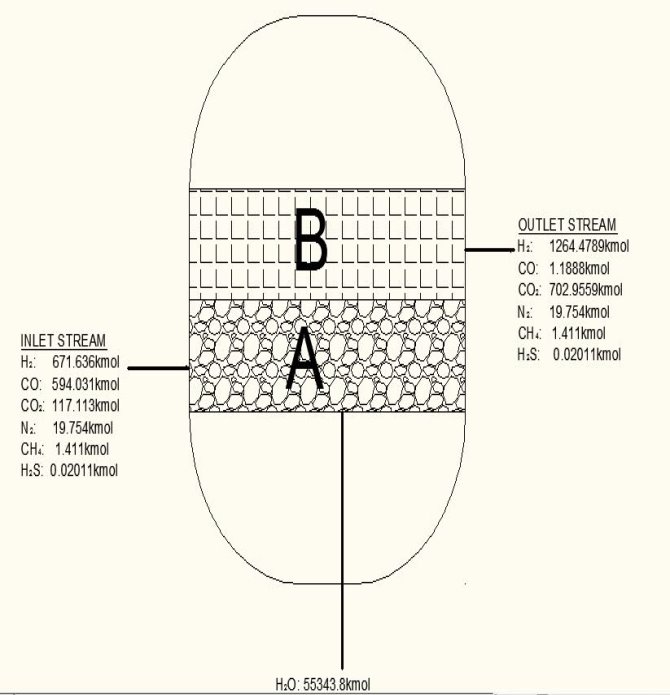
FIGURE 4.4 THE CO CATALYTIC CONVERTER
This unit converts carbon monoxide to carbon dioxide, a reaction which leads to the production of more hydrogen. It is required to carry out this reaction over chromium-promoted iron oxide catalyst. The catalyst vessel is a single shell with a dividing plate separating the two catalyst beds which constitute the two stages of conversion. The following reaction takes place in the CO catalytic converter:
CO + H2O  CO2 + H2 ΔH= – 41170.51J
Also provided are the basic data for the CO conversion section of the plant:
- Space velocity
The space velocity through each catalyst stage be assumed to be 3500 volumes of gas plus steam measured at NTP per volume of catalyst per hour. It should further be assumed that use of this space velocity will allow a 10°C approach to equilibrium to be attained throughout the possible range of catalyst operating temperatures listed below.
- Equilibrium data for the CO conversion reaction

TABLE 4.9 EQUILIBRIUM DATA FOR CO AT DIFFERENT TEMPERATURES
| TEMP/K | 600 | 700 | 800 | |||
| KP | 3.69 x 10⁻² | 1.11 x 10⁻⁴ | 2.48 x 10⁻⁴ | |||
In the design of a catalytic converter, the following are the key issues to be considered: reactor type; catalyst type, catalyst volume and mass; the catalytic converter sizing; operating conditions (temperature and pressure) within the reactor; phase type; feed conditions (temperature and concentration).
4.8.1 Reactor Type: Fixed Bed Reactor
The fixed bed reactor is a tubular which is packed with solid granular catalyst on a fixed support. It is termed a fixed bed reactor because the reactor feed, whether liquid or gaseous feed passes through the catalyst bed to contact with the catalyst for chemical reactions, with the catalyst bed not being moved as the fluid flows feed through it. Based on the flow directions of the feedstock some of the hydro – processing reactors can be divided into “axial” reactors and “radial” reactors. In the axial reactor the feed flows along the axial direction for the reactions to take place. Generally the feed flows downwards. In the radial reactor the feed flows in the radial direction for the reactions to take place. The axial reactor is used when the pressure drop across a catalyst bed is small. Or otherwise the radial reactor should be used. Based on the temperature of the cylindrical shell some reactors can be divided into cold wall reactors and hot wall reactors. They are all fixed bed reactors. “Hot wall” reactor is not lined with any heat insulating linings. Because the temperature of the reactor shell is very high, the reactors must be made of alloy steel which can sustain high temperature and is highly resistant to hydrogen corrosion. The advantage is that more volume of such a reactor can be effectively used. A “cold wall” reactor is lined with heat-insulating material. The temperature of the reactor shell is quite low, ordinary low alloy steel can be used for making such reactors. Corrosion caused by feedstock, especially by hydrogen can be avoided.
4.8.2 Catalyst: Chromium – Promoted Iron Oxide
The overall reaction of a heterogeneous gas-solid reaction on a supported catalyst, such as the one involved in this design, is made up of a series of physical steps as well as the chemical reaction. First, there is mass transfer of reactant from the bulk gas phase to the external solid surface, after which there is diffusion from the solid surface to the internal active sites, activation of the adsorbed reactants; next is the most important step of chemical reaction, then desorption of products, internal diffusion of products to the external solid surface, and mass transfer to the bulk gas phase.
TABLE 4.10: CATALYST PROPERTIES OF CHROMIUM PROMOTED IRON CATALYST (Source: Chemical Reactor Design for Process Plants by Howard F. Rase, 1999)
| PROPERTY | CHROMIUM – PROMOTED IRON OXIDE |
| Maximum operating Temperature (K) | 890 0F |
| Tablet size |  |
| Bulk Density | 70 lb / cu ft |
| Particle Density | 126 lb / cu ft |
| Cost | 20 $ / cu ft |
| Catalyst poisons | Inorganic salts, boron, oils or phosphorus compounds, liquid H20 is a temporary poison. Sulfur compounds in an amount greater than 50 ppm |
| Catalyst life | 3 years and over depending on care in startup and during operation |
The purpose of the chromium promotion is to minimize catalyst sintering by textural promotion. During the course of the reaction, there are no significant side reactions.
The works of Xue et al confirm that Carbon is formed if the water-gas shift reaction occurs at the reaction stoichiometry and temperature. In order to achieve higher conversions with the use of a catalyst and also avoid coking, the H2O / CO feed ratio must be higher than that required by the reaction stoichiometry. With this low H2O / CO ratio, all possible side reactions would likely produce C or CH4. Formulation of C blocks the catalyst sites causing catalyst deactivation and an increase in the pressure drop across the bed caused by plugging or fouling of the reactor. Formation of CH4 would consume the hydrogen and alter the product composition which may give rise to potential difficulties in subsequent processes.
Activated Fe3O4 is pyrophoric, that is, it ignites spontaneously upon exposure to air, and as a result the catalyst must be re-reduced and stabilized by surface oxidation (using an inert gas with a low concentration of O2) before being re-used.
4.8.2.1 Catalyst Volume (from space velocity):
The catalyst volume can be obtained from space velocity data given in the problem statement coupled with the simulation figures for the flowrate of gases into the catalytic converter.
FOR 1ST STAGE:

4.8.2.2 Catalyst Mass (in 1st stage of converter):
FOR 2ND STAGE:

4.8.2.3 Catalyst Mass (in 2nd stage of converter):
4.8.3 CATALYTIC CONVERTER SIZING
In carrying out the sizing of Fixed Bed Reactors, most designs approximate to plug flow. The simplest of such arrangements is adiabatic (Chemical Process Design and Integration by Robin Smith).
A summary of the reactor dimensions is provided in the table that follows.
TABLE 4.11: REACTOR DIMENSIONS OF CATALYTIC CONVERTER
| CATALYST BED | LENGTH(M) | DIAMETER(M) | VOLUME(M3) |
| 1st Stage | 7.03 | 3.518 | 68.34 |
| 2nd Stage | 12.22 | 3.518 | 118.83 |
| REACTOR | |||
| 1st Stage | 8.795 | 3.518 | 85.50 |
| 2nd Stage | 14.61 | 3.518 | 142.06 |
| Total | 23.405 | 3.518 | 227.56 |
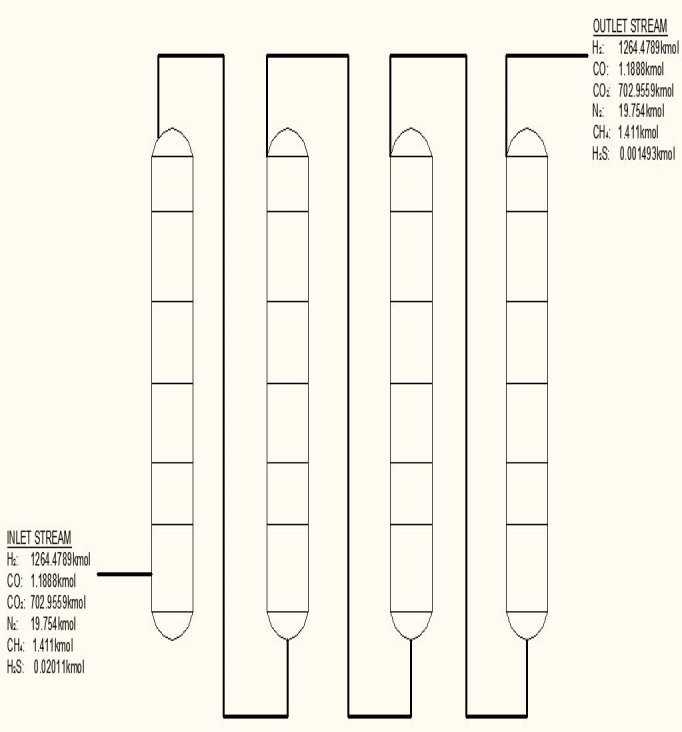
FIGURE 4.5 FINAL H2S SCRUBBER
The process:
The final H2S removal stage could be divided into two operations namely:
- Normal operation
- Intermittent regeneration operation
4.9.1 NORMAL OPERATION
The converted gas leaving an air-cooled heat exchanger is fed to the unit together with oxygen. Iron oxide in the Lautamasse reacts with hydrogen sulphide in the converted gas to form iron sulphide. The iron sulphide is an intermediate product and it reacts with the oxygen as quickly as it is formed to produce iron oxide and sulphur deposits. This process occurs continuously and is represented by the equation.
2Fe2O3(s) + 6H2S  2Fe2S3 + 6H2O
2Fe2S3 + 3O2 2Fe2O3 + 6S
4.9.2 REGENERATION OPERATION
When the quantity of sulphur deposit overtime attain a value between 40  55% of the dry weight of the Lautmasse, the normal process will be stopped. Hot oxygen only is then continuously fed to the unit in a parallel in order to oxidize the sulphur deposit to sulphur(iv) oxide gas which can be converted to tetraoxosulphate(vi)acid in order to generate money.
S(s) + O2(g) SO2(g)
The Lautamasse becomes ineffective when the regeneration process has been carried out for about 10times.
4.9.3 THE EQUIPMENT
The final H2S removal is to take place in
- Four vertical vessels
- A separate outlet from each of the vessel converging SO2 from regeneration
- A separate inlet header to each of the column, conveying heated oxygen.
- A minimum point where the oxygen and the converted gas is mixed.
- Each column contains five trays each containing Lautamasse
- The columns are to be identical.
The following was specified
- Height of column = 18.5 m
- Diameter of column = 2.5 m
- Number of trays = 5
- Total pressure drop = 35 KN/m2
- Number of columns = 4
- Locking lid type = Autoclave
Unspecified Parameter are:
- Plate type and its configuration
- Mass of iron oxide per tray
- Regeneration period
- Regeneration duration
- Tray thickness
- Tray spacing
Choice of tray – Bubble cap
Reasons:
- It provides maximum contact between the gas and solid unlike the sieve and valve trays.
- It allows for maximum occupation of the tray space volume by the Lautamasse powder.
- The riser hole size – 5 mm (Coulson and Richardson )
- Choice of material : Low alloy steel (Ni, Cr, Mo, V)
Properties
Tensile strength – 550 N/mm2
Design stress – 240 N/mm2
- Determination of number of holes
N = 25001 holes
(e) Determination of the mass of lautamasse and sulphur.
= 10402.6 Kg
When the quantity of sulphur deposit on the tray falls between 40-55% of the weight of the lautamsee the operation has to be stopped and then regeneration takes place.
Assuming the mass of sulphur and the lautamase is the ratio 1:0.4 that is assuming that sulphur is 50% of the total mass mixture.
Mass of sulphur
=3467.5kg
Mass of fe203 =
=6935kg
To calculate the time for regeneration:
4.9.4 ASSUMPTION
The absorption of H2S in the four columns are 50%, 30%, 20%, 10%. The assumption is based on the fact that absorption decreases along the column. But we want to model the column base on the absorption of the first column.
Time after which regeneration will take place is
=15.8months
 16months
After 16 months regeneration process has to be carried out.
Volume and height of sulphur and lautamasse determination.
Mass of sulphur = 3467.6kg
Density of sulphur = 2000kg/m3
Volume of sulphur = 
=
Height = 
= 
= 0.3532m
Lautamasse;
Density of lautamasse = 675kg/m3
Mass of lautamasse = 6935kg
Volume = 
= 10.274m3
Height = 
= 2.0930m
This is a good value since the higher the height of the lautamasse, the lesser the effective tray spacing.
Total height of lautamasse and sulphur
= 2.0930 + 0.3532
= 2.45m
4.9.5 REGENERATION
Sulphur deposit after 16months per column = 3467.5kg  5
5
= 17337.5kg
Amount in moles= 
= 541.797 moles
 S + O SO2
541.8 kmol of O2is required per column.
Since each column is designed assuming 50% of the total H2S absorbed
(4 541.797kmol)SO2 = 150% of the actual SO2 produced
Also, (4 541.797kmol)SO2 = 150% of the oxygen required
The actual SO2 produced = 1444.8kmol
The actual O2 required = 1444.8kmol
If regeneration is assumed to take place within 6hrs,
Flow rate of SO2 regenerated = 240.8kmol/hr
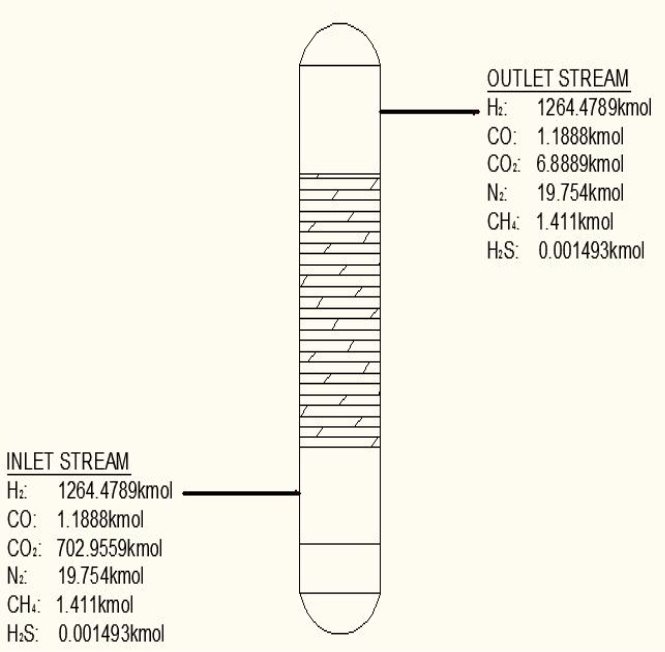
FIGURE 4.6 CO2 REMOVAL
Mechanism of Removal: Absorption
Absorption Mechanism: Chemosorption(Chemical Absorption)
Equation of Reaction
K2CO3(aq) + H2O(l) + CO2(g)  2KHCO3(aq)
Basis : 4125.535 kg of Feed / hr
TABLE 4.12: COMPOSITION OF INLET AND OUTLET STREAMS FOR CO2 REMOVAL
| COMPONENT | yin | yout |
| H2 | 0.63326 | 0.9800 |
| CO | 0.00060 | 0.00093 |
| C02 | 0.35555 | 0.00247 |
| N2 | 0.00989 | 0.0155 |
| CH4 | 0.00071 | 0.001104 |
| H2S | 5.33E-07 | 8.34E-07 |
| TOTAL | 1.000000 | 1.000000 |
ASSUMPTION: Only Carbon dioxide (CO2)is absorbed and all the other gases act as inert in the 40% K2CO3 solution.
Mole Ratio Of Co2 In The Gas Entering The Column
Mole Ratio Of Co2 In The Gas Leaving The Column
Plotting the equilibrium curve for CO2
TABLE 4.13: EQUILIBRIUM DATA FOR CO2 REMOVAL
 |
X | Y | X | Y |
| 0.025 | 0.1 | 0.0017 | 0.111111 | 0.001703 |
| 0.18 | 0.2 | 0.0122 | 0.25 | 0.012351 |
| 0.6 | 0.35 | 0.0408 | 0.538462 | 0.042535 |
| 1.7 | 0.5 | 0.1156 | 1 | 0.13071 |
| 4.0 | 0.68 | 0.2722 | 2.125 | 0.374004 |
| 7 | 0.75 | 0.4762 | 3 | 0.909126 |
| 10 | 0.8 | 0.6803 | 4 | 2.127932 |
| 11 | 0.9 | 0.748 | 9 | 2.968254 |
4.10.1 PACKING MATERIAL: Pall Rings (Plastic)
Pall rings are chosen as the Fp (Packing Factor), small column diameter, high quality with low price, low pressure drop.
The packing characteristics
Dp = 90mm
% = 92%
= 92%
Summary of design
TABLE 4.14: SUMMARY OF CO2 ABSORBER DIMENSIONS
| COLUMN DIAMETER | 1.3m |
| COLUMN HEIGHT | 24.96m |
| PACKING TYPE | Plastic pall rings |
| DIAMETER OF PACKING | 90mm |
| VOIDAGE | 92% |
| SPECIFIC AREA | 85m2/m3 |
| PACKING FACTOR | 17.07 ft-1 |
| QTY OF SOLVENT REQUIRED | 852.537 kmol/hr |
- HEAT EXCHANGER DESIGN
4.11.1 THE PROPOSED DESIGN
TABLE 4.15: SUMMARY OF PROPOSED HEAT EXCHANGER DESIGN
| EXCHANGER | FIRST | SECOND |
| Tube Layout | Split ring, floating head, 1 shell pass, and 1 tube pass of4.83 m length, 30 mm O.D., 26 mm I.D., and triangular pitch. Pitch-to-diameter ratio of 1.25 | Split ring, floating head, 1 shell pass, and 4 tube passes of6.00 m length, 20 mm O.D., 16 mm I.D., and triangular pitch. Pitch-to-diameter ratio of 1.25 |
| Total number of Tubes/Number of Tubes per pass | 96/96 | 1308/327 |
| Heat transfer area (based on outside diameter)m2 | 43 | 493 |
| Shell Internal diameter (mm) | 484.5 | 1064.4 |
| Baffle spacing (mm) | 97 | 212.88 |
| Baffle cut | 25% | |
| Tube-side coefficient (W/m2 °C), clean. | 252.97 | 102.42 |
| Overall coefficient, estimated (W/m2 °C). | 120.00 | 60.00 |
| Overall coefficient required (W/m2°C). | 149.85 | 67.81 |
| Dirt/Fouling factors
Tube-side/Shell-side(m2 °C /W) |
0.0002 /0.0003 | 0.0002 /0.0003 |
| Pressure drops, including drop over nozzles (estimated)
Tube-side/Shell-side (kPa) |
253/452 | 73/969 |
4.11.2 OPTIMISATION
There is scope for optimizing the design by reducing the number of tubes, as the pressure drops are well within specification and the overall coefficient is well above that needed. However, the method used for estimating the coefficient and pressure drop on the shell side(Kern’s method) is not so accurate, so keeping to this design will give some margin of safety.
4.11.3 VISCOSITY CORRECTION FACTOR
The viscosity correction factor  was neglected when calculating the heat transfer coefficients and pressure drops. This is reasonable for gases as it has a relatively low viscosity.
Usually, 
For such a small factor, the decision to neglect it was justified. Applying the correction would decrease the estimated heat transfer coefficient, which should not be a problem as the area required for heat exchange is well taken care of. It would also give a slight increase in the estimate.
4.11.4 OXYGEN STREAM PRE-HEATER.
4.11.4.1 FLUID ALLOCATION
Placing the higher temperature stream on the tube side will reduce the overall cost of design. Therefore, the saturated stream is placed in the tubes.
4.11.4.2 DUTY OF PRE HEATER
Let us assume that the amount of saturated stream used for pre-heating of the O2 stream gives off ‘ONLY’ its Latent Heat to the O2 – stream
Q= 877.04 ×10³ KJ/hr
= 243.622 ×10³ W
MASS OF SATURATED STREAM REQUIRED.
mS = 0.1414 Kg/sec
MEAN TEMPERATURE DIFFERENCE (ΔTm)
ΔTm= 0.986(114.823 0c)
= 133.215 0c
4.11.4.3 ESTIMATION OF U (Overall Coefficient)
An estimation of 200W/m2C for the overall Heat Transfer Coefficient is chosen as suggested by literature.
4.11.4.4 PROVISIONAL AREA.
A = 10.76m2
4.11.4.5 TUBE DIMENSION SELECTION
- Outer Diameter – 20mm
- Inner Diameter – 16mm
- Length of Tube – 6.10m
- Tube Effective Length- 6.0m
Small diameter tubes are chosen because they give more compact & cheaper exchangers. Use of longer tubes will reduce shell diameter thus lowering cost exchanger.
Heat Transfer Area of 1 tube = πdoL
= π(20/1000)(6)
= 0.37699m2
4.11.4.6 NUMBER OF TUBES REQUIRED
Number of tubes = 28.542
=28 tubes
4.11.4.7 TUBE ARRANGEMENT SELECTION.
A Triangular Tube Arrangement pattern is chosen as it gives higher heat transfer rates as compared to others. The recommended tube pitch is 1.25 times the Tube Outside Diameter(do). Tube Bundle Diameter is therefore
= 170mm
4.11.4.8 SHELL DIAMETER DETERMINATION
Using a Split Ring Floating Head unit, the Diameter clearance between the Shell and Tube Bundle is 50mm
Therefore,
Shell Diameter = 170 +50 = 220mm
4.11.4.9 TUBE SIDE COEFFICIENT
A Horizontal Condenser with condensation in the tubes is the usual arrangement for pre-heaters &vaporizers using condensing steam as the heating medium. It is customary to design purposes. For air- free steam, a coefficient of 8000W/m2 is used. Therefore,
hI= 8000W/m2
4.11.4.10 MASS VELOCITY IN SHELL (GS)
GS = 134.917Kg/m2s
4.11.4.11 LINEAR VELOCITY (Us)
US = 3.20m/sec
4.11.4.12 SHELL SIDE EQUIVALENT DIAMETER
For a Triangular pitch Arrangement
de = 1.10/do[pt2– 0.917do2]
= 14.2mm
4.11.4.13 AVERAGE PHYSICAL PROPERTIES OF SHELL FLUID
- Viscosity (µ) = 2.61 ×10⁻⁵ Pas
- Thermal Conductivity (K) = 3.448 × 10⁻² W/mK
- Heat Capacity (Cp) = 0.9818 ×10³ J/Kg 0C
4.11.4.14 REYNOLD’s NUMBER ON SHELL SIDE
Re = 73402.99987
4.11.4.15 PRANDTL’s NUMBER ON SHELL SIDE
Pr = 0.74318
4.11.4.16 HEAT TRANSFER COEFFICIENT (SHELL SIDE)
hs = 317.324W/m2 0c
4.11.4.17 OVERALL COEFFICIENT
U= 322.691 W/m2 0c
4.11.4.18 PRESSURE DROP CALCULATIONS
On the Shell Side
Re= 73402.99987
JF= 3.6 × 10⁻²
ΔPs = 4(3.6×10⁻²)(220/14.2)(6000/220)(42.07×3.202)
= 26.2112 KN/m2 which is very acceptable
On the Tube Side:
The pressure drop on the condensing side or tube side is difficult to predict as 2 phases are present & the vapour mass velocity is changing throughout the tube side.
4.11.5 AIR-COOLED EXCHANGERS
Air-cooled exchangers should be considered when cooling water is in short supply or expensive. They can also be competitive with water-cooled units even when water is plentiful. Frank (1978) suggests that in moderate climates air-cooling will usually be the best choice for minimum process temperatures above 65°C, and water-cooling for minimum process temperatures below 50°C. Between these temperatures a detailed economic analysis would be necessary to decide the best coolant. Air-cooled exchangers are used for cooling and condensing. Air-cooled exchangers consist of banks of finned tubes over which air is blown or drawn by fans mounted below or above the tubes (forced or induced draft). Typical units are shown in Figure 2 below. Air-cooled exchangers are packaged units, and would normally be selected and specified in consultation with the manufacturers. The equation for finned tubes given below can be used to make an approximate estimate of the area required for a given duty (Sinnott, 2005).
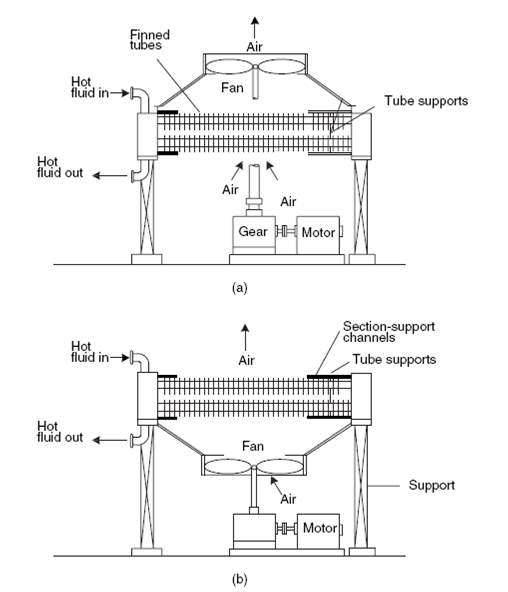
FIGURE 4.7 AIR-COOLED EXCHANGERS
4.11.5.1 FINNED TUBES
Fins are used to increase the effective surface area of heat-exchanger tubing. Many different types of fin have been developed, but the plain transverse fin shown in Figure 2 is the most commonly used type for process heat exchangers.
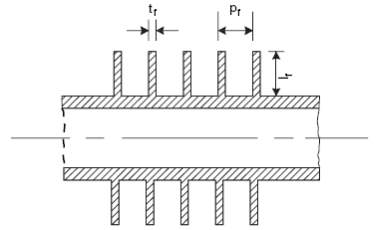
FIGURE 4.8: FINNED TUBE
Finned tubes are used when the heat-transfer coefficient on the outside of the tube is appreciably lower than that on the inside; as in heat transfer from a liquid to a gas, such as in air-cooled heat exchangers.
The fin surface area will not be as effective as the bare tube surface, as the heat has to be conducted along the fin. This is allowed for in design by the use of a fin effectiveness, or fin efficiency, factor.
(Sinnott, 2005)
 (4.11.1)
LMTD = 47.28°C
 (4.11.2)
Prandtl Number
 (4.11.3)
Thus, the Prandtl number for air at 216.4 °C = 0.69
Heat Duty Required
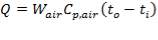 (4.11.4)
Hence, the heat duty Q of the exchanger = 1.013 KJ/kg °C
Overall Heat Transfer Coefficient for the Design
 (4.11.5)
Trials with various values of U
TABLE 4.16: HEAT TRANSFER COEFFICIENTS WITH CORRESPONDING AREA AND FACE VELOCITY VALUES
| S/N | U (KJ/hr m2°C) | A (m2) | vair (m/s) |
| 1 | 6.127 × 10⁴ | 965.56 | 3.00 |
| 2 | 8.169 × 10⁴ | 724.167 | 4.00 |
| 3 | 1.225 × 10⁵ | 482 | 6.00 |
In addition,
 (4.11.7)
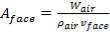
Aface = face area (m2)
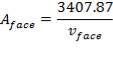
TABLE 4.17: CORRESPONDING FACE AREA AND FACE VELOCITY VALUES
| vface (m/s) | Aface (m2) |
| 3 | 1135.96 |
| 4 | 851.97 |
| 6 | 567.91 |
Substituting Wair in (4.11.7) into (4.11.4),
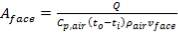 (4.11.8)
ρair = density of air, 1.1762 kg/m3
So far, for heat exchanger parameters,
U = 1.2254 × 10⁵ KJ/hr m2 °C
A = 482.78 m2
vface = 6 m/s
Aface = 567.91 m2
4.11.5.2 FAN COVERAGE
= 293.96 m2
For the design also, we choose to use two fans rather than one, as this takes care of cooling over a bit of a longer distance of fan stages, and provides insurance in case of failure of one fan or the other.
4.11.5.3 FAN DIAMETER
With the two identical fans to be used the diameter is simply computed with the diameter, thus;
Diameter of fan = 13.45 m
General Properties of the Fans to be used as per industrial standards
Fan speeds vfan = 70 m/s
V-belt drive of about 30 horsepower
Forced draft fan system will be used as it uses less power in blowing cool air volume
4.11.5.4 FIN AREA AND TUBE AREA ANALYSES
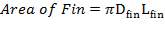
 (4.11.10)
 (4.11.11)
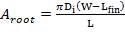 (4.11.12)
Dfin = Diameter of fin = 12.7 mm
De = External diameter of the tube = 41.2 mm
Di = Internal diameter of the tube = 37.2 mm
W = Width of tube = 4.00 m
Lfin = Length of fin = 68.2 mm
L = Length of tube = 15 m
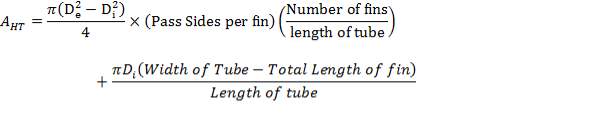
AHT = Total heat transfer area per length of tube = 0.01644 m2/m
Number of tubes per row of each metre in a tube bank = n× = 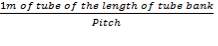
With the chosen pitch, P = 47.625 mm; n× = 20.997 ≈ 21 tubes per row
Number of rows n, chosen = 4; and given that W = 4.00 m,
Total number of tubes, N = n× × W × n = 336 tubes.
Because liquids are incompressible, Equation 1 may be used to calculate the work required to pump a liquid. The kinetic energy term is small compared to the other terms and is neglected. Therefore, Equation 4.11.1 reduces to
g∆z + ∆p/ρ+ W+ E = 0, defining points 1 and 2,we have,
g (z2 – z1,) + (p2 – p1,)/ρ + W + E = 0 (4.12.1)
The friction pressure loss term is split into two parts, one for the suction side of the pump, Es, and, the other for the discharge side of the pump, ED. Thus, Equation 1 becomes, after solving for W.
W = g (z1 – z2) + (p1 – p2)/ρ – (Es + ED) (4.12.2)
Frequently, we must make a preliminary estimate of the pump work. Manufacturers do not stock all pumps and other expensive machinery because of the cost of carrying an inventory. The machinery is manufactured on receipt of an order from a customer. Manufacturing some process machinery, may take six months or longer. To save time in implementing a project will require ordering equipment having long delivery times before completing a detailed design. Also, the management of a firm will require an estimate of the cost of a project to prepare a budget or a proposal for a customer. Once the work is estimated, the pump shaft power,
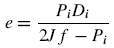
Pp = mW/ ɳP (4.12.3)
where, ɳp – the pump efficiency, includes both the hydraulic and mechanical frictional losses. Below outlines a calculation procedure for calculating an approximate pump size.
4.12.1 Approximate Pump-Sizing Calculation Procedure
1. Define the flow system, i.e., locate points 1 and 2. The pressures p1 and p2 will be known at these points.
2. Locate the process equipment according to the rules-of-thumb which is zero above ground level for pumps.
3. Estimate z 1 and z2.
4. Estimate the frictional pressure losses Es and ED according to the table 2 given below.
5. Calculate the pump work from Equation (4.12.2)
6. Calculate the pump shaft horsepower using Equation (4.12.3) and the pump efficiencies
given in the excel spreadsheet.
7. Calculate the electric-motor horsepower using the motor efficiency given in
the spreadsheet.
8. Select a standard electric-motor horsepower using the spread sheet to obtain approximately
a 10% safety factor.
TABLE 4.18: APPROXIMATE FRICTIONAL PRESSURE DROP ACCROSS PROCESS EQUIPMENT
4.12.2 THE METERING RAM PUMP
The pumped fluid contacts only the inside surface of the tubing. There are no other valves, O-rings, seals or packing to worry about in a peristaltic pump. Therefore, the only compatibility to worry about in a peristaltic pump is the tubes for the fluid being pumped. Of all the design parameters, the compatibility is the first one that need to be considered.
The tube is made elastomeric in order to maintain the circular cross section of cycles of squeezing in the pump. This requirement eliminates a variety of non-elastomeric polymers that have compatibility with a wide range of chemicals, such as PTFE, polyolefins, PVDF etc. from consideration as material for pump tubing. Elastomers, both natural and synthetic, have common characteristics including elastic recovery after stress, flexibility, extrusion resistance, and relative impermeability to gases and liquids. Each class of elastomer has its own unique properties and performance that can be modified by the inclusion of other ingredients.
Reasons why tube is made elastomeric and not plastic are because elastomer provide :
1. Very good dimensional stability over a broad temperature range
2. High compression set resistance
3. Excellent extrusion resistance at high temperatures and pressures
4. Retention of sealing force during pressure and temperature cycling (a major problem with many plastics)
5. Elastomers are long-chain polymers connected by cross-links that impart strength, resilience and elasticity, and these cross-links are very stable to heat and high pressure. Plastics are also long-chain polymers, but they are not connected by chemical cross-links. Plastics acquire their strength when the chains orient with one another and become crystalline in regions. These regions may deform or melt under high pressure and temperature.
There are over 20 classes of elastomers. Of all these classes, the most ideal elastomer for this work is EPDM (ethylene propylene diene Monomer) + polypropylene (as in Santoprene).
Reasons why EPDM (ethylene propylene diene Monomer) + polypropylene (as in Santoprene) is the most ideal :
1. It has a wide service temperature range
2. EPM elastomers have excellent resistance to ozone, water and steam, alkalis and acids, salt solutions and oxygenated solvents
3. Very good balance of compression set, flex resistance, physical strength, low temperature flexibility, weather resistance properties, and resistance to acid condensates
4. Outstanding resistance to high heat; excellent resistance to oil, gasoline, hydraulic fluids and hydrocarbon solvents; very good impermeability to gases and vapor; very good resistance to weather, oxygen, ozone, and sunlight; good flame retardant.
5. EPDM + polypropylene have the best fatigue resistance compare to other elastomers
4.12.2.1 OCCLUSION
The minimum gap between the roller and the housing determines the maximum squeeze applied on the tubing. The amount of squeeze applied to the tubing affects pumping performance and the tube life – more squeezing decreases the tubing life dramatically, while less squeezing decreases the pumping efficiency, especially in high pressure pumping. Therefore, this amount of squeeze becomes an important design parameter.
The term “occlusion” is used to measure the amount of squeeze. It is either expressed as a percentage of twice the wall thickness, or as an absolute amount of the wall that is squeezed.
Mathematically;

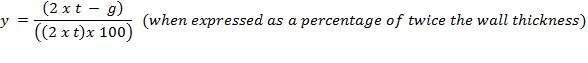
Where;

For this design work , the wall thickness of the tube of the peristaltic pump(t) is 4mm and the minimum gap between the roller and the housing(g) is 1.6mm so the percentage occlusion is calculated using the above formular
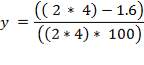

Occlusion is one of the key peristaltic pump design parameter because it affects not only the efficiency of the fluid movement in the pump but the life span of the tube. The higher the occlusion, the more efficiently the pump moves fluid and the lower the occlusion, the less efficiently the pump moves fluid. The occlusion not only alters the efficiency of the pump but also the lifespan of the tubing. By increasing the occlusion, you are squeezing the tubing with greater force, which will wear out the tubing material faster. Prepare replacement tubing are provided because of the high occlusion , and because a replacement tubing may be needed is one of the reasons why EPM elastomer tubing is the choice of tubing because it is inexpensive.
5 MECHANICAL DESIGN
5.1.1 DESIGN PRESSURE
5.1.2 DESIGN TEMPERATURE


5.1.3 MATERIAL OF CONSTRUCTION
The wall of the gasifier is made of Austenitic stainless steel (Type 316) as in the storage tanks.
Lining Material (Refractory block):Refractory liners are used on the working face of entrained-flow slagging gasifiers that react coal, petroleum coke, heavy fuel oil or other feedstock with oxygen and water. The refractory liners protect the gasifier shell from elevated temperatures, corrosive slags, and thermal cycling during gasification. Refractory failure is primarily by two means which are corrosive dissolution and spalling. High chrome gasifier materials have evolved as the material of choice to line the hot face of gasifiers, yet the performance of these materials does need to improve by coating it with substances like magnesium oxide, aluminium oxide and/or chromium oxide (Bennet, 2004).
Therefore,
The refractory liner for the heavy fuel oil gasifier is: Chromium oxide coated with zirconium oxide and aluminium oxide (Cr2O3: 90%, Al2O3: 3%, ZrO2: 7% in weight %)
5.1.4 THICKNESS OF THE REFRACTORY BRICK
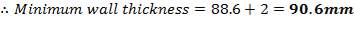
Assuming that the ratio of the thickness of the vessel to the lining material is taken as 8:1, the thickness of the refractory lining is therefore = 90.6/8 mm = 11.325 mm
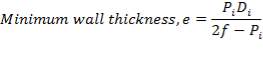
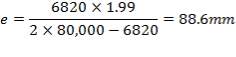
5.1.5 MINIMUM WALL THICKNESS
The minimum thickness required to resist the internal temperature of the gasifier is calculated thus,
5.1.6 MINIMUM HEAD THICKNESS
An Ellipsoidal head is chosen as the closure for this vessel because it is relatively cheaper than the torispherical head and it can withstand the design pressure of the vessel (Coulson and Richardson, 1999). The minimum thickness required is obtained thus,
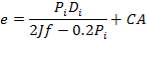
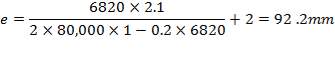
Thickness of the head = 92.2 mm
5.1.7 VESSEL SUPPORT
Skirt Support is chosen because it is suitable for tall and vertical columns as it does not impose concentrated load on the vessel.
With the heat exchanger geometry defined, the mechanical design calculations must be done to ensure that the heat exchanger design is valid for the design pressure and conditions. The typical calculations are:
- Calculation of shell wall thickness.
- Calculation of nozzle wall thickness.
- Calculation of tube plate thickness.
SHELL WALL THICKNESS DETERMINATION
Pi= 3000 kPa
Di = 1.078 m
At the shell side mean temperature of 192oC,
f = 134 × 106N/m2
Therefore,
e = 3000000( 1.078)/ [2(134 × 106) – 3000000]
= 12.2 mm
Other design specifications include:
- Design Pressure = 110% of operating Pressure = 3300 kPa
- Design temperature = Maximum shell temperature = 220oC
- Corrosion Allowance = 4 mm
5.3.1 MATERIALS FOR CONSTRUCTION:
Carbon Steel is advised because, of its operability at not so high-pressure, because of its hardness and malleability and because it is most popular and therefore easy to obtain.
5.3.2 PACKING:
Interlox saddle packing was chosen because they are more efficient due to greater surface and improved hydrodynamics. They are made with a variety of holes and protrusions to enlarge the specific surface area. Because of their open structure and large specific surface area, mass transfer efficiency is high when proper distribution of liquid and gas over the cross section can be maintained. It also important to note that when ceramic construction of packing is suitable, saddles are the preferred packing.
5.3.3 DESIGN PRESSURE
Assuming 8% above operating pressure
= 1.08 x 4241.325 KN/m2
= 4580 .631 KN/m2
(4580.631-101.325) gauge
= 4479.306 kN/m2 gauge
5.3.4 DESIGN TEMPERATURE
This is obtained as,
= Highest Temperature + allowance for uncertainty
Assuming an uncertainty of 80oC
Therefore, design temperature= (250+ 80) oC
=330oC
5.3.5 TENSILE STRENGTH
At 25oC, the tensile strength of Carbon =210N/mm2
At 500oC, the tensile strength of Carbon is 450 N/mm2
At 330oC, the tensile strength of Carbon will be,
TABLE 5.1: TENSILE STRENGTH VALUES AT DIFFERENT TEMPERATURES
| TEMPERATURE, OC | TENSILE STRENGTH, N/MM2 |
| 25 | 210 |
| 330 | X |
| 500 | 450 |
Interpolating we have,
(330 – 25) / (500 – 25) = (x – 200) / (450 – 210)
x=154+200
= 354N/mm2
5.3.6 DESIGN STRESS:
At 300oC, the design strength of Carbon = 85N/mm2
At 350oC, the design strength of Carbon is 80 N/mm2
At 330oC, the design strength of Carbon will be,
(COULSON AND RICHARDSON, VOL 6)
TABLE 5.2: DESIGN STRESS VALUES AT DIFFERENT TEMPERATURES
| TEMPERATURE, OC | DESIGN STRESS, N/MM2 |
| 25 | 85 |
| 330 | X |
| 500 | 80 |
Interpolating we have,
(330 – 300) / (350 – 300) = (x – 85) / (80 – 85)
X = τ = 82 N/mm2
Nominal design stress = 1.5 × = 1.5 x 82
= 123 N/mm2
5.3.7 CHOICE OF CLOSURE
Minimum wall thickness required for a cylindrical shell
e= Pi Di / 2f – Pi
Given that,
Pi = 4241.325 KN/m2
Di = Internal diameter = 0.5275 m
therefore,
E = (4241.325 × 0.5275)
2 × 82000 – 4241.325
= 14 mm
Corrosion allowance = 2 mm
Minimum thickness of wall required = 14 mm + 2 mm = 16 mm
Choice of closure = Hemispherical head
Optimum thickness ratio for a hemispherical head to the thickness of the vessel = 0.6 (Coulson and Richardson, 2005)
Thickness of the hemispherical head = 16 x 0.6 mm = 9.6 mm
Type of Vessel Support = Skirt Support
5.4.1 Shell Thickness
Thickness of shell, 
where,
Inner diameter of vessel (D) = 1.3 m
Working pressure = 1.013 ×10⁶ N/m2
Design pressure (P) = 1.1× 1.013 x 106 N/m2
Permissible Stress (f) = 115 × 106 N/m2
Joint Efficiency (J) = 0.85
Corrosion allowance (c) = 2mm
hence,

So outer diameter of shell
- Axial Stress Due to Pressure
Axial stress due to pressure, 
- Stress due to Dead Load
- Compressive Stress due to weight of shell up to a distance X

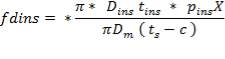
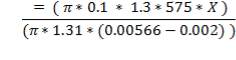
- Compressive stress due to weight of insulation at height X
Insulator used is asbestos
Thickness of insulation,  = 100mm
Diameter of insulation, 
Density of insulation = 575 kg/m3
Mean diameter of vessel = 
For large diameter column,

- Compressive stress due to liquid in column up to height X
- Effect of attachments
- Packing weight
- Head weight
- Ladder
Density of packing (Plastic pall rings) = 53 kg/m3
Packing weight = 
= 690.11 X N
Head weight (approximately) = 35000 N
Weight of ladder = 1600 X N
5.4.2 SUPPORT FOR ABSORBER
Material used is structural steel (IS 800)
Skirt support is used
Inner diameter of the vessel = Di = 4.69m
Outer diameter of the vessel = Do = 4.70m
Height of the vessel = H = 10.054m
Density of carbon steel =  = 7700kg/m3
Density of packing =  = 53 kg/m3
The catalytic converter primarily functions to provide surface area required for the exothermic reaction involved in the water-gas shift reaction and also to house the catalyst required for the reaction. The materials that make entry into the converter include steam and flue gases which exit the initial H2S removal stage and basically include hydrogen, carbon monoxide. Hydrogen sulphide, methane and nitrogen. The major aspects that will be considered in the mechanical design include:
- Operating and design temperatures and pressures
- Vessel dimensions and orientation
- Construction materials
- Type of vessel heads
5.5.1 Operating and Design temperatures and pressures
The operating temperature of the catalytic converter: 380 0C
The operating pressure of the catalytic converter: 1200 kPa
The design temperature of the catalytic converter: 480 0C (catalyst)
The design pressure of the catalytic converter: 1.1 1200 kPa = 1320 kPa
The maximum operating with respect to catalyst degeneration: 476.67 0C
5.5.2 Vessel Dimensions and Orientation
The major dimensions have earlier been calculated in the chemical engineering design section of this unit; the diameter being 3.518m and total height of 23.41m. Minimum wall thickness – the thickness required to ensure that any vessel is sufficiently rigid to withstand its own weight, and any incidental loads; and for a diameter of about 3.5 m, this thickness is about 16 mm. Also, a 3mm corrosion allowance is added. The “corrosion allowance” is the additional thickness of metal added to allow for material lost by corrosion and erosion, or scaling.
5.5.3 Construction Materials
Construction materials for pressure vessels are usually plain carbon steels; low and high alloy steels, other alloys, clad plate, and reinforced plastics. Because the temperature of the reactor shell is very high, the reactors must be made of alloy steel which can sustain high temperature and is highly resistant to hydrogen corrosion. A “cold wall” reactor is lined with heat-insulating material. The temperature of the reactor shell is quite low, ordinary low alloy steel can be used for making such reactors.
Alloy steels contain one or more alloying agents to improve mechanical and corrosion-resistant properties over those of carbon steel.
Nickel increases toughness and improves low-temperature properties and corrosion resistance. Chromium and Silicon improve hardness, abrasion resistance, corrosion resistance, and resistance to oxidation.
Molybdenum provides strength at elevated temperatures.
5.5.4 TYPE OF VESSEL HEAD
The vessel head indicates the closure. Ellipsoidal heads will be made use of. The ellipsoidal head thickness can be calculated using the following formula:
where, Pi – is the internal pressure; = 1200 kPa =1.2 Nmm-2
Di – the internal diameter; = 3.518 m
J – the joint factor; which is equal to 1 as a result of the absence of joints
f– the design stress at the specified temperature, equal to 180 N/mm2
Others include:
5.5.5 Openings required
Two openings are required:
An entry opening at the vessel top
An exit opening at the vessel bottom
Removable baffles for catalyst loading and discharge
5.5.6 Heating and Cooling Jackets or Coils.
Since its been established that a cold wall reactor will be used for the wall of the catalytic converter, implying an adiabatic arrangement to be ensured by incorporating on the reactor body an insulating material.
5.5.7 Internal fittings specification
The reactor will also consist of a reactor cylindrical shell, inlet diffuser, vapor-liquid distributor, scale removing basket, catalyst supporting plate, catalyst pipe, quench hydrogen box and a re-distributor, outlet accumulator, catalyst removal port and quench hydrogen pipe.
Also needed are Skirt supports of about 5 mm thickness;
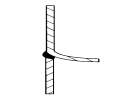
FIGURE 5.1 SKIRT-SUPPORT
Base rings and anchor bolts for the supports.
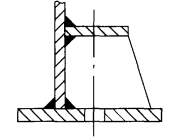
FIGURE 5.2 DOUBLE PLATE WITH GUSSET
Design stress 240N/mm2
Construction material ; low alloy steel
Tray thickness; 12mm
Design temperature; 30 – 45oC
5.6.1 Design pressure:
This should be 10% greater than operating pressure
= 
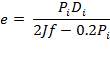
5.6.2 Wall thickness
e = 
e = wall thickness
Pi= internal design pressure
Di= internal chamber
 = design stress
e = 
= 12.9 mm
Using corrosion allowance of 2mm
e= 14.9mm
5.6.3 Support
Skirttype is recommended
Material for the absorber shell is Carbon steel
5.7.1 Shell Thickness
Thickness of shell,
where,
Inner diameter of vessel (D) = 1.3 m
Working pressure = 1.013 ×10⁶ N/m2
Design pressure (P) = 1.1× 1.013 x 106 N/m2
Permissible Stress (f) = 115 × 106 N/m2
Joint Efficiency (J) = 0.85
Corrosion allowance (c) = 2mm
Hence,
So outer diameter of shell
5.7.2 Axial Stress Due to Pressure
Axial stress due to pressure ,
5.7.3 Stress due to Dead Load
5.7.3.1 Compressive Stress due to weight of shell up to a distance X
5.7.3.2 Compressive stress due to weight of insulation at height X
Insulator used is asbestos
Thickness of insulation, = 100mm
Diameter of insulation,
Density of insulation = 575 kg/m3
Mean diameter of vessel =
For large diameter column,
5.7.3.3 Compressive stress due to liquid in column up to height X
5.7.4 Effect of attachments
- Packing weight
- Head weight
- Ladder
Density of packing (Plastic pall rings) = 53 kg/m3
Packing weight =
= 690.11 X N
Head weight (approximately) = 35000 N
Weight of ladder = 1600 X N
5.7.5 SUPPORT FOR ABSORBER
Material used is structural steel (IS 800)
Skirt support is used
Inner diameter of the vessel = Di = 4.69m
Outer diameter of the vessel = Do = 4.70m
Height of the vessel = H = 10.054m
Density of carbon steel = = 7700kg/m3
Density of packing = = 53 kg/m3
With the heat exchanger geometry defined, the mechanical design calculations must be done to ensure that the heat exchanger design is valid for the design pressure and conditions. The typical calculations are:
- Calculation of shell wall thickness.
- Calculation of nozzle wall thickness.
- Calculation of inner tube wall thickness.
- Calculation of expansion joint dimensions (to compensate for shell and tube side differential expansion due to temperatures differences.
- Calculation of tube plate thickness.
5.8.1 FIRST EXCHANGER
5.8.1.1 Shell Wall Thickness (Corrosion Allowance = 2 mm):
 (Sinott, 2005)
Where f is the design stress, and Pi is the internal pressure.
Design pressure; take as 10 per cent above operating pressure,
= 31.9 bar
= 3.19 N/mm2
Typical design stress f = 540 N/mm2
e = = 1.70; with J = 0.85 for shell and tube exchangers
Adding corrosion allowance, 1.70 + 2 = 3.70, say 4.00 mm
5.8.1.2 Nozzle wall thickness:
Tube has been designed to provide entrance for nozzle = (0.2 shell diameter)
Thus nozzle diameter =
Nominal thickness at this condition is 0.5 in (=12.7mm) (Shilling et al., 1997)
5.8.1.3 Inner tube wall thickness:
With the tube dimensions selected according to standard,
Thickness = 
5.8.1.4 Calculation of tube plate thickness:
The minimum plate thickness enough to withstand the bending and shearing force is gotten from literature as:
Minimum plate thickness = 0.75
5.8.1.5 OTHER SPECIFICATIONS
Number of baffles  Hence
Hence 
Baffle clearances
The edge distance between the outer-tube limit (OTL) and the baffle diameter has to be sufficient to prevent tube breakthrough due to vibration.
Baffle clearance = 11mm (for shell ID  m) (Shilling et al., 1997)
Distance from tube O.D to centre of partition
Distance = 9.5mm (for ID )
)
Design temperature
Built to withstand 10% above highest stream temperature = (373.4 °C) × 1.1 ≈ 411 °C
Design pressure
Take as 10% above operating pressure = (30-1) × 1.1 = 39.1 bars
SECOND EXCHANGER
Shell wall thickness e (Corrosion Allowance = 2 mm):
(Sinott, 2005)
Design pressure; take as 10 per cent above operating pressure,
= 26.4 bar
= 2.64 N/mm2
Typical design stress f = 540 N/mm2
e = = 3.07; recall J = 0.85
Adding corrosion allowance, 3.07 + 2 = 5.07, say 6.00 mm
Nozzle wall thickness:
Tube has been designed to provide entrance for nozzle = (0.2 shell diameter)
Thus nozzle diameter=
Nominal thickness at this condition is 0.432in (=10.97mm)
Inner tube wall thickness:
Thickness=
Calculation of tube plate thickness:
Minimum plate thickness=0.75
OTHER SPECIFICATIONS
Number of baffles  Hence
Hence 
Baffle clearances
Baffle clearance=13mm (for shell ID m) (Shilling et al., 1997)
Distance from tube O.D to centre of partition
Distance = 9.5mm (for ID m)
m)
Design temperature
Built to withstand 10% above highest stream temperature = (380.9 °C) × 1.1 ≈ 420 °C
Design pressure
Take as 10% above operating pressure = (25-1) × 1.1 = 26.4 bars
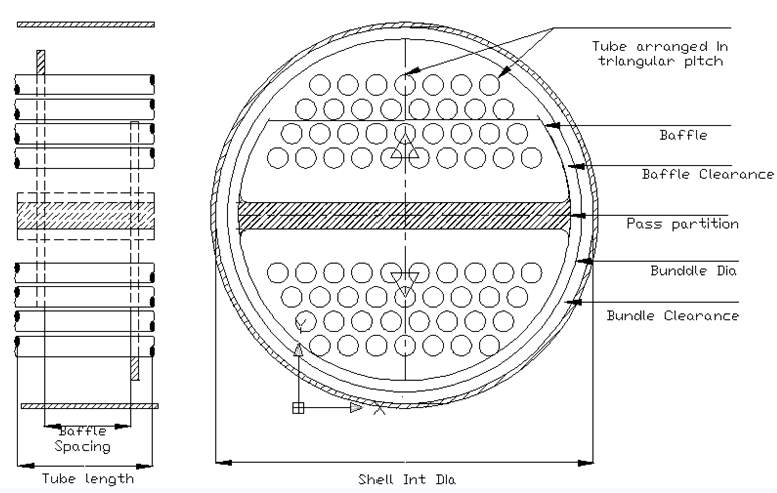
FIGURE 5.3: PHYSICAL LAYOUT OF A 2-TUBE PASS SHELL AND TUBE EXCHANGER
CHAPTER SIX
6 PLANT HAZARD AND OPERABILITY STUDY
GASIFIER INTENTION: to cause partial oxidation of the heavy oil feedstock.
TABLE 6.1:HAZOP ANALYSIS FOR GASIFIER
| GUIDE WORD | DEVIATION | CAUSES | CONSEQUENCES | ACTION |
| NO | Flow (steam & gas) | Control valve stuck closed | Delays the reaction | Fit low temperature alarm |
| MORE | Flow (Steam/Oxygen) | Failure of ratio flow or failure of control valve |
|
1)Alarms
2) Automatic shutdown |
| AS WELL AS | Composition | Refractory particles from reactor | Possible blockage of boiler tubes | Install filters up-stream of boiler |
TABLE 6.2: HAZOP ANALYSIS FOR WASTE HEAT BOILER
| GUIDE WORD | DEVIATION | CAUSES | CONSEQUENCES | ACTION |
| NONE | No tube side fluid flow | Failure of inlet tube side valve to open | Process fluid temperature is not heated accordingly | Install Temperature indicator before and after the process fluid line
Install TAH |
| MORE | More tube side fluid flow | Failure of inlet tube side valve to close | Output of Process fluid temperature too high | Install Temperature indicator before and after process fluid line
Install TAL |
| LESS | Less tube side fluid | Pipe leakage | Process fluid temperature too low | Installation of flow meter |
| REVERSE | Reverse process fluid flow | Failure of process fluid inlet valve | Product off set | Install check valve (whether it is crucial have to check?) |
| CONTAMINATION | Process fluid contamination | Contamination in cooling water | Outlet temperature too low | Proper maintenance and operator alert |
TABLE 6.3: HAZOP ANALYSIS FOR HEAT EXCANGERS
| GUIDE WORD | DEVIATION | CAUSES | CONSEQUENCES | ACTION |
| LESS | Less flow of shell side fluid | Pipe blockage | Temperature of process fluid increase | High Temperature Alarm |
| MORE | More shell side fluid flow | Failure of shell side valve | Temperature of process fluid decrease | Low Temperature Alarm |
| Corrosion | Corrosion of tube | Corrosive tube side fluid | Excess Heat transfer and crack of tube | Proper maintenance and operator alert |
| MORE OF | More pressure on tube side | Failure of service fluid valve | Bursting of tube | Install high pressure alarm |
| CONTAMINATION | Contamination of process fluid line | Leakage of tube and tube side fluid goes in | Contamination of process fluid | Proper maintenance and operator alert |
TABLE 6.4: HAZOP ANALYSIS FOR INITIAL H2S REMOVAL
| GUIDE WORD | DEVIATION | CAUSE | CONSEQUENCE | SAFETY ACTION |
| No | No supply of the gas into the absorber. | A stuck closed valve or faulty closed valve | Accumulation of the gas at the quencher or within the streamline | Valve CV2 closes |
| less | Less/ little supply of the crude gas into the absorber | Incomplete opening of the valve i.e. faulty valve
Blockage within the stream line |
Accumulation within the pipe
Excess heat loss from the gas |
CV2 closes to reduce the flow rate of entering NMP |
| more | More crude gas supply | A stuck open valve or faulty open valve | Insufficient H2S absorption
Insufficient gas cooling |
Open CV2 and CV3
Vent through relief valve |
| no | No supply of NMP into the absorber | A stuck closed valve or faulty closed valve | No H2S absorption occurs
The crude gas flows to the saturator where it corrodes the equipment due to the H2S present |
CV1 closes |
| less | Less supply of NMP into the absorber | Incomplete opening of the valve i.e. faulty valve
Blockage within the stream line |
Insufficient H2S absorption occurs | Close CV1 to reduce gas flow rate |
| more | More NMP supply into the absorber | A stuck open valve or faulty open valve | Flooding of the absorber with NMP | Open CV4 and CV1. |
| no | No discharge of the scrubbed gas out of the tower | A stuck closed valve or faulty closed valve | Accumulation of the gas within the absorber
Failure of equipment |
Close CV1 AND CV2 |
| less | little discharge of the scrubbed gas out of the tower | Incomplete opening of the valve i.e. faulty valve
Blockage within the stream line |
Accumulation within the pipe and outlet line
Faulty valve equipment |
Close valve CV1 and CV2 to reduce their flowrates |
| more | More scrubbed gas is discharged, i.e. if there is a pump sucking out the gaseous stream. | A stuck open valve or faulty open valve | Pressure drop within the tower | Open CV1, CV2 AND CV4 |
| no | No discharge of NMP out of the tower | A stuck closed valve or faulty closed valve | Accumulation of NMP within the quencher
Failure of equipment |
Close CV2 and CV1 |
| less | little discharge of NMP out of the tower | Incomplete opening of the valve i.e. faulty valve
Blockage within stream |
Accumulation within the pipe and outlet line
Faulty valve equipment |
Close CV1, CV2 and CV3 to reduce their flow rates |
INTENTION – CONTACTING SYNGAS WITH HOT WATER
TABLE 6.5A: HAZOP ANALYSIS FOR SATURATOR
| GUIDE WORD | DEVIATION | CAUSE | CONSEQUENCES & ACTION |
| Less of | Flow | Pump failure, blockage of pipe, valve failure | Syngas not contacted with water, high pressures, low level alarm, high pressure alarm |
| More of | Flow | Pump malfunction, valve stuck open | Flooding, channelling, high level alarm |
| As well as | Composition | Distributor malfunction, pump malfunction | Impure syngas. |
| No | Flow | Pump fail closed | Syngas not contacted with water, high pressures, low level alarm, high pressure alarm |
DESATURATOR INTENTION – DRYING THE PRODUCT GAS FROM CO SHIFT CONVERTER
TABLE 6.5B: HAZOP ANALYSIS FOR DESATURATOR
| GUIDE WORD | DEVIATION | CAUSE | CONSEQUENCES & ACTION |
| Less | Flow | Pump malfunction, pump fail closed | syngas not dried, high pressure alarm |
LINE 1 & 2 INTENTION – supplies syngas in and out of the saturator or desaturator
TABLE 6.5C: HAZOP ANALYSIS FOR LINES 1 AND 2
| GUIDE WORD | DEVIATION | CAUSE | CONSEQUENCES & ACTION |
| No | Flow | Valve failure, pump fail closed | Saturator mal-function |
| More | Flow | valve fail- open, pump malfunction | Less contact of syngas with water, high level alarm |
| Reverse | Flow | Pipe blockage | Pump malfunction, high pressure |
CO2 REMOVAL INLET INTENTION – to purge syngas stream of CO2
TABLE 6.6A: HAZOP ANALYSIS FOR CO2 REMOVAL INLET
| GUIDE WORD | DEVIATION | CAUSES | CONSEQUENCES |
| None | No Flow | Flow stopped upstream
Line blockage Line fracture |
No absorption in column. Entire process stops
As for 1. Pressure buildup in pipe and secondary cooler As for 1. Gases escape to the surrounding |
| More of | More Flow | Increased feed | Possible reduction in absorption efficiency.
May cause flooding |
| Flooding | Flooding | Unit subject to high pressure, bursting discs may rupture, tail gas release | |
| More Temperature | Higher feed gas or liquid temperature | Decreased absorption, higher pollution | |
| Less of | Less flow | Leaking inlet range | Gas escapes into surrounding |
| Less temperature | Overcooling | Increased dissolved gases in acid |
CO2 REMOVAL OUTLET INTENTION – to send syngas stream of CO2 to storage
TABLE 6.6B: HAZOP ANALYSIS FOR CO2 REMOVAL OUTLET
| KEYWORD | DEVIATION | POSSIBLE CAUSES | CONSEQUENCES |
| None | No Flow | No inlet gas flow
Flooding in column Line fracture |
No tail gas for expansion
Pressure build up in column No absorption in column |
| More of | More Flow | Increased feed
Decreased CO2 absorption |
Transfer line subject to higher pressures. Tail gas emission levels up |
| More Temperature | Higher feed gas or liquid temperature | Decrease absorption, higher pollution | |
| Less of | Less flow | Leaking inlet range | Gas escapes into surrounding |
| Other | Maintenance | Equipment failure, flange leak, catalyst changeover in reactor, etc. | Process stops |
STORAGE TANK INTENTION: The storage tanks 1 and 2 are designed to store heavy fuel oil enough for production of hydrogen for 5days and supply heavy fuel oil to the gasifier.
TABLE 6.7: HAZOP ANALYSIS FOR STORAGE TANKS
| EQUIPMENT | GUIDE WORD | DEVIATION | CAUSE | CONSEQUENCES | ACTION | |
| Line 1
Supplies HFO to the metering ram pump |
NO | No flow | Faulty pump | 1) Higher level in the tank
2) Explosion of tank |
Fit a high-high alarm | |
| Supplies only HFO to the pump | AS WELL AS | Composition | Corrosion of tank internals | 1) Impurities in the stream that can lead to blockage of the pump
2) Over pressure of tank |
Proper installation and maintenance | |
6.8.1 STORAGE TANK
SAFETY CONSIDERATIONS FOR THE STORAGE TANKS
- Flame arresters are installed based on the temperature, pressure, or composition of the gases entering the arrester, to stop open fire from spreading out. They are also periodically inspected to make sure they are free of dirt, or corrosion.
- Like any other high pressure vessel, a pressure relief valve with a pressure higher than both the design and operating pressure, is installed on the storage tank.
- The tank content fuel air mixture is stored well above the flammability limits such that it cannot burn even if an ignition source were present.
- Scaffolds are installed to aid workers during maintenance activities
- The storage tanks are shielded from weather conditions by suitable protective structures.
- The tanks for the storage of the final product are kept within a secondary container called a bund with enough space to take a volume at least 110% of the total volume capacity of the tanks (4,125,000m3)
6.8.2 THE HEAT EXCHANGERS
Overpressure is the only common safety issue affecting shell and tube heat exchangers. They are pressure vessels and as such are subject to the same codes and practices as other pressure vessels. That means the ASME Boiler and Pressure Vessel Code, Section VIII, Pressure Vessels, Parts UG-125 to 136 dealing with pressure relief devices. This specification gives very clear guidelines concerning all aspects of pressure relief requirements and application.
Pressure relief must be provided for both the shell and tube sides. If the source of overpressure is from upstream, the relief valve for that stream is best placed on the inlet. Otherwise it does not matter much whether it is on the inlet or outlet so long as they are inside any control or isolation valves. It is not sufficient to put minimum stops on the valves as these are easily altered. Even if the stops are welded in place, the valve may be replaced at some future date and the modification forgotten. If careful analysis shows that there are no process, fire, or failure conditions that could possibly require relief valves, it is still strongly advised to install thermal reliefs on both sides of any exchanger that is capable of being blocked in. It may be argued that the fluid is gas or that the process is not capable of adding heat to the blocked in exchanger. This argument overlooks the various unanticipated conditions that may arise during testing and maintenance. A worst case scenario: A cooler was taken out of service and steam cleaned. No one had drained the cooling water which expanded in the tubes and ruptured the joints. True, good maintenance practice would have prevented this incident. But then an NPS ¾ relief valve would have provided a permanent solution and would have cost a lot less than the damage caused by its absence.
6.8.3 THE CO CONVERTER
Safe operation of a fixed bed catalytic reactor is paramount especially as our reactor is exothermic. Elements such as controllability, stability, risk and economic aspects need to be considered. For the catalytic reactors, nominal conditions which are in the vicinity of safety limits are set so as to limit the hot-spot in the reactor and to excessive thermal stability to variation in the process parameters.
The following should be put in place for safe operation of the catalytic reactor.
- Use of baffles in the reactor to prevent hot-spot: baffle plates are placed at the reactor entrance to deflect the jet of the incoming gases.
- The height of the bed is limited to at least 1/2D to promote uniform flow distribution to avoid crushing the catalyst.
- The reactor would be designed for a thickness that will give 100% safety factor.
- Avoid steam condensation and minimize the re-oxidation of the catalyst upon shut down.
- Approximately 1.0m should be added to the length in order to account for inert material between tangents at top and bottom and for free space above bed for distributor and work area.
- For a stable operation, all heat generated by the exothermic reaction should be properly harnessed by the heat-exchanger so as to maintain the 10oC approach to equilibrium in other to prevent run-away reaction and also to prevent the formation of hydrocarbons (methane ) in large amount instead of the require hydrogen gas.
Thus, engineering safety covers the provision in the design of control systems, alarms, trips, pressure-relief devices, automatic shut-down system and firefighting equipment.
6.8.4 SATURATOR – DESATURATOR
SAFETY
For the saturator and desaturator syngas contains hydrogen gas which is flammable (flammability range 4.9 – 74.2). Hence the columns are prone to explosion and fire. This is so because hydrogen has a high burning rate, high buoyant velocity and high rate of vapour generation. Also inhalation of hydrogen can cause sleepiness and high-pitched voice in humans.
The vessels are operating at high pressures hence, the vessels are fitted with pressure relief valves for proper pressure control.
Preventive measures taken include:
- Adequate and secure water for fire fighting.
- Correct design of vessel.
- Use of pressure relief valves for pressure control.
- Use of corrosion resistant materials such as packing
- Compliance with standard codes such as the ASME code for the testing and design of the vessels
- Use of fails-safe instruments.
6.8.5 THE FINAL H2S ABSORBER
Corrosion consideration
So2 produced during regeneration combines with water to produce an acidic mixture that can badly corrode the SO2 header . Hence, corrosion monitoring is required after regeneration and chemical injection corrosion inhibitors are required during regeneraton.
Operability study
- The vessel: H2S dry sorption vessel
- Its lines;
- Inlet of flue gas plus O2 line
- Outlet of treated flue gas
- Inlet of reheneration oxygen
- Outlet of SO2
The Hazards
Toxicity:- H2S is toxic; effects are acute and chronic
Lower toxic limit: 10 ppm
Inlet gas H2S concentration: 15ppm
Lethal dose: 0.05% in air kills within 30 minutes to hour exposure
1.2 – 2.8 mg H2S per liter of air kills instantly. Long term exposure to very small amounts of H2S leads to chronic poisoning.
Symptoms: irritation of the mucous membrane, sensitivity to light, bronchitis, headaches, weariness, circulatory disturbances and loss of weight.
Causes of exposure in the unit
- Loosely bound flanges
- Pipe leakages
- Depressurizing vessels (vents)
- Depressurizing instruments such as pressure gauges
Safety precautions
Use appropriate personal protective equipment (PPE) such as nose masks during maintenance of measuring instruments, depressurization of vessels e.t.c
Ensure flanges are tightly bound with appropriately fitted gaskets. Welded joints preferred.
First Aid
Fresh air, artificial respiration, warmth, rest, transportation in an inclined position. Danger of suffocation if patient is unconscious.
Flammability
Pressurized hydrogen and CH4 are the flammable substance in the unit. The flammability units are shown in the table below.
TABLE 6.8: FLAMMABILITY LIMITS OF DIFFERENT COMPOUNDS
| MATERIAL | LOWER LIMIT | UPPER LIMIT |
| H2 | 4.1 | 74.2 |
| H2S | 4.3 | 45.0 |
| CO | 12.5 | 74.2 |
| CH4 | 5.3 | 14.0 |
Safety precaution
The plant will conform to the recommendations of the British Standard, BS 5908 to prevent fire outbreaks
Explosion
The system is prone to unconfined cloud explosion. Here, a considerable quantity of the flue gas in the atmosphere would explode when ignited.
Safety precautions
- No smoking around the facility
- No naked flames
- Use of intrinsically safe cameras and devices
- No mobile phones allowed in the facility
- Flame traps in vent and flare lines
Pressure
This unit operates at about 2400kpa. Hence, any blockage in the process lines can result in over pressure, i.e exceeding the design pressure of 2458.5kPa.
Safety precaution
Indirectly actuated valves(electrical and pneumatic) which fail-open should be used as the pressure relief valves. Auxiliary bursting discs may also be installed for a faster rate of depressurization during major overpressure
Temperature deviation
Design temperature is set at 300oc. The situation of excessively high temperature is highly unlikely. However it is possible.
Causes
If the outlet for SO2 during regeneration is blocked, it could result to
- Overpressure due to temperature builup
- Overtemperature due to inhibited heat flow
Control
- Pressure relief valves
- Input heated O2 flow controller
- Avoid restriction in the outlet SO2 line
Noise
No rotating and moving parts exist in the system. Hence, noise levels are minimal.
Environmental consideration
16 month SO2 emission:- scrubber should be installed, which uses Ca(OH)2 to absorbed the SO2 produced to form calcium sulphate, which can be sold to plaster of paris(POP) producing industries.
Flue gas vents should be routed to a central flaring system. A self-supported elevated flare system is recommended.
CHAPTER SEVEN
7 COSTING
Bare cost of a vertical vessel of diameter 1.99m and a height of 9.64m is 24,000 dollar as at mid 2004 (Coulson and Richardson, 2005)
Purchase cost = Bare cost  Material factor Pressure factor
Material factor = 2
Pressure factor = 2.28
Purchase cost = (24,000  2.28
2.28  2) dollar = 109,440 dollar
1dollar = N 151
109,440 dollar = N 16,525,440
Purchase cost of the vessel in 2004 = N16,525,440
The projected cost of the vessel in 2011 based on inflation rate is obtained as below:
TABLE 7.1: INFLATION RATES BY YEAR (1999-2011), US INFLATION CALCULATOR
| YEAR | INFLATION RATE | PROJECTED COST (NAIRA) |
| 2005 | 2.5% | 16,938,596.00 |
| 2006 | 4.3% | 17,666,934.77 |
| 2007 | 2.7% | 18,143,942.01 |
| 2008 | 5% | 19,051,139.11 |
| 2009 | -1.4% | 17,069,820.64 |
| 2010 | 1.1% | 17,257,588.67 |
| 2011 | 4% | 17,947,892.21 |
Therefore, the present purchase cost of the gasifier vessel = N17,.947,892.21
The estimation of the purchase cost of the lining material is carried out as follows:
Volume of the refractory brick = (29.88 – ) m3
) m3
= (29.88 – 29.30) m3 = 0.576 m3
The table below shows calculation of the density of the refractory brick
TABLE 7.2: REFRACTORY BRICK DENSITY CALCULATION
| COMPOUND | COMPOSITION (%) | DENSITY (Kg/m3) | % DENSITY |
| Cr2O3 | 90 | 4885 | 4396.5 |
| Al2O3 | 3 | 248.67 | 7.4601 |
| ZrO2 | 7 | 4825.14 | 337.7598 |
| Total | 100 | 4741.7199 |
Therefore,
The mass of the refractory brick ( ) = 4741.7199 Kg/m3 x 0.576 m3 = 2730.18 Kg
From literature, the cost of the lining material = 4825 dollar/metric tonne
1016 Kg = 1 tonne
2730.18 Kg = 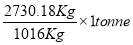 = 2.687 tonnes
Therefore, the cost of the refractory brick = 4825 x 2.687 dollar = 12,965.69 dollar
1 dollar = 151 Naira
12,965.69dollar = 12,965.69 x 151 Naira = N1, 957,819.27
Therefore,
The total purchase cost of the gasifier = purchase cost of the vessel + purchase cost of the refractory block = N17,.947,892.21 + N1, 957,819.27 = N19,905,711.48
Bare cost of a vertical vessel of diameter 0.5275 m and a height of 3.0893 m is 9,715.32 dollar as at mid 2004 (Coulson and Richardson, 2005)
Purchase cost = Bare cost × Material factor × Pressure factor
Material factor = 1
Pressure factor = 1.8
Purchase cost = (9,715.32 × 1.8 × 1) dollar = 17,487.58 dollar
1dollar = N 151
17,487.58 dollar = N 2,640,623.98
Purchase cost of the vessel in mid 2004 = N 2,640,623.98
The projected cost of the vessel in 2011 based on inflation rate is obtained as below:
TABLE 7.3: INFLATION RATES BY MONTH AND YEAR (2005-2011) (FOR BARE VESSEL)
| YEAR | INFLATION RATE (JUNE) | PROJECTED COST (NAIRA) |
| 2005 | 2.5% | 2,706,639.58 |
| 2006 | 4.3% | 2,823,025.08 |
| 2007 | 2.7% | 2,899,246.76 |
| 2008 | 5% | 3,034,209.10 |
| 2009 | -1.4% | 2,991,730.173 |
| 2010 | 1.1% | 3,024,639.21 |
| 2011 | 4% | 3,145,624.78 |
Therefore, the present purchase cost of the gasifier vessel = N3,145,624.78
The estimation of the cost of packing material for the quencher is done as below
The cost of an intalox saddle packing as at mid 2004 = 829 dollar/m3 (Coulson and Richardson, 2005)
Height of packing = 1.2023 m/1.5 = 0.8015 m
Diameter of the vessel = 0.5275 m
Therefore, the volume of the packing = (π × 0.52752/4) × 0.8015= 0.17516 m3
Thus,
The cost of the interlox saddle = 829 dollar/m3 x 0.17516 m3 = 145.21 dollar
145.21 dollar = N 21,926.53
The projected cost in the present year is estimated thus:
TABLE 7.4: INFLATION RATES BY MONTH AND YEAR (2005-2011) (FOR PACKING MATERIAL)
| YEAR | INFLATION RATE (JUNE) | PROJECTED COST (NAIRA) |
| 2005 | 2.5% | 22,474.69 |
| 2006 | 4.3% | 23,441.10 |
| 2007 | 2.7% | 24,074.00 |
| 2008 | 5% | 25,277.70 |
| 2009 | -1.4% | 24,923.81 |
| 2010 | 1.1% | 25,197.97 |
| 2011 | 4% | 26,205.89 |
Therefore the cost of the packing material = N 26,205.89
The total cost of the vessel along with the packing material = N 3,145,624.78 + N 26,205.89 = N 3,171,830.67
Cost of Catalyst
Volume of catalyst: 187.17 m3 or  cu ft
cu ft
Cost of catalyst = $20 per cu ft
Cost of procuring catalyst: 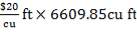
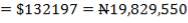
Cost of Equipment Materials
Reactor material of construction: Low alloy steel
Volume of reactor material: 227.56 m3
Density of low alloy steel: 8.44 g/cm3
Mass of reactor:  g or 1920 tonnes
Low alloy steels (Cr-Mo) cost about 400 – 700 pounds per ton
Cost of securing reactor materials: 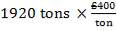
Cost of equipment
Cost of low alloy steel = USD700 & 1 tone
Density = 7850kg/m3
External diameter = Internal diameter + 2(thickness)
External volume of column = 
=92.56362m3
The 12mm was obtained by adding 2mm to the 10mm because of corrosion allowance
Internal volume of column = 
=90.81166m3
Volume of steel = External – Internal
= 92.56362 – 90.81166
= 1.7520m3
Tray thickness = 12 
Volume of steel tray = 
= 0.05890m3
Number of Steel column = 4
Total number of trays = 5
Total volume of Steel = 4(1.7520) + 20(0.05890)
= 8.18610m3
Total Mass = 
= 7850kg/m3 
= 64261kg
=64.260 tonnes
Total cost of vessels + tray =700 
= USD44,982 as at 2004
TABLE 7.5: INFLATION RATES BY YEAR (2005-2011) ( FOR H2S REMOVAL VESSEL)
| YEAR | INFLATION RATE | AMOUNT IN USD |
| 2005 | 2.5% | 46106.55 |
| 2006 | 4.3% | 48089.13 |
| 2007 | 2.7% | 49387.54 |
| 2008 | 5% | 51856.92 |
| 2009 | -1.4% | 51130.92 |
| 2010 | 1.1% | 51693.36 |
| 2011 | 4% | 53761.09 |
The cost as at 2011 = USD53761.09
But cost of lautamasse = USD600/tone
Mass of lautamasse = 6935kg
= 6935kg 
=6.935tonne
Cost of Lautamasse = USD(6.935
Cost of Lautamasse = USD4161
Total cost of Steel and Lautamasse = USD(53761.09 + 4161)
= USD57922.09 = NGN8.7 million
Absorber parameters:


Where

Substituting 2028.91lb for W in the above equation,


For plastic pall rings of 3.54in diameter, 

Total cost is given as:

 0
0
The cost data given in Figure 8 can be used to make preliminary estimates. The base date is mid-1998, and the prices are thought to be accurate to within ±25%.
Purchased cost = (bare cost from figure) Type factor
  Pressure factor
 (As at mid 1998)
Inflation-corrected value of Purchase cost from 1998 to 2011 gives $103971.17, which approximates to $104000.
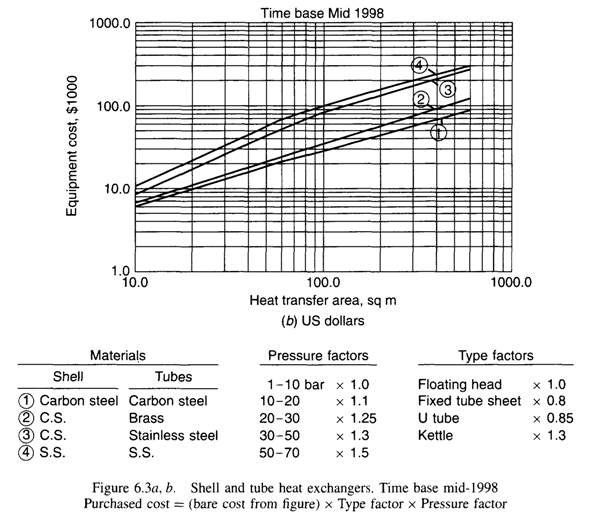
FIGURE 7.1: COST ESTIMATION DATA FOR SHELL AND TUBE HEAT EXCHANGERS
The cost data given in Figure 8 will be used again for the cost calculation. The base date is mid-1998, and the prices are thought to be accurate to within ±25%.
Purchased cost = (bare cost from figure) Type factor Pressure factor
 (As at mid 1998)
Inflation-corrected cost from 1998 to 2011 estimates to $582000.
CHAPTER 8
CONCLUSION AND RECOMMENDATION
8.1 CONCLUSION
The aim of this design project which is to design a plant producing 750,000 m3 of hydrogen of 95% purity by partial oxidation of oil feedstock has been achieved. The methodologies of HYSYS simulation plant were useful for carrying out the material and energy balance calculations required for the plant. From our material balance calculations, it is concluded that a 95% purity of hydrogen is obtained. Furthermore, it can be concluded from our energy balance calculations that the gasifier produces the largest amount of energy and the waste heat boiler consumes the largest amount of energy. The economic analysis shows the total cost and start-up capital required for the plant which tells us that it is profitable to set up the plant
8.2 RECOMMENDATION
It is hereby recommended that project design is carried out at lower levels, so as to give the students a well grounded approach to chemical engineering plant design.
Software development should be incorporated into the undergraduate prospectus because of the ease of computation that can be possible as a result of proficiency in the use of these applications.
Courses involving process design from other engineering departments should be taken by the students as plant design involves just more than chemical engineering.
Finally, supervisors should strive to take a more active interest in the design work of their respective students.
REFERENCES
Andrea Sella (2008),“Raschig’s Rings”. Chemistry World. page 83. Retrieved from wikipedia, the free encyclopedia date accessed: 05/07/2011.
Anon. (2011), Heat exchangers, Retrieved March 15, 2011 from www.wikipedia.com
Anon. (2011), Types of Heat Exchangers, Retrieved March 15, 2011 from www.wikianswers.com
Don W.G. and Robert H.P. (2008). Perry’s Chemical Engineering handbook, 8th edition.
ISBN 0-07-142294-3.
Frank, O. (1978), Simplified design procedure for tubular exchangers, in Practical Heat Transfer, Chem. Eng. Prog. Tech. Manual (American Institute of Chem. Eng.)
John Wiley & Sons. ISBN 0-471-46480-5. Retrieved from wikipedia, the free encyclopedia date accessed: 05/07/2011.
Jones et al, July 1981, Gas quench cooling and solids separation process
Oak Ridge Associated Universities Raschig Rings for Criticality Control (1980s). Retrieved from www.orau.org/collection/micellaneous/raschigs.com. Date accessed: 05/07/2011.
Pitts D. R and Sissom L. E (1998), Schaum’s Outline of Theory and Problems of Heat Transfer, Second Edition
Shilling R. L.,Kenneth J. B.,Patrick M. B.,Thomas M. F., Victor M. G.,Predrag S. H., Standiford F. C.,Klaus D. T. (1997), Perry’s Chemical Engineers’ Handbook, Seventh Edition,Chapter 11, Heat Transfer Equipment
Sinnott, R. K. (2005), Chemical Engineering, Volume 6, Fourth edition, Chemical Engineering Design
Seader, J.D. and Henley, Ernest J. (2006). Separation Process Principles (2nd Edition ed.). Sinnot, R.K. (2005a), Coulson and Richardson’s Chemical engineering series volume 6, 4th Edition, page 815.
Sinnot, R.K. (2005b), Coulson and Richardson’s Chemical engineering series volume 6, 4th Edition, page 591.
Sinnot, R.K. (2005c), Coulson and Richardson’s Chemical engineering series volume 6, 4th Edition, page 460.
Sinnot, R.K. (2005d), Coulson and Richardson’s Chemical engineering series volume 6, 4th Edition, pages 609-616.
Staudinger et al, (1977), Process for quenching product gas of slagging coal gasifier www.freepatentsonline.com/5571295
Von Klock et al, (1986), Synthesis gas generation with prevention of deposit formation in exit lines
BLANK PAGE
APPENDIX ONE: SIMULATION
APPENDIX TWO: PLANT AND SITE LAYOUT
APPENDIX THREE: PROCESS INFORMATION
APPENDIX FOUR: CALCULATIONS
TANK STORAGE CAPACITY
The mass of feed required to produce 750,000m3 of Hydrogen per day is given by:
The tank is to store enough feed for the production of Hydrogen for 5days. Thus, the mass of feed to be stored is:

Thus, the required capacity of the tank is obtained from the equation below
Given the specific gravity of the feed at 50oC = 0.9435,

Therefore, the required capacity of tank 1= Volume of feed
TANK DIMENSIONS
Assume that: 


For safety reasons, an overfill level protection level and a minimum operating level is put into consideration.
H = 70% of the total height
TANK 2
This tank is similar to tank in function, configuration, material of construction and safety devices and structural supports used. The only difference is that it is a smaller tank used to aid the Start-up and shut down procedures. This tank is required to store enough heavy fuel oil for a 3 hour production run.
STORAGE CAPACITY
From the material balance,


Therefore the required volume capacity of the tank is given by:
TANK DIMENSIONS
Also, assuming that: 

Similar to tank 1, there is an overfill level and minimum fill level for safety purposes
H = 70% of the total height (H1)
TANK 3
This tank is used for the storage of the final product gas, hydrogen before it is supplied to the immediate consumers. It is similar in configuration to tanks 1 and 2, but the material of construction is different.
STORAGE CAPACITY
According to the design problem statement, the volume of Hydrogen gas to be produced per day = 750,000m3.
Assuming that the tanks are offloaded every 5 days such that the required capacity of the tank is 
Due to the large capacity requirements of the tank, the total volume of the product is stored in 50 equal size tanks.
Thus, the capacity of each tank is
TANK DIMENSIONS
For each of the 50 tanks, assume that H = 3D


Similar to tanks 1 and 2, there are safety allowances in the height of the tank.
So that D = 44m
Installed storage capacity is now
7.7.1 THE HEAVY FUEL OIL GASIFIER
CHEMICAL ENGINEERING DESIGN
The following reactions take place in the gasifier:
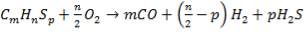 (1)
(1)
 (2)
(2)
 (3)
(3)
 (4)
(4)
 (5)
(5)
The slowest reaction is reaction 4 (Carbon-steam reaction) and is therefore taken as the rate determining step for the reactor.
C + H2O → H2 + CO (rate-determining step)
The rate expression for this reaction is given as:
r = kv
Where:
r = rate of reaction (in this case, the rate of disappearance of H2O)
kv = rate constant
K = equilibrium constant
CH2O, CH2 and CCO = molar concentrations of CH2O, CH2 and CCO respectively (kmol/m3)
Given the table below for rate constant, kv (from reference source)
| T (K) | 952.38 | 1000 |
| kv (cm3/gmol.s) | 1.62 | 8.6 |
RATE CONSTANT VALUES AT SPECIFIC TEMPERATURES
Temperature of the exit crude gas is taken as the reaction temperature in the gasifier
Therefore, reaction temperature = 1300oC = (1300 + 273) K = 1573K
Extrapolating kv values in the table above in order to get the value of kv at 1573K, yields:
620.62 (6.98) = 47.62 (kv – 1.62)
kv = 92.59 cm3/gmol.s
kv = 92.59  = 0.0926 m3/kmol.s
The table below is used to extrapolate for the value of the equilibrium constant, K at 1573K
| T (K) | 1300 | 1400 |
| Log K | 2.06 | 2.44 |
EQUILIBRIUM CONSTANT VALUES AT SPECIFIED TEMPERATURES
100 log K – 206 = 103.74
log K = 3.0974
K = 1251.411092
COMPOSITION OF CRUDE GAS LEAVING THE GASIFIER (FROM MATERIAL BALANCE CALCULATION: ON WET BASIS)
| COMPONENTS | AMOUNT (kmol/hr) | COMPOSITION |
| H2 | 671.636 | 0.4232 |
| CO | 594.031 | 0.3743 |
| CO2 | 117.113 | 0.0738 |
| CH4 | 1.411 | 0.0008 |
| H2O | 171.01 | 0.1077 |
| H2S | 7.055 | 0.0044 |
| N2 | 19.754 | 0.0124 |
| C | 5.16 | 0.0033 |
| Total | 1587.17 | 1.0000 |
The operating pressure in the gasifier is assumed to be 62 bar (6200KN/m2)
From equation of state,
C (Kmol) = , where P = pressure (= KN/m2), R = gas constant = 8.314 KJ/Kmol.K and T = temperature (= K)
Therefore,
CH2O =  =
=  = 0.0511 Kmol/m3
CH2 = 
 = 0.2006 Kmol/m3
CCO =  =
=  = 0.1774 Kmol/m3
And then,
r = 0.0926 = -0.0297
For a CSTR, the performance equation is given as:
V = 
From material balance calculation,
Mass of steam entering the gasifier on a basis of 100kg/day feed of heavy fuel oil = 75kg
Therefore, actual mole of steam entering the gasifier
=  = 171.897 kmol/hr
Amount of steam leaving the gasifier = 171.01 kmol/hr
FAO = FH2Oo = 171.897 kmol/hr
XA = XH2O =  =
=  = 0.0052
Therefore,
V =  = 29.88 m3
From literature, a standard 4.5 m-high gasifier can gasify up to 1.9 tonnes/hr of feed. This standard is then used to estimate the height of the heavy fuel oil gasifier.
1 tonne = 1016 kg
1.9 tonnes = (1016 x 1.9) kg = 1930.4 kg
Mass of heavy fuel oil feed = 4135.535 kg/day
1930.4 ——————————- 4.5m
4135.535 —————————  = 9.64m
and,
V = π
Therefore,
D =  =
=  = 1.99 m
So, in summary:
Height of the gasifier = 9.64 m
Diameter of the gasifier = 1.99 m
Total molar flow rate of the exit crude gas = 1587.17 kmol/hr
Volumetric flow rate of the exit crude gas = =3347.88 m3/hr
Residence time, τ = Volume/Volumetric flow rate = = 0.0089 hr = 32.13s
Space velocity, υ = 1/ τ = 1/32.13s = 0.031 s-1
MECHANICAL ENGINEERING DESIGN
DESIGN PRESSURE

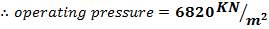
DESIGN TEMPERATURE


MINIMUM WALL THICKNESS
The minimum thickness required to resist the internal temperature of the gasifier is calculated thus,
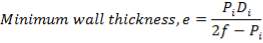
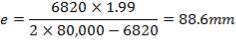
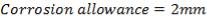

MINIMUM HEAD THICKNESS
An Ellipsoidal head is chosen as the closure for this vessel because it is relatively cheaper than the torispherical head and it can withstand the design pressure of the vessel (Coulson and Richardson, 1999). The minimum thickness required is obtained thus,
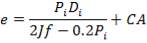
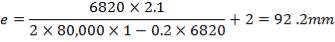
Thickness of the head = 92.2 mm
THE WASTE HEAT BOILER

The calculations leading to the determination of  in the above equation are shown below:
Cp-values are dependent on temperature, so we have to determine the Cp of all the individual components that make up the inlet stream (i.e. at 1300°C)
The heat capacity equations are:
C: Cp = 11.18 + 1.095 × 10⁻² – 4.891 × 10⁵ -2
H2: Cp = 
CO: Cp = 
CO2: Cp = 
N2: Cp = 
CH4: Cp = 
H2S: Cp = 
Using these Cp values, we can calculate a bulk Cp for the stream as shown:
BULK CP VALUES FOR STREAM COMPONENTS
|
COMPONENT |
Cp (J/KMOLOC)
|
MOLE FRACTION |
MOLAR FLOW |
IN-STREAM Cp (J/KMOLOC) |
| C | 28.207 | 0.00362 | 5.157 | 0.2089 |
| H2 | 32.585 | 0.47191 | 671.636 | 13.2328 |
| CO2 | 58.747 | 0.08229 | 117.113 | 4.1593 |
| CO | 35.412 | 0.41739 | 594.031 | 12.7199 |
| N2 | 35.222 | 0.01388 | 19.754 | 0.4191 |
| CH4 | 135.761 | 0.00099 | 1.411 | 0.1222 |
| H2S | 51.4787 | 0.00496 | 6.702 | 0.0360 |
From the addition of all the values in the in-stream Cp column, we obtain:
Cp = 35.92522 J/mol. °C
Substitute the value of Cp above into Equation (2.1):
From the material balance calculations, we can see that

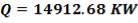
The next thing to do is try and obtain an overall heat transfer coefficient for the heat exchange process.
As mentioned previously, for a water tube waste heat boiler, the demineralised water supplied as utility goes in on the tube side while the hot process gases go in on the shell side. The configuration of the boiler and the fluids flowing in it determine the form that the overall heat transfer coefficient will take. For the water tube configuration:
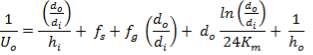
Where:
fs= steam fouling
fg = gas fouling
do= external diameter
di = internal diameter
km = thermal conductivity of tube (carbon steel)
hi = inside heat transfer coefficient
ho = outside heat transfer coefficient
From literature, heat exchanger tube diameters are specified between 16mm and 50mm. Waste heat boilers use tube internal diameters that are much closer to the upper limit than conventional heat exchangers. For this design:
Tube outer diameter, 
Tube inner diameter,
hi= 
where
 =
= 
= 
= 90.855
hi= 
= 1309379.395 W/m2k
For gas streams, fouling factors range from 0.0002 to 0.0005. A factor of 0.0005 is selected as the design gas fouling factor so as to prepare for the highest possible degree of fouling.
For steam streams, fouling factors range from 0.0002 to 0.00067. A factor of 0.00067 is selected as the design gas fouling factor so as to prepare for the highest possible degree of fouling.
Steam outside heat transfer coefficient is:
ho = 2000Btu/ ho ft2oF
= 11333.33W/ m2oC
= 4.088e 4 KJ/hr. m2oC
The thermal conductivity of carbon steel at the highest temperature quoted in literature is 47 W/m2 ºC
Substituting the aforementioned values into Equation 2.3, we obtain:

To obtain the heat transfer area, we need to first obtain the mean temperature difference between the inlet and the exit gas streams. Since there is a change of phase in the waste heat boiler, the standard log mean temperature difference cannot be applied, so a weighted mean temperature difference will be applied:
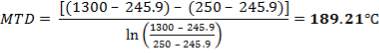
Recall that,


To obtain the flow rate of water required for the heat transfer, we need to first obtain the latent heat of vaporization of water at the design pressure specified.
From steam tables, we can obtain the enthalpy of saturated steam at the design pressure of 4140KN/m2 using interpolation between values from the said steam table.
Enthalpy of saturated steam, at 254oC:
ENTHALPY OF SATURATED STEAM
| 2801.5 | 250 |
 |
254.9 |
| 2785 | 275 |
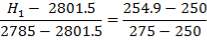
Enthalpy of saturated liquid (water) at 254.9 oC:
ENTHALPY OF SATURATED LIQUID
| 1085.36 | 250 |
 |
254.9 |
| 1210.07 | 275 |
 Latent Heat of vapourization,
= 
= 1710.686 KJ/Kg
To obtain the water flow rate:
Heat loss by gas,
Q = m
Using the value of obtained above, we can substitute into Equation 2.5 and obtain the mass flow rate of water,  shown below:
 = 31382.732 Kg/hr
By rule of thumb, design tubeside flow rates,  for waste heat boilers usually range between 45kg/hr and 90kg/hr. Assuming
  for this design:

Where
Nt = number of tubes
W = gas flow rate
w = tubeside flow rate
For the design, we select the number of tubes as 490 tubes
To obtain the tube length required,
Tube Side Area = 
Using Equation 2.7, we can obtain the tube length required for the heat transfer.
To obtain the Tube bundle arrangement:
A triangular tube arrangement gives higher heat transfer rates.
Tube Pitch,
Pi = 125 do
= 1.25 (0.0508)
= 0.0635m
Tube bundle diameter is given by,
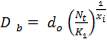
Where Nt is the number of tubes
ki and xi, are constants dependent on tube arrangement
Db = bundle diameter,
do = outer diameter of tube
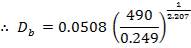
= 1.58m
To obtain the clearance and hence the shell diameter, we refer to graph of clearance correlations to obtain correlated values of clearance and area. From the graph, we can see that our bundle diameter is out of the range for which a clearance value can be obtained, so we interpolate for its corresponding clearance value as shown overleaf:
CORRESPONDING AREA-CLEARANCE VALUES
| AREA | CLEARANCE |
| 1.2 | 77 |
| 0.85 | 70 |
| 1.58 | x |


To obtain the linear velocity of flow through the tubes:

For a two- pass flow regime in the boiler, the flow area will be about 480.36m2
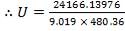 = 5.58m/hr
To obtain the pressure drop (shell side):
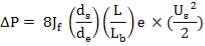
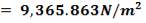 (0.0936bar)
To obtain the pressure drop (tube side):
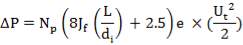
 (0.177bar)
QUENCHER
INLET STREAM INTO QUENCHER
| COMPONENT | MOLE (Kmol) | MOLE FRACTION |
| C | 5.16 | 0.00364 |
| H₂ | 671.636 | 0.4743 |
| CO | 594.031 | 0.4195 |
| CO2 | 117.113 | 0.0827 |
| N₂ | 19.754 | 0.01395 |
| CH₄ | 1.411 | 0.000996 |
| H₂S | 7.055 | 0.00498 |
| 1416.16 |
HEAT CAPACITY
The heat capacity data can be obtained from heat capacity tables in available from literature
Taking a reference temperature of 15oC.
The heat capacity equations are:
C: Cp = 11.18 + 1.095 × 10⁻²T – 4.891 × 10⁵T-2
H2: Cp =
CO: Cp =
CO2: Cp =
N2: Cp =
CH4: Cp =
H2S: Cp =
Multiplying these equations by the respective mole fraction of each component yield we have:
C: Cp × mass in terms of moles
= Cp × 0.00364
= 0.0407 + 3.986 × 10⁻⁵T– 1780.324 T-2
H2: Cp × 0.4743
= 13.679 + 3.628 × 10⁻⁵ T + 1.559 × 10⁻⁶ T2 – 4.125 × 10⁻¹⁰ T3
CO: Cp × 0.4195
= 12.145 + 1.724 × 10⁻³ T + 1.488 × 10⁻⁶ T2 – 9.23 × 10⁻¹⁰ T3
CO2: Cp × 0.0827
= 2.986 + 3.5 × 10⁻³ T – 2.388 × 10⁻⁶ T2 + 6.173 × 10⁻¹⁰ T3
N2: Cp × 0.01395
= 0.405 + 3.068 × 10⁻⁵ T + 7.984 × 10⁻⁸ T2 – 4.01 × 10⁻¹¹ T3
CH4: Cp
=
H2S: Cp
=
Summing the heat capacity values for each component, we have
Cpnet = 29.457 + 5.462 × 10⁻³T + 7.575 × 10⁻⁷ T2 – 7.856 × 10⁻¹⁰T3 – 1780.324 T-2
Heat lost by the crude gas, ΔH is given by
 net dT
ΔH =  + 5.462 × 10⁻³T + 7.575 × 10⁻⁷ T2 – 7.856 × 10⁻¹⁰T3 – 1780.324 T-2) dT
= 29.457 (250 – 15) + 0.002731 (2502 – 152) + 2.525 × 10⁻⁷ (2503 – 153) –1.964 ×10⁻¹⁰ (2504 – 154) + 1780.324 (250-1 – 15-1)
= 6,984.618 KJ/Kmol
COMPOSITION OF OUTLET STREAM FROM THE QUENCHER
| COMPONENT | MOLE (Kmol) | MOLE FRACTION |
| H₂ | 671.636 | 0.476 |
| CO | 594.031 | 0.421 |
| CO₂ | 117.113 | 0.083 |
| N₂ | 19.754 | 0.014 |
| CH₄ | 1.411 | 0.001 |
| H₂S | 7.055 | 0.005 |
| 1411 |
The heat capacity equations are:
H2: Cp × 0.476
= 13.728 + 3.64 × 10⁻⁵ T + 1.57 × 10⁻⁶ T2 – 4.14 × 10⁻¹⁰ T3
CO: Cp × 0.421
= 12.19 + 1.73 × 10⁻³ T + 1.494 × 10⁻⁶ T2 – 9.26 × 10⁻¹⁰ T3
CO2: Cp × 0.083
= 2.997 + 3.513 × 10⁻³ T – 2.396 × 10⁻⁶ T2 + 6.195 × 10⁻¹⁰ T3
N2: Cp × 0.014
= 0.406 + 3.08 × 10⁻⁵ T + 8.012 × 10⁻⁸ T2 – 4.019 × 10⁻¹¹ T3
CH4: Cp 0.001
0.001
=
H2S: Cp 0.005
=
Summing the heat capacity values for each component, we have
Cpnet = 29.523 + 5.442 × 10⁻³T + 7.668 × 10⁻⁷ T2 – 7.881 × 10⁻¹⁰T3
Heat lost by the crude gas, ΔH is given by
 net dT
ΔH =  + 5.442 × 10⁻³T + 7.668 × 10⁻⁷ T2 – 7.881 × 10⁻¹⁰T3) dT
= 29.523 (50 – 15) + 0.002721 (502 – 152) + 2.556 × 10⁻⁷ (503 – 153) – 1.97 × 10⁻¹⁰ (504 – 154)
= 1039.525 KJ/Kmol
ΔHnet = (6984.618 × 1416.16) – (1039.525 × 1411) KJ/hr
= 2,340.157 KJ/s
Heat gained by the water = m
Cp for liquid water = 18.2964 + 47.212 x 10⁻² T – 133.88 x 10⁻⁵ T2 + 1314.2 x 10-9 T3
Therefore,
Heat gained by water = 
= 18.2964 (363 – 298) + 0.23606 (3632 – 2982) – 4.463 × 10⁻⁴ (3633 – 2983) + 3.286 ×10⁻⁷ (3634 – 2984)
= 1189.266 + 101423.318 – 9536.786 + 3114.116
= 96,189.91 KJ/Kmol
Thus, Heat gained by water = (m/M x 96189.91KJ/Kmol)
Molecular weight of water = 18 Kg/Kmol
Heat gained by water = 96189.91/18 m = 5343.88 m
Since, heat lost by the crude gas = heat gained by water
Therefore,
5343.88m = 2340.157
m = 0.438 Kg/s
Allowing a minimum of 10 minutes hold-up of water,
Therefore, m = 0.438 Kg/s x 10mins x 60s = 262.748 Kg
COLUMN DIAMETER
The equation for the Column Diameter, from Handbook of Chemical Engineering Calculation is given as,
D = (4S/π)1/2
Where,
S is the actual cross sectional area, which in terms of volumetric gas flow rate is
S = q/V
Where q = volumetric gas flow rate of inlet stream into the quencher
V = assumed superficial velocity (between 1 and 2 m/s)
To obtain the volumetric gas flow rate we have,
PV = nRT
Therefore, n = 1416.16 Kmol/hr
= Kmol/s
q = (16.23 × 8.314 × 523) / (4140 + 101.325)
= 0.3934 m3/s
V = assumed to be 1.8 m/s
S = q/V
= 0.3934/1.8 = 0.2185 m2
Therefore,
D = (4S/π)1/2
= (4 × 0.2185/3.1429) ½
= 0.5275 m
HEIGHT OF THE COLUMN: Z
This is obtained, from Coulson and Richardson, using the following formula:
Z= HOGNOGS.F
Where,
HOG assuming 3.0in of ceramic packing material, HOG= 4.5ft
4.5 ft
=1.3716m
Assuming a Safety Factor of 1.5,
S.F= 1.5
NOG is given by,
NOG=ln (y1/y2)
Assuming 60% reduction in concentration of H2S
Where,
y1= concentration of H2S in entering gas stream= 0.00498Kmol
y2=concentration H2S in exit gas stream=0.00199kmol
NOG = ln (0.00498/0.00199)
= 0.9173
Using a 3 inch (76.2 mm) ceramic diameter packing, the corresponding height of transfer unit, HOG = 4.5 ft
The height, Z = (HOG) x (NOG) x (SF)
Using a safety factor, SF of 1.5 for the quencher
Therefore,
Z = (4.5 x 0.3048) x (0.9173) x (1.5) = 1.887 m
Converting mass of water Kg to m3
V = (mass of water in Kg) ⁄density of water
V = 262.748/1000
= 0.2627 m3/s
Height in packing H = V/S
= 0.2627/ 0.2185= 1.2023 m
Height of entire column = 1.887 + 1.2023 m
= 3.0893 m
MECHANICAL ENGINEERING DESIGN
DESIGN PRESSURE
Assuming 8% above operating pressure
= 1.08 x 4241.325 KN/m2
= 4580 .631 KN/m2
(4580.631-101.325) gauge
= 4479.306 kN/m2 gauge
DESIGN TEMPERATURE
This is obtained as,
= Highest Temperature + allowance for uncertainty
Assuming an uncertainty of 80oC
Therefore, design temperature= (250+ 80) oC
=330oC
TENSILE STRENGTH
At 25oC, the tensile strength of Carbon =210N/mm2
At 500oC, the tensile strength of Carbon is 450 N/mm2
At 330oC, the tensile strength of Carbon will be,
TENSILE STRENGTH VALUES AT DIFFERENT TEMPERATURES
| TEMPERATURE, OC | TENSILE STRENGTH, N/MM2 |
| 25 | 210 |
| 330 | X |
| 500 | 450 |
Interpolating we have,
(330 – 25) / (500 – 25) = (x – 200) / (450 – 210)
x=154+200
= 354N/mm2
DESIGN STRESS:
At 300 oC, the design strength of Carbon =85N/mm2
At 350 oC, the design strength of Carbon is 80 N/mm2
At 330 oC, the design strength of Carbon will be,
(COULSON AND RICHARDSON, VOL 6)
DESIGN STRESS VALUES AT DIFFERENT TEMPERATURES
| TEMPERATURE, OC | DESIGN STRESS, N/MM2 |
| 25 | 85 |
| 330 | X |
| 500 | 80 |
Interpolating we have,
(330 – 300) / (350 – 300) = (x – 85) / (80 – 85)
X = τ = 82 N/mm2
Nominal design stress = 1.5 × = 1.5 x 82
= 123 N/mm2
CHOICE OF CLOSURE
Minimum wall thickness required for a cylindrical shell
e= PiDi / 2f – Pi
Given that,
Pi = 4241.325 KN/m2
Di = Internal diameter = 0.5275 m
Therefore,
E = (4241.325 × 0.5275)
2 × 82000 – 4241.325
= 14 mm
Corrosion allowance = 2 mm
Minimum thickness of wall required = 14 mm + 2 mm = 16 mm
Choice of closure = Hemispherical head
Optimum thickness ratio for a hemispherical head to the thickness of the vessel = 0.6 (Coulson and Richardson, 2005)
Thickness of the hemispherical head = 16 x 0.6 mm = 9.6 mm
Type of Vessel Support = Skirt Support
INITIAL H2S REMOVAL
ASSUMPTIONS
- No NMP in Output gas stream
- Unit operates at 50% of the flooding gas mass velocity
- Flow rate of NMP is 40% more than the minimum
Given that
Henry’s law constant for NMP = 0.97
Density of gas stream = 31.49kg/m3
Density of NMP = 1020kg/m3
H2S concentration in the inlet stream = 0.5mol%
NMP has already been selected from the first semester preliminary design as our scrubbing liquid.
An energy balance is not require for this unit because there is very little temperature change between the unit’s inlet and exit streams and hence the unit can be assumed to be operating isothermally.
A packed column using 1 in. Raschig ring packing with a packing factor of 160 have been selected for use for this design. Raschig rings have been selected because they give a larger degree of contact between the gas phase and the liquid phase. It also gives a higher mass transfer area to work with.
To calculate the height and diameter of the column to be used for this absorption process, we need to determine the overall gas transfer units, NOG, as well as HOG.
To obtain Equilibrium outlet concentration, x1 at y1 = 0.5,

Where M=Henry’s law constant for NMP
Concentration Y2 for 99.9797% removal of H2S from the inlet stream:

, Substitute  = 0.5,
 =
= 
= 0.00020296
The ratio of the flow rate of NMP to the inlet gas flow rate,  is estimated as
 = 1.4
= 1.4
Substituting the values previously known and obtained into Equation 3.3, we obtain
= 1.4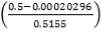
= 1.3574
the expression for calculating  is shown below:
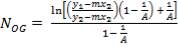
Where A = absorption factor
But
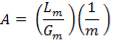
Where m is the slope of the equilibrium curve, assuming it approaches zero.
 = 1.4
= 1.4
Substituting this value into Equation 3.4 along with all equilibrium concentrations, we obtain:
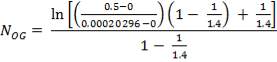
= 22.593
From the value calculated above, we can go further to calculate the height of the column, h

Therefore, the column height that satisfies this design is approximately 46ft (14m).
Given that the physical characteristics of NMP are similar to those of water, some correlations of water systems can hence be used in calculations of NMP systems:
To obtain the flooding gas mass velocity, :
:
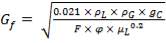 (=)
(=)
Where
 = viscosity of NMP
  = raschig ring packing factor
 = density of NMP
 = density of gas stream
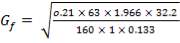 = 6.274
To obtain the actual gas velocity (assuming operation at 50% flooding):

 (11293
 )
)
Hence, we can obtain the column diameter as
= 2.44m
In summary:
Column height = 14m (approx.)
Column diameter = 2.44m (approx.)
MECHANICAL DESIGN
Shell Thickness
Thickness of shell, 
where,
Inner diameter of vessel (D) = 1.3 m
Working pressure = 1.013 ×10⁶ N/m2
Design pressure (P) = 1.1× 1.013 x 106 N/m2
Permissible Stress (f) = 115 × 106 N/m2
Joint Efficiency (J) = 0.85
Corrosion allowance (c) = 2mm
Hence,

So outer diameter of shell
- Axial Stress Due to Pressure
Axial stress due to pressure , 
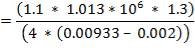
- Stress due to Dead Load
- Compressive Stress due to weight of shell up to a distance X


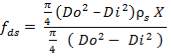
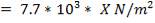
- Compressive stress due to weight of insulation at height X
Insulator used is asbestos
Thickness of insulation,  = 100mm
Diameter of insulation, 
Density of insulation = 575 kg/m3
Mean diameter of vessel = 
For large diameter column,

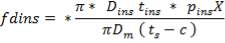
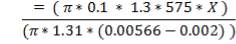
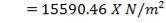
- Compressive stress due to liquid in column up to height X

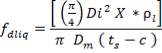
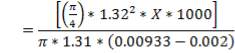
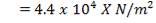
- Effect of attachments
- Packing weight
- Head weight
- Ladder
Density of packing (Plastic pall rings) = 53 kg/m3
Packing weight = 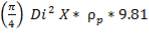
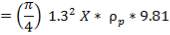
= 690.11 X N
Head weight (approximately) = 35000 N
Weight of ladder = 1600 X N
- SUPPORT FOR ABSORBER
Material used is structural steel (IS 800)
Skirt support is used
Inner diameter of the vessel = Di = 4.69m
Outer diameter of the vessel = Do = 4.70m
Height of the vessel = H = 10.054m
Density of carbon steel =  = 7700kg/m3
Density of packing =  = 53 kg/m3
7.7.2 CARBON MONOXIDE CONVERSION UNIT
Catalyst Volume (from space velocity):
The catalyst volume can be obtained from space velocity data given in the problem statement coupled with the simulation figures for the flowrate of gases into the catalytic converter.
FOR 1ST STAGE:


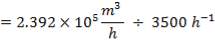

Catalyst Mass (in 1st stage of converter):

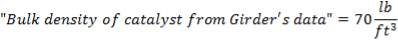
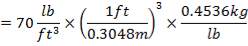

Thus,
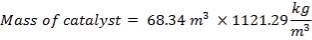
FOR 2ND STAGE:

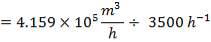

Catalyst Mass (in 2nd stage of converter):
CATALYTIC CONVERTER SIZING
In carrying out the sizing of Fixed Bed Reactors, most designs approximate to plug flow. The simplest of such arrangements is adiabatic (Chemical Process Design and Integration by Robin Smith).
With the assumption of an elementary reaction, the rate of reaction can be proposed to be:
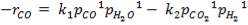
Inhibiting the undesired reverse reaction, leading to the elimination of the second term of the rate expression can be done by running the reaction at an appropriate temperature, removing product from the reaction vessel shortly after formation and operating at certain pressures.
Thus, this results into:
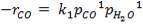
In terms of mole fraction of reactants entering into the reactor,
This provides grounds for assuming that  is so large, it would relatively, be constant so that:
where, 
 = Specific reaction rate (constant) for component CO [=] s-1 or h-1
= 


 Reaction rate [=] kmol.m-3.s-1 or kmol.m-3.h-1
FA0
FA
For a tubular flow reactor such as the one employed in the catalytic converter, the following performance equation is developed:

As a result,
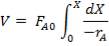
substituting, we have:
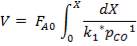
since  is constant,

Recalling that,
Thus,
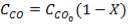
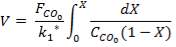
Taking CCOo which is a constant into consideration, we have:
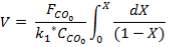
Thus, integrating the above expression, we have
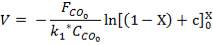
where, c is an integration constant
Recall,
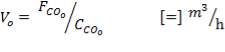
substituting Vo into the expression for V,
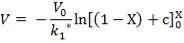

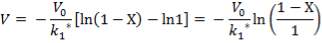
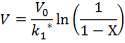
In the above expression,  is the volumetric flowrate of the entering stream into the FIRST stage, and it is equal to
 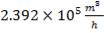 .
.
Working with a basis of about 80% conversion in the first stage of the catalytic converter, X = 0.8
Explanations ensued on the appropriate  to be used make way for literature data. The Howard Rase’s data from Girder which states that for the Iron – Oxide catalyst, Fe3O4
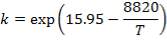
With the temperature being equal the equilibrium temperature in 0R of the catalytic converter stage in question, the temperature from the simulation is equal to 380.8 which is equal to 11740R
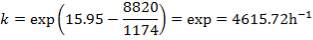

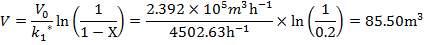
For the second stage, the expression translates into:

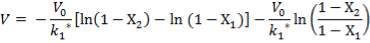
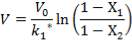
In the above expression, is the volumetric flowrate of the entering stream into the SECOND stage, and it is equal to  .
.
Working with a basis of about 95% conversion in the second stage of the catalytic converter, X2 = 0.95 and X1 = 0.80 in the first
Back to the rate constant dependent on temperature,
With the temperature being equal the equilibrium temperature in 0R of the catalytic converter stage in question, the temperature from the simulation is equal to 370.0which is equal to 11580R
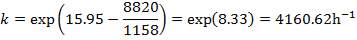

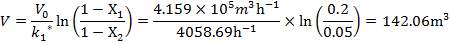
Thus, the following are the calculated reactor volumes:
1st Stage of reactor 85.50
2nd Stage of reactor 142.06
Standard reactor sizing reflected from Perry’s Handbook of Chemical Engineering reveal that for a standard plug flow tubular reactor, 
 will be assumed for this reactor
For a cylinder, volume, 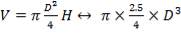
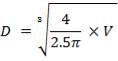
For the first stage, 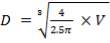
This makes the height equal to  m
m
Working with the reasoning that both stages of the reactor have to have the same diameter,
For the second stage,  3.518 m
From  ,
,
For the Height of catalyst bed:
1st stage,
,
2nd stage,
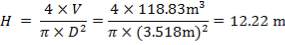
Type of vessel head
The vessel head indicates the closure. Ellipsoidal heads will be made use of. The ellipsoidal head thickness can be calculated using the following formula:
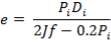
where, Pi – is the internal pressure; = 1200 kPa =1.2 Nmm-2
Di – the internal diameter; = 3.518 m
J – the joint factor; which is equal to 1 as a result of the absence of joints
f– the design stress at the specified temperature, equal to 180 N/mm2

CHEMICAL ENGINEERING DESIGN (FINAL H2S REMOVAL)
The following was specified
Determination of number of holes
Using the correlation
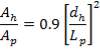
Ap = perforated area = tray area
dh = hole diameter
Lp = hole pitch = 3 for a triangular pitch
Ah= total hole area = n
AP= , dh =5 x 10-3
=4.9087m2
Ah =n
=0.000019634nm2
 = 0.9
= 0.9 
=0.9 
=0.1
 =
=
n=
=25001 holes
(e) Determination of the mass of lautamasse and sulphur.
The general equation for the thickness of a flat plate required to resist a given pressure load can be written in the form.
t = CD 
 =the maximum allowable stress ( the design stress)
D= the effective diameter
C= a constant, which depends on the edge support
T=0.43 
Assuming a thickness of 10mm
10=0.43
 =
=
P=0.00007684/m
P=20768N/
Using p=
Force=P
A=
= 
=4.9087m2
F = 20768N/m 2 x 4.9087 m2
=101945N
Mass = 
=  Kg
Kg
= 10402.6 Kg
When the quantity of sulphur deposit on the tray falls between 40-55% of the weight of the lautamsee the operation has to be stopped and then regeneration takes place.
Assuming the mass of sulphur and the lautamase is the ratio 1:0.4 that is assuming that sulphur is 50% of the total mass mixture.
Mass of sulphur= x 10402.5 kg
=3467.5kg
Mass of fe203 =
=6935kg
To calculate the time for regeneration:
Equation of reaction
 2Fe203(s) + 6H2S(g) 2Fe2S3 + 6H20 (1)
2Fe203 + 302(g) 2Fe203 + 6S(g) (2)
From the reaction
3 moles of H2S(g) produced 6 moles of sulphur.
Number of moles of the fed = 
=
=108.359kmol
Number of moles of the H2S required to produced 2108.359 of H2S is 108.369kmol from material balance
Molar flowrate of H2S intel =0.0211kmol/hr
Molar flowrate of the outlet =1.06583 x kmol/hr
Amount of H2S absorbed in flow rate
= (0.02011-1.0658x  kmol/hr
=0.01904417kmol/hr
Assumption
The absorption of H2S in the four columns are 50%, 30%, 20%, 10%. The assumption is based on the fact that absorption decreases along the column. But we want to model the column base on the absorption of the first column.
Time after which regeneration will take place is t
= =
=
=11379.67hr
The molar flow rate (0.009522085kmol/hr) was calculated by multiplying 0.01904417kmol/hr x 50%
But 24hr = 1day
11379.76hr = x Days
x days=
=474.156 days
30 days=1mol
474.156 days =p mols
P =
=15.8months
 16months
After 16 months regeneration process has to be carried out.
volume and height of sulphur and lautamasse determination.
Mass of sulphur = 3467.6kg
Density of sulphur = 2000kg/m3
Volume of sulphur = 
=
Height = 
= 
= 0.3532m
Lautamasse;
Density of lautamasse = 675kg/m3
Mass of lautamasse = 6935kg
Volume = 
= 10.274m3
Height = 
= 2.0930m
This is a good value since the higher the height of the lautamasse, the lesser the effective tray spacing.
Total height of lautamasse and sulphur
= 2.0930 + 0.3532
= 2.45m
REGENERATION
Sulphur deposit after 16months per column = 3467.5kg  5
5
= 17337.5kg
Amount in moles= 
= 541.797 moles
S + O SO2
541.8 kmol of O2is required per column.
Since each column is designed assuming 50% of the total H2S absorbed
(4 541.797kmol)SO2 = 150% of the actual SO2 produced
Also, (4 541.797kmol)SO2 = 150% of the oxygen required
The actual SO2 produced = 1444.8kmol
The actual O2 required = 1444.8kmol
If regeneration is assumed to take place within 6hrs,
Flow rate of SO2 regenerated = 240.8kmol/hr
7.7.3 CARBON DIOXIDE REMOVAL
Mechanism of Removal: Absorption
Absorption Mechanism: Chemosorption(Chemical Absorption)
Equation of Reaction
K2CO3(aq) + H2O(l) + CO2(g) 2KHCO3(aq)
CHEMICAL ENGINEERING DESIGN
Basis : 4125.535 kg of Feed / hr
COMPOSITION OF INLET AND OUTLET STREAMS FOR CO2 REMOVAL
| COMPONENT | yin | yout |
| H2 | 0.63326 | 0.9800 |
| CO | 0.00060 | 0.00093 |
| C02 | 0.35555 | 0.00247 |
| N2 | 0.00989 | 0.0155 |
| CH4 | 0.00071 | 0.001104 |
| H2S | 5.33E-07 | 8.34E-07 |
| TOTAL | 1.000000 | 1.000000 |
ASSUMPTION: Only Carbon dioxide (CO2)is absorbed and all the other gases act as inert in the 40% K2CO3 solution.
MOLE RATIO OF CO2 IN THE GAS ENTERING THE COLUMN
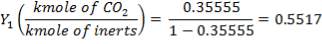
MOLE RATIO OF CO2 IN THE GAS LEAVING THE COLUMN
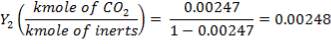
FLOW RATES OF GAS ENTERING = 1996.789 kmol/hr
FLOW RATES OF LIQUID LEAVING = 1277.92 kmol/hr
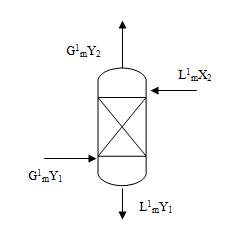
Typical absorber showing inlet and outlet gas and liquid streams
MAKING AN OVERALL MATERIAL BALANCE
Equation 1
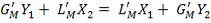
Equation 2
Rearranging,
Equation 3

 = flow rate of inert in gaseous stream
 = flow rate of liquid stream
Solving Equation 2,
 as the entering K2CO3 contains no CO2

Plotting the equilibrium curve for CO2
EQUILIBRIUM DATA FOR CO2
 |
X | Y | X | Y |
| 0.025 | 0.1 | 0.0017 | 0.111111 | 0.001703 |
| 0.18 | 0.2 | 0.0122 | 0.25 | 0.012351 |
| 0.6 | 0.35 | 0.0408 | 0.538462 | 0.042535 |
| 1.7 | 0.5 | 0.1156 | 1 | 0.13071 |
| 4.0 | 0.68 | 0.2722 | 2.125 | 0.374004 |
| 7 | 0.75 | 0.4762 | 3 | 0.909126 |
| 10 | 0.8 | 0.6803 | 4 | 2.127932 |
| 11 | 0.9 | 0.748 | 9 | 2.968254 |
STEPS INVOLVED IN OBTAINING 
- Plot a graph of X against Y
- Trace the value of Y1 across the graph and note the point of intersection with the equilibrium line.
- Draw a line from Y2to the point of intersection
- Then find the slope of the line which is
 .
.
From the graph,the value of  = 0.2208

The  calculated above is the amount of K2CO3 only, the amount of the whole solution
To find the  ,
,
COLUMN DIAMETER CALCULATION
Gas Mass Flow rate at the bottom of column ( =
= 
Liquid Mass Flow rate at the bottom of column ( = 
The density of the gaseous feed, 

 (density of liquid )of 40% K2CO3 at temperature of 388.46K = 1359kg/m3 (Perry)
Also from data viscosity of 40wt% K2CO3 at 388.46K = 0.9cP (Kohl)
PACKING MATERIAL: Pall Rings (Plastic)
Pall rings are chosen as the Fp (Packing Factor), small column diameter , high quality with low price, low pressure drop.
The packing characteristics
Dp = 90mm
% = 92%
= 92%
Fp = 56m-1 (17.0688ft-1)
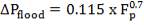

 Packing Height
Flow Parameter,
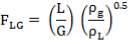
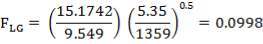
Using Figure 14.48 (Perry) for flow parameter of 0.0975 and  of
of  Packing Height
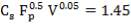
Where
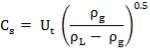
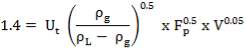


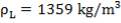


The Column Diameter is 1.3m
Height calculations
HG (Height of the gas film transfer unit)
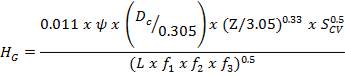
HL (Height of the liquid film transfer unit)
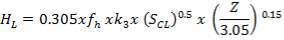
Determine the values of the parameters Scv, Scl, Lw×, f1, f2, f3, k3, yh, fh
Where,
Scv = vapor phase Schmidt number
Scl = liquid phase Schmidt number
Lw×=liquid mass flow rate per unit column cross section
f1 = liquid viscosity correction factor
f2 = liquid density correction factor
f3 = surface tension correction factor


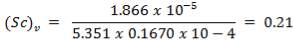


Surface tension of water  = 72.8 dynes/cm
Surface tension of liquid ( ) = 91.4 dynes/cm
At assumed percentage flooding,

=  = 11.8 kg/ m.s
At  ;
; 
Also at assumed percentage flooding,

Take diameter correction term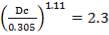 1.11 = 2.3
Estimate Z as 26m
Solving for 
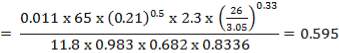
Solving for HL
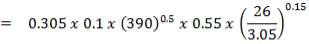
= 0.457

Colburn has suggested optimum values of  to lie between 0.7 & 0.8
Therefore,
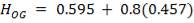
= 0.96
Now, Column height= 0.96 x assumed Z
= 0.96 x 26
= 24.96
AUXILIARY EQUIPMENT: HEAT EXCHANGERS
BASIC DESIGN PROCEDURE
FIRST HEAT EXCHANGER DESIGN
STEP 1: SPECIFICATION
The process stream flows into the first heat exchanger, and it is required to raise the temperature of the unconverted gas stream from the saturator by heating against converted gas from the second stage of CO shift conversion reactor. The physical properties of the fluids are as presented in step 2 below.
Duty = 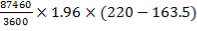
= 901.1 kW
The same amount of heat duty transferred to the shell side
STEP 2: PHYSICAL PROPERTIES
Gas from second stage of catalytic converter
Inlet Mean Outlet
Flow kg/hr 984100 984100 984100
Pressure kPa 700 500 300
Temperature oC 373.4 371.05 368.7
Specific Heat KJ/kg oC 2.090 2.080 2.070
Thermal Conductivity mW/m oC 54.82 66.156 53.95
Density Kg/m3 14.52 14.40 14.28
Viscosity μNsm-2 16.80 17.51 18.22
Gas from unconverted gas stream
Inlet Mean Outlet
Flow kg/hr 29290 29290 29290
Pressure kPa 3000 2750 2500
Temperature oC 163.5 181.75 220.0
Specific Heat KJ/kg oC 1.965 2.1472 1.965
Thermal Conductivity mW/m oC 75.34 79.851 86.28
Density Kg/m3 13.83 13.60 13.37
Viscosity μNsm-2 17.56 17.55 17.54
STEP 3: OVERALL COEFFICIENT
For a gas-gas exchanger of this type, the overall coefficient, as suggested by literature, should range between 50 and 300W/m2 oC (light oils).
STEP 4: EXCHANGER TYPE AND DIMENSIONS
An even number of tube passes is usually the preferred arrangement as this places the inlet and outlet nozzles at the same end of the exchanger, which simplifies the pipe work. Nonetheless, we use one shell pass and one tube pass.
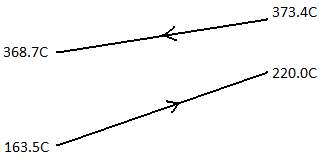
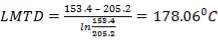
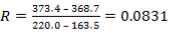
 Ft (correction factor) = 0.97

Assume U = 120W/m2 °C
STEP 5: HEAT TRANSFER AREA
STEP 6: LAYOUT AND TUBE SIZE
A split-ring floating head exchanger is to be used for efficiency and ease of cleaning. Both shell and tube fluids are corrosive and the operating pressure is high, so a stainless steel can be used for the shell and tubes. Since the unconverted gas stream contains more CO than H2, and the converted gas contains more H2 than CO, thus the unconverted gas stream is more corrosive due to the more corrosive nature of CO, and as such, the unconverted gas stream is passed through the tubes, and the converted, through the shell.
The following standard steel tube dimensions are to be used: 30mm outside diameter, 26mm inside diameter, 4.83m long tubes. A popular triangular pitch is to be used in the design, with pitch-to-diameter ratio = 1.25.
STEP 7: NUMBER OF TUBES
Area for heat transfer of one tube (External curved-surface area of tube sheet)
= 
Number of tubes = , Say 96
So, for 1 passes, tube per pass = 96
Tube internal cross-sectional area =
So area per pass = 
Volumetric flow = 0.6300 m3/s
Tube side velocity, ut = 
This velocity is sufficient for tube operation (reasonable gas velocity should be from 15 to 30 m/s)
STEP 8: BUNDLE AND SHELL DIAMETERS
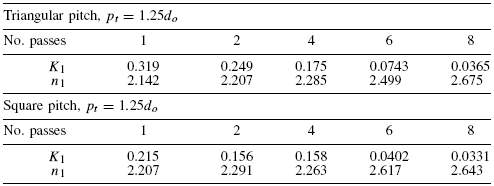
Selection Parameters for the Design of Tube Bundle Diameter (Sinott, 2005)
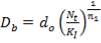
Where Nt= number of tubes
Db= bundle diameter, mm,
do = tube outside diameter, mm .
From table above, k1=0.319, n1=2.142
Db = 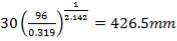
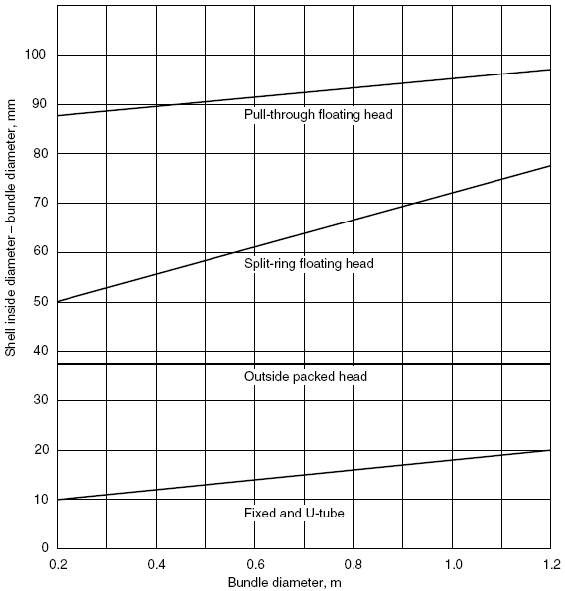
SHELL-BUNDLE CLEARANCE (SINOTT, 2005)
For split ring, floating head exchanger, the shell clearance from above figure is 51mm
 = 426.5 + 58 = 484.5mm
STEP 9: TUBE-SIDE HEAT TRANSFER COEFFICIENT
 =
= 
 =
=
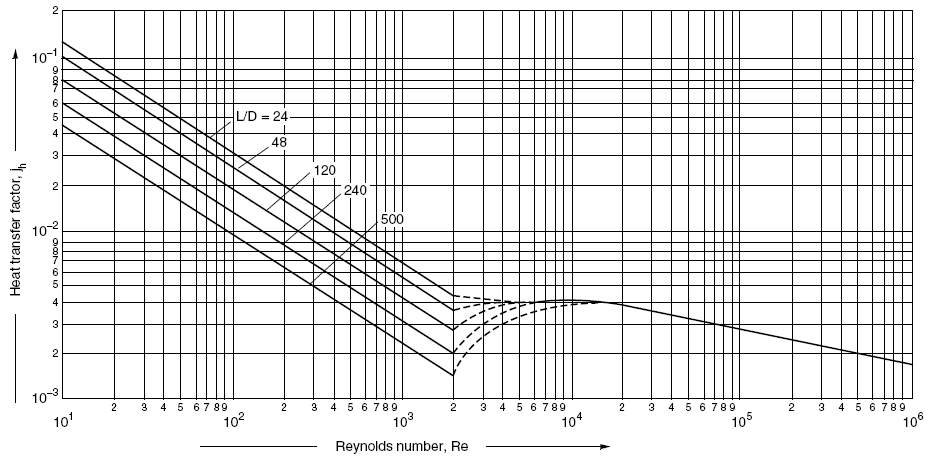
TUBE-SIDE HEAT-TRANSFER COEFFICIENTS
From FIGUREbelow jh = 
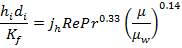
Neglecting viscosity correction factor,

STEP 10: SHELL-SIDE HEAT TRANSFER COEFFICIENT
Kern’s method will be used
The shell diameter as calculated is;
DS=484.5 mm
As a first trial, take the baffle spacing = 
=96.8mm
Calculating the area of cross flow Asfor the hypothetical row of tubes at the shell equator, given by:
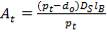
Also shell equivalent diameter (de) (hydraulic diameter), for triangular pitch is given by
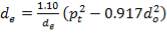
Where Pt= tube pitch,
do = tube outside diameter,
Ds= shell inside diameter, m,
lB= baffle spacing, m.
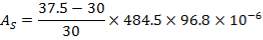
=0.0180m2
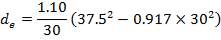
=21.30mm (to be used to calculate the Reynolds number Re)
Shell velocity, us
= 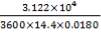
= 34.41m/s
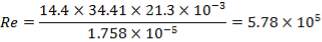

In using segmented baffles with a 25% cut, this should give reasonable heat transfer coefficient without too large a pressure drop.
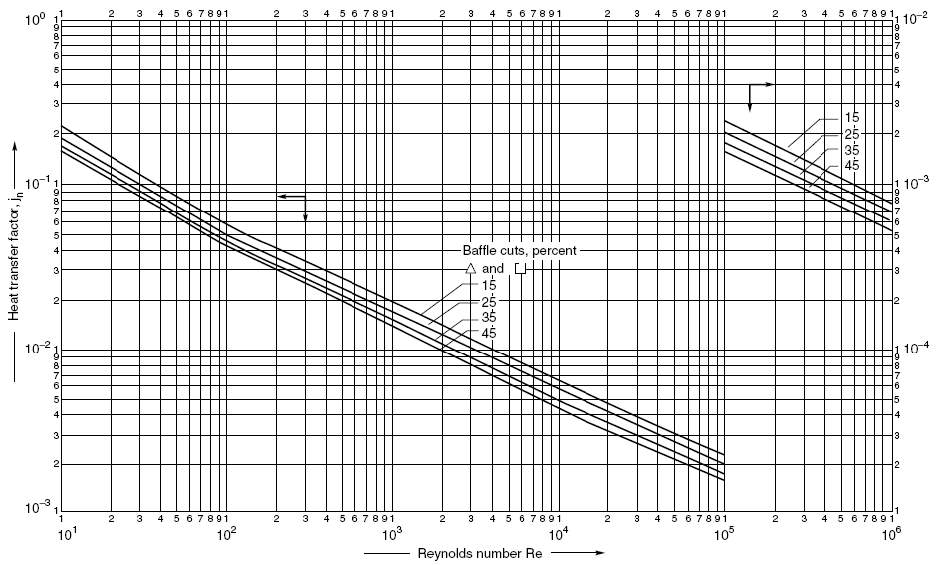
SHELL-SIDE HEAT-TRANSFER COEFFICIENTS
From the above figure, jh =
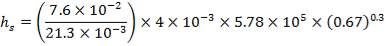
= 451.91
STEP 11: OVERALL HEAT TRANSFER COEFFICIENT
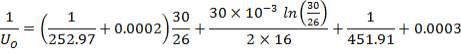
 149.85
The calculated overall coefficient deviates from the assumed 120 value within 25%; as such, the equipment so designed has adequate area to handle the required duty.
STEP 12: PRESSURE DROPS CALCULATIONS
TUBE SIDE
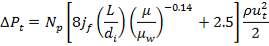
Where  = tube-side pressure drop, N/m2 (Pa),
Np = number of tube-side passes,
ut = tube-side velocity, m/s,
L = length of one tube.
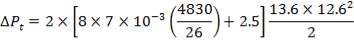

SHELL SIDE
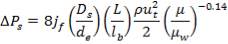
where L = tube length,
lB= baffle spacing.


STEP 14: OPTIMISATION
There is scope for optimizing the design by reducing the number of tubes, as the pressure drops are well within specification and the overall coefficient is well above that needed. However, the method used for estimating the coefficient and pressure drop on the shell side(Kern’s method) is not so accurate, so keeping to this design will give some margin of safety.
VISCOSITY CORRECTION FACTOR
The viscosity correction factor  was neglected when calculating the heat transfer coefficients and pressure drops. This is reasonable for gases as it has a relatively low viscosity.
Usually, 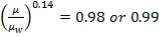
For such a small factor, the decision to neglect it was justified. Applying the correction would decrease the estimated heat transfer coefficient, which should not be a problem as the area required for heat exchange is well taken care of. It would also give a slight increase in the estimate.
SECOND HEAT EXCHANGER DESIGN
Applying the Above Steps for Heat Exchanger 2,
Fluid Properties:
Gas from first stage of catalytic converter
Inlet Mean Outlet
Flow kg/hr 31220 31220 31220
Pressure kPa 1200 950 700
Temperature oC 380.9 377.15 373.4
Specific Heat KJ/kg oC 2.1164 2.1033 2.0902
Thermal Conductivity mW/m oC 56.076 55.448 54.820
Density Kg/m3 12.480 14.400 8.7527
Viscosity μNsm-2 17.904 17.7529 17.6018
Gas from unconverted stream
Inlet Mean Outlet
Flow kg/hr 29290 29290 29290
Pressure kPa 2500 1850 1200
Temperature oC 220.0 285.0 350.0
Specific Heat KJ/kg oC 1.9563 1.9665 1.9767
Thermal Conductivity mW/m oC 82.68 90.92 99.16
Density Kg/m3 8.3043 14.400 1.0337
Viscosity μNsm-2 17.862 18.876 21.004
STEP 3: OVERALL COEFFICIENT
For a gas-gas exchanger of this type, the overall coefficient will be in the range of 20 to 300W/m2 oC (Gases).
STEP 4: EXCHANGER TYPE AND DIMENSIONS
An even number of tube passes is usually the preferred arrangement as this positions the inlet and outlet nozzles at the same end of the exchanger, which simplifies the pipe work. So, we hereby use one shell pass and 4 tube passes.
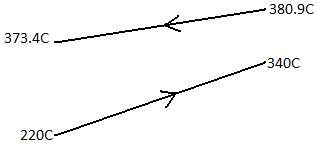
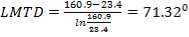 C
C
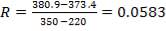
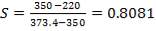
By reading correction factor from literature with the values of R and S, 

Assume U = 60 W/m2 oC
STEP 5: HEAT TRANSFER AREA
STEP 6: LAYOUT AND TUBE SIZE
The ratio of H2O and CO between both streams is still similar as with the first exchanger, and as such, the gas from the combustion chamber is passed through the shell, and the unconverted gas is passed through the tubes, as in the case of the former heat exchanger. Use 20mm outside diameter, 16 mm inside diameter, 6 m long tubes.
A triangular pitch will be used also. Pitch/diameter = 1.25.
STEP 7: NUMBER OF TUBES
Area of one tube (Neglecting thickness of tube sheet)
= 
Number of tubes = tubes
tubes
So, for 4 passes, tube per pass =327
Tube cross-sectional area =
So area per pass=
Volumetric flow =
Tube side velocity, ut =
This velocity is high enough to corrode the tube internal at pressures above atmospheric (reasonable gas velocity should be from 5 to 10 m/s)
STEP 8: BUNDLE AND SHELL DIAMETER
k1 = 0.175, n1 = 2.285; from Figure 4
Db=
For split ring, floating head exchanger, the shell clearance from Figure 5 above is 73mm
= 991.39 + 73 = 1064.39mm
STEP 9: TUBE-SIDE HEAT TRANSFER COEFFICIENT
= 
=
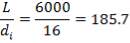
From Figure 6, jh = 2.5
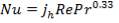 =
= 

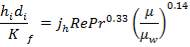
Neglecting viscosity correction factor,
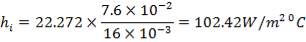
STEP 10: SHELL-SIDE HEAT TRANSFER COEFFICIENT
Kern’s method will be used
The shell diameter as calculated is;
DS=1064.39 mm
As a first trial, take the baffle spacing =
lB= 212.88 mm
Calculating the area of cross flow AS for the hypothetical row of tubes at the shell equator, given by:
Also shell equivalent diameter (de) (hydraulic diameter), for triangular pitch is given by
,where the parameters are as listed above.
 0.0564m2
14.22mm
Shell side velocity at operating condition= = 11.15
Gs =
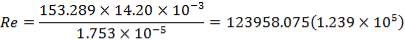
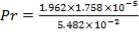 = 0.67
Using segmented baffles with a 25% cut.
From the above Figure 7, jh = 
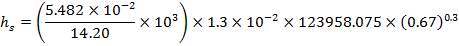
= 124.93
STEP 11: OVERALL HEAT TRANSFER COEFFICIENT

67.81
The calculated overall coefficient deviates from the assumed 60 value with 13%.
STEP 12: PRESSURE DROP
TUBE SIDE
With = tube-side pressure drop, N/m2 (Pa),
Np = number of tube-side passes,
ut= tube-side velocity, m/s,
L =length of one tube.

SHELL SIDE
OXYGEN STREAM PRE-HEATER
Fluid Allocation
Placing the higher temperature stream on the tube side will reduce the overall cost of design. Therefore, the saturated stream is placed in the tubes.
DUTY OF PRE HEATER
Let us assume that the amount of saturated stream used for pre-heating of the O2 stream gives off ‘ONLY’ its Latent Heat to the O2 – stream
Q= (mCpΔT)O2 = (mL)stream
At a mass temperature of 115 0c, the Cp of the O2 stream Cp = 0.9818KJ/Kg 0c
Q = 4701.58 kg/hr(0.9818J/Kg 0c)(210 – 20)
= 877.04 ×10³ KJ/hr
=243.622 ×10³ W
MASS OF SATURATED STREAM REQUIRED.
Q= msLS
Where
LS = Latent Heat of Vaporization of stream at specified conditions (1723KJ/Kg)
243.622×103 = ms(1723)
mS = 877.04 ×10³/1723(KJ/hr)/(KJ/Kg)
= 509.02Kg/hr
= 0.1414 Kg/sec
Log MEAN TEMPERATURE DIFFERENCE (ΔTm)
ΔTm = ΔT1 – ΔT2/ln(ΔT1/ΔT2)
=(254.9 -210)- (254.9- 20)/ ln[(254.9 – 210)/(254.9 – 20)]
ΔTm = 114.823 oc
From Literature, F= 0.986
Corrected Tm = F(ΔTm)
ΔTm= 0.986(114.823 0c)
= 133.215 0c
ESTIMATION OF U (Overall Coefficient)
An estimation of 200W/m2C for the overall Heat Transfer Coefficient is chosen as suggested by literature.
CALCULATION OF PROVISIONAL AREA.
A = 243.622 × 10³W/200(133.215 0C)
= 10.76m2
TUBE DIMENSION SELECTION
- Outer Diameter – 20mm
- Inner Diameter – 16mm
- Length of Tube – 6.10m
- Tube Effective Length- 6.0m
Small diameter tubes are chosen because they give more compact & cheaper exchangers. Use of longer tubes will reduce shell diameter thus lowering cost exchanger.
Heat Transfer Area of 1 tube = πdoL
= π(20/1000)(6)
= 0.37699m2
NUMBER OF TUBES REQUIRED
Number of tubes required = Provisional area/Area of 1 tube
=10.75m2/0.37699m2
Number of tubes = 28.542
=28 tubes
TUBE ARRANGEMENT SELECTION.
A Triangular Tube Arrangement pattern is chosen as it gives higher heat transfer rates as compared to others. The recommended tube pitch is 1.25 times the Tube Outside Diameter(do). Tube Bundle Diameter is therefore
Nt = K(Db/do)n
28 = 0.249(Db/20)2.207
Db= 169.95mm
=170mm
SHELL DIAMETER DETERMINATION
Using a Split Ring Floating Head unit, the Diameter clearance between the Shell and Tube Bundle is 50mm
Therefore,
Shell Diameter = 170 +50 = 220mm
TUBE SIDE COEFFICIENT
A Horizontal Condenser with condensation in the tubes is the usual arrangement for pre-heaters &vaporizers using condensing steam as the heating medium. It is customary to design purposes. For air- free steam, a coefficient of 8000W/m2 is used. Therefore,
hI= 8000W/m2
SHELL SIDE COEFFICIENT.
As = [(pt – do)/ps]DSLB
Pt = 1.25(do) = 25mm
LB = DS (for Pre-heaters)
AS = 25-20/25(220×10-3)2
= 9.68×10⁻³m2
MASS VELOCITY IN SHELL (GS)
GS= WS/AS
=4701.58/3600×1/9.68×10-3
GS = 134.917Kg/m2s
LINEAR VELOCITY (Us)
US = GS/ρ
=(134.917Kg/m2s)/(42.07Kg/m3)
US = 3.20m/sec
SHELL SIDE EQUIVALENT DIAMETER
For a Triangular pitch Arrangement
de = 1.10/do[pt2– 0.917do2]
= 14.2mm
AVERAGE PHYSICAL PROPERTIES OF SHELL FLUID
- Viscosity (µ) = 2.61 ×10⁻⁵ Pas
- Thermal Conductivity (K) = 3.448 × 10⁻² W/mK
- Heat Capacity (Cp) = 0.9818 ×10³ J/Kg 0C
REYNOLD’s NUMBER ON SHELL SIDE
Re = 42.07 (3.2)(14.2 × 10⁻³)/(2.61 ×20-5)
=73402.99987
PRANDTL’s NUMBER ON SHELL SIDE
Pr = (0.9818 ×10³)(2.61 ×10⁻⁵)/3.448×10-2
=0.74318
From literature, jh = 2.3 × 10⁻³
hsde/kf = jhRePr 1/3
hs(14.2 × 10⁻³)/3.448×10-2 = 2.3 ×10⁻³(73402.99987)(0.74318)1/3
hs = 317.324W/m2 0c
OVERALL COEFFICIENT
Thermal conductivity of cupronickel alloys =50W/mK
Tube side scale Resistance = 0.052 × 10⁻³m2K/W
Shell side scale resistance =0.14 ×10⁻³ m2K/W
U-1= (371.324)-1 + 0.00014+20×10-3ln(20/16)/2(50)+20(0.000052)/16+20/16(1/8000)
U-1= 3.0989 ×10⁻³
U = 322.691 W/m2 0c
PRESSURE DROP CALCULATIONS
- On the Shell Side
Re = 73402.99987
JF = 3.6 × 10⁻²
ΔPs = 4(3.6×10⁻²)(220/14.2)(6000/220)(42.07×3.202)
= 26.2112 KN/m2 which is very acceptable
- On the Tube Side
The pressure drop on the condensing side or tube side is difficult to predict as 2 phases are present & the vapour mass velocity is changing throughout the tube side.
AIR-COOLED EXCHANGERS
(1)
Where
T1= the process side inlet temperature = 325°C
T2= the process side outlet temperature = 40°C
t1= the air-side inlet temperature = 25°C
t2= the air-side outlet temperature = 216.4°C
LMTD = 47.28°C
 (2)
(2)
With
μo = the viscosity of air at 0°C = 1.78 × 10⁻⁵ kg/m s
μt = the viscosity of air at t = 1.8829 × 10⁻⁵ kg/m s
Tt = the set temperature = t = 216.4°C
To = the temperature of air at 0°C
Prandtl Number
 (3)
(3)
Cp = Specific heat capacity of air = 1.0130 KJ/kg °C
μair =Viscosity of air at 216.4 °C = 1.8829 × 10⁻⁵ kg/m s
K = Thermal conductivity of air = 2.7143 × 10⁻⁵ KJ/m °C
Thus, the Prandtl number for air at 216.4 °C = 0.69
Heat Duty Required
 (4)
(4)
Wair = mass flow rate of air = 1.443 × 10⁷ kg/hr
to = outlet temperature of the air = 216.4 °C
ti = inlet temperature of the air = 25 °C
Hence, the heat duty Q of the exchanger = 1.013 KJ/kg °C
Overall Heat Transfer Coefficient for the Design
 (5)
(5)
Where
U = Overall heat transfer Coefficient in KJ/hr m2 °C
A = Effective heat transfer area in m2
Δtm = Log mean temperature difference LMTD between the process stream and cooling air
The LMTD and Q values have been calculated as above
Also, A relates to other parameters as
 (6)
(6)
With V = volumetric flow of air = 1.2265 × 10⁷ m3/hr, vair = vface = velocity of air m/hr
Trials with various values of U
HEAT TRANSFER COEFFICIENTS WITH CORRESPONDING AREA AND AIR VELOCITY VALUES
| S/N | U (KJ/hr m2°C) | A (m2) | vair (m/s) |
| 1 | 6.127 × 10⁴ | 965.56 | 3.00 |
| 2 | 8.169 × 10⁴ | 724.167 | 4.00 |
| 3 | 1.225 × 10⁵ | 482 | 6.00 |
HEAT TRANSFER COEFFICIENTS WITH CORRESPONDING AREA AND AIR VELOCITY VALUES
In addition,
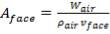 (7)
(7)
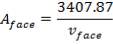
Aface = face area (m2)
CORRESPONDING FACE VELOCITY AND FACE AREA VALUES
| vface (m/s) | Aface (m2) |
| 3 | 1135.96 |
| 4 | 851.97 |
| 6 | 567.91 |
Substituting Wair in (7) into (4),
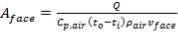 (8)
(8)
ρair = density of air, 1.1762 kg/m3
So far, for heat exchanger parameters,
U = 1.2254 × 10⁵ KJ/hr m2 °C
A = 482.78 m2
vface = 6 m/s
Aface = 567.91 m2
FAN COVERAGE
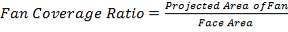 (9)
(9)
By standard, it is preferable to fan coverage ratio above 0.40, as a high ratio improves air distribution across the face of the tube bundle, but an excessively high value would imply excessive power input.
Here, we take fan coverage ratio for the design as 0.50
Aface = 567.91 m2
Thus,
Projected Area of Fan = 0.5 × Aface
= 0.5 × 567.91
= 293.96 m2
For the design also, we choose to use two fans rather than one, as this takes care of cooling over a bit of a longer distance of fan stages, and provides insurance in case of failure of one fan or the other.
Fan Diameter
With the two identical fans to be used the diameter is simply computed with the diameter, thus;
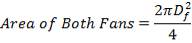
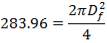
Diameter of fan = 13.45 m
General Properties of the Fans to be used as per industrial standards
Fan speeds vfan = 70 m/s
V-belt drive of about 30 horsepower
Forced draft fan system will be used as it uses less power in blowing cool air volume
Fin Area and Tube Area Analyses
 (10)
(10)
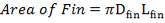 (11)
(11)
 (12)
(12)
Dfin = Diameter of fin = 12.7 mm
De = External diameter of the tube = 41.2 mm
Di = Internal diameter of the tube = 37.2 mm
W = Width of tube = 4.00 m
Lfin = Length of fin = 68.2 mm
L = Length of tube = 15 m
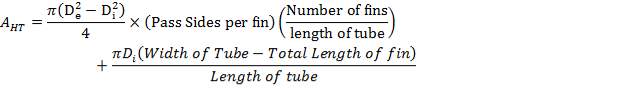
AHT = Total heat transfer area per length of tube = 0.01644 m2/m
Number of tubes per row of each metre in a tube bank = n× = 
With the chosen pitch, P = 47.625 mm; n× = 20.997 ≈ 21 tubes per row
Number of rows n, chosen = 4; and given that W = 4.00 m,
Total number of tubes, N = n× × W × n = 336 tubes.
Cite This Work
To export a reference to this article please select a referencing stye below:
Related Services
View all


Related Content
All TagsContent relating to: "Biology"
Biology is the scientific study of the natural processes of living organisms or life in all its forms. including origin, growth, reproduction, structure, and behaviour and encompasses numerous fields such as botany, zoology, mycology, and microbiology.
Related Articles

DMCA / Removal Request
If you are the original writer of this dissertation and no longer wish to have your work published on the UKDiss.com website then please: