Probability Risk Analysis of Engine Control Systems Used in Civil Aircraft
Info: 16445 words (66 pages) Dissertation
Published: 27th Jan 2022
Tagged: Aviation
Abstract
The purpose of this paper is to describe the guidelines used while performing safety assessment of the engine of the aircrafts used for civil aviation. The paper focuses on the Fault Tree Analysis (FTA) and the Functional Hazard Analysis (FHA) method of safety assessment. For the purpose of being used as a model for the duration of the paper, the Gulfstream aircraft engine model GV-SP has been used. The calculations for the FHA analysis and FTA analysis have been done using the design of this engine. This thesis follows the rules and guidelines applicable for the FAA and EASA regulations and this document have been done under those guidelines. The thesis also shows compliance to the FAR/JAR 25.1309. As such, part of the thesis might be applicable for non 25.1309 situations.
For the purpose of finding the probability risk assessment of the aircraft engine in question, FHA analysis and FHA analysis is required. So, firstly the functions of the engine control system are identified for the purpose of making the FHA table. They are identified from the top level events to the low level events, also, their failure conditions and the effects of those failures are also identified. After which, these data is used to make the FTA diagram and represent the data in a graphical representation. The failure rates etc, are got from the Gulfstream aircraft engine GV-SP specifications, and this data is utilized in the calculations of failure rate probability and other calculations. Finally, a conclusion has been drawn from the calculations made which determines the probability risk assessment of the engine.
Keywords
Functional Hazard Analysis (FHA), Fault Tree Analysis (FTA), Primary System Safety Assessment (PSSA), Failure Modes and Effects Analysis ( FMEA).
Table of Contents
Click to expand Table of Contents
Chapter 1 Preface…………………………………………..4
1.1 Purpose and Scope of thesis …………………………………4
1.2 Organization of thesis …………………………………….6
1.2 Acronyms……………………………………………7
Chapter 2 System Safety Assessment ……………………………….8
2.1 Functional Hazard Assessment ……………………………….8
2.1.1 Introduction………………………………………8
2.1.2 Requirements for FHA……………………………….10
2.1.3 FHA process…………………………………….15
2.1.4 FHA output……………………………………..18
2.1.5 Mistakes to avoid………………………………….19
2.1.5 Summary of FHA………………………………….19
2.2 Fault Tree Analysis …………………………………….19
2.2.1 Introduction……………………………………..19
2.2.2 Background……………………………………..23
2.2.3 Theory behind FTA…………………………………24
2.2.4 Methodology…………………………………….25
Chapter 3 The FHA of engine control system …………………………30
3.1 Functions of engine control system ……………………………30
3.2 Failure conditions of each function ……………………………33
3.3 The Failure effect and probability of each failure condition ……………..35
3.4 FHA table ………………………………………….35
Chapter 4 The FTA of engine control system ………………………….38
4.1 Fault tree of typical engine control system ………………………..39
4.2 Analysis based on the fault tree ………………………………39
4.2.1 Cut Set determination ……………………………….39
4.2.1 Probability calculation of the top event ……………………..40
Chapter 5 Conclusion ……………………………………….42
References………………………………………………43
Acknowledgement………………………………………….44
Attachments
Chapter 1 Preface
Purpose and scope of thesis
Purpose
Focus of this thesis is the probability risk analysis of the engine control systems used in the civil aircrafts. This includes events like landing at the airport with less than final reserve fuel (FRF) and running out of all usable fuel. FRF can be explained as the quantity of fuel stated by regulations, thus an aircraft must have at least this amount remaining in its tanks at the end of its journey (when the plan lands). It is taken as a safety incident if there is less fuel in the aircraft than the amount specified by the regulations. The goal was to develop a mathematical model and simulation model with which it is possible to estimate the probabilities of these two events. The model was developed using dynamically coloured Petri nets. To estimate the probabilities, we used regular Monte Carlo simulation method and splitting method. Monte Carlo provided important insights, but was insufficient to provide results for rare events like fuel starvation. The splitting method is an adequate algorithm to speed up the simulations, especially when the size and complexity of the model makes the use of other methods, like importance sampling, infeasible.
Purpose of this project is to develop the first version of a risk assessment model within the context of fuel management. This model should serve as a basis for further research of this topic.
Scope
The scope of this study must be described along three dimensions. The first is that of the aviation processes that are the subject of the study. Is it the straightforward gate to gate processes of an aircraft, or are the subsidiary processes like design and certification, maintenance, etc. involved as well? If so, what are the boundaries of the subsidiary processes? The second dimension is that of the hierarchy of the organisation. Is only the operational level considered, or are higher managerial levels (procedures level, policy) and even those of the regulators also of interest? The third scoping dimension is that of the accident ‘processes’, including the causal factors. How far back in time must the causes of the event be traced? Are consequences of the accident also within the scope? For each scoping dimension we need to indicate whether the boundary in scoping is the result ofpractical or theoretical considerations. These scoping questions are basically part of the user needs and will be addressed in the associated chapter of this thesis.
Apart from the scoping of the causal modelling that will be determined by the user requirements, the scope of the thesis will have to be limited for practical reasons. The study focuses on commercial air transport. Leisure flights, military aviation and aerial work (e.g. crop dusting) are considered out of scope. In practice this limits the study to fixed wing aircraft as commercial air transport by helicopter and lighter-than-air vehicles is negligible in volume and number of flights compared to fixed wing aircraft. The situation in the Netherlands is taken as example to answer the research questions, with a focus on the safety issues related to the growth of Amsterdam Airport Schiphol. Risk for people on-board as well as on the ground (both inside and outside the airport perimeter) will be taken into consideration. Environmental impact effects are excluded.
The actors involved include the airlines, the airport and the air traffic control provider, but also the Ministry of Transport, the Ministry of Spatial Planning and the Environment, local municipalities and commissions and advisory groups such as the Dutch Expertgroup on Aviation Safety (DEGAS) and its predecessor the Safety Advisory Committee Schiphol (VACS) and the Commissie MER. Because of the general desire to harmonise regulation within Europe, because of the desire for a ‘level playing field’ in Europe, and because of the international character of aviation in general, the problem should also be addressed in a European context.
For pragmatic reasons the scope of the thesis will be limited to direct aircraft crash risk. Post-crash events, such as the development of post-traumatic stress disorders in people directly involved, are not considered. From a technical point of view it is perhaps perfectly feasible to extend a causal risk model to post-crash events, but such a model would require different subject matter expertise and is therefore considered to be outside the scope. Aircraft crash risks as a result of unlawful acts (terrorism, revengeful employees, unruly passengers), or military intervention (either on purpose or accidental) are considered out of scope because the information on associated causal influences is considered to be confidential and not suitable for general dissemination.
Primary (flying from A to B) as well as subsidiary processes (air traffic control, aircraft design and maintenance, etc) are relevant for flight safety. While each accident always involves the primary process, the causal chain of events for an accident sequence nearly always involves the subsidiary processes as well. Therefore a causal risk model must encompass the primary and the subsidiary processes. The model should encompass those subsidiary processes that are directly linked to the primary process. They include flight crew training, aircraft design, certification and maintenance, air traffic management and airport processes. A description of these processes is provided in Appendix B.
The primary and subsidiary processes are embedded in national and international policies and regulation. Control of the processes’ products, including safety, actually involves a socio technical system of several hierarchical levels. Rasmussen [1997] identifies the following 6 levels: Government, Regulator, Company, Management, Staff and Work. The scope of the causal risk model should encompass the primary and subsidiary processes across all hierarchical levels from government down to work.
Organization of the thesis
This dissertation shows how a realistic model can help system designers and programmers to understand the performance characteristics of the underlying communication system. The organization of this thesis is as follows.
Chapter 2 introduces our communication model in detail. We first describe the architectural model that our communication model is built on, as well as provide a breakdown view on how data flow through this architecture. Then we list out all the parameters of this communication model together with their associated cost formulae. The last section in Chapter 2 is focusing on reviewing other related models, and show how our work is distinguished from other works.
Chapter 3 provides a brief description on the Directed Point communication package [], which is used as our tool to validate the thesis statement. Then we measure two of the Ethernet-based implementations of Directed Point and perform a systematic analysis on their performance. Through our modeling framework, we easily spot out the strength and weakness of these systems.
In Chapter 4, we extend our performance studies from a point-to-point analysis to a highly congested communication pattern, the many-to-one collective operation. We focus on the congestion behavior of how the reliable transmission protocol performs under heavy congestive loss situation. The primary network architectural feature relevant to this study is the switch’s buffering architecture, which is one of the performance parameters of our communication model. We conduct both experimental and analytical studies on two different buffering architectures, and investigate on how these buffering mechanisms impact on the resulting performance.
Chapter 5 and 6 highlight another capability of our communication model – algorithm design and analysis. In these chapters, we are focusing on another communication pattern, the many-to-many complete exchange operation.
In Chapter 5, we discuss an efficient algorithm, the Synchronous Shuffle Exchange algorithm, for the complete exchange operation with our communication model. We make use of our model parameters to show that this algorithm is optimal on a theoretical non-blocking network. We also show that, in reality, the switch’s buffering architecture may hamper the performance of our optimal algorithm, due to the demanding nature of this algorithm.
In Chapter 6, we extend our study on the complete exchange operation to another realistic LAN topology, the Hierarchical network []. And we show that there are architectural limitations on this topology. Again, by using the resource information provided by our communication model, we have designed a proactive congestion control scheme to augment the original synchronous shuffle exchange algorithm to work efficiently on this network topology.
Chapter 7 gives a summary of this dissertation as well as discusses on directions for future work. Last but not the least, Appendix A contains the full description of all benchmark methodologies of our communication model.
Acronyms
AC – Advisory Circular
A/C – Aircraft
ARP – Aerospace Recommended Practice (SAE)
CCA – Common Cause Analysis
CMA – Common Mode Analysis
FAA – Federal Aviation Administration
FAR – Federal Aviation Regulation
FC – Failure Condition
FC&C – Failure Conditions and Classifications
FE – Failure Effects
FHA – Functional Hazard Assessment
FM – Failure Modes
FMEA – Failure Modes and Effects Analysis
FTA – Fault Tree Analysis
H/W – Hardware
JAA – Joint Aviation Authorities
JAR – Joint Aviation Requirements
MA – Markov Analysis
PRA – Particular Risks Analysis
PSSA – Preliminary System Safety Assessment
Chapter 2 Description of System safety assessment
A System Safety Assessment is a precise, thorough assessment of the executed framework to demonstrate that significant wellbeing prerequisites are met. The investigation procedure will be comparable to the exercises of the PSSA however extraordinary in degree. The distinction between a PSSA and a SSA is that a PSSA is a method to assess proposed models and determine framework/thing wellbeing prerequisites; while the SSA is a confirmation that the executed outline meets both the subjective and quantitative security prerequisites as characterized in the FHA and PSSA. The SSA coordinates the consequences of the different examinations to check the wellbeing of the general framework furthermore, to cover all the particular security contemplations recognized in the PSSA.
The SSA procedure documentation incorporates consequences of the applicable investigations and their substantiations as required.
2.1 Introduction to functional hazard assessment
The use of the FHA is to take into account the functions at the most suited level, to find failure conditions and the related classifications, at the same time considering the loss of functions as well as the malfunctions that occur. A good FHA should note the failure conditions that could occur in each phase of flight, where the effects of the failure and their classifications are different in each flight phase. Moreover, The FHA creates safety requirements that are derived, which is required to limit and control the function failure effects that have an effect on the classification of the failure conditions.
The above mentioned requirements might contain things such as design constraints, annunciation of failure conditions, maintenance action, etc. In addition, those requirements might contain single or multiple systems. Every one of the necessities identified with security must be traceable and approved at each level of inference. A decent approach to fulfill this is to make a table of inferred requirements in view of design choices. Once the abnormal state necessities have been distinguished, they might be utilized to create lower level requirements as a major aspect of the PSSA procedure for the frameworks or things. This procedure is proceeded, with emphasis, until the plan procedure is finished.
The FHA analysis method can be used to do analysis on all kinds of systems, equipment, and software. FHA analysis can be carried on a single subsystem or whole functional system or even systems made of integrated parts. Bases on the type of functions being analyzed the level or depth of analysis detail can be different. For an example, In case of analyzing functions of a high-level system, it will be essential to use a high-level hazard analysis. But, if the system being analyzed is the functions of a low-level (detailed design) subsystem, then it will create a much more detailed functional analysis.
There are two types of FHA, the Aircraft level FHA and the System level FHA. FHAs done at the above mentioned two levels utilize similar standards. Creation of the FHA at the most suited level is based on the general information and experience, also it might require advice from various specialists. The table given below (Table 2.1) is an example of the high level functions and the conditions of failure related to them which could be taken into account.
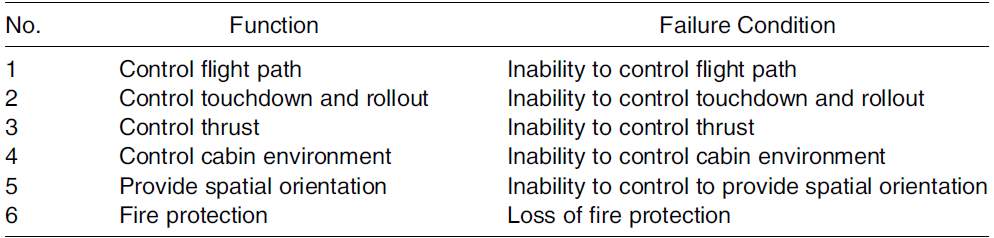
Table 2.1
These failure conditions can be further broken down through the use of FHAs and fault trees. The following are some examples.
- Inability to Control Flight Path – this can be broken down into;
- Loss of trim – further broken down into;
- Loss of manual trim
- Loss of fuel trim
- etc.
- Inadvertent trim
- Loss of all hydraulics
- Loss of flight control
- Flight Control Malfunction – further broken down into;
- Elevator Hard over
- Loss of trim – further broken down into;
At some point, the failure conditions related to safety ought to be defined together with their individual safety goals and the suggested methods for exhibiting compliance. In the case of aircraft level safety requirements, methods for exhibiting compliance ought to be given in the aircraft level FHA. As for the system level requirements, methods for exhibiting compliance should be demonstrated by using the PSSA.
To identify possible failure conditions of multiple systems we could make use of the aircraft level FHA. Above mentioned multiple failure conditions might have a higher failure condition classification than the expected values got on independent system analysis. It is better to setup an aircraft level general hazard list, so that it can be utilized during future projects. This will reduce the risk of known hazards being overlooked. If there is already such a list in existence, it ought to be used as a cross-check during the making of the aircraft level FHA.
2.1.1 Process of FHA
FHA process can be described as a qualitative as well as a quantitative analysis method. The FHA process can be utilized solely as a qualitative analysis method, also if required it can also be used as a quantitative one which can be used for individual component failure modes. During the FHA process a detailed point by point examination of the subsystems to figure out which parts can fail or malfunction creating a hazard and makes a resultant impact on the subsystem and its operation.
The FHA gives answers to a progression of inquiries:
- What components can face failure?
- How can those components fail?
- How often will they fail?
- What will be the consequences of those failures?
- What kinds of hazards are created due to those failures?
The making of an FHA is the initial step in a safety evaluation process that is made on new aircraft programs or ones that are modified. The FHA sets up the safety requirements for safety in the new design or the modified one. The FHA procedure follows a top down approach for finding the failure conditions of the functions and determining the effects in case of those situations. Below is the process through which this assessment is made.
- Finding all the functions related to the level which is being studied (internal functions and exchanged functions).
- Finding and giving explanation of the conditions of failure related to these functions, by taking into account single and multiple failures in normal and also in degraded environments.
- Determining the effects which the failure condition is going to have.
- Classifying those effects on the aircraft into different categories such as; catastrophic, severe-major/hazardous, major, minor and no-safety effect.
- Assigning requirements to the relevant failure conditions to be considered at the lower level
- Determining which supporting materials are needed to justify the above mentioned classification.
- Determining which method to be used to check for compliance with the requirements of the failure conditions.
2.1.1.1 Identification of the functions
While making the FHA all the functions related to the level which is under study ought to be determined. This includes both internal and exchanged functions. By getting the necessary source data and using the information to create the function list, we can easily identify these functions.
Getting the source data can be considered as the first step in performing the FHA process.
FHA inputs for the aircraft level are;
- List containing the top-level aircraft functions (example; lift, thrust, etc.).
- Objectives of the aircraft and the requirements of the customer (example; number of passengers, range, etc.).
- Initial design decisions (example; number of engines, conventional tail, etc.).
FHA inputs for the system level are;
- List containing the main functions to be considered.
- A functional diagram showing external interfaces.
- The list of functions created in the higher design level FHAs.
- The list of the failure conditions identified in the higher design level FHAs.
- The requirements defined in design requirements and objectives documents.
- The design options chosen at the upper level and their rationale.
Making a list of functions;
The first step while making a list of functions is to make a list of the expected functions and using it to compare with the inputs of source data, by doing this the lists of functions of FHA is created. The functions are allotted to hardware and software amid the aircraft or system level. It is essential to note down a list of any new functions that are presented due to this architectural design choice. This can be achieved by making a list of all the hardware and/or software functions that need to be considered, then it can be used to check if all these functions are already mentioned in the function list of either aircraft or system level. During this process, two types of functions are identified.
- Functions internal to the considered level (Internal Functions)
- At the aircraft level; these functions are the aircraft’s principle functions and also functions that are traded between the internal systems of the aircraft.
- At the system level; these are the considered system’s functions and also functions that are traded between the internal parts of the system.
- Functions external to the considered level (Exchanged Functions)
- At the aircraft level; the functions that interface with other aircrafts or with ground systems.
- At the system level; for any given system, these are functions which are either provided by other systems or provided to other systems (including other aircraft systems or with ground systems).
2.1.1.2 Identifying and describing failure conditions
The first step of this process is to create an environmental list and emergency configuration list. After that, the one who is doing the analysis have to consider all the parts listed in the internal function list as well as the list of exchanged functions, and also the list of the environmental and crisis/irregular configurations. After this is done, the analyst then have to create a list containing failure conditions for the aircraft/system. While making this list he has to take into account single failures and as well as multiple, which both should be considered in normal environments and abnormal environments. In order to get these failure conditions and the assumptions that we make while we consider them, the analyst must know the feasible failure modes. Those failure conditions have to be further divided into the phases an aircraft have to go thought during its flight, when the gravity of those condition fluctuates with changes in the flight phase of the aircraft.
Besides the functions list given in 2.1.1.1 , it is also essential to take into account the environmental conditions. Thus, the analyst should make such a list which needs to be taken into account when finding the failure effects. Some of the conditions of the environment that have to be considered are mentioned below;
- a. Weather
- b. electromagnetic radiation
- c. HIRF
- d. Volcanic Ash
Moreover, the analyst should make a list of the aircraft configurations occurring due to emergency/irregular situations. These also should be thought of while noting down the failure effects. Some of the emergency/irregular conditions include;
- a. Emergency landing on water (Ditching)
- b. Engine Out
- c. Loss of Communications
- d. Loss of pressure from pressurized compartments (Depressurization)
In the case of FHA of system level, the list if taken from the relevant list gotten from FHA of aircraft level or FHA(s) or the upper level. Moreover, the choices related architectural design that is decided while initial concept design phase is going on. Some of the emergency/irregular conditions that might be included in that list include the following:
- a. loss in the Hydraulic System
- b. loss in the Electrical System
- c. loss in the Equipment Cooling
Determining the failure conditions by taking into account single and multi-failures;
In order to make the single failure list, the analyst has to examine the actual list make in the previous steps. Moreover, the analyst has to do an analysis of the concept design made during the initial design process. Compares to the single failure list, making of the multiple failure list is much more complicated. One of the main reasons is that it demands the analyst to know clearly the assimilation of the system segments and also know how the system which is going to be analyzed interact and work together with other systems of the aircraft. As such, this process demands a rich knowledge of the aircraft and the aircraft system architecture. During the making of it, multiple failures need to be taken into account, more so when an effect of one failure depends on the availability of a different system or component.
Some common single failure conditions are listed below;
- a. Loss/stopping of a Function
- b. Un-declared Loss of a certain Function
- c. flaw/defect in the function
Some common multiple failure conditions are listed below;
- a. Having 3 hydraulic systems and losing two of them.
- b. failure in communication and also in the navigation system.
2.1.1.3 Finding the effects that are caused by failure conditions
The one who is doing the analysis must analyst must find the effects that are caused due to the failure conditions on the aircraft itself, the aircraft’s crew and it’s passengers who are using it. People who have rich experience in the operational field should be consulted while making the analysis to get their opinion and knowledge while classifying the failure condition effects into different groups. The analyst can attain this directly in FHA of aircraft level. On the other hand, for the FHA of the system level, the effect of the aircraft level might be similar to that of the system level. Alternatively the analyst might need to take the joined effects of different systems that have similar roles into account, so that the analyst can find how the system failure condition effects.
2.1.1.4 Finding the designation of the failure condition effects
By going through the incidental data, evaluating the materials of regulatory guidance, making use of the old design knowledge, as well as talking to the flight crews (if needed) , we can find the classification. The classifications are:
- Catastrophic
- Severe - Major/Hazardous,
- Major,
- Minor and
- No safety effect.
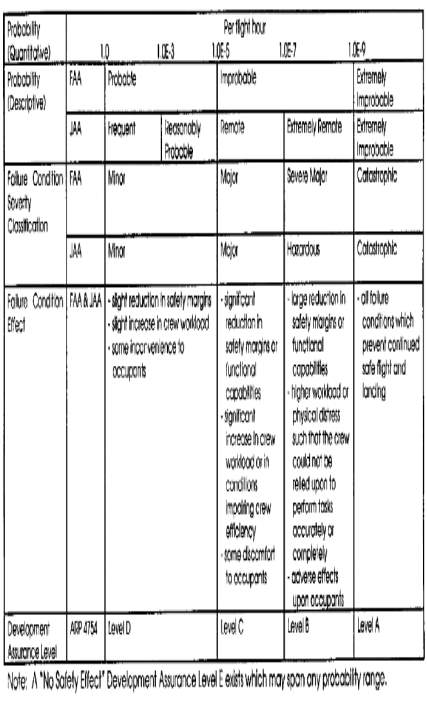
Table 2.1.1.4 Failure conditions severity
In order to ensure that it can be easily found if need in future, the papers containing aiding materials such as studies, tests etc, that were made use of while finding the classification of failure conditions and effects.
2.1.1.5 Task of Probability Requirements to Failure Conditions (this is for the Lower Level)
For every one of the conditions of failure, the person who is doing the analysis should allocate relevant probability requirements. In addition to which the analyst also should allocate relevant conditional design requirements. Such requirements are usually found in the requirements which are given in the specifications (aircraft , system as well as the requirements of the items).
2.1.1.6 Determination of the additional material required to prove the failure condition effect classification
In case there are some failure conditions which are difficult to perceive, more materials such as simulations, studies etc should be included which could be used to prove and define the selected
2.1.1.7 Determination of the method to be used to prove requirements of the failure conditions with compliance
For all of the failure conditions mentioned in the analysis, the person who is doing the analysis must find a way for the aircraft/system to fulfill the safety objective. The flowchart below gives information regarding defining of required safety objectives for their failure conditions.
Figure 2.1.1.7 Assessment of safety objectives
2.1.1.8 Making use of past experience
At the time where the production of list of conditions of failure and it’s classifications have been done, in order to avoid some less occurring failures from being omitted it is best to check the current list with past lists. In addition, it would also be beneficial to create and maintain generic list for the purpose of checking, so that it can be used for the reviewing process of the FHA.
2.1.2 Output of the FHA
2.1.2.1 Documentation
The findings of the FHA analysis by the analytic should be recorded in documentation, so that it can be easily referred to incase of any need. Given below are the information that should be included in the documentation made at the end of FHA analysis.
- Function list of the FHA input
- Environmental and Emergency Configuration List
- Derived safety requirements for the design at each level
- The FHA Report. It should include;
- Description of the Function
- Failure Conditions
- Phase of Operations
- Effect of the Failure Condition on the Aircraft, Crew and Occupants
- Classification of the Failure Condition
- Reference to ]’Supporting Material
- Verification Method (for the design solution chosen to meet the safety objective)
2.1.3 Things to keep in mind while making FHA (to avoid mistakes)
At the point when initially figuring out how to make a FHA, it is normal to make some common mistakes. Given below is a list of typical mistakes made amid the making of a FHA.
- All the functions of the system is not assessed and written in the document.
- The risk depiction is inadequate, uncertain, or excessively definite.
- Typical factors elements are not satisfactorily distinguished or examined.
- The danger alleviation method is deficient for peril hazard.
- The hazard is shut rashly or mistakenly.
- Modes such as maintenance, training, and testing are overlooked.
2.1.1.4 Summary of FHA
Here is a small summary of the basic principles of FHA;
- FHA is a qualitative analysis tool for the evaluation of system functions.
- The main function of making a FHA is to distinguish functions that can prompt the occurrence of an undesired situation or risk.
- FHA is very important to analyze software.
- A block diagram can make an FHA process easier to understand.
2.2 Introduction to Fault Tree Analysis
2.2.1 Introduction
A Fault Tree Analysis (FTA) is a deductive failure analysis which concentrates on one specific undesired event and gives a method to deciding reasons for this event. As such, a Fault Tree Analysis can be said is a “top down” system assessment technique in which a qualitative model for a specific unwanted event is shaped and afterward it is assessed. The examiner starts with an undesired top level dangerous event and deliberately decides all correct single faults and failure mixes of the function of the system blocks at proceeding lower level which may precipitate this event. The analyst continues down through progressively more detailed (i.e., lower) levels of the outline. This continues till a Primary Event is revealed or till the top level risk event prerequisite has been fulfilled. A Primary Event is characterized as an occasion which for some reason has not been additionally developed (i.e., it is an event that does not need to be separated down to a better level of detail, so that it can be more easily demonstrated that the system under investigation consents to relevant safety requirements). An internal or even an external event to the system which is under study might cause a primary event, and can be credited to the equipment failures or programming blunders.
The one who is doing the analysis is urged to suspend the FTA analysis when adequate detail to fulfill the top level peril prerequisite has been found.
The fault tree graphical portrayal is based on hierarchy and is names after the numerous branches it creates. Due to this layout, it makes this analysis a perceivable tool for the people from both designing and the certification authorities. Being one of the methods of safety assessment methods for guaranteeing that the equipment or the system will finish its expected security capacities, fault tree ensures identifying and controlling the design safety aspects.
FTA is a model that consistently and graphically shows the different possible mixes (scenarios) of conceivable events, weather it is a failure or a typical event happening in a system, which prompt a hazard event or a hazardous condition. It can be considered as a deductive analysis as it moves from the general issue to the particular causes behind that issue. During the FTA analysis procedure, the logical fault paths are buildup by making use of one hazard event at the top, then it goes to the all conceivable root causes that could be behind it at the bottom. This method gives FTA some of its advantages such as being easy to perform, to understand, it also gives insights to useful system information, and it gives a view of all plausible causes for the hazard which is being investigated.
Fault trees are graphical models that make use of logic gates and hazard events to create a model of the causes of the hazard event and show their relationship. The graphical model made during FTA can be converted into a mathematical model to calculate the probability of the failures occurring and system important measures. The development of a FTA can be described as an iterative procedure, in which initial structure of the model will be gradually updated to keep up with the developments in the design
In case of analysis of systems there are two uses of FTA. The mainly utilized application is the proactive FTA. It is carried out during the development of the system in order to effect the design by anticipating and preventing problems that could occur in the future. The second application is the reactive FTA, which is carried out when a hazard or mishap has already occurred. These two types of application is similar in the techniques used, except that the reactive FTA contains additional use of mishap evidence and the evidence event gate which is not there in case of proactive FTA.
At the point where it is used as a tool to analyze the system safety, the results of the FTA analysis gives a graphic and logical representation, which clearly shows the various combinations of conceivable events. Which includes both failures and normal events that are happening in a system that can lead to a predefined undesired event. An undesired or hazard event can be defined as any event which has been noted as a questionable and undesirable. A potential accident or hazardous events are both examples of such an event. The graphic representation of the events shed light to the often complex interrelationships of system events, and clearly showcases the interdependence between such events, which is the root cause of the occurrence of those undesired event.
The finished FTA can be made use of in determining the importance of fault events and the probability of its occurrence. It is possible to make sure to increase the chances of the valid actions being taken to eliminate or control the fault events. This can be enhanced in specific conditions by quantifying the FTA and making a numerical evaluation. This process of quantification and numerical evaluation creates three general generates three basic estimations for decision making in relation to the risk acceptability and also the essential preventive measures:
- The undesired event’s occurrence probability.
- How significant and what are the probability of hazard events bringing about the undesired event
- The amount of risk significance of the parts or how important components are
A qualitative evaluation of the fault free will yield effective results at a reduced cost in the majority of the times. More attention is required when determining whether to carry out a qualitative or a quantitative FTA. For high yields of useful results quantitative approach is more suited. However, it demands more time and have to be carried out by experienced personnel. In addition, the quantitative approach also needs the collection data regarding the component failure, so that it can be used as for input to the FTA.
FTA can be utilized during communicating and supporting decision making to expend resources to moderate the hazard levels, as a FTA results in graphic as well as logical representation of the origins or system faults which leads to the hazard events. Thus, it gives the needed proof in a simple and easily understandable format to give support to the arrangements of risk acceptability and the requirements of the needed preventive measure.
It is possible to use the FT process during any of the lifecycle phases of a system—from the idea of the concept to usage. However, it should be noted that for best results, FTA analysis should be carried out as soon as possible during the design process. This will reduce the costs as, since the earlier the changes are made the less modifications need to be done which also mean it will cost less.
In FTA we can analyze only those system elements that have a contribution to the happening of the undesired events. This is an important time and cost saving feature of the FT technique. While doing the analysis, elements that do not have any contribution to the undesired events are ruled out. As a result, they are not included in the analysis. This allows most of the work to be allocated for the elimination or control of the origin or origins of the area of problem. But, even though some elements might not be involved in the checked occurrence, they might be responsible for the occurrence of another undesired event.
To conclude, the FT is utilized to check the system of doubt, in a methodical and concise manner, so that the relationships and the causes of the hazard event can be found and depicted graphically. A quantitative assessment might be carried out along with to a qualitative evaluation, so that an idea of the probability of the occurrence of the top-level event along with the major faults behind the top-level event can be found. An analyst might make use of the findings of a FTA as given below:
- Authentication of design compliance with regard to the set values of safety requirements.
- Finding the safety deficiencies (weather it is subtle or obvious) in the design that have developed regardless of the existing requirements.
- For the purpose of finding usual mode failures.
- Formulation of preventive measures for the purpose of elimination or reduction of identified safety deficiencies in the design.
- Appraisal of the set preventive measures to check if they are adequate.
- Setting or modifying of the safety requirements which are reasonable for the next design phase.
2.2.2 Background
This investigation method falls under the framework configuration danger examination sort (SD-HAT). Allude to Chapter 3 for a depiction of the investigation sorts. The FTA method has been alluded to as rationale tree examination and rationale graph investigation. Fault tree examination has a few essential purposes, which incorporate the accompanying:
- Discover the underlying drivers of a danger or undesired event amid outline advancement all together that they can be wiped out or alleviated.
- Set up the main drivers of an incident that has happened and prevent them from repeating.
- Distinguish the undesired event causal component mixes and their relative likelihood.
- Decide high-hazard fault ways and their instruments.
- Distinguish chance significance measures for segments and fault events.
- Bolster a probabilistic hazard appraisal (PRA) of framework outlines.
The FTA strategy can be utilized to model a whole framework, with investigation scope given to subsystems, congregations, parts, programming, methodology, condition, and human blunder. FTA can be led at various reflection levels, for example, theoretical outline, best level plan, and nifty gritty segment plan. FTA has been effectively connected to an extensive variety of frameworks, for example, rockets, ships, space-create, trains, atomic power plants, flying machine, torpedoes, restorative gear, and substance plants. The procedure can be connected to a framework ahead of schedule in outline advancement and in this manner distinguish security issues right on time in the plan procedure. Early application assists framework engineers with designing in security of a framework amid early advancement as opposed to taking remedial activity after a test disappointment or a setback.
A fundamental comprehension of FTA hypothesis is basic to creating FTs of little and noncomplex frameworks. Moreover it is essential for the examiner to have a point by point under-remaining of the framework paying little mind to many-sided quality. As framework multifaceted nature increments, expanded learning and involvement in FTA is additionally required. By and large, FTA is anything but difficult to learn and get it. Appropriate application relies on upon the multifaceted nature of the framework and the ability of the investigator.
Applying FTA to the investigation of a framework configuration is not a troublesome procedure. It is more troublesome than an investigation strategy, for example, a PHA, fundamentally in light of the fact that it requires a consistent manner of thinking, a comprehension of FTA development methodology, and a definite information of framework plan and operation. FTA does not require information of abnormal state science contrasted with Markov or Petri net investigations.
The FTA method appreciates a good notoriety among framework wellbeing examiners in all ventures using the procedure. In a few businesses it is the main apparatus that can give the important likelihood estimations to confirmation that numerical necessities are being met. Numerous business PC projects are accessible to help the investigator in building, altering, and mathematically assessing FTs.
A few experts censure the FTA device since it doesn’t generally give probabilities to six-decimal-put precision when modeling certain outlines. In any case, comparison of FT model outcomes to those of different apparatuses, for example, Markov examination (MA) demonstrate that FTA gives exceptionally practically identical outcomes considerably more prominent straightforwardness in modeling trouble. Moreover, six-digit exactness is at some point futile when the information is not exact.
Despite the fact that FTA is named a peril examination, it is basically utilized as a main driver investigation device to distinguish and assess the causal variables of a risk. Moreover, it can give a likelihood hazard evaluation.
Markov investigation could be used set up of FTA for likelihood figuring’s; in any case, MA has impediments that FTA does not (allude to Chapter 18). For instance, it is hard to model vast complex frameworks, the arithmetic are more cumber-a few, it is hard to envision fault ways in a MA model, and a MA model does not deliver cut sets.
2.2.3 Theory behind FTA
Fault tree examination is a hearty, thorough, and organized methodology requiring the utilization of specific standards of Boolean polynomial math, rationale, and likelihood hypothesis. The FTA itself, can be described as a rationale chart of the considerable number of events (disappointment modes, human mistake, and typical conditions) that can make the top undesired event happen.
At the point when the FTA is finished, it is assessed to decide the basic cut sets (CSs) and likelihood of disappointment. The cut sets are the blend of disappointment events that can make the top happen. The FT assessment gives the vital data to sup-port hazard administration choices.
The hypothesis behind FTA is to begin with a top undesired event (UE) (e.g., danger) and model the greater part of the framework faults that can add to this top event. The FT model is an impression of the framework outline, from a disappointment state perspective. In this case the UE may be “incidental warhead start because of framework faults.”
The FTA is produced in layers, levels, and branches utilizing a dull examination prepare. FTA created in layers, with each real layer speaking to noteworthy parts of the framework. For instance, the top FT structure typically models the framework capacities and stages, the middle FT structure models subsystem fault streams, and the base FT structure models gathering and segment fault streams.
2.2.4 Methodology
There are eight essential strides in the FTA procedure, as appeared in Figure 2.2.1. These are the means required to play out a total and exact FTA. A few experts may join or extend a portion of the means, however these are the essential strategies that must be taken after.
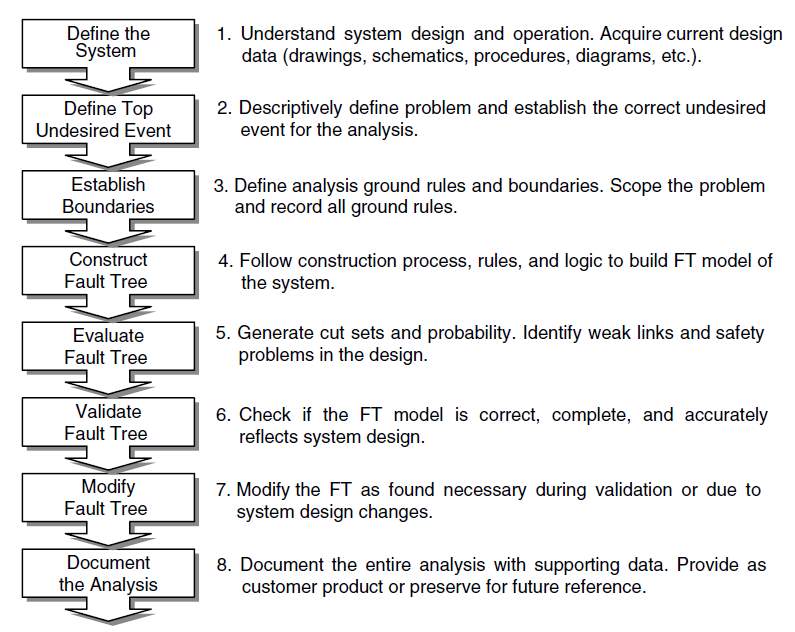
Figure 2.2.1 FTA process
Building Blocks
Fault trees comprises of hubs interlinked together in a treelike structure. The hubs speak to fault/disappointment ways and are connected together by Boolean rationale and images. The FT images shape the fundamental building squares of FTA and comprise of four classifications:
- Fundamental events
- Gate events
- Restrictive events
- Exchange events
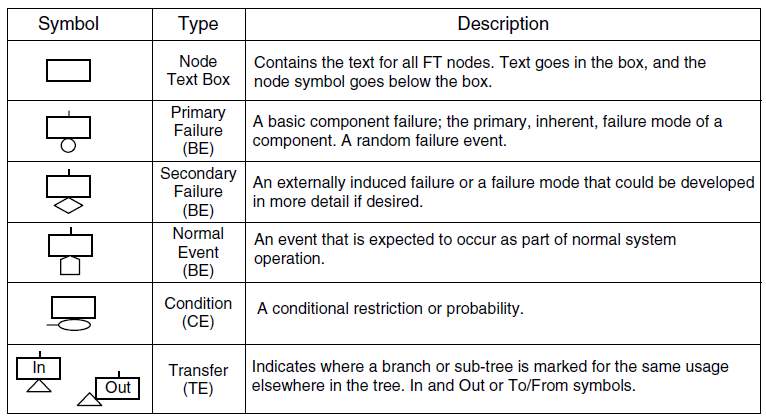
Figure 2.2.2 FTA symbols
Figure 2.2.2 demonstrates the standard images for fundamental event (BE), condition event (CE), and exchange event (TE) as they would show up on a FT and their related definitions. Take note of that the rectangle is simply a placeholder for content. At the point when FTA was first built up, the content was set specifically in the BE images and the rectangle was utilized for entryway hubs, yet with the appearance of PC representation this ended up noticeably bulky, so the rectangle was received for all hubs.
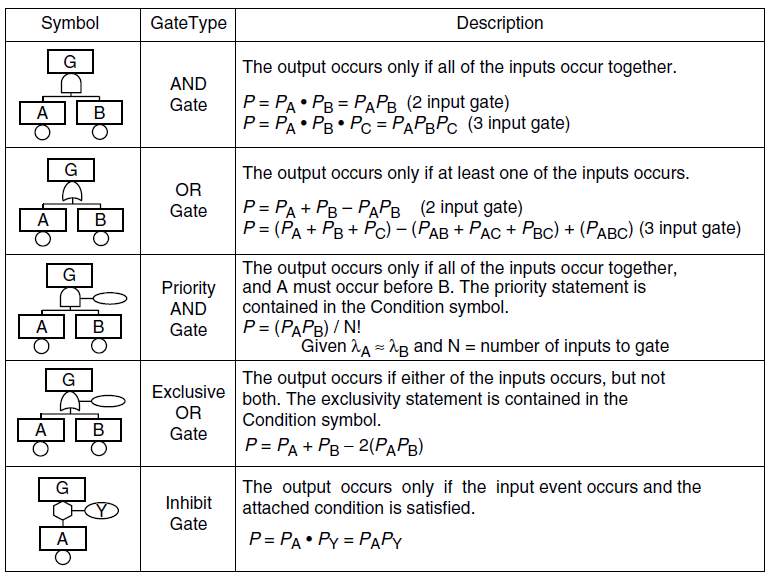
Figure 2.2.3 FTA symbols for gate events
Figure 2.2.3 demonstrates the entryway event images, definitions, and likelihood estimation recipes. It is through the entryways that the FT rationale is built and the tree develops in width and profundity. The images appeared in Figures 11.4 and 11.5 are for the most part considered the standard FT images, in any case, some FT programming programs do use somewhat unique images.
All fault trees are made out of two sorts of images, rationale and event. The general run with respect to images is, keep it basic; the less the diverse image sorts utilized the less demanding it will be for a man exploring the fault tree to comprehend it. Rationale images are utilized to entwine the different branches of the fault tree. Rationale images ought not be specifically associated together in the fault tree, their sources of info and yields ought to dependably be events.
The two fundamental rationale images utilized are the Boolean rationale AND-entryways as well as doors. The expert chooses an AND-entryway when the undesired top level event can just happen when all the following lower conditions are valid. The OR – entryway is utilized when the undesired event can happen if any at least one of the following lower conditions are valid. The expert may likewise utilize other Boolean rationale entryways if the framework engineering warrants the utilization of these door sorts.
Event images most usually utilized incorporate a rectangle, triangle, oval, circle, house, and precious stone (see Figure D2). A rectangle contains the portrayal of a rationale image yield or an event. A triangle demonstrates an exchange of data and is made out of two sorts. A triangle with a vertical line from its top speaks to a fault tree area (events and their relating likelihood of event) which is “moved in”. A triangle with a level line from its side shows that the event the triangle is fixing to is “exchanged out” to another branch of the tree. The oval speaks to a Conditional Event which characterizes an essential condition for a disappointment mode to happen (typically utilized as a part of conjunction with PRIORITY and INHIBIT entryways). For instance, “screen flops first” is a Conditional Event since it is important before degenerate information can be proliferated through the framework undetected.
The circle, house, and precious stone all speak to sorts of Primary Events. A circle implies a Basic Event. A Basic Event is characterized as an event which is inward to the framework under investigation, requires no further improvement (i.e., has the ability of making a fault happen), and for equipment components just, can be relegated a disappointment rate spending plan or a genuine disappointment rate from a FMES or other source essential for quantitative assessment.
Chapter 3 FHA of Engine Control System
As it has already been mentioned in the scope of this thesis, this section has been completed by using the Gulfstream GV-SP aircraft as a model. The Full Authority Digital Engine Control (FADEC) system which is used of the Gulfstream GV-SP aircraft provides all the required engine control functions. In addition it also facilitates the interface between the engines and the aircraft sub-systems.
3.1 The determination of functions of engine control system
The determination of the functions of the engine control system of the aircraft is the first step in making the FHA table which in turn is required for the FTA process.
3.1.1 Engine Start
Electronic Engine Controller(ECC) which is the controlling unit of the FADEC system controls the starting of the engine, so that it can optimize the engine starting capabilities for the given aircraft conditions. The methodology behind it is that, it receives start and ignition system switch positions from the flight deck and airframe input conditions (altitude, airspeed etc.) from the Modular Avionics Units (MAU’s). This information is utilized by the ECC in order to determine the type of start to be carried out. The possible types of start include; starter assisted ground starts, starter assisted in-flight starts, windmill starts, dry cranks and wet cranks.
3.1.2 Ignition Control
Ignition is required during the start of the engine, when flying in inclement weather conditions or the flight crew selects continuous ignition. The igniters will also be commanded on by the DADEC’s during the auto-relight function after an engine flameout has been detected.
3.1.3 Engine information to airframe
Every EEC channel transmits ARINC 429 information to the airframe from two transmitters, which are associated with the MAU’s. The ARINC 429 transmitters are disengaged yet transmit similar information.
The EICAS framework creates the essential and optional motor show, which demonstrates the accompanying motor parameters transmitted from the EEC direct in charge: EPR, TGT, fuel flow, engine oil pressure, engine oil temperature, N1 (low speed shaft) speed, N2 (high speed shaft) speed.
3.1.4 Thrust management
The EEC has two control modes; the primary is EPR control where the EEC controls to an EPR command; the secondary is alternate N1 control (EPR not available or N1 control manually selected) where the FADEC controls to an N1 speed. The FADEC system require the following aircraft inputs to calculate the required thrust for the given aircraft conditions;
- Air Data. Each EEC receives ARINC 429 data from the MAU’s as outlined in block diagram sheet 20. The MAU’s derive their parameters from independent Air Data Modules (ADMs) which process the combined Pivot / Static probes pressure inputs. The Total Air Temperature (TAT) probes are processed by the MAUs directly. The EEC performs an air data selection and validation (including comparison with engine measured static air pressure) to derive valid air data parameters.
- Throttle Position. Each EEC receives the throttle lever angle input from a dual RVDT, which provides independent position to each channel via a six-wire configuration. The primary coil of the RVDT is excited by the EEC, which induces signals into the secondary coils. The EEC then derives throttle lever position from the secondary returns. Details of the EEC to Throttle Quadrant interfaces are shown on block diagram Figure 5-1, SHT 27.
- Throttle Trim. When engine synchronization is selected, each EEC receives trim data from the MAUs via ARINC 429 airframe input buses. The MAUs will try to match N1 or N2 (flight crew selected) by sending out a throttle trim signal. The FADEC will sum the measured throttle position with the throttle trim to derive the “actual” throttle position.
- Aircraft Systems Status. Each EEC channel receives aircraft system status information from the MAUs over the ARINC429 data buses. EEC channel A is connected via a dedicated data bus, channel B FADEC’s is connected by a general data bus. The status information includes engine bleed off-take requirements (ECS and Anti-ice), pilot selected Alternate Control Mode and WOW status.
The EEC uses the air data parameters and bleed, requirements to calculate EPR max and an EPR idle reference value and linearly interpolates between these two EPRs to derive EPR Command. In alternate control mode, also known as N1 reversion, the FADEC will calculate the N1 reversion command as a function of throttle lever position and altitude.
The basic idle control limiters are minimum limiters to maintain P30, N1 or N2 as necessary, it is normal operation to be controlling to one of these limits at idle. Maximum limiters are also included to prevent engine from exceeding N1 or N2 shaft speeds, P30 and fuel flow
3.1.5 Fuel Control
The EEC controls to the figured EPR or N1 charge by situating of the Fuel Metering Valve (FMV) utilizing a double (one for every channel) torque-motor to control the fuel stream.
The fuel supply is controlled by the HPSOV, which has one open loop and three close curls. The HPSOV position is controlled by the FUEL SHUTOFF switch in the flight-deck. The fuel control switch has a positive bolt and requires a different and particular operation to put the control in the shutoff position. At the point when the change is chosen to RUN the HPSOV will open and can be shut by either the turn being chosen OFF or both of the Independent Over-speed Protection (IOP) curls being stimulated. At the point when the FUEL SHUTOFF turn is chosen OFF, every EEC channel likewise gets a discrete information, which causes the FADEC to drive the FMV to the base stop and to do an EEC reset.
3.1.6 Over-speed protection
Every EEC channel contains an Independent Over-speed Protection (lOP) unit, which screens N1 and N2 shaft speeds for over-speed assurance. The lOP will consequently stop fuel in the event of N1 and N2 achieving the overs-peed trigger. N1 (LP) and N2 (HP) speed test information sources are accessible from three sources, one devoted test for every channel and one shared test. Points of interest are appeared in square chart Figure 5-1, SHT 29.
On the off chance that the lOP channel identifies an over-speed it will vote to close the HPSOV. For an over-speed shutdown to happen both equipment (lOP) circuits or one equipment circuit and it’s related programming (FADEC) circuit might identify the overs-peed. At the point when this happens the lOP channel will stimulate its HPSOV close curl to shutoff the fuel. The HPSOV close curl remains stimulated until the FUEL SHUTOFF switch in the flight-deck is chosen to OFF.
3.1.7 Thrust reverser
The EEC controls the Thrust Reverser framework to guarantee safe operation and control of motor power backward push.
3.1.8 Heat management
The FADEC is in charge of keeping up Fuel Temperature in the wing fuel tanks to prevent hardening of the fuel. The FADEC autonomously completes this capacity by control of a Fuel Return to Tank Valve, which controls the stream spill fuel to the tanks.
3.1.9 Auto-throttle and synchronization
The Auto-throttle and motor synchronization capacities are done by the MAUs and are autonomous of the FADEC’s. The EEC transmits motor information to the MAU, which ascertain a required EPR. The MAU orders the throttle to the required position utilizing shut circle control through an ARINC 429 interface to the Throttle Quadrant. The FADEC framework utilizes measured throttle position in the ordinary approach to figure the motor push prerequisite.
3.2 The determination of failure condition of each function
The safety practitioner must evaluate each function documented in the FHA worksheet for the impact of functional failure. This evaluation must consider all of the life-cycle phases, activities, and states/modes applicable to the system under assessment and a given functional failure’s potential impact in each phase, activity, and state/mode combination. For example, the execution of maintenance functions during a tactical state/mode may introduce hazards that do not apply to the execution of maintenance functions with the system in an off state.
The safety practitioner must consider the following functional failure types for each function under analysis:
- Fails to operate: Function does not happen/perform when given the appropriate input.
- Operates early/late: Function performs earlier or later than it should have; if too late, function could be out of sequence.
- Operates out of sequence: Function occurs before or after the wrong function; function occurs without receiving the appropriate inputs.
- Unable to stop operation: Function continues even though the thread should move on to the next function.
- Degraded function or malfunction: Function does not finish or only partially completes; function generates improper output
System safety practitioners who have been assessing hazards for a well-defined system may be initially uncomfortable with assessing at the functional level. The results will have much less detail compared to a subsystem hazard analysis or deficiency report safety analysis. However, the results will be useful to both the program office and the system safety program as a tool to identify and minimize safety risk early, lowering total costs.
The FHA worksheet provides the safety practitioner with a tool to ensure complete coverage of the system functions and full evaluation of functional failures. This process recommends expanding the worksheet rows by entering each function as its own row, and then expanding even further by allocating each functional failure type to each function under assessment. When completing a worksheet row, multiple hazards may be associated with a given functional failure; also, multiple mishaps and effects may be associated with a given hazard. Splitting a row in to multiple entries will be driven by the difference in mitigations that can be applied to risk reduction of a particular hazard, and may not be obvious during this step of the analysis.
Also during this step, hazards associated with the functional failure must be characterized in accordance with the applicable hazard tracking database fields, which should be documented in the program’s System Safety Program Plan. This involves documenting the hazard description of the functional failure, the mishap associated with the identified hazard, and the effect(s) that result from the occurrence of the mishap.
Those functions that have been assessed as having a functional failure which constitutes a hazard are defined as SSFs of the system. Note: participating in functional definition (see Step 2) allows the safety program to define the SSFs in accordance with the system documentation as developed by SE. This allows the safety program to maintain common language with SE, but also allows for the identification and documentation of SSFs within SE artifacts. Establishing and maintaining common language between SE and system safety engineering is an important benefit of the FHA.
3.3 The failure effect and probability of each failure condition
The analyst has completely described the utilitarian disappointments of the framework, including the hazard(s), mishap(s), and subsystem(s) related with those disappointments. Describing risks right on time in the framework configuration handle enables the security professional to prescribe framework configuration changes to take out or control the perils recognized so far.
For each distinguished peril, the wellbeing specialist must recognize the current and suggested prerequisites or potentially outline limitations to survey, lessen, and additionally dispose of the incident hazard related with the given risk. These prerequisites and imperatives might be as fault resistance, location, separation, annunciation, or recuperation. With a specific end goal to completely archive the current alleviations recognized amid this investigation, the wellbeing expert must report them in the “Current Mitigations” field of the proper risk push in the FHA worksheet; the security specialist must record the prescribed alleviations in the “Suggested Mitigations” field of the fitting danger push in the FHA worksheet.
The ID of suggested necessities and outline imperatives enables the wellbeing specialist to survey the expected effect of those prerequisites and plan requirements on the accident danger of the framework perils.
3.4 FHA table
The data containing the functions of the engine and their failure conditions were utilized to make the following FHA table.
| System: Engine Controls System | I Functional Hazard Assessment | Project: GV-SP | ||||||||||||||||||||||||||||
| Risk Category – Hardware 1 – Catastrophic 2 – Hazardous 3 – Major 4 – Minor | Risk Category – Software A – | Catastrophic B – Hazardous C – Major | D- | |||||||||||||||||||||||||||
| Minor | E – No effect | |||||||||||||||||||||||||||||
| FHA | Function | Hazard | Phase | Effect on Aircraft or | Risk Category | Functional | Verification | |||||||||||||||||||||||
| Tracking | Relations/Remarks | |||||||||||||||||||||||||||||
| No. | ||||||||||||||||||||||||||||||
| Personnel | H’ware | I S’ware | ||||||||||||||||||||||||||||
| 7320A | Provide engine | Failure to provide | ..’ . | . | .. | . | ‘ . | |||||||||||||||||||||||
| control | engine control | .: | . | . | … ‘ | . | ||||||||||||||||||||||||
| a) Loss of throttle | Landing | NC: The FADEC will maintain last thrust | 3 | C | 24 Electrical | 1) No system I | ||||||||||||||||||||||||
| signal to the | Approach | signal received from the throttle quadrant. | equipment changes | |||||||||||||||||||||||||||
| FADEC EEC for | Flight crew will have to use spoilers and | between the GV and | ||||||||||||||||||||||||||||
| the left and right | brakes to slow the aircraft down. High | the GV-SP. See GV- | ||||||||||||||||||||||||||||
| engine | residual thrust from both engines. One | GER-1489 | ||||||||||||||||||||||||||||
| engine could be shut down. | ||||||||||||||||||||||||||||||
| Crew: This results in a significant increase | ||||||||||||||||||||||||||||||
| in crew workload. | ||||||||||||||||||||||||||||||
| b) Loss of throttle | Landing | NC: The FADEC will maintain last thrust | 4 | D | 24 Electrical | 1) No Fault Trees | ||||||||||||||||||||||||
| signal to the | Approach | signal received from the throttle quadrant. | developed as this is | |||||||||||||||||||||||||||
| FADEC EEC for | Flight crew will have to use spoilers and | considered a minor | ||||||||||||||||||||||||||||
| the left or right | brakes to slow the aircraft down. High | event. | ||||||||||||||||||||||||||||
| engine | residual thrust from engine. This engine | 2) Fault Tree analysis | ||||||||||||||||||||||||||||
| could be shut down. | has not been | |||||||||||||||||||||||||||||
| conducted but was | ||||||||||||||||||||||||||||||
| Crew: This results in a slight increase in | validated using FMEA | |||||||||||||||||||||||||||||
| crew workload. | data | |||||||||||||||||||||||||||||
| 73206 | Provide control | Failure to provide | . | ‘.. | . | |||||||||||||||||||||||||
| & stability to | control & stability to | . . | . | . | ||||||||||||||||||||||||||
| produce thrust | produce thrust | . | . | . | . | ‘. | . . | . | ||||||||||||||||||||||
| a) Loss of engine | Landing | NC: The FADEC will maintain last thrust | 4 | D | 24 Electrical | 1) No Fault Trees | ||||||||||||||||||||||||
| control of the left or | Approach | Signal received from the throttle quadrant. | developed as this is | |||||||||||||||||||||||||||
| right engine | Flight crew will have to use spoilers and | considered a minor | ||||||||||||||||||||||||||||
| brakes to slow the aircraft down. One thrust | event. | |||||||||||||||||||||||||||||
| reverser available. High residual thrust from | 2) Fault Tree analysis | |||||||||||||||||||||||||||||
| one engine. This engine could be shut | has not been | |||||||||||||||||||||||||||||
| down. | conducted but was | |||||||||||||||||||||||||||||
| validated using FMEA | ||||||||||||||||||||||||||||||
| Crew: This results in a slight increase in | data | |||||||||||||||||||||||||||||
| crew workload. | ||||||||||||||||||||||||||||||
Chapter 4 the FTA of Engine Control System
4.1 The Fault Tree of typical Engine Control System
The table 4.1 below shows the typical hazardously misleading parameters for both engines as a top level event.
| Event ID | Function Failure |
| 1 | Right Hazardously Misleading P50 Probe Failure |
| 2 | Right Hazardously Misleading P30 Probe Failure |
| 3 | Left Hazardously Misleading P50 Probe Failure· |
| 4 | Left Hazardously Misleading P30 Probe Failure |
| 5 | Right Hazardously Misleading Oil Temperature Transducer Failure |
| 6 | Left Hazardously Misleading Oil Temperature Transducer Failure |
| 7 | Right Hazardously Misleading N2 Compressor Shaft Speed Probe Failure |
| 8 | Left Hazardously Misleading N2 Compressor Shaft Speed Probe Failure |
| 9 | Left EEC Failure |
| 10 | Right EEC Failure |
| 11 | Left Hazardously Misleading Thermocouple and Harness Failure |
| 12 | Right Hazardously Misleading Thermocouple and Harness Failure |
| 13 | Right Hazardously Misleading N1 Compressor Shaft Speed Probe Failure |
| 14 | Left Hazardously Misleading N1 Compressor Shaft Speed Probe Failure |
| 15 | MAU #1 Dual Generic 110 causes erroneous engine parameters to be displayed. |
| 16 | MAU #2 Dual Generic 110 causes erroneous engine parameters to be displayed. |
Table 4.1
4.2 The analysis based on fault tree
The calculations for the following parts have been done using the data obtained from the table 4.1
4.2.1 Cut Set Determination of top event
Cut sets (CS) are one of the key items from FTA. They recognize the segment disappointments as well as event blends that can make the top UE happen. CSs likewise give one component to likelihood counts. Basically, CSs uncover the basic and frail connections in a framework configuration by distinguishing security issue segments, high likelihood CS, and where planned wellbeing or repetition highlights have been avoided.
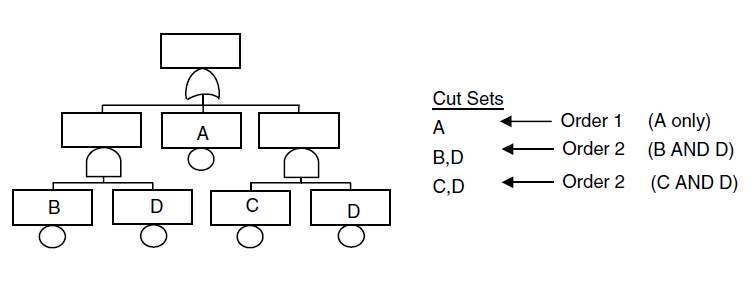
Figure 4.1
Figure 4.1 demonstrates a case FT with its subsequent CSs recorded on the privilege. Per the meaning of a CS, each of these CSs can make the top UE happen. CSs are gen-erated through the tenets of Boolean polynomial math, and a wide range of algorithms exist for creating CSs.
As a rule, the accompanying perceptions with respect to CS tend to remain constant:
A low-arrange CS demonstrates high wellbeing weakness. A solitary request CS (i.e., a solitary point disappointment) tends to bring about the most serious hazard.
A high-arrange CS demonstrates low security weakness. A high-arrange CS (e.g., a five-information AND entryway) has a tendency to have a relatively little likelihood and in this manner displays less framework hazard.
For an expansive aggregate number of CS the examiner needs to assess the aggregate hazard on the top UE. This is on account of the majority of the CS included may achieve an unsuitable esteem.
4.2.2 Probability Calculation of top event
The top FT (fault tree) likelihood is a general term for the likelihood ascertained for the top undesired event. The top event likelihood is computed from the FT utilizing the probabilities that are contribution for the fundamental events, as far as a disappointment rate and introduction time or a straight likelihood. Contingent upon the particular top event definition, the top event likelihood can be the likelihood of the top event happening amid a mission, the likelihood of the top event happening in a given timeframe, an immaculate probability number for the top event, or the top event inaccessibility.
An entryway likelihood is in some cases called a middle of the road event likelihood since it is figured for a transitional event underneath the FT best event. The entryway demonstrations like a top event for the branch of FT underneath it. Examination of middle of the road entryway event probabilities is at times valuable amid FTA. Whatever method is utilized to figure entryway probabilities (beat down or base up), if MOEs are not accurately mathematically represented (i.e., settled) the last outcomes can be wrong.
There are a few unique methods to process the top FT likelihood. The most widely recognized methodologies are the accompanying:
- Direct analytical calculation – utilizing the FT CSs
- Bottom- up gate- to-gate calculation
- Simulation
The direct analytical calculation utilizing the FT CSs approach just entireties the majority of the CSs utilizing the OR entryway extension clarified previously. At the point when the quantity of CSs turns out to be extensive, it turns out to be excessively tedious and awkward, making it impossible to make a correct figuring, and the incorporation – rejection guess method clarified above is then used.
The simulation method makes use of Monte Carlo strategies to reenact the arbitrary disappointment of events in the FT. A huge number of trials are by and large run, and after that factual figuring is made to process the top FT likelihood.
The base up entryway to-door figuring method begins at the base of the FT and computes each entryway up the tree in a well ordered process. Each door is computed utilizing the proper entryway likelihood recipe. A lower level entryway count is utilized as an info incentive to a larger amount door. There is one critical alert with this technique, if the FT contains MOEs or MOBs the figuring will be mistaken unless the MOEs and MOBs are accurately represented (i.e., Boolean diminishment), which typically implies falling back on the CS estimation. An illustration base up door to-entryway computation is appeared in Figure 4.2
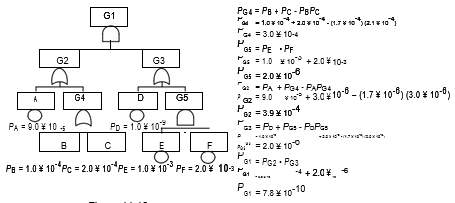
Figure 4.2
Chapter 5 Conclusion
FHA and FTA analysis is essential in determining the failures that could occur in an aircraft engine. This is very important when aircrafts have problems and needs to be repaired/maintained. The maintenance worker can find the possible causes of the failures by going through the FHA table and the FTA diagram. It will show the maintenance worker of the possible areas where the failures occurred and as due to the probability calculations the worker can know how likely a function is to fail. So, the worker can focus more on the functions which have a higher failure rate, which would theoretically help to find the fault faster. In the modern world everyone lacks time, so it is essential for the aircraft to be repaired as soon as possible. The FTA and the FHA analysis ensure that the fault can be found and repaired faster and more easily.
The limitation of the study done in this thesis is that it can be fully applied only for the engine in question (Gulfstream GV-SP), and for other aircrafts it can only be used as a reference but cannot be relied upon. This is so, as the structure and makeup of each engine is different, which would mean that they would have different causes of failures and functions. So, a FHA and FTA analysis should be done during the production of any engine, for itself. This FHA and FTA then should be periodically updated when needed. During the design stage it is only possible to assume the possible failures, but during the lifetime of the aircraft it is possible for it to come across new failures that are not considered during the making of FHA and FTA. In such cases, the FHA and FTA should be updated with the new data and this new data should be considered while making new aircraft engines so as to avoid it being accidentally looked over when making the FHA and FTA for the new engine.
References
[1] Adam Scharl, Kevin Stottlar, Rani Kady, Functional Hazard Analysis Methodology, navsea, August 2004.
[2] Clifton A. Ericson, Hazard Analysis techniques for System Safety, Virginia, John Wiley & Sons Inc. 2005
[3] Harley Burdet, P09005.10.5, Functional Hazard assessment report for unmanned aircraft systems, 22 November 2009.
[4] Nikhil Balakrishnan, An overview of System Safety Assessment, 2015, 33-81
[5] Stephane Paul, Thales ATM, document no:D1.3.9, Functional Hazard Assessment and very Preliminary System safety assessment report, final version, Germany
[6] P. J. Wilkinson and T. P. Kelly, Functional hazard analysis for highly integrated aerospace systems, Presented at IEE Seminar on the Certification of Ground/Air Systems, IEE Savoy Place, London, 1998
[7] FAA, System Safety Handbook – chapter 8: safety analysis: hazard analysis tasks, 2000.
[8] Nikhil Kumar C., Sharvan Kumar, Thesis, Full Authority Digital Engine Control (FADEC), REVA Institution os technology and management, Bengaluru.
[9] Mark Aiguier, Guidelines and methods for conducting the safety assessment process on civil airborne systems and equipment, Society of Automotive Engineers, August 1995
[10] G.Kotonya and I.Sommerville, Requirements Engineering: Processes and Techniques, Wiley, Chi Chester, England, 1998.
[11] Federal Aviation Administration, System safety analysis and assessment for part 23 airplanes, advisory circular, 2011.
[12] Alfred Roelan, Casual Risk models of air transport – comparison of user needs and model capabilities, November 2008.
[13] Viktor Gregor, Thesis, Safety Risk assessment for aircraft fuel management, Comenius University in Bratislava, 2015
[14] MelkerHarefors, Multivariable Control Design for a Jet Engine: Volvo Aero Corporation, S-46181, Trollhattan, Sweden, 1996.
[15] Balakrishnan, S.R., Evolution of control systems for Aircraft Gas Turbine Engine under development, J. AeSI, 1996.
[16] Mal Atherton, Systems thinking in Aero-engine control systems, Rolls-Royce Corporation, Indianapolis, Indiana, 2011.
[17] Federal Aviation Administration, Aviation maintenance technician handbook-airframe volume 1, chapter 14- Aircraft fuel system,
[18]Sanjay Garg, Aircraft Turbine Engine Control Research at NASA Glenn Research Center, Glenn Research Center, Ohio USA, 2013.
[19] Andrea Prencipe, Thesis, Breadth and depth of technological capabilities in CoPS: The case of the aircraft engine control system, University of Sussex, 2000.
[20] J.A Cook, J.W Grizzle, J.Sun, Engine control, January 1995.
Cite This Work
To export a reference to this article please select a referencing stye below:
Related Services
View all


Related Content
All TagsContent relating to: "Aviation"
Aviation regards any activity involved in the aircraft industry or mechanical flight including flying and the design, manufacture, and maintenance of aircraft. The term “aircraft” includes such vehicles as aeroplanes, helicopters, and lighter than air craft such as hot air balloons and airships.
Related Articles

DMCA / Removal Request
If you are the original writer of this dissertation and no longer wish to have your work published on the UKDiss.com website then please: