Rainfall Prediction Using Machine Learning Algorithms
Info: 9680 words (39 pages) Dissertation
Published: 29th Sep 2021
Tagged: Geography
Abstract
This paper introduces current supervised learning models which are based on machine learning algorithm for Rainfall prediction in India. Rainfall is always a major issue across the world as it affects all the major factor on which the human being is depended. In current, Unpredictable and accurate rainfall prediction is a challenging task. We apply rainfall data of India to different machine learning algorithms and compare the accuracy of classifiers such as SVM, Navie Bayes, Logistic Regression, Random Forest and Multilayer Perceptron (MLP). Our motive if to get the optimized result and a better rainfall prediction.
TABLE OF CONTENTS
| Chapter No. | Title | Page no. |
|
|
Introduction
|
9 |
|
|
Problem statement
|
11 |
|
|
Literature Review | 16 |
|
|
Proposed Solution | 32 |
|
|
Result and discussion
|
39 |
|
|
Summary and Conclusions | 42 |
|
|
References | 43 |
LIST OF ABBREVIATIONS
| MLT | Machine Learning Technique |
| SVM | Support Vector Machine |
| NN | Neural Network |
| ANN | Artificial Neural Network |
| NB | Naïve Bayes |
| LR | Logistic Regression |
| RF | Random Forest |
| MLP | Multilayered perceptron |
Introduction
In Today’s era global warming is affecting all over the world which majorly effect on mankind and cause the expedite the change in climate. Due to this air and oceans are warming, sea level is rising and flooding and drought etc. One of the serious consequences due to this climate change is on Rainfall. Rainfall prediction now days is an arduous task which is taking into the consideration of most of the major world-wide authorities. Rainfall is a climatic factor that affects several human activities on which they are depended on for ex. agricultural production, construction, power generation and tourism, among others [1]. This make the rainfall serious concern and requirement of better rainfall prediction. Rainfall is a complex atmospheric process, and due to the climate changes, it become more difficult to predict it. Since due to the arbitrary characteristics of rainfall series, they are often labelled by a stochastic process [2]. Now flood and drought are very common as in Uttarakhand state of India has confronted worst natural disaster in June 2013. There was received approx. 400% more rainfall compare to regular monsoon rainfall. Due to such type of heavy rainfall, roads and bridges was completely destroyed and 100,000 pilgrims and tourists was trapped which are on their “Char Dham Yaatra”[3] and this disaster could not be predicted by the government, big industries or risk management entitles, as well as the scientific community before the incident. These are also may lead to the land slide which is also a most serious geo-hazard causing the loss of life and property all over the world.
Form the last few decade scientist and engineers are successfully production several models for making the accurate prediction in several field. Machine learning is also a field which is widely used for the prediction purposes or classifying the things. There are number of methods, listing from KNN, more complex method such as SVM and ANN (Artificial Neural Network). For metrology predictions ANNs pictured as alternative method which opposed to traditional method, are based on self-adaptive mechanisms that learn from examples and capture functional relationships between data, even if the relationships between the data is unknown or difficult to describe [4].
In recent times, Deep learning become is become one of the successful mechanism in ANN to solve the complex problem and dealing with great amount of data [5]. Deep learning is essentially a series of multilayer architecture that are trained. The main changes which impact the model are weight and the learning rate of the layers. Deep learning approach has been widely applied to fields like computer vision, image recognition, natural language processing, and bioinformatics [6].
In our experimental study we use the rainfall data collected from the official website of Indian government. The data collected is comprises more than a decade of measurement of rainfall in all over India. As the world if moving toward to the issue of water and in India specific the rainfall prediction is most important thing. So, in this paper we try to optimize the result and to find the model which is well suitable for the rainfall prediction in India specific region only.
In our experimental study we have a tendency to use the rain knowledge collected from the official web site of Indian government. the info collected is includes quite a decade of mensuration of rain all told over Asian nation. because the world if moving toward to the difficulty of water and in Asian nation specific the rain prediction is most vital factor. So, during this paper we have a tendency to try and optimize the result and to seek out the model that is well appropriate for the rain prediction in Asian nation specific region solely.
Climate change is a big issue which effect the mankind. People around the world are facing serious consequences due to this climate change. Climate change means that the change in the global or regional climate and particularly the climate change is suddenly comes into consideration from the mid to late 20th century onward. This all happening due to the high pollution level in the atmosphere and attributed largely to the increased level of atmospheric carbon dioxide (CO2) produced by the use of fossil fuels. Climate change which also referred as the global warming. Global warming which refers to the rise in average surface temperature on earth Due to which the whole earth is changing.
Problem statement
Climate is a important aspect of human life. So, the Prediction should accurate as much as possible. In this paper we try to deal with the prediction of the rainfall which is also a major aspect of human life and which provide the major resource of human life which is Fresh Water. Fresh water is always a crucial resource of human survival – not only for the drinking purposes but also for farming, washing and many other purposes.
Making a good prediction of climate is always a major task now a day because of the climate change.
Now climate change is the biggest issue all over the world. Peoples are working on to detect the patterns in climate change as it affects the economy in production to infrastructure. So as in rainfall also making prediction of rainfall is a challenging task with a good accuracy rate. Making prediction on rainfall cannot be done by the traditional way, so scientist is using machine learning and deep learning to find out the pattern for rainfall prediction.
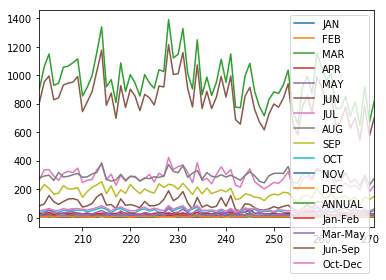
A bad rainfall prediction can affect the agriculture mostly framers as their whole crop is depend on the rainfall and agriculture is always an important part of every economy. So, making an accurate prediction of the rainfall somewhat good. There are number of techniques are used of machine learning but accuracy is always a matter of concern in prediction made in rainfall. There are number of causes made by rainfall affecting the world ex. Drought, Flood and intense summer heat etc. And it will also affect water resources around the world. Our major concern is the major downfall to the rainfall on yearly bases as we can see in Fig 1 the graph show there is the major downfall to the yearly rainfall in millimetre.
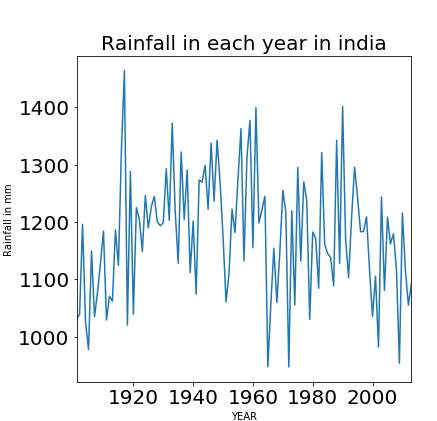
Fig.1. Rainfall in Each Year
As we do further detailing about the rainfall in India on monthly bases in Fig 2. And compare the in monthly bases rainfall. As in below figure we can see that in month of August rainfall is
In today’s world climate change is a big issue which effect the mankind. People around the world are facing serious consequences due to this climate change. Climate change means that the change in the global or regional climate and particularly the climate change is suddenly comes into consideration from the mid to late 20th century onward. This all happening due to the high pollution level in the atmosphere and attributed largely to the increased level of atmospheric carbon dioxide (CO2) produced by the use of fossil fuels. Climate change which also referred as the global warming. Global warming which refers to the rise in average surface temperature on earth Due to which the whole earth is changing.
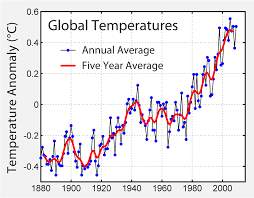
As the graphing is showing the rapid growth of temperature from past few decades. According to NASA (National Aeronautics and Space Administration) who always keep their eyes to every change in climate states that the climate will became worst if didn’t control all these.
Most of the world says that the main cause of this current climate change or global warming is human expansion of the greenhouse gases.
This climate change is impacting the mankind and increasingly influencing their life. This also effecting all the area on which human are depending upon, 3 major area are Water, food and air these are the most important things required by the human to survive. But all these 3 areas are affected due to global warming.
Due to climate change it become difficult for farmer to grow crops, raise animals and catch fish in the same ways and same places as they have done in the past. This also effects the agricultural production. Farmer as the main source of the food for the human but due to this its also get affected. Where as air is also become poisonous there are several no of harmful gases are mixed up in the air which effecting the humans. More people are becoming ill due to this air pollution as for humans it is necessary to breath.
And water which is also an important resource of survival of humans. But due to this climate change availability of the fresh water is decreasing rapidly. No of countries ae facing the shortage of fresh water to drink. This climate changes are not just changing the temperature. The whole water cycle is also get affected. Warmer the world becomes means the atmosphere ha the capacity to hold grater moisture. So, there are changes in the volume of water vapour, rainfall and the flow of water in the atmosphere.
Fresh water is always a crucial resource of human survival – not only for the drinking purposes but also for farming, washing and many other purposes. It is expected to become increasingly scarce in future, and this partly due to climate change.
Approximately 98% of our water in our earth is salty and only 2% is fresh which can be used for drinking purposes. Of that 25, almost 70% comes from the snow and ice, 30% is ground water and less than 0.5% is the surface water which are lake, river etc. and 0.05% is in our atmosphere. Here Rainfall is also the major resource of fresh water and rainfall is also responsible for filling up the river or lake. Ground water level is also increase only because of the rainfall. But due to the climate change Rainfall is also get affected. Many areas around the world is facing the major drought in their region due to which they are bound to leave their houses and leave their countries or area and try to get settle in the area where they get fresh water for their survival. The whole water cycle is also get affected. Warmer the world becomes means the atmosphere has the capacity to hold grater moisture. So, there are changes in the amount of water vapour, rainfall and the circulation of water in the atmosphere.
Due to this a new issue arsing in the world which is climate migration in which people are bound to change their country in search of the water.
India is facing the drought in most of their states. Due to which farmer couldn’t able to do their farming as water is the main part of farming. Below shows the overall rainfall in India in past few years.
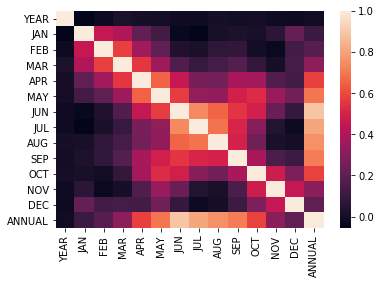
The graph above show heat map the each month rainfall in each year in India. As shown there is a major fluctuation in rainfall in India. A good prediction in rainfall can lead to the better resource management.
The scope of this research is wide. Currently peoples are facing major problem due to this climate change. If we able to make a good prediction of weather this will very helpful for the whole mankind human kind.
Literature Review
Steve Oberlin, et.al (2012) proposed various Machine Learning strategies for the Big Data processing. He applied Machine Learning and various techniques from Artificial Intelligence to the complex and powerful data sets. Recommendation engines used by Netflix to see the rating and preferences of audience are one of the applications of Machine Learning. Informatics and Data Mining in which IBM’s “Watson” uses different Machine Learning approach to process and depict human language and answer the queries [1]. Linear regression, massaging the data, Perception, k- means are the few strategies used by him for uncovering the relationships and finding patterns in data. The choice of Machine Learning algorithm basically depends on the nature of prediction. The prediction can be estimate type or classification. He also discussed how increasing features can make the algorithm complex and increasing computational requirements.
Jainender singh, et.al (2014) proposed machine learning technique that would be providing promising results to security issues faced in applications, its technologies and theories. He emphasized on mining from sparse, incomplete and uncertain data that would give optimized results when hidden patterns are discovered from the data sets using machine learning algorithms like Support Vector Machine (SVM), Naïve Bays classifiers, clustering techniques which are used to create supervised learning [4]. It would give insight knowledge in health, education, trade and many more fields.
Junfei Qiu, et.al (2017) proposed some of the latest advances of Machine Learning for processing Big Data. Representation Learning, a new advanced learning method in which data representation is useful and meaningful by extracting helpful information while constructing classifiers and predictors. It aims to capture vast input which would give computation as well as statistical efficiency. Feature selection, Feature extraction and Metric learning are the subtopic of Representation learning. Active learning is another advanced Machine learning method applied for big data processing like biological DNA identification, image classification. It is a case of semi-supervised Machine learning in which it queries the users to get desired output from subset of critical labelled instances available thus minimizing the cost and giving higher accuracy and optimized results. He also discussed about the challenges and issues of Machine learning for Big Data processing. Heterogeneous nature of data, data produced at lightning speed, uncertainty and incomplete data, its vastness are some of the major concerns about Big Data. He also gave remedies for the same. Alternating direction methods of multipliers (ADMM) is a promising method for parallel and distributed large scale data processing. It splits the multiple variables in an efficient way thus helping to find solution to a large scale of data. For handling high speed of data, Extreme Learning Method (ELM) has been introduced to provide faster learning speed, great performance and with less human interference.
Yasir Safeer, et.al (2010) presented Machine learning Algorithm i.e. k-means clustering for finding a document from a vast collection of unstructured text documents. He proposed a technique to portray documents that would be improving clustering result [3]. He discussed about the stream of document clustering, implemented k-means and devised an algorithm for better representation of documents and proposed how systematic domain dictionary would be used to get better similarity results of documents.
Roheet Bhatnagar, et.al (2018) presented about role of Machine Learning and Big Data Processing and Analytics (BDA). The development of Machine Learning and Big Data Analytics is complementary to each other. He discussed various future tends of Machine learning for Big data. Data Meaning implies how Machine Learning can be made more intelligent to acquire text or data awareness [5]. Technique Integration, another trend used to integrate data and process it. Classification, regression, cluster analysis are some of the techniques of Machine Learning which are used to perform analytics and predict future from existing patterns find correlation among the given data sets
Alexandra L’Heureux, et.al (2017) presented new ways of processing Big Data through Machine Learning Algorithms. Due to Big Data characteristics, traditional tools are now not capable of handling its storage, transport or its efficiency. Machine Learning is regarded as a fundamental component of Data Analytics as it has power to learn from data and provides data driven insights, prediction and decision. The tremendous increase in size, space and time complexity of Support Vector Machine (SVM) would affect both the complexities thus making computational efficiency infeasible. Curse of Modularity in which increase in size of data leads to collapse of the given boundary of algorithm is solved by Map Reduce [6]. It is a programmable and scalable paradigm used for processing large data sets on various nodes by following parallelism. It follows iterative approach. K-means can also, be used to overcome shortcoming of Curse of modularity. Online Learning, one of the Machine Learning paradigms that would bridge the efficiency gaps produced by Big Data. It helps in processing large amount of data solution. Due to its adaptive nature, it is able to handle dirty and noisy data.
Zheng, Tao, et al. [7] the proposed work is based on to discover the vital genotype and phenotype association to affiliate Type 2 Diabetes Mellitus (T2DM). In the proposed framework, for proper diagnosis, detection and medication cases of T2DM Electronic Health Records (EHR) data are used through feature engineering and machine learning. Various learning model has been used for better comparison such as Naïve Bayes (NB), Logistic Regression (LR), Support Vector Machine (SVM), K- Nearest Neighbours (KNN), Decision Tree- J48 (DT), Random Forest (RF). WEKA package is applied on engineered features on the various model mentioned above. For all the used learning model 4-fold cross validation is conducted and get reported on their average performance and standard deviation. J48, SVM, RF have the highest performance index yielding more than 95% of accuracy, sensitivity, specificity, AUC on all the three levels of feature selection. In comparison, LR has the highest accuracy of 99% followed with SVM and RF 98%. Whereas, rest three models namely KNN, NB, and LR are vulnerable to the issue of sparsity and noise in records database across the three levels of feature selection.
Madeeh Nayer Algedway [8] has performed the work by developing a model for detecting diabetes in the patient using six different algorithms such as Linear Discriminate Analysis (LDA), Generalized Linear Model (GLM), Recursive Trees, Support Vector Machines (SVMs), K-Nearest Neighbours (KNN) and Naïve Bayes to Pima Indians Diabetes Database. Compare the six algorithms are using GLM wholistic classifier, performance will be measured by generating the confusion matrix for calculating four performance measure factor like accuracy, precision, recall, and f-measure, the tool used for prediction is WEKA and MATLAB. For achieving, the better predictive model for better accuracy and f-measure can be done by stacking ensemble. Run all the six algorithms separately for different performance model measures like accuracy, precision, recall, and f-measure. 10-cross-validation is used for cross-validation in all six algorithms. However, Stacking ensemble of three algorithms namely, LDA, KNN and the Recursive tree gives the accuracy of 96.4% and f-measure as 0.956. [45]The KNN weakness have been proved in many cases when combined with other feature selection techniques it outperform. In conclusion, stacking ensemble with three algorithms are better than the rest model such as support vector machine, generalized linear model, Naïve Bayes to predict diabetes in the patient.
Huang, Guan-Mau, et al. [9] in the proposed work they have shown the detection of diabetic nephropathy among the type 2 diabetic patient. The diabetic nephropathy is damage to kidney caused by diabetes, high cholesterol, hypertension. [3] According to the proposed work by Huang, Guan- Mau et al. the early detection of renal malfunction are possible using decision tree based model integrating it with genotype and clinical data of patients which were collected from various association using 345 type 2 diabetic patient. The 5 -fold cross-validation approach is used where the data are classified according to genders, the algorithms like Naïve Bayes, Support Vector Machine(SVM), Random Forest(RF), Decision Tree are compared with their attributes for the better result. The result obtained in the proposed work is purely comparison done using WEKA and LibSVM. According to the paper, the results are obtained in four categories, 1. Comparing performance between individual and combination of clinical features. 2. Comparing performance between individual and combination of genetic features. 3. Evaluation of performance by integration of clinical and genetic features. 4. Gender-based performance in decision tree classification of the diabetic nephropathy training dataset. Applying the 5-fold cross-validation technique with accuracy, specificity, and sensitivity reaching 85.27%, 83.32 and 85.24%, respectively using decision tree classification algorithm. In conclusion, the individual use of genetic and clinical features gives a disappointing result whereas, the combination of genetic and clinical features gives a significantly better result.
T.S. Santhanam and M.S. Padmavathi [10] the proposed work for diagnosis of diabetes by introducing K-Means clustering based outlier detection followed with Genetic Algorithm (GA) for feature selection with Support Vector Machine (SVM) as a classifier to classify the dataset of Pima Indians Diabetes from UCI repository. The Genetic Algorithm (GA) feature selection tools and its output are used in SVM using 10-fold cross validation technique for classification. SVM with K-Means and Genetic Algorithm model give accuracy as 98.82%. The proposed research method finds following conclusion: (a) the minimum and maximum classification accuracy are 98.43% and 99.21% respectively for SVM and average accuracy is 98.79%. (b) The K-means outlier detection percentage is 33.46%, out of 768 instances, 511 samples are selected and 257 samples were included as outlier. (c) Minimum number of attribute selected is 3 and maximum is 6. (b) Attributes such as Pregnancies, PG Concentration, and Age are critical attributes in the dataset. Overall, in present findings of this proposed method there is 2.08% increment in accuracy of SVM classification model over the modified K-means algorithm.
Dagliati, Arianna, et al. [11] according to the proposed method in this paper the machine learning algorithms embedded with data mining pipelining to extract the knowledge from the vast pool of information. The European Union-funded MOSAIC (Models and Simulations techniques for discovering diabetes influence factor) project in the year of 2012-2016 the EHR are collected for predictive type 2 diabetes mellitus model for nearly one thousand patients. This kind of data mining profiling comprises of center profiling, predictive model targeting, predictive model construction, and model validation. The classification models are used as Support vector machine (SVM), logistic regression (LR), Naïve Bayes (NB), and random forest (RF). The analysis is done in four stage of data mining pipelining. The method of center profiling is aimed for selection bias and for defining the performance variable, characteristic in terms of population, patterns of care etc. An important conclusion is also derived from the medical point of view that the period of diabetes and the BMI value are the main risk factor for retinopathy and neuropathy whereas, hypertension was the main risk factor for retinopathy and nephropathy. Henceforth, it has been concluded that the data mining technology can be easily integrated with machine learning for the better outcome in prognosis and treatment of any disease.
Santillana, Mauricio, et al. [12] in the proposed system the main contribution is by collecting and combining influenza-like illness (ILI) activities using machine learning ensembles approach. In the proposed paper the three popular machine learning algorithms are used namely Support Vector Machine (SVM), Stacked Linear Regression (SLR), and AdaBoost regression with the decision tree. The six weak predictors are developed of ILI are (a) near real-time hospital visit records from Athena health, (b) Google Trends, (c) influenza-related Twitter microblogging posts, (d) FluNearYou, (e) Google Flu Trends (f) CDC data. To evaluate these weak predictors for performance five evaluation metrics are considered namely, Pearson correlation, root mean squared error (RMSE), maximum absolute percent error (MAPE), Root Mean Square Percent error (RMSPE), and hit rate. Furthermore, from the proposed paper result the AdaBoost gives outperformance with best accuracy lowest RMSE and robustness lowest MAPE for the three forecast time horizons which are labeled as “this week”, “next week”, and “in two weeks”.Henceforth, in conclusion, it is derived that the ensemble model is as important for a real-time system as it for archival data to accurately estimates influenza flu in one, two or three weeks.
Ch, Sudheer, et al. [13] in this proposed research work for prediction of malaria transmission using Support Vector Machine and [27]Firefly algorithm (SVM-FFA) shows the better performance. According, to the proposed research the epidemic of Malaria is widespread, is Rajasthan leading to death and illness and lack of primary healthcare make the situation worse. The four model system is been made for both the region like SVM-FFA, Auto-Regressive Moving Average (ARMA), Artificial Neural Networks (ANN), SVM. The proposed models are developed using LibSVM library in MATLAB and the ARMA model is defined using the IBM- SPSS software for the better insight on the depth of data and prediction. The R2 statistic and NMSE parameter for training and testing, using R2 it gives the accurate result for SVM-FFA for predicting malaria incidences. In the conclusion, we find that the proposed work proved that the novel approach of FFA and SVM is better than the other models for prediction of malarial incidences beforehand so the authorities can take better steps for the particular community and regions.
Heydari, Mahmoud, et al. [14] in the proposed work prediction of type 2 diabetes among the population of Tabriz, Iran where 2536 cases of the patient were screened for diagnosis using machine learning algorithm and applying data mining techniques to extract the knowledge from the data sets. In the proposed system various classification methods are used like Support vector machine (SVM), artificial neural network (ANN), decision tree, k-nearest neighbor(k=5), a Bayesian network for disease diagnosis using 10-fold cross-validation. The performance statistic Artificial Neural Network (ANN) shows 97.18% accuracy when eight neuron hidden layers are used in the structure with 97.5% of sensitivity and 96.8% specificity.
Melillo P, Izzo R, Orrico A et al. [15] in the proposed system the automatic prediction of cardiovascular and cerebrovascular (strokes, syncopal events) events using heart rate variability analysis (HRV) these are high-risk subjects for the patient above 55 years of age in the developed country. According the proposed work 10-fold cross-validation with several data mining techniques are used for prediction based on various HRV features are Naïve Bayes classifier (NB), decision trees using the C4.5 decision tree induction algorithm, Random Forest (RF), boosting meta-learning approach i.e. AdaboostM1 (AB), SVM and artificial neural networks using a Multilayer Perceptron (MLP). In the result discussion, C4.5 and AB achieved the highest performance with chi-squared feature selection algorithms, whereas MLP and NB with co-relation based algorithms. RF outperformed by achieving the accuracy of 85.7%, a sensitivity of 71.4%, and a specificity of 87.8%. In the proposed system Random Forest is chosen as the best algorithm based on feature selection for performance including SVM.
Dipnall JF, Pasco JA, Berk M et al. [16] in the proposed work various data mining and machine learning methodologies were combined to form a hybrid system to detect biomarkers associated with depression. The data were collected from the study conducted on depression in between the year 2009-2010 in National Health and Nutrition Examination Study (NHANES), the study is conducted in three steps methodology as the amalgamation of multiple imputations, machine learning boosted regression, and logistic regression to identify the key biomarkers. The two methods used in this paper namely are Missing At Random (MAR) or Missing Completely At Random (MCAR). The advantage of using boosted regression is it can accommodate any kind of variable, and any type of likelihood loss function, and can deal with highly correlated predictors [4]. This novel hybrid method approach with boosted regression and statistical regression are very much likely applicable for large datasets with various biomarkers in epidemiological datasets. Henceforth the multi-step hybrid approach can easily handle the missing data and complex surveys samples.
Kang, Seokho, et al. [17] in the proposed work an anti-diabetic drug failure prediction is introduced keeping the point exponential increase of type 2 diabetes in Human being all around the globe. The method proposed in this paper is Support Vector Machine (SVM) which is considered as one of the best methods to train large-scale medical dataset. To enhance the effectiveness and ensemble effective of SVM algorithm E3-SVM method is introduced. The proposed research work is completed in two-phase for E3-SVM. The major shortcomings of the proposed system are to choose appropriate k values i.e., data selection parameters. The prediction of k values affects the prediction and performance of data at the various level of selection of data points selection. The proposed system has concluded that the Bagging shows the better result when used with small bootstrap size. Even short training time is required for betterment in performance.
Jelinek, H. F. et al. [18] in the proposed system they have shown a sincere concern of the risk of diabetic neuropathy as the nervous system get affected when diabetes gets spread all over the body causing cardiac arrest. Henceforth, multi-scale Allan vector is applied to determine heart rate variability (HRV), the features from ECG recordings are used for machine learning methods and automated detection. The proposed system introduces new Graph-Based Machine Learning System (GBMLS), effectively diagnosis the diabetic neuropathy. The Scikit learns were used to test the result, along with the proposed algorithm GBLMS other algorithms like SVM, CBGF, HBGF et al. are used which comes along with Scikit learning package. The GBLMS method is combined with multi-scale Allen Vector (MAV) gives the best result with high sensitivity of 98% and specificity of 89% which outperformed other classifiers like Random Forest with 83% and 92% as sensitivity and specificity respectively.
Khan, Saranjam, et al. [19] in the proposed method Raman Spectroscopy spectra are combined with Support Vector Machine to efficiently diagnosis Dengue Virus in 84 patients collected from the Holy Family Hospital, Rawalpindi, Pakistan in autumn of 2015. Raman Spectroscopy is the shift in the wavelength of the inelastically scattered radiation that provides the chemical and structural information [5]. The 10-fold cross-validation technique is used to evaluate the approach when the confusion matrix analysis is generated to analysis results obtained from Raman spectra and SVM using the three kernels namely, Gaussian Radial Basis, Polynomial, and Linear. Among all the three kernels Polynomial kernel function order 1 give the best result when the method was analyzed in terms of accuracy, precision, sensitivity, and specificity of 85%, 90%, 73%, and 93% respectively. In the proposed work it had been shown the use of Raman Spectroscopy helped for easier diagnosis as the screening get easier and efficient and the use of SVM with different kernels helps to filter the result in large-scale efficiently with proper classification of all the features.
Kesorn, Kraisak, et al. [20] in the proposed research a surveillance system is introduced to monitor the effect of dengue hemorrhagic fever (DHF) and Aedes aegypti mosquito infection rate on similar climate and geographical area using the Support Vector Machine (SVM). According to the proposed research work, the nine major area are considered for dengue epidemic rate which is selected in between the year of 2007-2013 these areas are: temperature, rainfall, humidity, wind speed, Ae. aegypti larvae infection rate, male mosquito infection rate, female mosquito infection rate, population density, and morbidity rate. The methodology takes place in three steps. For the model construction, various forecasting classification algorithms like K-Nearest Neighbor (KNN), Decision Tree (DT), Neural Networks (NN), Support Vector Machine (SVM) with different kernels, SVM is chosen because of its outperformance with RBF kernel. For the prediction and result evaluation, the 10-fold cross-validation technique is used to validate the result for SVM effectiveness using the accuracy, sensitivity, and specificity as overall performance metrics. The SVM RBF kernel is defined by the predictive model of two parameters C (parameter of regularization) and σ2 (kernel function parameter) gives the value of 8 and 0.1250 with 10-fold cross-validation.
Among all the kernels used the SVM-RBF kernel shows better performance with 96.296% accuracy, sensitivity and specificity of 87.47%, which is better than the SVM-L, SVM-P, KNN, DT, NN.
Zuccon, Guido, et al. [21] in the proposed system early detection of outbreaks of influenza-like illness (ILI) are detected using Tweets from Twitter microblogs. In the proposed study they have tried to prove that the use of Naïve Bayes and SVM algorithm will not only give the best results even the use of Logistics performs similarly to SMO (polynomial kernel and sequential minimal optimization algorithm) in 10-fold cross validation for low threshold values while it loses its effectiveness for high threshold values. [47]This big unstructured can even analyzed using Map Reduce to generate a meaningful result from the various tweets. The Medtex text analysis software is used to extract the features from the free text of Twitter messages, here number of standard features are used like word tokens, stems, and n-grams; the presence of Twitter username, hashtags, URLs, emoticons. However, the classifiers with F-measures of the balanced sheet have the for cross-validation have higher performances stats comparatively with the unbalanced sheet of unseen data validation.
Patidar Shivnarayan, Ram Bilas Pachori et al. [22] in the proposed system an automated diagnosis of coronary artery disease (CAD) which is a major lead for heart failure, arrhythmias, and cardiac arrest using the novel method of tunable Q-wavelet transform (TQWT) features based extraction from heart rate signals obtained from the raw ECG (Electrocardiogram). This feature are applied to classification algorithms like Least Squared Support Vector Machine (LS-SVM) with different kernels whereas, only Morlet Kernel function using 3-fold cross validation gives accuracy of 99.7%, sensitivity of 99.6%, specificity of 99.8%, and Matthews correlation coefficient of 0.9956 for Q varying between 24 and 30, which gives nearly 100% efficiency. Henceforth from the proposed research work, it is been clear the outcome can be even applied to the diagnosis of heart disease, diabetes, eye disease, and neural diseases.
Bashir Saba, Usman Qamar et al. [23] in the proposed work the prediction of heart disease is found from the BagMOOV novel ensemble methods this framework is based on enhancing bagging approach for the multi-objective weighted voting scheme for prediction and analysis. The proposed work prediction assessed using 10-fold cross-validation and ANOVA (Analysis of Variance). Along with the BagMOOV approach, a decision support system (DSS) is also introduced for heart disease diagnosis using novel ensemble method. In the proposed work five different datasets are used like SPECT, SPECTF, Heart disease and Statlog, and Eric datasets with different attributes the class labels are denoted as class 0 and 1 for distinguishing features. The BagMOOV ensemble technique gives accurate and efficient results in all the datasets compared to the other state of art techniques. Using the proposed work the decision support system uses 138 patients samples where an accuracy of 84.78% with 73.47% sensitivity, 91.01% specificity, and 81.30% f-measure is achieved. Henceforth, the highest accuracy is achieved by the DSS among all the distinguish classifiers used in this proposed work.
Passos, Ives Cavalcante, et al. [24] in this proposed study where the mood disorders a psychological behavioral trait of the human being is studied using the machine learning algorithms. To perform the training the three algorithms of machine learning such as Least average shrinkage and selection operator (LASSO), support vector machine (SVM), and relevance vector machine (RVM) are designed using MATLAB to design a system to predict the possibility of suicide attempter. Although the Leave-one-out cross-validation technique is used for assessment of training and testing datasets. Above all the three algorithms the RVM had the better performance rate because 103 out of 144 patients were guessed correct that they are likely to attempt suicide or not, with the accuracy of 72%, sensitivity of 72.1%, specificity of 71.3%, and chi-squared is p
Rane, Archana L. [25] in the proposed system a survivability kit for the human being is developed where some common symptoms diseases which kinds of the epidemic like Colds-Flu Gripe, Dengue, Malaria, Cholera, Leptospirosis, Chikungunya, Chickenpox, and Diarrhoea are can be easily predicted. To perform the present study data are collected from the hospital of Nasik, Maharashtra (India) of 316 patients. The algorithms like Decision tree (J48), Artificial Neural Network (MLP), Support Vector Machine (SMO), K-Nearest Neighbour (LWL), and Naive Bayes is used assessed by 10-fold cross-validation and performed in WEKA open source software. Henceforth, from the proposed work the ANN outperforms the parameters values comparatively to SVM which exceptionally gives lowest acceptance result.
Moreira, Mário WL, et al. [26] in the proposed the risk of hypertension in pregnant women is diagnosed with preeclampsia which is the risk during and after the pregnancy for maternal health. The diagnosis of preeclampsia is very difficult manually that is a probabilistic method of Bayesian Network is introduced which is performed over 20 pregnant women having hypertension. The Bayesian network does the thorough study of each symptom a pregnant lady suffers from a headache, giddiness, nausea/vomiting, edema etc. so the decision support system is developed to a diagnosis of preeclampsia in pregnant women.
Sally nihilist et.al projected the sensible learning eventualities wherever we’ve got bit of labelled knowledge at the side of an outsized pool of unlabelled knowledge and conferred a “curtaining” strategy for exploitation the unlabelled knowledge to boost the quality supervised learning algorithms. She assumed that there square measure 2 completely different supervised learning algorithms that each output a hypothesis that defines a partition of instance area for e.g. a call tree partitions the instance area with one equivalent category outlined per tree. She finally finished that 2supervised learning algorithms may be used with success label knowledge for every different.
Zoubin Ghahramani et.al gave a short summary of unsupervised learning from the angle of applied mathematics modelling. consistent with him unsupervised learning maybe motivated from data abstractive and theorem principles. He additionally reviewed the models in unsupervised learning. He any finished that statistics provides a coherent framework for learning from knowledge and for reasoning beneath uncertainty and additionally, he mentioned the kinds of models like Graphical model that contend a vital role in learning systems for kind of completely different forms of knowledge.
Rich Caruana et.al has studied numerous supervised learning strategies that were introduced in last decade and supply a large-scale empirical comparison between 10 supervised learning strategies. These approaches include: SVMs, neural nets, supply regression, naive Bayes, memory-based learning, random forests, call trees, bagged trees, boosted trees and boosted stumps. They moreover studied and inspect the result that calibrating the models through Platt Scaling and Isotonic Regression has on their performance. that they had used numerous performance-based criteria to gauge the educational strategies
Man Galih Salman, Yaya Heryadi, Bayu Kanigoro Has studies the matter faces concerning foretelling. during this author exploitation deep learning technique for the foretelling. Deep learning is that the a part of AI within which “deep” indicates that such neural network contains additional layer then the “shadow” ones utilized in typical machine learning. It projected a probe a frame work with the weather knowledge. The results has been enforced to explore continual NN exploitation heuristically optimisation methodologyfor rain prediction supported weather dataset.
Proposed solution
Machine Learning
We are going to toward the time zone of artificial intelligence where everything is controlled and handled by the machine. Machine learning is the subset of artificial intelligence where we teach the machine to learn by itself without the help any external source. In machine learning we teach the machine to learn from its previous data and try to improve its result in future by taking lesson from its previous decision. Part of machine learning includes the uses of tools, methods and techniques which help it form better results. These methods and algorithms provide machine and us a new approach to explore the new knowledge from and given data or the by exploiting the traditional datasets. In some situation, we try to record the behaviour and then model that behaviour. In turn modelling stimulate the people to have a better understanding of the situation. Machine learning method have a slight have a history of statistics. It’s helpful for exploring more complicated learning model to take out the true message hidden in large amount of data.
Although both machine learning technologies and traditional statistics tools can be applied in data analysis, their fundamental principles and characteristics have a great different. As compared to statistics data analysis, the exclusive advantages of machine learning includes enumerated benefits which are : we can process big data and real-time data streams with mixed values types, we can select from different learning models and controlling parameters to capture the non-linear or high-order structure in data, we can also recognize complicated patterns that cannot be represented in different mathematical terms, visualization of the data for making a prediction and we can also integrate the learning models with other different databases management system.
Learning is a continuous process but in machine also we try to stimulate this learning process alike humans. For machine basically learning consist of 3 types which are supervised, unsupervised and reinforcement learning. All these play a major role to designing a learning model. In supervised learning, the system provided with the no. of labels in which data is to be divided, also a desired output. The algorithm is able to “learn” by comparing the actual output with the trained outputs and find errors and adjust the model accordingly. In other hand, Unsupervised learning data is provided is unlabelled, so data is divided according to likeness among is input data. Learning in the algorithm is left to find likenesses among its input data. Unlabelled data are big in size, machine learning ald=gorithm are facilitate unsupervised leaning ae particularly valuable.
SVM (Support Vector Machine)
SVM use to solve the classification problems which find the best fit line between the classes which also known as the hyperplane. Distance from the hyperplane corresponds to the confidence of prediction. So, we have to make the margin as largest as possible between the hyperplane and the closest data point. Basically, SVM uses a kernel trick which takes the low dimension input data to the high dimensional feature space in order to find a best fit line or decision boundaries.There are no of hyperplane exist between the classes but the best choice will be the hyperplane that leaves the maximum margin from both classes.
SVM is the It is an iterative algorithm which is used to solve the optimization problem that arises during the training of Support Vector Machine. It usually uses to break the problem into no of sub problem [8]. In Lin et al. [17], they used SVM-based models with and without typhoon characteristics to forecast the rainfall.
Using the feature of two SVM class concepts in a plane called separating hyperplane, an n−1 Dimensional plane equivalent to an n dimension space separates the classes apart. The hyperplane is so selected that both classes are separated by a maximum distance from the plane; this plane is called the maximum margin hyperplane. The equation of the separating hyperplane is given in Equation below:
w*X +b = 0
where Xi s the d-dimensional feature matrix consisting of features of classes to be separated, b is the bias, w is normal to the hyperplane, |b|/ ||w|| is the perpendicular distance from the hyperplane to the origin, and ||w||2 is the Euclidean norm of w.
Navie Bayes
Navie Bayes classifier is based on the probability theorem which is Bayes theorem. It is a powerful algorithm for predictive modelling. Navie bayes is widely used for classifying the high dimensional training datasets. It’s a probabilistic classifier as its uses the probability theorem for the classification and focuses on making the supposition that existence of a certain feature is independent of the existence of other features that why it’s called as Navie.
Bayes part is comes from the Bayes theorem or law which gives us the method for the conditional probability that is the probability of an event based on some previous knowledge available on the events. Naive bayes technique is based on Bayes’ theorem which provides posterior probability P(C|A) from P(C), P(A) & P(A|C):
P(C|A) = P(A|C) P(C)
P(A)
In the above formula we find out the probability (Conditional probability) of occurrence of event C given the event A is true equal to the probability of the occurrence of the event A given the event C is true multiplies by the probability of C upon the probability of A.
Random Forest
Random forest is supervised learning method in which a classification tree is generated. In this algorithm input data vector put in each tree of the forest to classify a new object from an input feature vectors. Each tree in forest provides the “votes” to each tree and tree with highest “votes” are considered for classification. pseudo−code [14]. Randomly choose “k” features from the total “m” features. Spilt the element into some elements by using the best split.
Algorithms is capable preforming both classification and regression task. It’s a collection, no of decision trees the more tree in forest the more robust and more accurate results.
MLP (MULTILAYER PRECEPTRON)
MLP is a class of feed forward ANN. An MLP consists of at least three layers of nodes. Except for the input nodes, each node is a neuron that uses a nonlinear activation function. MLP use a supervised learning technique called back propagation for training purpose [11].
A multilayer perceptron is a neural network linking multiple layers in a directed graph, which means that the signal path through the nodes only goes one way. Each node, apart from the input nodes, has a nonlinear activation function. An MLP uses backpropagation as a supervised learning technique. Since there are multiple layers of neurons, MLP is a deep learning technique.
It attempts to replicate how the human brain work. A neural network architecture is encouraged by biological neural networks and be made up of multiple layers in an artificial neural network made up of hardware and GPUs neural networks. The output of one layer serves as the input of the succeeding layer. In deep learning, algorithms can be either supervised and serve to classify data, or unsupervised and perform pattern analysis.
In our paper we are using the rainfall datasets from the government of India website which is data.gov.in. We are using machine learning algorithms to predict the rainfall and try to find out the best algorithm. This process leads to several steps given below:
Step 1: Collect the rainfall dataset from the open repository data.gov.in with no. of multiple features.
Step 2: Data Cleaning, Data Pre-processing and feature selection.
Step 3: Output will be algorithm with the optimized result.
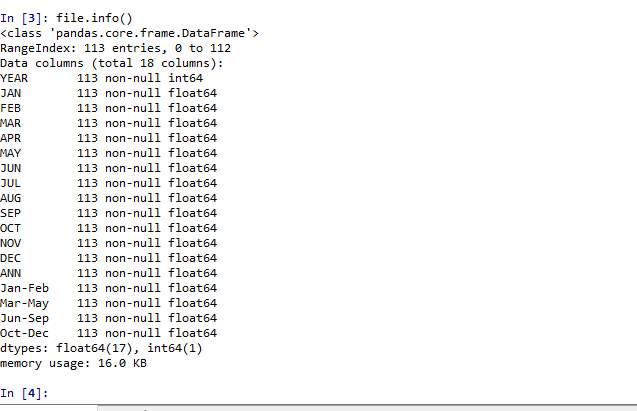
Dataset is taken from the official website of Indian government which data.gov.in.
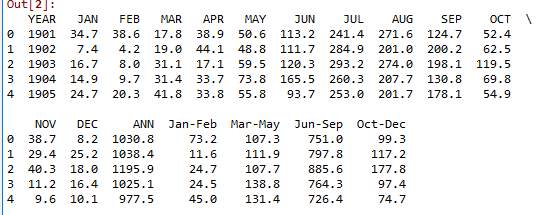
And the data preparation is done using data pre-processing process. We use the data which is gathered from the official website od Indian government. That provide us the rainfall volume of data which is calculated in millimetre from all over India from 1901-2013. These data set are of every month of the specific year from January to December rainfall data.
Data is noisy, incomplete and missing. We have to do feature selection for more meaningful inputs for processing and analysis. In the paper for the experiment purpose we used monthly rainfall volume in millimetre.
We do data normalization or feature scaling to standardize the range of independent variables. For re-scaling data in between [0,1] we applied the standard scalar formula given as:
Xi – mean(x) / stdev(x)
where stdev is the standard deviation.
This official website provides the overall rainfall all over India on mm of the past 23 years. We use different machine learning algorithm to predict the rainfall of the next month by taking the train data as the previous months as past months.
Mainly we did the train the data with initial months and predict the rainfall of the net month.
In our work we select month as feature and try to predict the rainfall of next month. As the below graph show the rainfall in month.
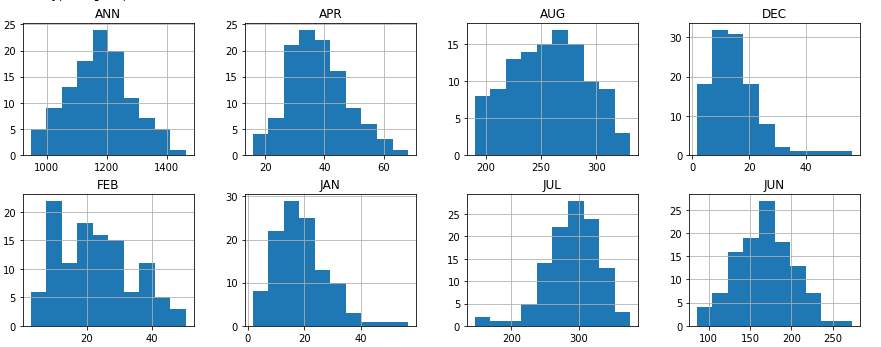
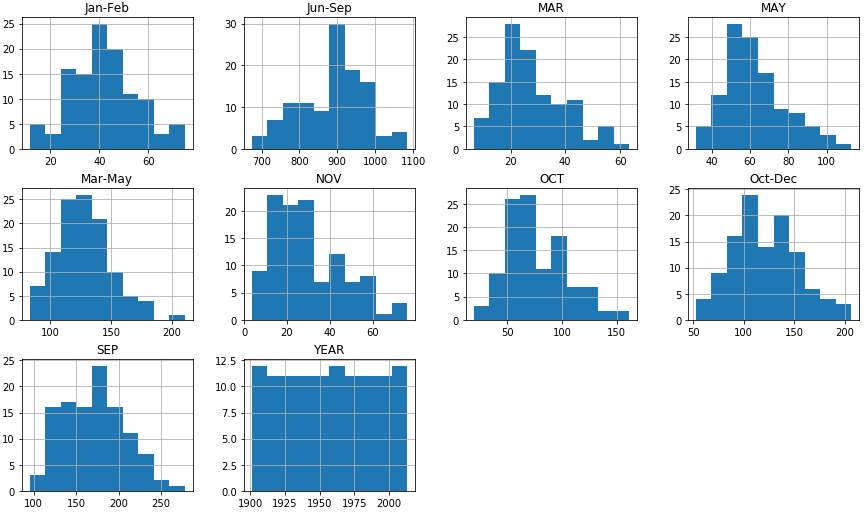
Rainfall in each month(mm)
Result and discussion
Climate change is always a major issue for whole world and making any prediction on that is now days pretty difficult and unpredictable. Climate change is due to the current global warming trend is human expansion. Due to this air and oceans are warming, sea level is rising and flooding and drought etc. One of the serious consequences due to this climate change is on Rainfall. Rainfall prediction now days is an arduous task which is taking into the consideration of most of the major world-wide authorities.
In this paper core motive is to finding out the algorithm which gives us the good prediction of rainfall. Here are we took the rainfall data of India of past 23 year from the official site of Indian government. Below is the table of the accuracy of the algorithms.
| S.no | Algorithms | Accuracy score | Accuracy (%) |
| 1 | SVM | 0.51 | 51% |
| 2 | RANDOM FOREST | 0.65 | 65% |
| 3 | NAVIE BAYES | 0.53 | 53% |
| 4 | MULTILAYER PRECEPTRON | 0.41 | 41% |
Here we can see the random forest is comes up as the best algorithm for the rainfall prediction.
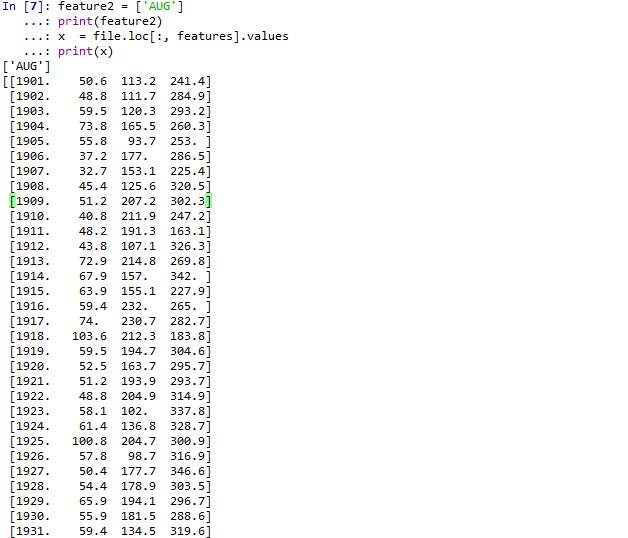
Train dataset:
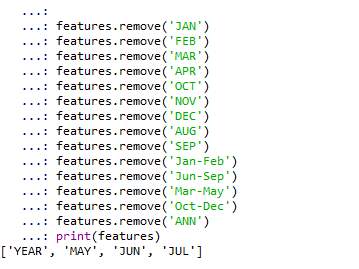
As above screen depict that we use May, June , July rainfall data as the train data for our algorithm and for the test we use August rainfall data.
Summary and Conclusion
This Paper has presented a supervised rainfall learning model which used machine learning algorithms to classify rainfall data. We used different machine learning algorithm to check the accuracy of rainfall prediction. We have compared SVM, Random Forest, Navie Bayes and MLP (Multilayer perceptron) classifiers. From the above figure 3 we can conclude that Random forest is the Machine learning algorithm which is suitable for rainfall prediction in India.
Currently machine learning used in no. industries. As the data increases the complexity of that data will increase and for that we are using machine for the better understanding of that data. In Weather predictions its pretty helpful with good accuracy score and in rainfall also its gives pretty good predictions. In future we are planning to increase our work in Storm predictions and Crop prediction with the rainfall prediction
Cite This Work
To export a reference to this article please select a referencing stye below:
Related Services
View all


Related Content
All TagsContent relating to: "Geography"
Geography is a field of study that is focused on exploring different places and environments from around the world. Different aspects of Geography include countries, habitats, distribution of populations, the Earth's atmosphere, the environment, and more.
Related Articles

DMCA / Removal Request
If you are the original writer of this dissertation and no longer wish to have your work published on the UKDiss.com website then please: