Predicting Risk of Hospitalization in a Pediatric Population
Info: 8563 words (34 pages) Dissertation
Published: 1st Feb 2022
ABSTRACT
Objectives
Develop predictive models for a paediatric population that provide information for paediatricians and health authorities to identify children at risk of hospitalisation for conditions that may be impacted through improved patient care.
Design
Retrospective healthcare utilisation analysis with multivariate logistic regression models.
Data
Demographic information linked with utilisation of health services in the years 2006–2014 was used to predict risk of hospitalisation or death in 2015 using a longitudinal administrative database of 527,458 children aged 1 to 13 residing in the Regione Emilia-Romagna (RER), Italy in 2014.
Outcome measures
Models designed to predict risk of hospitalisation or death in 2015 for problems that are potentially avoidable were developed and evaluated using the C-statistic, for calibration to assess performance across levels of predicted risk, and in terms of their sensitivity, specificity and positive predictive value.
Results
Of the 527,458 children residing in RER in 2014, 6,391 children (1.21%) were hospitalized for selected conditions or died in 2015. 49,486 children (9.4%) of the population were classified in the “At Higher Risk” group using a threshold of predicted risk >2.5%. The observed risk of hospitalization (5%) for the “At Higher Risk” group was more than 4 times higher than the overall population. We observed a C-statistic of 0.78 indicating good model performance. The model was well calibrated across categories of predicted risk.
Conclusions
It is feasible to develop a population-based model using a longitudinal administrative database that identifies the risk of hospitalisation for a pediatric population. The results of this model, along with profiles of children identified as high risk are being provided to the pediatricians and other healthcare professionals providing care to this population to aid in planning for care management and interventions that may reduce their patients’ likelihood of a preventable, high-cost hospitalisation.
Strengths and limitations of this study
- This study included the entire pediatric population of the Emilia-Romagna Region of Italy, 527,458 children ages 1-13.
- The study used an existing longitudinal administrative healthcare database with both the advantage of much lower cost than new data collection and the disadvantage of gaps and potential errors in administrative data.
- The results of the study are being used to assist pediatricians and health authorities manage high risk children.
INTRODUCTION
Healthcare systems have been moving from a passive approach of waiting for and reacting to patients’ problems to a more active model that includes identification of patients at risk, taking the initiative in offering care and actively seeking to avoid recurrence or progression of medical problems. With the aging of populations worldwide, and high prevalence of chronic diseases, it is not surprising that these efforts have often focused on the elderly. Less attention has been paid to the pediatric population. However, despite the relatively low prevalence of chronic disease in children, there is evidence that children experience preventable hospitalizations. (1) For example, a study of pediatric inpatient claims in the United States estimated that pediatric “ambulatory care sensitive” conditions accounted for $4.05 billion (USD) in hospital charges and over 1 million hospitalization days in a one year period. (2)
Predictive risk modeling is a tool that can be used to estimate the risk of an outcome within the context of pre-specified variables and uncertainty. Predictive risk modeling may offer an opportunity to better understand individuals who may be at higher risk for an undesirable outcome. (3) A number of predictive risk modeling studies have been conducted in pediatrics; however, many of these studies have focused on children with specific medical problems or use data that is not routinely available in administrative databases. (4), (5), (6), (7), (8), (9)
Under the auspices of the Italian National Health Service (NHS), the 21 regional governments are responsible for delivering health care through a network of geographically defined Local Health Authorities. Primary care physicians, including pediatricians, work for the Local Health Authorities as independent contractors. Every Italian is expected to enroll with a primary care physician (a pediatrician for those under age 14) who serve as the ‘gatekeepers” for delivering primary care and coordinating specialty services for their enrolled patients. (10) This focus on primary care is ideal for the development and implementation of a proactive model of health care.
To further encourage coordinated care, the Regione Emilia-Romagna (RER) has established Patient-Centered Medical Homes. The identification of patients who would most benefit from outreach efforts is fundamental to achieving the goals of promoting population health and practicing proactive medicine. The RER has therefore developed and implemented a population-based model to predict risk of hospitalization or death for adult residents in the region. (11) The results of the model are presented to physicians in Patient-Centered Medical Homes as patient profiles to support care management and the identification of patients who may benefit from additional outreach such as home health care, disease management, or case management.
Current risk models used in RER focus on the adult population. This paper describes the development of predictive risk models for the paediatric population using the RER’s regional longitudinal administrative healthcare database to help identify children who are at risk of hospitalization for conditions that may be affected through improved patient care.
METHODS
Data Source
The RER is a region of northern Italy that lies between the River Po and Apennine Mountains with approximately 4.5 million inhabitants. RER maintains a longitudinal healthcare database for all its residents. The RER database contains patient-level demographic data (age, gender, birth and death dates, location of residence, primary care physician/pediatrician) and utilization data for inpatient (hospital discharge abstract data with ICD-9-CM diagnosis and procedure codes, and admission/discharge dates), outpatient (laboratory, diagnoses, and physician services, pharmacy claims including WHO ATC/DDD system codes), (12). specialty (therapeutic procedures, rehabilitation, and specialist visits), and emergency room visits. Inpatient medications are not captured. Patients with disabilities or low family income are eligible for exemption of service copayment for specialty visits and outpatient prescriptions, which provide some socioeconomic information. Each resident is assigned an anonymous identifier so that utilization can be tracked over time while maintaining patient privacy. (13)
Study Cohort
In Italy, children age 14 years old are required to switch from a pediatrician to a primary care physician; therefore, we limited the study population to children 1-13 years old on December 31st, 2014. The study population also was narrowed to whom met the following criteria: (i) resident of the RER for the entire year 2014, (ii) have valid information on age, gender, local health authority, district or geographic location in 2014, (iii) alive at the beginning of 2015. The study population was stratified into three age groups: 1-2 years old (on December 31, 2014); 3-5 years old; 6-13 years old. Children less than one year old on December 31, 2014 were not included in the study population due to insufficient data for prediction of outcomes.
Dependent Variable
The outcome was defined as the occurrence of hospitalization that could have potentially been prevented or delayed with appropriate patient care or death by any cause. (11) We developed a list of hospitalizations that are potentially preventable with appropriate patient care using a three step process. First, we conducted a literature search to evaluate pediatric studies that defined potentially avoidable disease in pediatrics that could require hospitalization. (14), (15), (16) We began with the listing of ICD-9-CM codes for “pediatric ambulatory care sensitive conditions” identified in Shi et al. (15) All hospitalizations in 2013 of children in the target age groups were classified using both ICD-9-CM codes and Disease Staging categories. (17), (18) The results were reviewed by the authors of this paper and compared to the Shi et al list. A number of changes were made for this project. For example, the list of immunization preventable conditions to be included in the dependent variable was expanded to include currently available vaccines. We included additional conditions, such as acute cystitis (ICD-9-CM code of 595.0) and hypoglycemic coma (ICD-9-CM code of 251.0). Advanced stages of selected medical problems were added where Stage 1 may not be avoidable but advanced stages can potentially be delayed or prevented through timely intervention, e.g. Stage 2 or 3 appendicitis, Stage 2 or 3 sinusitis. While certainly not always preventable, we believed that inclusion of hospitalizations for certain types of trauma and toxicities (e.g., acetaminophen toxicity, adverse drug reactions, burns) was appropriate especially for a pediatric population. These changes are summarized in Appendix, Table 1.
Finally, we used disease staging categories for inclusion of relevant hospitalizations that would have been missed using solely primary ICD-9-CM codes. For example, if a child was hospitalized with a primary diagnosis of respiratory failure with asthma (ICD-9-CM code of 493) as the secondary diagnosis, then the disease staging category of Asthma would include that admission that might have been missed by including only primary ICD-9-CM codes. This is summarized in Appendix, Table 2.
Children hospitalized for these selected conditions or who died from any cause in 2015 were counted as being positive for the outcome.
Independent Variables
A list of predictor variables was developed utilizing the RER administrative data from 2006-2014. Independent variables included information such as: demographics, socioeconomic factors, diseases/conditions grouped by etiology or body systems, mother’s medical history and pregnancy/birthing information, emergency-room visits, potentially inappropriate prescriptions and antibiotic usage.
Demographic variables included: age on December 31st, 2014, gender, and citizenship (Italian or non-Italian). Children from low-income families or with disabilities are exempt from copayments for prescriptions and specialty visits. This information was used as a potential predictor variable.
We mapped diseases defined primarily by the affected body system with the exceptions of cancer, genetic conditions, and trauma which were based on etiology (Louis, 2014) using 2014 hospital discharge data, outpatient prescription information, and specialty visit claims. A total of 24 groups were defined. Disease Staging diagnostic categories was used to map hospital admissions to the 24 body system/etiology groups. (17) (see first column of Table 1) Patients with cardiovascular diseases, chronic respiratory diseases, diabetes mellitus, epilepsy, and disorders of the thyroid were identified using the Anatomical Therapeutic Chemical (ATC) Classification System codes from outpatient prescriptions. (19) Specialty visit records were also used for identifying medical conditions of some body systems. For example, if a child was admitted to the hospital for type 1 diabetes mellitus, or visited an endocrinologist, or had filled a prescription for insulin injection(s) (ATC code of A10AB), this patient would be identified as having an endocrine diagnosis in 2014.
Severity level codes (critical (C), acute (A), urgent but deferred (U), and not urgent (N)) are assigned to individuals upon discharge from the emergency department. We excluded ER visits that resulted in a hospital admission because diagnosis information was captured by hospital discharge data with more accurate information. We believe more frequent or severe ER visits may indicate a poor outcome, therefore, number of emergency room visits by severity level was calculated for each patient.
There is evidence that the risks outweigh the benefits for certain medication usage in the pediatric population. (20) For example, certain mood-altering medications such as, citalopram, sertraline, fluvoxamine, and any tricyclic antidepressants are not recommended in children of any age. Some medications can be harmful within specified ages. For example, loperamide is not indicated for children under three years old. For children who filled an outpatient prescription in 2014, we calculated their age at dispensation date and amount of medications they had filled, in order to identify patients with potentially inappropriate prescriptions in 2014. The number of antibiotic prescriptions utilized in 2014 was estimated since high utilization of antibiotics has been linked to decreased gut microflora, decreased immune function, and resistant strains of bacteria. (21)
For children ages 1-5 the models considered problems identified at birth as potential predictors using hospital discharge abstract data. About 86% of the newborns were healthy, with no serious medical problems noted on their birth records. Infants with diagnostic categories of premature birth with low birth weight, full-term infants with abnormal birth weight, premature with very low birth weight, or extremely low birth weight, were classified as abnormal birth weight; all other conditions were considered as a group. The mothers’ delivery information, such as age at delivery, C-section, and parity, were identified based on the mothers’ hospitalization records, and linked to children. Information about deliveries that occurred outside hospitals could not be captured.
Children ages 1-5 years old were also linked with information regarding their mothers’ medical history and drug use during pregnancy. There is evidence on the association between pre-natal (up-to 270 days before delivery) exposure to antibiotics and the development of asthma. (22) We estimated the total exposure to any antibiotics during the pre-natal period using the mother outpatient prescription claims. We included two categories of mother’s potentially inappropriate drug use, class D (potential risks outweigh the benefits) and X (contraindicated during pregnancy), since these drugs may be linked to harm to children. Mothers’ 3 year medical history before delivery was retrieved for identifying certain conditions such as abortion, diabetes and psychological condition. For about 22% of children we were not able to establish the mother-baby linkage.
We developed history variables with up to five years of data (pharmacy, specialty, hospital admission, and emergency room visit) for children in age strata 3-5 years old and 6-13 years old. Children who had conditions in any year from 2009 to 2013 were flagged as having a utilization history.
Modeling
Logistic regressions were used to estimate predicted probability for the occurrence of an inpatient hospital stay for the selected conditions, or death from any cause, for the individual patients. Since age and gender may be strongly correlated with children’s’ risk, we fit a total of six multivariate logistic regression models: female and male by age groups (1-2, 3-5, and 6-13 years old). All models were developed using SAS 9.3 statistical software (SAS Institute, Cary, NC, U.S.A.).
Model Validation
The predicted accuracy of the modeling was evaluated using C-statistics (the area under the receiver operating characteristics curve), comparing the results of the ‘predicted’ to the ‘observed’ outcomes in 2015. We stratified patients into risk strata based on the predicted risk of hospitalization or death. “At higher risk” was defined as children with a predicted risk greater than 2.5%. “Higher than average” was defined as children with a predicted risk of hospitalization or death between the mean rate and 2.5%. The rest of population was grouped into “Lower than average”. Calibration of the model across these risk groups was assessed by comparing observed to predicted rates among the risk groups. We also report the sensitivity, specificity and positive predictive value (PPV) for the defined risk group cutoffs.
RESULTS
Characterization of Risk Groups
A total of 527,458 children resided in RER in 2014; of those, 6,391 children (1.21%) were hospitalized for selected conditions or died in 2015. Table 1 displays the distribution of gender, age category, presence of selected chronic conditions, ER visits, selected prescription drug usage, co-pay exemption for income or disability and specialty visits for the eligible RER residents as of December 31 2014.
Table 1 also compares the characteristics of the total selected pediatric population to the subgroups of the population classified by risk categories based on the model results. Forty nine thousand four hundred and eighty-six children (9.4%) of the population were classified in the “At Higher Risk” group using a threshold of predicted risk >2.5%. The children predicted to be At Higher Risk were more likely to be male (58.9%) compared to 51.5% in the total population. The two youngest age strata (1-2 and 3-5 years) had much higher proportions of children identified in the At Higher Risk group than the 6-13 year old children. For example, 18,112 (23%) of the children age 1-2 years were identified in the At Higher Risk Group. This age category includes 36% of the At Higher Risk children although it represents 15% of the total pediatric population. Children in the “At Higher Risk” category were more likely to have each of the selected conditions. When looking at the highest prevalence conditions, 43.8% of children in the “At Higher Risk” category had an ear, nose, or throat problem, compared to 6.1% in the overall population; 5.5% had a gastrointestinal problem compared to 1.4% in the overall population; 4.3% had a neurological problem compared to 0.7% in the overall population; 14.7% had a respiratory problem compared to 3.9% in the overall population; and 11.7% had a skin problem compared to 7.5% in the overall population.
Children identified as being “At Higher Risk” were much more likely to have a history of emergency room visits and were more likely to have a history of 2, 3, or more antibiotic prescriptions. Overall, 14.6% of children had 3 or more antibiotic prescriptions; in the “At Higher Risk” category 51.7% had a history of 3 or more antibiotic prescriptions. Children with exemptions from co-payments due to either family income or disability were more likely to be identified as being At Higher Risk as were children with a history of medical or surgical specialty visits.
Table 2 displays information about the delivery (for the children age 1-5) and medical history of the mother for those children where we were able to match to their mother’s record. First children, children who were delivered by caesarean section and children where an abnormal birth weight or other problems were noted at birth were more likely to be classified in the “At Higher Risk” category. If the mother was prescribed a potentially inappropriate drug or an antibiotic during pregnancy, the child was more likely to be classified in the “At Higher Risk” category. When examining a 3 year medical history of the mother, the mother’s asthma, cardiovascular disease, diabetes mellitus, or mental health problems, or the record of a previous abortion, were all relatively frequent and more prevalent in the mothers of children predicted to be in the “At Higher Risk” category.
Calibration
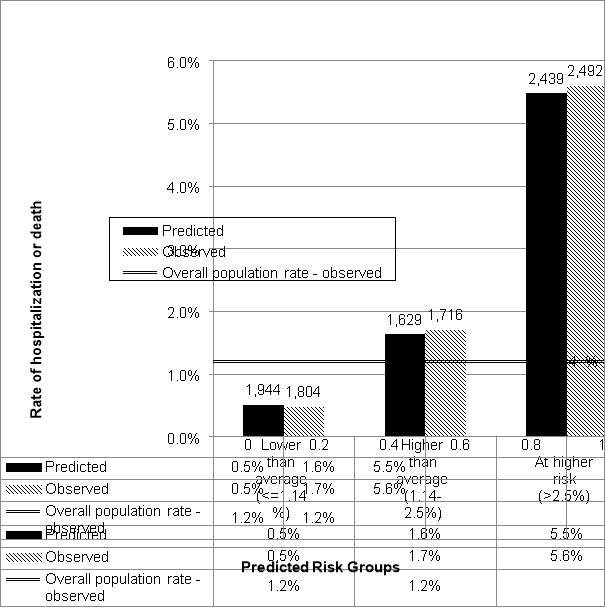
The population was divided into three risk groups based on predicted probability of hospitalization as defined above. We observed good calibration; each stratum’s predicted risks were similar to observed prevalence of hospitalizations or deaths. (Figure 1) Individuals, who fell in the “At Higher Risk” group, with predicted risk greater than 2.5%, had 2,683 predicted events based on the model results, and 2,737 observed events. While the overall rate of hospitalization or death for children ages 1-13 was 1.21% the predicted and observed risk of the “At Higher Risk” group was over 5%.
Model Performance among Risk Groups
We observed a c-statistic of 0.78 indicating good model performance (Table 3). The sensitivity (proportion predicted to be At Higher Risk of those who had an event in 2015) was 0.43 and 0.70 for predicted risk categories of “at higher risk” and “higher than average”, respectively. In other words, among those whom were hospitalized or deceased in 2015, 43% were predicted to have risk greater than 2.5% of hospitalization or death, and 70% have risk higher than average. The specificity (proportion predicted to be at a “lower” risk of those who did not have an event) was 0.91 and 0.72 for the predicted ‘higher’ and “higher than average” risk categories; among those who were not hospitalized and did not die in 2015, 91% were not predicted to be “at higher risk”. The positive predictive value (proportion with an event of those who were predicted to be at an elevated risk) was 0.06 and 0.03 for the “higher” and “higher than average” predicted risk categories. In other words, of those individuals who were estimated to have a >2.5% risk of hospitalization or death approximately 6% had an event in 2015.
DISCUSSION
We have developed a population-based model that identifies risk of hospitalization for potentially preventable problems in a pediatric population including all children under the age of 14 living in the RER of Italy. The C-statistic of 0.78 indicates that the model performs well. By comparison, in a study predicting high-cost pediatric patients, Leininger et al reported a C-statistic of 0.73. (9)
We believe that the definition of the dependent variable used in our models increases the likelihood that they are identifying patients whose risk may be reduced through proactive care. We have updated previously published criteria to include hospitalizations that may have been prevented by currently available vaccines. And we have used the logic of disease staging to include relevant hospitalizations that would have been missed using solely primary ICD-9-CM codes. Specifics of the selection criteria are available in the supplemental material.
The richness of the administrative data available in the RER allowed for a robust definition of the predictive variables. The RER data allow for the linkage of patients’ use of diverse in and out-patient health care services over multiple years. In addition, the ability to link child and mother’s information allows the models to consider some of the mother’s medical history such as the presence of chronic disease and use of prescription drugs in the years prior to birth as well as complications that may have arisen at birth.
There are limitations to our models. The models were developed with administrative data which lack some of the clinical specificity which would be useful in assessing patient risk. Children who have not had the types of encounters included in the RER database would have potentially missing information. The RER database does not have encounter level diagnostic data available documenting visits with the primary care pediatrician. The administrative data have very limited information available about the patient and family socio economic status. Our models use prior utilization among the predictor variables. With the administrative date, we cannot distinguish appropriate from inappropriate prior utilization which may bias our results. Despite their limitations administrative data have many advantages for a project such as ours. They are relatively inexpensive to analyze and in the case of the RER include a large population over multiple years.
While the evidence was mixed, a systematic review suggests that hospitalizations can be prevented in children with medical complexity. (1) The Local Health Authority of Parma has begun working with the primary care pediatricians caring for the patients identified by the models to develop individual “profiles” of children identified as being at higher risk. Data in the profiles, along with the more detailed information available in the medical record, can be used by the pediatricians to assess what additional intervention, if any, may help to manage the child’s risk. For example, review of the profiles of higher risk children can help identify children whose parents might be contacted for a visit if they have not been seen recently. Summaries of prescriptions that have been filled from the profiles can be reviewed for potential over use, under use, or inappropriate use of mediation. High risk children with chronic illness might be referred to a specialist or home health care provided.
The RER healthcare system offers several advantages in the goal of reducing potentially preventable hospitalization. Every child is enrolled with a primary care pediatrician. The population is quite stable allowing for continuity of care. Through the Italian National Health Service every child is entitled to health care with little or no cost at the point of service. While the primary care pediatricians are paid on a per capita basis the RER can negotiate incentive payments and monitor improvements in care that may help to reduce avoidable hospitalizations. If successful, the results of the models can be applied by other Local Health Authorities in the Regione Emilia-Romagna, other Italian regions, and other countries with similar data availability.
REFERENCES
1. Coller RJ, Nelson BB, Sklansky DJ, Saenz AA, Klitzner TS, Lerner CF, et al. Preventing Hospitalizations in Children with Medical Complexity: A Systematic Review. Pediatrics. 2014; 134(6).
2. Lu S, Kuo D. Hospital Charges of Potentially Preventable Pediatric Hosptilizations. Acad Pediatr. 2012; 12(5): p. 436-44.
3. Waljee A, Higgins P, Singal A. A Primer on Predictive Models. Clinical and Translational Gastroenterology. 2013; 44(4): p. e44.
4. Huang L, Li S, He D, Weiqun B, Li L. A predictive risk model for medical intractability in epilepsy. Epilepsy and Behavior. 2014; 37: p. 282-86.
5. Cerqueira DC, Soares CM, Silva VR, Magalhaes JO, Barcelona IP, Duarte MG, et al. A Predictive Model of Progression of CKD to ESRD in a Predialysis Pediatric Interdisciplinary Program. Clin J Am Soc Nephrol. 2014; 9(4): p. 728-35.
6. Lopes J, Goulart E, Siqueira A, Fonseca I, de Brito M, Starling C. Nosocomial Infections in Brazilian Pediatric Patients: Using a Decision Tree to Identify High Mortality Groups. Brazilian Journal of Infectious Diseases. 2009 Apr; 13: p. 2.
7. Gorelick M, Scribano P, Stevens M, Schultz T, Shults J. Predicting Need for Hospitalization in Acute Pediatric Asthma. Pediatric Emergency Care. 2008; 24(11): p. 735-43.
8. McAna J, Crawford AG, Novinger BW, Sidorov J, Din FM, Maio V, et al. A predictive model of hospitalization risk among disabled medical enrollees. The American Journal of Managed Care. 2013; 19(5): p. e166-74.
9. Leininger L, Saloner B, Wherry L. Predicting High-cost Pediatric Patients. Medical Care. 2015 August; 53(8): p. 729-735.
10. Lo Scalzo L, Donatini A, Orzella L, Cicchetti A, Profili S, Maresso A. Italy: Health System Review. Copenhagen: World Health Organization; 2009. Report No.: Volume 11, No. 6.
11. Louis D, Robeson M, McAna J, Maio V, Keith S, Liu M, et al. Predicting risk of hospitalisation or death: a retrospective population-based analysis. BMJ open. 2014; 4(9): p. e005223.
12. WHO Collaborating Centre for Drug Statistics Methodology. Guidelines for ATC classification and DDD assignment 2013 Oslo; 2012.
13. The Emilia-Romagna Regional Health Service and the new welfare system: Facilities, expenditure, and activities as of 31.12.2010. Programs, agreements and organisational models. Bologna: Regione Emilia-Romagna Assessorato Politiche per la Salute; 2012.
14. Flores G, Abreu M, Chaisson C, Sun D. Keeping Children Out of Hospitals: Parents’ and physicians’ perspectives on how pediatric hospitalizations for ambulatory care-sensitive conditions can be avoided. Pediatrics. 2003; 112(5): p. 1021-1030.
15. Shi L, Lu N. Individual Sociodemographic Characteristics Associated with Hospitalization for Pediatric Ambulatory Care Sensitive Conditions. Journal of Health Care for the Poor and Underserved. 2000 November; 11(4): p. 373-384.
16. Pediatric Quality Measures Program. Content last reviewed July 2016. Agency for Healthcare Research and Quality, Rockville, MD. http://www.ahrq.gov/policymakers/chipra/factsheets/fullreports/index.html. [Online].
17. Gonnella JS, Hornbrook MC, Louis DZ. Staging of Disease A Case-Mix Measurement. JAMA. 1984; 251(5): p. 637-644.
18. Gonnella JS, Louis DZ, Gozum MV, Callahan CA, Barnes CA, editors. Disease Staging Clinical and Coded Criteria. 629th ed. Ann Arbor: Truven Health Analytics; 2012.
19. Maio V, Yuen EJ, Rabinowitz C, Jimbo M, Donatini A, Mall S, et al. Using pharmacy data ti identify those with chronic conditions in Emilia-Romagna, Italy. Journal of Health Services Research and Quality. 2005; 10(4): p. 232-238.
20. Prot-Labarthe S, Weil T, Angoulvant F, Boulkedid R, Alberti C. POPI (Pediatrics: Omission of Prescriptions and Inappropriate Prescriptions): Development of a Tool to Identify Inappropriate Prescribing. PLoS ONE. 2014; 9(6): p. e101171.
21. Costelloe C, Metcalfe C, Lovering A, Mant D, Hay A. Effect of antibiotic prescribing in primary care on antimicrobial resistance in individual patients: systematic review and meta-analysis. BMJ. 2010; 340: p. c2096.
22. Metsala J, Lundqvist L, Virta L, Kaila M, Gissler M, Virtanen S. Prenatal and post-natal exposure to antibiotics and risk of asthma in childhood. Clinical & Experimental Allergy. 2014; 45: p. 137-145.
23. Thukral A, Lodha R, Irshad M, Arora N. Performance of Pediatric Risk Mortality (PRISM), Pediatric Index of Mortality (PIM), and PIM2 in a pediatric ICU in a developing country. Pediatr Crit Care Med. 2006; 7(4): p. 356-60.
24. Pollack MM, Patel KM, Ruttimann UE. PRISM III: An updated pediatric risk of mortality score. Critical Care Medicine. 1996 May; 24(5): p. 743-752.
25. MW S, Rutherford MK. The high concentration of U.S. health care expenditures. Rockville, MD: Agency for Healthcare Research and Quality; 2005. Report No.: Research in Action Issue 19. AHRQ. Pub. No. 06-0060.
26. Langham M, Walter A, Boswell T, Beck R, Jones T. Identifying children at risk of death within 30 days of surgery at an NSQIP pediatric hospital. Surgery. 2015 Dec; 158(6): p. 1481-91.
APPENDICES
Table 1: Study Population 2014
| Total Population | At Higher Risk | Higher than average | Lower than average | |||||
| Risk >2.5% | Risk 1.2-2.5% | Risk | ||||||
| 527,458 | 49,486 | 99,714 | 378,258 | |||||
| Number | % | Number | % | Number | % | Number | % | |
| Gender | ||||||||
| Female | 255,875 | 48.5% | 20,315 | 41.1% | 43,030 | 43.2% | 192,530 | 50.9% |
| Male | 271,583 | 51.5% | 29,171 | 58.9% | 56,684 | 56.8% | 185,728 | 49.1% |
| Age Group | ||||||||
| 1 to 2 years | 78,051 | 14.8% | 18,112 | 36.6% | 44,084 | 44.2% | 15,855 | 4.2% |
| 3 to 5 years | 125,459 | 23.8% | 20,180 | 40.8% | 35,543 | 35.6% | 69,736 | 18.4% |
| 6 to 13 years | 323,948 | 61.4% | 11,194 | 22.6% | 20,087 | 20.1% | 292,667 | 77.4% |
| Selected condition/body system | ||||||||
| Cancer | 1,138 | 0.2% | 477 | 1.0% | 252 | 0.3% | 409 | 0.1% |
| Cardiovascular | 1,624 | 0.3% | 653 | 1.3% | 211 | 0.2% | 760 | 0.2% |
| Dental Conditions | 442 | 0.1% | 138 | 0.3% | 109 | 0.1% | 195 | 0.1% |
| Endocrine | 6,458 | 1.2% | 1,276 | 2.6% | 1,074 | 1.1% | 4,108 | 1.1% |
| Ear, Nose, Throat | 31,919 | 6.1% | 21,664 | 43.8% | 7,376 | 7.4% | 2,879 | 0.8% |
| Eye | 821 | 0.2% | 165 | 0.3% | 145 | 0.1% | 511 | 0.1% |
| Genetic Conditions | 274 | 0.1% | 188 | 0.4% | 29 | 0.0% | 57 | 0.0% |
| Gastrointestinal | 7,380 | 1.4% | 2,724 | 5.5% | 1,578 | 1.6% | 3,078 | 0.8% |
| Genitourinary | 3,389 | 0.6% | 987 | 2.0% | 836 | 0.8% | 1,566 | 0.4% |
| OB/GYN | 128 | 0.0% | 17 | 0.0% | 19 | 0.0% | 92 | 0.0% |
| Hematological | 1,114 | 0.2% | 596 | 1.2% | 247 | 0.2% | 271 | 0.1% |
| Hepatobiliary | 245 | 0.0% | 82 | 0.2% | 39 | 0.0% | 124 | 0.0% |
| Immunologic Disease | 199 | 0.0% | 80 | 0.2% | 45 | 0.0% | 74 | 0.0% |
| Infectious Disease | 869 | 0.2% | 596 | 1.2% | 160 | 0.2% | 113 | 0.0% |
| Male Genital | 1,329 | 0.3% | 179 | 0.4% | 209 | 0.2% | 941 | 0.2% |
| Musculoskeletal | 3,817 | 0.7% | 664 | 1.3% | 453 | 0.5% | 2,700 | 0.7% |
| Neurologic Diseases | 3,738 | 0.7% | 2,123 | 4.3% | 912 | 0.9% | 703 | 0.2% |
| Nutrition | 924 | 0.2% | 446 | 0.9% | 201 | 0.2% | 277 | 0.1% |
| Other Conditions | 1,703 | 0.3% | 1,150 | 2.3% | 247 | 0.2% | 306 | 0.1% |
| Neonatal Conditions | 186 | 0.0% | 111 | 0.2% | 50 | 0.1% | 25 | 0.0% |
| Psychological | 854 | 0.2% | 388 | 0.8% | 141 | 0.1% | 325 | 0.1% |
| Respiratory | 20,450 | 3.9% | 7,285 | 14.7% | 5,886 | 5.9% | 7,279 | 1.9% |
| Skin | 39,344 | 7.5% | 5,809 | 11.7% | 7,461 | 7.5% | 26,074 | 6.9% |
| Trauma | 737 | 0.1% | 177 | 0.4% | 167 | 0.2% | 393 | 0.1% |
| ER visits based on severity level | ||||||||
| Critical | 182 | 0.0% | 117 | 0.2% | 35 | 0.0% | 30 | 0.0% |
| Acute | 15,029 | 2.8% | 5,219 | 10.5% | 3,915 | 3.9% | 5,895 | 1.6% |
| Urgent but could be deferred | 118,372 | 22.4% | 26,945 | 54.5% | 33,241 | 33.3% | 58,186 | 15.4% |
| Not Urgent | 45,336 | 8.6% | 11,216 | 22.7% | 13,080 | 13.1% | 21,040 | 5.6% |
| Inappropriate Rx* | 8,077 | 1.5% | 2,376 | 4.8% | 3,090 | 3.1% | 2,611 | 0.7% |
| Antibiotic use | ||||||||
| 1 | 114,421 | 21.7% | 8,248 | 16.7% | 24,544 | 24.6% | 81,629 | 21.6% |
| 2 | 63,151 | 12.0% | 9,359 | 18.9% | 19,035 | 19.1% | 34,757 | 9.2% |
| 3+ | 76,878 | 14.6% | 25,587 | 51.7% | 29,144 | 29.2% | 22,147 | 5.9% |
| Non-Italian citizen | 90,760 | 17.2% | 8,975 | 18.1% | 18,390 | 18.4% | 63,395 | 16.8% |
| Copay exempted based on family income/employment status | 244,911 | 46.4% | 37,502 | 75.8% | 64,776 | 65.0% | 142,633 | 37.7% |
| Copay exempted based on disabled status | 6,173 | 1.2% | 2,029 | 4.1% | 1,321 | 1.3% | 2,823 | 0.7% |
| Specialty visits in pediatrics | ||||||||
| Medical | 12,642 | 2.4% | 3,987 | 8.1% | 2,735 | 2.7% | 5,920 | 1.6% |
| Surgical | 8,982 | 1.7% | 2,060 | 4.2% | 2,294 | 2.3% | 4,628 | 1.2% |
Table 2: Birthing and Medical History of Mother*
*Information about the delivery was considered only for children 1-5 years old.
** For 22% of children we were not able to establish the mother-baby linkage.
Table 3: Observed and Predicted Events by Risk Group
| Risk groups (predicted risk range) | N | Average predicted risk | Observed prevalence | Expected frequency based on predicted risk | Number of observed events |
| Lower than average ( | 378,258 | 0.5% | 0.5% | 2,018 | 1,896 |
| Higher than average (1.2-2.5%) | 99,714 | 1.7% | 1.8% | 1,690 | 1,758 |
| At higher risk (>2.5%) | 49,486 | 5.4% | 5.5% | 2,683 | 2,737 |
| TOTAL | 527,458 | 1.2% | 6,391 | 6,391 |
Table 4: C-statistic, Sensitivity, Specificity, and PPV
| C-statistic (overall model) = 0.78 | ||
| Cut-off points for comparison | ||
| “At higher risk”1 score | “At higher risk”1 + “Higher than average”2 score | |
| Sensitivity3 | 0.43 | 0.70 |
| Specificity4 | 0.91 | 0.72 |
| Positive Predictive Value5 | 0.06 | 0.03 |
| True Positives6 | 2,737 | 4,495 |
| 1“At higher risk” is defined as patients with a predicted risk of hospitalization of > 2.5%. | ||
| 2“At higher risk”1 + “Higher than average”, is defined as patients with a predicted risk of hospitalization of > 1.2%. | ||
| 3 Sensitivity is defined as the proportion of those hospitalized who were predicted to be hospitalized (true positive rate). | ||
| 4 Specificity is the proportion of those not hospitalized who were not predicted to be hospitalized (true negative rate). | ||
| 5 Positive Predictive Value is the proportion of those predicted to be hospitalized who were actually hospitalized. | ||
| 6 Positive Predictives are the number of residents who were predicted to be at risk of hospitalization at the predicted risk threshold and were actually hospitalized | ||
Figure 1: Model calibration:
Predicted and observed prevalence of hospitalization or death in 2015 by risk category
Cite This Work
To export a reference to this article please select a referencing stye below:
Related Services
View all


Related Content
All TagsContent relating to: "Hospitals"
A hospital is a health care institution with specialised facilities and medical equipment where doctors and nurses diagnose and treat people with illnesses or injuries.
Related Articles

DMCA / Removal Request
If you are the original writer of this dissertation and no longer wish to have your work published on the UKDiss.com website then please: